Review

The Use of LiDAR-Derived DEM in Flood Applications: A Review

by
Nur Atirah Muhadi
1,*,
Ahmad Fikri Abdullah
1,2,
Siti Khairunniza Bejo
1,
Muhammad Razif Mahadi
1 and
Ana Mijic
3
1
Department of Biological and Agricultural Engineering, Faculty of Engineering, Universiti Putra Malaysia, Serdang 43400, Selangor, Malaysia
2
International Institute of Aquaculture and Aquatic Sciences, Batu 7, Jalan Kemang 6, Teluk Kemang, Si Rusa 71050, Port Dickson, Negeri Sembilan, Malaysia
3
Department of Civil and Environmental Engineering, Skempton Building, Imperial College London, South Kensington Campus, London SW7 2AZ, UK
*
Author to whom correspondence should be addressed.
Remote Sens. 2020, 12(14), 2308; https://doi.org/10.3390/rs12142308
Submission received: 29 April 2020 / Revised: 21 June 2020 / Accepted: 21 June 2020 / Published: 18 July 2020
(This article belongs to the Special Issue Remote Sensing in Hydrology and Water Resources Management)

Abstract

:
Flood occurrence is increasing due to escalated urbanization and extreme climate change; hence, various studies on this issue and methods of flood monitoring and mapping are also increasing to reduce the severe impacts of flood disasters. The advancement of current technologies such as light detection and ranging (LiDAR) systems facilitated and improved flood applications. In a LiDAR system, a laser emits light that travels to the ground and reflects off objects like buildings and trees. The reflected light energy returns to the sensor, whereby the time interval is recorded. Since the conventional methods cannot produce high-resolution digital elevation model (DEM) data, which results in low accuracy of flood simulation results, LiDAR data are extensively used as an alternative. This review aims to study the potential and the applications of LiDAR-derived DEM in flood studies. It also provides insight into the operating principles of different LiDAR systems, system components, and advantages and disadvantages of each system. This paper discusses several topics relevant to flood studies from a LiDAR-derived DEM perspective. Furthermore, the challenges and future perspectives regarding DEM LiDAR data for flood mapping and assessment are also reviewed. This study demonstrates that LiDAR-derived data are useful in flood risk management, especially in the future assessment of flood-related problems.

1. Introduction

Floods are a major severe natural catastrophe experienced in many countries around the world including Malaysia. In Malaysia, flooding is the most frequent danger among all disasters, and it can be considered as an annual disaster due to its consistent occurrence [1,2]. The flood issue is gaining attention globally with significant efforts made to develop effective flood prevention and monitoring solutions. Preparation of flood hazard and floodplain maps is one of the examples of the preparedness phase in a disaster management cycle, which is widely used to reduce the impact of disasters, to react during the event, and to take action to recover after a disaster occurs, including flood disasters [3].
Information on how far the floodwater inundates and how deep the area is flooded at what velocity is required in floodplain management and flood damage estimation. To obtain such information, elevation data that represent the earth’s surface represent one of the primary components for flood studies. Accurate elevation information is crucial to both the input and the output of flood hydraulic analysis, as well as to producing floodplain maps [4]. A flood hydraulic model requires several input parameters that can be derived from the digital elevation data. The output of the flood model simulation is then mapped onto a digital elevation surface to determine the flood hazard zone and to further analyze the products to estimate probable flood damage in terms of flood inundation and flood depth.
A digital elevation model (DEM) is a predominant source of elevation data due to its simplicity and easy-to-use data [4,5]. A DEM provides gridded elevation data in a raster structure that represents the terrain’s surface. It contains x-, y-, and z-values, which represent x- and y-coordinates and elevation information, respectively. A DEM is commonly generated by extracting surface features from a digital surface model (DSM). DEMs can be generated from many sources such as ground surveys, digitizing existing hardcopy topographic maps, or remotely sensed technology. DEM sources range from no cost to high-cost data sources depending on their accuracy. With the rapid development of remote sensing technology, DEMs generated from this technology are a preferred choice using photogrammetry, interferometric synthetic aperture radar (IfSAR), or light detection and ranging (LiDAR). Photogrammetry is the science of measuring features without physical contact with the features from photographs [6]. Aerial photographs are widely adopted due to their ability to provide high-resolution and high-accuracy DEMs. However, this emerging technology can only be acquired during cloud-free and low-haze conditions, which is not the finest condition during flood events.
On the other hand, IfSAR uses a microwave sensor to send signals to the earth’s surface and records the scattered signal from the surface. It is an active microwave radar system that can obtain imagery over a vast area at night or in cloud cover. Spaceborne IfSAR such as shuttle radar topography mission (SRTM) is the most commonly used global DEM because it is an open-access DEM with acceptable resolution and accuracy. In contrast to spaceborne IfSAR, airborne IfSAR systems have more flexible system deployment and provide higher spatial resolution. However, both spaceborne and airborne IfSAR have limitations in urban areas due to complex scattering environments [7]. Furthermore, using this technology in densely vegetated areas is challenging because the radar cannot penetrate the ground surface beneath vegetation canopy.
Another emerging technology is LiDAR. A LiDAR sensor that is mounted on platforms such as aircraft and helicopters is known as airborne LiDAR. Meanwhile, LiDAR systems that collect data from the ground are referred to as ground-based LiDAR or terrestrial LiDAR. The generation of DEM data using the LiDAR system has several advantages over other sources. LiDAR data can be acquired during daylight or night time, as well as during cloudy conditions [7,8]. Moreover, it has the ability to penetrate the ground surface in vegetated and urban areas more reliably than either photogrammetry or IfSAR. Due to these reasons, it became a recent solution for flood-related problems. The ability of LiDAR systems to provide higher-resolution and centimeter-accuracy outcomes diversified their use in wide-ranging applications of flood studies.
In studies involving the application of remote sensing in floodplain and flood risk assessment, DEMs are used to visualize the interface of floodwater with the elevation of the ground surface. Moreover, a DEM is an important indicator in determining the flood inundation and flood depth [4,9,10]. The accuracy of a DEM is critical in hydrological modeling as it can affect the discharge values, water depth, and the extent of flood inundation maps [11,12]. In a flat floodplain, a vertical error of 1 m in the DEM leads to an error of 100 km2 in the estimated flood inundation [10]. Hence, accurate and high-resolution DEM data are needed to produce reliable flood mapping, especially in the context of flood simulation modeling.
In Malaysia, the Department of Irrigation and Drainage (DID) is responsible for providing flood forecasts and flood hazard maps. A higher level of accuracy of the DEM such as LiDAR data will improve the accuracy and reliability of the flood maps. Hence, the DID provides LiDAR-derived DEM as the backbone of the hydrological model. Nevertheless, the existing LiDAR data coverage is minimal; thus, IFSAR data are used to cover the rest of the potentially flooded area. Furthermore, LiDAR-derived DEM was also applied for flood risk assessments in some regions of the Philippines, as well as using IFSAR and SAR DEM as other alternatives in the absence of LiDAR in certain areas [13,14].
In flood inundation modeling, DEM resolution and accuracy play an important role in terms of modeling resolution and accuracy. For instance, a low-resolution DEM allows quick model simulations but it simplifies the topographic information that may affect the flood propagation. High-resolution DEM is needed, especially for urban areas, due to the presence of small features such as road curbs and dykes; thus, it is likely that the accuracy of flood simulations can be affected by the resolution of the DEM. Therefore, many researchers carried out studies to see whether coarser DEM resolution decreases the accuracy of the predicted flood inundation extent.
Tamiru and Rientjes [15] investigated the effects of LiDAR-derived DEM resolution in flood modeling. In this study, several DEMs with different resolutions were used as the input to the flood model. The authors concluded that the DEM resolution has a significant effect on simulation results. The affected flood simulation characteristics are inundation extent, flow depth, and flood velocity. In short, a coarser-resolution DEM results in a larger loss of information, while a high-resolution DEM results in excessive computational time. Furthermore, Casas et al. [16] conducted a study on different topographic data sources and resolution on flood modeling. The differences between each DEM were measured in terms of flood model outputs such as water discharge, water level, and flood inundation. The authors emphasized that the flood modeling results are majorly dependent on the DEM accuracy, whereby a LiDAR-derived DEM has the least root-mean-square error (RMSE) in terms of elevation accuracy and estimated flood inundation.
Vaze et al. [17] carried out a study on the accuracy and resolution of LiDAR DEM to improve the quality of hydrological features extracted from DEMs. The authors also investigated the effect of re-sampling DEM data into coarser resolution. The results obtained demonstrate that the accuracy and resolution of input DEM have a significant impact on the values of the hydrologically important spatial indices derived from the DEM. Hsu et al. [18] conducted a case study on the influence of DEM resolutions on the simulation of flood inundation in Tainan City, Taiwan. Five different grid sizes of DEM from 1 × 1 m to 40 × 40 m were used as the input of the flood models. The results showed that coarser DEM may cause losses of important small-scale features. Therefore, the inundation area may increase with a coarser DEM, resulting in a reduction in the accuracy of flood inundation models.
Ozdemir et al. [19] investigated the impact of using different high-resolution terrestrial LiDAR data on water depth, inundation extent, arrival time, and velocity predicted by the flood simulations. It was found that increasing the terrain resolution significantly affected the flood simulation results. The finding demonstrated that fine-resolution DEM can lead to significant differences in the dynamics of flood inundation. On the other hand, a coarser resolution reduced the performance of flood inundation prediction due to changes in flow paths at coarser resolution caused by losses of feature representation [20]. Furthermore, de Almeida et al. [21] investigated the influence of fine-resolution DEM on the flood inundation model over urban areas. The authors performed four different scenarios with small-scale modifications to analyze the influence of the decametric-scale changes. The findings from this study confirmed that flood hazard prediction was sensitive to decimetric-scale features, and they had an impact on the dynamic and distribution of flooded areas.
In summary, the findings from previous studies confirmed that accurate terrain data had a big impact on flood hazard prediction. Results of flood simulations varied in response to different DEM resolutions, which could be associated with the degree of topography representation. It was found that high-resolution DEM can provide relevant and reliable flood modeling results [22]. In contrast, coarser resolutions deteriorate the performance of flood models [20]. The previous studies confirmed that accurate terrain data have a big impact on flood hazard prediction and that the inundation area evaluation increases with coarser DEMs. Hence, a finer model resolution is necessary if the decision-maker is interested in local-scale inundation predictions [23]. Based on previous studies, the researchers suggested that LiDAR data offer high-quality data as an essential input of flood modeling.
Therefore, this review highlights the basic principles of LiDAR systems, system components, and their applications in flood studies. It also presents a brief discussion on the number of papers published in the Scopus database that focused on LiDAR data in flood studies over the past 10 years. Moreover, this paper reviews the challenges and future directions of the technology when using LiDAR data for flood modeling.

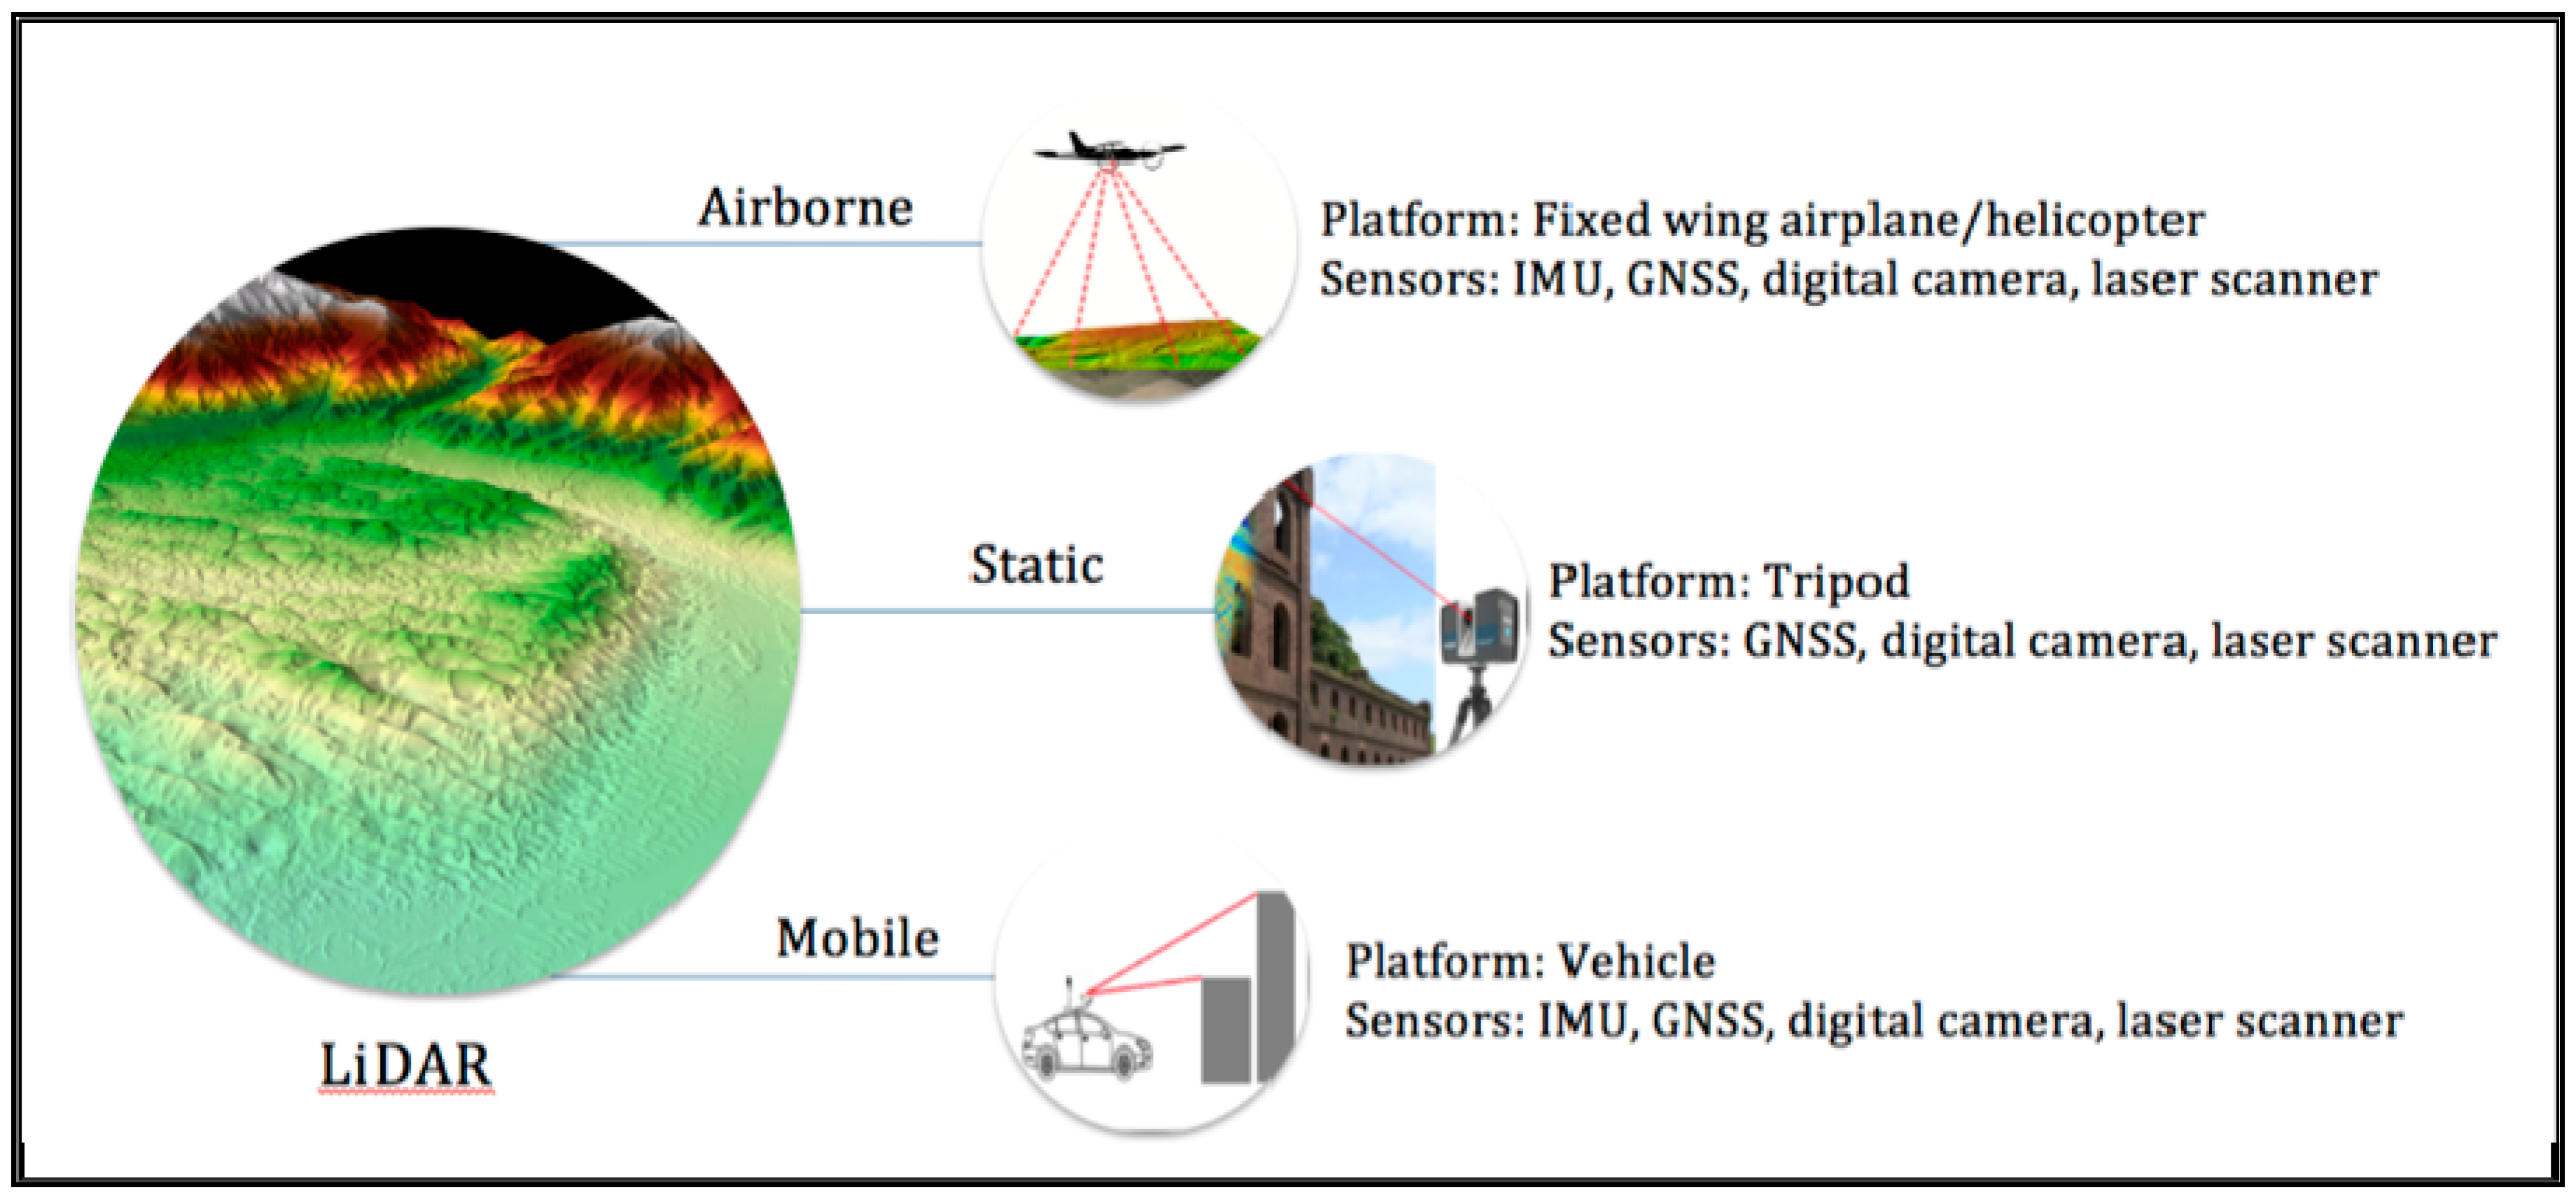
2. Principles of LiDAR Systems

LiDAR is an active remote sensing system, which allows the system to operate during the day and at night. LiDAR systems are used in various applications, and their advantages are well noted by researchers and practitioners all around the world. The development of laser scanning differs by the position of a sensor, i.e., whether an airborne-based LiDAR system or a ground-based LiDAR system. These two systems vary in terms of data acquisition modes, scanning mechanisms, and product accuracy and resolution, with several similarities. One similarity is that both systems can capture point cloud data and simultaneously acquire imagery [24].

2.1. Airborne LiDAR: Fundamentals and System Components

An airborne LiDAR is a multi-sensor system [25] that consists of several components which are the platform, laser scanner, positioning hardware, photographic or video recording equipment, computer, and data storage. For airborne LiDAR, the platform to mount the laser scanner can either be a fixed-wing aircraft or a helicopter, which is used to fly the laser sensor over a region of interest.
A LiDAR sensor with a wavelength of 1000–1600 nm emits laser pulses toward the ground, and the signal is backscattered by different objects, such as man-made structures, vegetation, and the ground surface [26]. The reflected light energy returns to the sensor, whereby the sensor logs the returning signal. The time of travel of the return pulse is used to measure the distance traveled. The measurements of distance and orientation are done by utilizing positioning systems, including a global positioning system (GPS) and inertial measurement unit (IMU).
LiDAR can produce high-resolution and high accuracy data by relying on the accuracy of GPS and IMU components [27]. IMUs are used to measure the accurate position, trajectory, and orientation of the aircraft. Meanwhile, the purpose of the GPS is to identify the X, Y, and Z location. The GPS is responsible for providing the precise location of the sensor; hence, differential GPS is adopted by setting up a ground GPS station to achieve a required position accuracy of better than 10 cm in the airborne LiDAR [28,29].
The camera or video recording equipment flies along with the LiDAR sensor to provide color information to represent the real-world color. The process is carried out by mapping red, green, and blue values onto the georeferenced point location [30]. Other components in the airborne LiDAR system are the control and data recording unit and onboard computer. The control and data recording unit stores raw data collected by the scanner, IMU, and GPS. Laser scanners can produce about 20 gigabytes of ranging data per hour as compared to the summation of GPS and IMU data, which only produce about 0.1 gigabytes per hour [31].

2.2. Terrestrial LiDAR: Fundamentals and System Components

Terrestrial LiDAR, also known as terrestrial laser scanning, is a ground-based version of the airborne LiDAR, which is frequently used for terrain and topographic mapping. Terrestrial LiDAR includes stationary laser scanning, whereby the sensor is mounted on a tripod for fixed positions and mobile laser scanning, while the sensor is mounted on a mobile ground-based platform such as a vehicle. The term terrestrial LiDAR usually refers to static laser scanning. Because static and mobile laser scanning differ in terms of components and mechanisms, these two categories are discussed separately in this section.
Nevertheless, both systems still have several similarities. For instance, the main component of both terrestrial LiDAR systems is a laser scanner. Lasers with a wavelength of 500–600 nm are typically used in ground-based LiDAR systems [26]. Furthermore, terrestrial LiDAR, just like airborne LiDAR systems, utilizes an integrated digital camera or video recording, which is responsible for colorizing point clouds and three-dimensional (3D) models to represent color in the real world.

2.2.1. Static Laser Scanner

Static laser scanning is performed from the top of a fixed surveying tripod. Static terrestrial laser scanning needs a two-dimensional (2D) scanning pattern to complete a scan survey, which is why static terrestrial LiDAR integrates with one or two mirrors that can change the direction of laser pulses [32]. Therefore, this LiDAR system can scan and measure the distances of the surrounding objects. Terrestrial LiDAR systems identify the range between the sensor and the targets by measuring the time required for the laser pulse to travel to the target and return to the sensor. The basic components for this system include the ranging unit, scanning mechanisms, laser controller, data recorder, and (optionally) a digital camera.
Theoretically, the laser scanner operates by emitting an infrared laser beam to the center of a rotating mirror, which deflects the laser beam around the scanning area. Once the scattered light hits the objects, it reflects onto the scanner. The digital camera can be mounted on the scanner rotating axis to provide images of the surroundings [33] The recorded time it takes is divided by two and multiplied by the speed of light to get the distance. The coverage of terrestrial laser scanning usually ranges from 100 m to 300 m [24]. Because static terrestrial LiDAR scans are provided from a stable position and orientation, point clouds with good geometric quality are obtained [31].

2.2.2. Mobile Laser Scanner

On the other hand, mobile laser scanning has similar data collection modes to airborne LiDAR. Showing many similarities with airborne LiDAR, mobile laser scanning requires only one scanning (1D) direction, whereas the other is performed by the moving platform. In mobile laser scanning systems, the laser scanner is mounted on a moving vehicle such as a car or van. Due to the continuous motion of the scanner, positioning systems based on GPS and IMU technologies are required to precisely measure the respective positions and orientations. The systems perform as the vehicle moves around, while the positioning systems track the trajectory and attitude of the vehicle for producing a 3D point cloud from the range of data collected. Figure 1 illustrates the operating principles of all types of laser scanning.

2.3. Advantages and Disadvantages of Airborne and Terrestrial LiDAR

Both LiDAR systems have their advantages and drawbacks. Airborne LiDAR data offer rapid data acquisition capability and a high degree of automation. Data are captured with a speed of up to about 50 km2/h [34]. Due to this, it is considered to be a fast method of generating accurate DEM. Furthermore, because airborne LiDAR captures data from above, it gives a direct and clearer view of roads and rooftops of buildings as compared to terrestrial LiDAR.
In contrast, terrestrial LiDAR is preferable compared to airborne LiDAR in certain situations because terrestrial LiDAR is more cost-effective for small-scale areas and can be portable, while it produces high-resolution of terrain data. The main advantages of terrestrial LiDAR data are the high measurement density and high data accuracy. It can collect higher point density, typically 100 points/m2 [35]. It can also provide scan rates up to half a million points per second for 100 m to 300 m, depending on the distance range of the scanner [31]; thus, it provides detailed terrain description and high-resolution surface roughness [15,36,37,38,39]. Terrestrial LiDAR yields high-resolution digital elevation models (DEMs) with pixel sizes on the scale of centimeters rather than the 1–3-m-resolution DEMs derived from airborne LiDAR [40].
Even though terrestrial LiDAR data can be used to provide information in small-scale areas, it cannot provide data in certain areas such as private lands and steep slope areas. Therefore, several researchers suggest fusing terrestrial LiDAR with airborne sources to cover topographic features in inaccessible areas [38,41].

2.4. Overview

In summary, there are different ways of achieving data acquisition using LiDAR data, including airborne LiDAR and terrestrial LiDAR. Previous studies demonstrated that terrestrial LiDAR data held an advantage over other DEM sources, including airborne LiDAR, as they responded to small-scale topographic features, which were important factors that influenced the flood prediction results. Airborne LiDAR has difficulty in detecting small-scale features which are often not well represented in DEMs, which is the reason why many researchers opted for terrestrial LiDAR to generate a high-resolution DEM. Nevertheless, both LiDAR sensors proved to be able to maintain high accuracy and produce high-resolution data due to their high scanning rates [42] compared to other DEM sources.

3. Applications of LiDAR System in Flood Monitoring

The application of LiDAR in supporting many science research activities such as geologic mapping, landslide hazards, and flood risk management cannot be disputed [43]. The number of publications of peer-reviewed research literature recorded in the Scopus database for the past 10 years, from 2010 to 2019, which discussed LiDAR data in flood studies, was determined. The related papers were searched using the boolean “AND” to combine the words “LiDAR” and “flood”, and we sought these words in the abstract, title, and keywords of the documents. This study decided to focus only on research articles and conference proceedings of the related topic to be counted, as presented in Figure 2.
The graph shows that there was a rapid increase in the rate of publishing papers on LiDAR and flood applications in early 2010, and this increasing trend remained until 2019. There may be various reasons for the increase such as the availability and accessibility of LiDAR technology and the occurrence of flood disasters in the world. For instance, Duan et al. [44] suggested that flood disasters became more severe in China in recent years based on flood variations from 1950 to 2013. Furthermore, the potential of LiDAR technology to provide high-quality data may receive attention from researchers and practitioners, which leads to an increment in LiDAR data applications in multidisciplinary studies, especially in flood applications.
LiDAR provides detailed information on the elevation of the ground surface for predicting flood inundation from rivers. Detailed LiDAR measurements not only offer higher-resolution elevation data for floodplain modeling, but they also provide a source of high-resolution surface roughness information. High resolution and high accuracy of a topographic dataset are also important in predicting the flood inundation [45].
Due to this, LiDAR technology is in demand for creating DEMs for flood-prone areas, especially in urban areas. The application of high-resolution LiDAR data is increasing in developed countries [46] such as in the United Kingdom, as well as in the United States. This section reviews the previous studies on the application of the airborne and terrestrial LiDAR in flood mapping and monitoring applications. This paper discusses several topics relevant to flood studies from a LiDAR data perspective.

3.1. Development of Flood Models Using DEM LiDAR

One of the important factors in producing reliable flood inundation maps is the availability of high-accuracy topographic data [47]. Detailed and accurate DEMs are needed, to represent specific properties that may obstruct and conduct the flow of water in the real world. Inaccurate topographic representation in a small-scale area would affect the simulation results [15], especially in urban areas; hence, researchers tend to use high-resolution input data for flood simulation in urban areas and floodplains to collect important small-scale features. Many studies were carried out to demonstrate the effectiveness of using LiDAR-derived DEMs in developing flood models. Results from the flood model simulations were compared with the observed water level during previous flood events to validate the simulated results.
Priestnell et al. [36] discussed the methods of extracting surface features from DSMs generated by airborne LiDAR. The extraction of features could help in many applications, including flood inundation modeling. This study explained the way in which the DEM and surface roughness layer could be generated from the original DSM from LiDAR by using a simple filtering procedure and an artificial neural network. The findings were illustrated in the case of flood inundation modeling. Furthermore, Webster et al. [48] investigated the coastal impacts due to climate change and sea-level rise in Charlottetown, Canada. Detailed topographic data were derived from airborne LiDAR for flood risk mapping, and they were used to define flood risk hazards. This finding demonstrates the effectiveness of airborne LiDAR for identifying the impact of climate change and storm surge in coastal areas.
Webster et al. [49] generated a flood risk map by using airborne LiDAR and geographical information system (GIS) processing to study flood inundation in Southeast New Brunswick, Canada. The flood inundation and flood depth of the proposed approach were validated by comparing the results with water levels observed during the flood event in January 2000. It was found that the flood extent and flood depth were accurate within 10–20 cm. Bales et al. [50] also carried out a study on flood inundation maps derived from LiDAR data for real-time flood mapping applications in Tar River Basin, North Carolina. This study used airborne LiDAR data with a vertical accuracy of about 20 cm to produce topographic data for the inundation maps. The difference between the measured and simulated water levels to high-water marks was less than 25 cm.
For terrestrial LiDAR, the first attempt at developing an urban hydraulic model using terrestrial LiDAR was done by Fewtrell et al. [51]. The performance of the flood model was analyzed by comparing the simulation results with the 50-cm-resolution model as a benchmark. This study found that errors in coarse-scale topographic datasets were significantly high. Moreover, the authors concluded that terrestrial LiDAR data can be used to provide information in small-scale flood risk management and suggested fusing airborne and terrestrial LiDAR to cover topographic features in inaccessible areas. Sampson et al. [52] investigated the capability of terrestrial LiDAR to provide high accuracy of DEMs for improving flood inundation models in urban areas. The study found that small features such as curbs and dykes, which had a significant impact on the flood propagation, could be represented from the terrestrial LiDAR data. The authors concluded that terrestrial LiDAR could be employed when an accurate representation of surface features is required, especially in urban inundation studies.
Furthermore, Poppenga and Worstell [53] demonstrated the need for hydrologic information derived from airborne LiDAR elevation surfaces for flood inundation monitoring in coastal regions. The study demonstrated how inland areas are hydrologically disconnected to ocean water due to bridge decks or culverts. Next, Yin et al. [54] used LiDAR-derived DEM in a high-resolution 2D hydraulic model to study the impact of land subsidence on urban pluvial flooding. The authors concluded that land subsidence could lead to moderate impacts on flood extent and flood depth in the urban areas. Chen et al. [55] assessed the accuracy of airborne LiDAR-derived flood extent by evaluating the data during the 2008 Iowa flood in the United States (US) with field measurements collected by the US Geological Survey (USGS) and Federal Emergency Management Agency (FEMA). The root-mean-square error (RMSE) of the floodwater surface profile from LiDAR to field measurement was 30 cm. The finding showed that LiDAR surveys could be used in measuring floodwater heights with reliable quality.
After the devastating flood in 2008, the Iowa Flood Center (IFC) was established to improve the availability of flood-relevant information to the community. Krajewski et al. [56] discussed several projects conducted by the IFC that were related to flood disasters. One of the projects was flood mapping that could be accessed online, working as flood inundation map libraries. Hydrodynamic modeling was used to simulate river and floodplain flows by using the best approach to describe river and floodplain topography, which was LiDAR data. In summary, these findings demonstrated the effectiveness of airborne LiDAR for identifying the impact of flooding.
In the past few years, LiDAR technology was widely used in flood inundation research due to its high potential of providing inundation models with detailed elevation data. Based on these studies, it was found that LiDAR data produce high-resolution DEMs for flood simulation modeling, which can be an efficient tool in floodplain inundation management.

3.2. Generation of Surface Roughness Maps Using LiDAR Data

One of the essential input parameters in a flood model is surface roughness, which is useful for boundary conditions. Roughness maps can be derived from different sources such as orthophoto, LiDAR data, and land-use data. The surface roughness has a significant effect on the output of hydrodynamic modeling. The roughness parameter is often defined through Manning’s formula [57]. Meanwhile, the roughness values are mostly derived from a look-up table based on land-use/land-cover classification (LULC).
According to Straatsma and Baptist [58], roughness values have to be estimated accurately to reduce the variation of input parameters during calibration. The authors carried out a study to derive roughness parameterization using multispectral and airborne LiDAR data. After that, the results of the proposed method were compared with a traditional roughness parameterization approach, which was a manual interpretation of aerial photographs and a look-up table. This approach led to a high-resolution roughness map.
Vetter et al. [59] used airborne LiDAR to derive hydraulic surface roughness estimations based on geometry data by using vertical vegetation structure analysis. The effects of different roughness coefficient values were quantified by calculating the inundated depth maps. The results showed that the roughness values derived from airborne LiDAR represented the area in detail as compared to the traditionally derived map.
High-resolution data are recommended as the best option for damage assessment applications. Joyce et al. [60] recommended using airborne LiDAR data to generate DEMs and surface roughness layers to be included in hazard models. Moreover, the high density of LiDAR data provides a high-resolution surface roughness of floodplains. This information is very useful for boundary conditions in flood simulations [61].
Dorn et al. [57] derived roughness maps based on several different datasets, including LiDAR. This study aimed to analyze the effect of the roughness maps on flood simulations. LiDAR point clouds were used to derive surface roughness by using a voxel structure, an approach developed by Vetter et al. [59]. The results based on different roughness maps differed in terms of inundation area, water depth, and flood intensity. The authors suggested using LiDAR data to derive a roughness map for estimating the consequences of floods. Moreover, the authors mentioned that the use of the same LiDAR data in producing the DEM data and the roughness maps is beneficial, as there is no issue of temporal difference.
In short, in addition to topography, surface roughness has a great influence on hydrodynamic models as it affects the flow regime [62,63,64]. Hence, appropriate roughness maps should be generated for the use of hydrodynamic models for predicting the reliable consequences of flood disasters. Based on previous research, it was concluded that LiDAR data provide high-resolution surface roughness, which will increase the accuracy of the flood extent simulated by the hydrodynamic model. Hence, laser scanning technology is able to produce a roughness map with a high level of spatial detail [58].

3.3. Comparisons of LiDAR-Derived DEMs with Other DEM Sources

Due to the significant impacts of DEM accuracy on the flood model outputs, it is important to know which DEM sources could provide higher accuracy and spatial resolution before the selected DEM is used for the assessment of flood hazard risk. Therefore, many comparative studies were carried out using different DEM sources to understand the importance of the accuracy of DEM on the flood model. The results were analyzed based on significant differences in the model output. This section discusses the comparisons between LiDAR-derived DEM and other DEM sources, as well as their significant characteristics in flood applications.
Casas et al. [16] evaluated the effects of DEM sources on the hydraulic modeling of floods in terms of the hydraulic model outputs such as flood inundation and water surface elevation. The results of this study demonstrated that the flood model output was highly dependent on the DEM quality with LiDAR data, showing a high potential source for the parameterization of channel and floodplain topography.
Schumann et al. [65] carried out a comparison of DEMs generated from airborne LiDAR, contours, and SRTM in terms of the effect on a flood inundation model. The results were compared with inundation maps from a model calibrated with ground-surveyed maximum watermarks. As expected, the authors found that LiDAR had the lowest RMSE, followed by contour DEM and SRTM. The estimated inundated area for LiDAR was the largest area and the nearest to the reference value. It was concluded that LiDAR is the most reliable source of topographic data for flood hazard estimation.
Moreover, Wang and Zheng [66] compared LiDAR-derived DEM with United States Geologic Survey (USGS) national elevation data (NED) on floodplains in North Carolina. Sanders [67] extended the scope by evaluating the difference between LiDAR-derived DEM and NED with airborne IfSAR and SRTM for flood inundation modeling. Sanders found that flood model predictions were highly dependent on the DEM resolution. The author also concluded that LiDAR-derived DEM was more accurate than other DEM sources which overestimated the flood extent. The need for LiDAR data is now a fundamental input to hydrologic and hydraulic models, especially in flood inundation models.
Furthermore, Coveney and Fotheringham [68] examined the impact of DEM data sources on flood risk prediction in the coastal areas. The authors used national-coverage DEM known as Ordnance Survey Ireland, two GPS-derived DEMs generated at low and medium resolution, and terrestrial LiDAR-derived DEM to model flood risk. The findings demonstrated that the DEM generated from terrestrial LiDAR was more advantageous than other DEM data sources, especially in representing small topographical features in a local flood.
Additionally, Papaioannou et al. [69] investigated the influence of different DEM sources used in a hydraulic model for flood analysis. The results of the flood models were compared with historical flood records. According to this study, DEMs derived from terrestrial LiDAR were best, as they generated the closest values to the historical data. This finding indicated that the high accuracy of DEMs helped improve the flood risk analysis task. This study concluded that the accuracy of DEMs is the major factor that affects flood modeling results.
In addition, Li and Wong [70] studied the effects of different DEM sources on flood simulation results. The authors concluded that different DEM sources have major impacts on inundation areas from flood prediction results as compared to DEM spatial resolution. Based on the experimental results, it was found that inundation areas from LIDAR-derived DEM were the closest to reality. Furthermore, this study also highlighted that the reliability of the DEM source significantly affected the flood simulation results.
Jakovljevic and Govedarica [71] simulated flood inundation by selecting the grid cell of a DEM lower than the projected water level, connected to an adjacent flooded grid cell. In this study, the authors used LiDAR-derived DEM and the Advanced Spaceborne Thermal Emission and Reflection Radiometer Global Digital Elevation Model (ASTER GDEM) to study the difference in the estimated flood extents. It was found that land elevation from ASTER GDEM was overestimated, which directly resulted in an underestimation of flood inundation risk. The inundation map generated from ASTER GDEM indicated that the inundation area was two times smaller than that generated from LiDAR-derived DEM. Figure 3 shows the visual comparison of the flood extent from LiDAR and ASTER GDEM.
Based on previous research, LiDAR proved to be an efficient method to provide terrain data with high resolution as compared to other DEM sources [72]. According to Sampson et al. [73], LiDAR-derived DEMs are considered the most reliable DEMs for flood modeling to date. In summary, hydrological modeling studies showed that the vertical accuracy of DEMs does affect the accuracy of hydrologic predictions [70].

3.4. LIDAR as a Source of Information for Hydrodynamic Model Verification

Based on previous studies, it was found that LiDAR data are capable of producing high-resolution DEMs for flood simulation modeling, which can be an efficient tool in floodplain inundation management. Hence, they are commonly used for hydrodynamic model verification. Courty et al. [74] mentioned that inundation areas from LIDAR-derived DEM were the closest to reality as reported by Li and Wong [69]; therefore, they used LiDAR-derived DEM as a reference when comparing DEMs generated from Advanced Land Observing Satellite (ALOS) World 3D-30m (AW3D30), SRTM, and Advanced Spaceborne Thermal Emission and Reflection Radiometer (ASTER) for flood modeling purposes. Based on the flood simulation results, AW3D30 performed better than SRTM, while ASTER was the worst performer of all global DEMs.
Hashemi et al. [75] also used LiDAR-derived DEMs as a reference when investigating the quality of DEMs generated from an unmanned aerial vehicle (UAV) used in flood modeling. These studies concluded that the reliability of floodplain maps is dependent on the quality of DEM. Van de Sande et al. [76] adopted LiDAR DEM data as ground truth referring to the terrain elevation. Hence, the flood risk assessment of publicly available DEMs such as ASTER and SRTM DEM was compared with flood risk based on LiDAR DEM. The inundation maps of these publicly available DEMs were smaller than inundation maps produced using LiDAR DEM. The underestimations of the flood risk influence the credibility when making appropriate decisions regarding flood risk management and mitigation.
Furthermore, most small river basins in many countries are not characterized by high-quality DEMs such as LiDAR data [77]. Hence, aerial photographs or globally available DEMs such as ASTER and SRTM are commonly used, which leads to low accuracy of flood prediction due to the significant effect of low-accuracy DEMs. Therefore, this study proposed using corrected DEMs generated from aerial photographs as an option in flood modeling. The correction of DEM was performed based on field measurements to determine vertical errors. Then, a reference DEM that was developed from LiDAR data was used to validate the performance of the original and corrected DEM. The impact of DEM accuracy was evaluated using the flood model. The results from the model indicated that the flood prediction of corrected DEM was better than that of the original DEM when compared with the simulated result of the reference DEM, as shown in Figure 4. However, the authors suggested that the proposed method was not suitable for urban areas.

3.5. LiDAR DEM for Flood Hazard and Flood Risk Mapping

Flood risk assessment and management rely on the accuracy of flood extent simulated using a flood model. Most flood risk mapping is based on a conceptual risk approach that uses DEMs to predict the flood hazard according to the projected water levels and to indicate the vulnerability of areas to flood events with damage to properties and livelihood. Hazard mapping is an important element in assessing risk and designing mitigation measures for flood-prone areas.
Flood hazard is usually generated based on the outcome of hydrological models that simulate the water movement across the floodplain like flood extent, water velocity, or water depth [11,37,78]. In addition, flood hazards can also be produced using a statistical or machine-learning approach integrated with GIS technology by using fluvial stage records and topographic data [79,80]. Flood hazard and flood risk maps indicate the flood-prone area with possible destructive impact, which is used for flood planning purposes.
For instance, existing digital mapping was not sufficient enough to provide a high accuracy of flood risk maps for Annapolis Royal, Nova Scotia, Canada, an area that is vulnerable to coastal flooding [81]. Hence, the need for a high-resolution DEM was studied to produce accurate inundation maps based on sea level and climate change. As the sea level rises, water inundates the nearby lands; thus, it is important to define the extent of the flood inundation. The predicted results were compared with the benchmark of a past storm event to test the model. Based on the prediction results, mitigation structures such as dykes could be suggested if coastal development is planned to take place in any of the risk areas.
Puno et al. [13] conducted flood simulations at different return periods with LiDAR-derived DEMs as a primary source of elevation data in the hydrologic model. The model was calibrated by comparing the predicted flood simulation with a real flood event in 2016. Flood hazard maps were generated from the simulated flood events using GIS and LiDAR-derived DEM. The generated maps were validated through an interview with the affected localities. The authors found that using LiDAR data in the hydrologic model could produce high-resolution flood hazard maps that can offer more accurate decisions and actions in disaster management and mitigation.
Ogania et al. [14] evaluated the effect of DEM resolutions on generating flood hazard maps using hydraulic modeling software for disaster preparedness and mitigation. This study presented the performance of three different DEM resolutions, which were LiDAR, IfSAR, and SAR DEMs in flood modeling studies. The accuracy of each generated flood map was evaluated using a confusion matrix approach by comparing the generated maps with the actual flood data. This paper revealed that LiDAR-derived DEMs provide a more defined flood extent and clear distribution of flood hazards. Furthermore, they offer more accurate flood maps compared to other DEM data sources, which aligned with the findings from previous researchers such as Hailes and Rientjes [82] and Schumann et al. [65].
Mihu-Pintilie et al. [83] used high-density LiDAR data with 2D hydraulic modeling to improve urban flood hazard maps. This study simulated four different multi-scenarios at different discharge values. Because LiDAR data provide a precise representation of the hydraulic conditions such as channels and roads, the combination of 2D hydraulic and LiDAR DEMs produced accurate information regarding flood hazard vulnerability. Flood hazard maps were generated based on flood depth classification according to the Japanese criteria of the Ministry of Land Infrastructure and Transport (MLIT). The criteria suggested five hazard classes of very low, low, medium, high, and extreme classified as H1, H2, H3, H4, and H5, respectively. Figure 5 shows that all hazard classes were encountered according to scenario 1 (s1). However, most of the affected areas were assigned with the very low or low class of hazard (H1 and H2).
LiDAR datasets were implemented in a new procedure of flood hazard estimation proposed by Guerriero et al. [84]. The authors developed algorithms of interpolation of multiple probability models of hydrometric time-series data combined with topography derived from LiDAR data for the production of flood hazard maps. Flood hazard maps produced from this method were compared with a flood event observation in 2015 for validation. This suggested method can be considered as another option for hydraulic simulations to provide flood hazard analysis.
In conclusion, high-resolution DEMs have great influence on producing accurate and reliable maps in the field of flood simulations. Using these maps helps in disaster risk reduction and management, especially in identifying specific areasthat need to be prioritized for providing appropriate flood risk management measures to be taken to combat flood disaster. Previous studies implied that LiDAR-derived DEMs improve the accuracy of flood parameters; hence, they can help in producing high-quality flood hazard and flood risk mapping.

4. Challenges and Future Perspectives

The frequency of flood disasters all over the world is increasing due to climate change and rapid urbanization. Future climate projections could provide an additional understanding of extreme climate changes, including the risk of flood events [85]. Furthermore, studies on flood mapping and monitoring increased with the advancement of current technologies to reduce the impact of flood disasters. LiDAR data acquisitions seem to be a promising approach to solve the problems associated with the inadequate representation of topographic data. Both airborne and terrestrial LiDAR systems are active imaging techniques operating with light that allow the systems to collect data during daylight or nighttime. Previous studies revealed that LiDAR technology has many advantages, which makes it suitable for flood modeling, particularly in flat areas and complex urban environments. Depending on the spatial scale, LiDAR data offer different advantages for accurate terrain mapping compared to other sources. Moreover, LiDAR could be advantageous to provide information in small-scale flood risk management by having small important topographic features such as dykes, ditches, and levees [15,51,86,87]. Furthermore, the integration of LiDAR technology with any remotely sensed products may be used to increase the effectiveness of this technology, especially in flood modeling.
However, there are some restrictions in using LiDAR-derived DEM in the context of flood applications. The main drawback of both LiDAR systems is the process of classifying ground from non-ground data for DEM generation, which is needed in simulations of the flood model. Ground surface information is not easily extracted, especially in areas with complex terrain surface and features such as buildings and vegetation [88]. The ground filtering process proves to be a challenging task as it can affect the accuracy of the LiDAR products [8,49,89]. Several filtering algorithms were developed by previous researchers to process LiDAR data. However, the LiDAR data must be correctly processed because they could influence the outcomes of flood mapping [69]. The algorithms perform differently depending on the specific surface conditions. This means that not all algorithms are competent in producing high-quality LiDAR-derived DEM data [90]. A filtering algorithm should be selected based on its ability to produce the desired result [91]. Common filtering algorithms used in LiDAR data processing include elevation threshold with expand window (ETEW), maximum local slope, adaptive triangulated irregular network (TIN), and progressive morphology [90,92,93]. Filtering problems are expected to be better solved with the evolution of machine learning [88].
In addition, the sensitive response of flood inundation to small changes in topography representation gives rise to several challenges [21]. Collecting small-scale features needs a high resolution of DEM data, but the data are rarely available, especially for developing countries. Not all countries can afford to use LiDAR data due to economic constraints. The high cost and the difficulty of processing huge LiDAR datasets could be the main reason why LiDAR data are not used in some developing countries. Even developed countries like the United States and the United Kingdom do not have LiDAR data available for the entire country. Another challenge when using LiDAR data is the need for huge data storage due to the high-point-density data. High-point-density data need a longer computational time to process [94,95]. Between airborne and terrestrial LiDAR systems, the time required for flood model simulations using terrestrial LiDAR is 10 times longer than that required for airborne LiDAR [96].
Furthermore, even though high-resolution DEMs offer detailed information topography, they take a longer time to process or analyze the data. Abucay and Tseng [97] carried out a visibility analysis that could be used in identifying flood-prone areas using various DEM sources. The authors reported that the LiDAR-derived DEM required 28 min to complete the visibility analysis, followed by the SAR DEM that took 19 s, while ALOS and ASTER GDEM both required only 3 s to complete the process. Nevertheless, the computational time problem may be solved with future advancements in computer technology. Moreover, the LiDAR system cannot penetrate water bodies as its laser beam is absorbed by the water. Therefore, the inaccurate elevation measurement of water-covered areas influences cross-section attributes, leading to inaccuracies in hydrodynamic simulations [98].

5. Conclusions

Detailed topographic information is a crucial input parameter for flood modeling and monitoring. The performance of flood modeling is highly dependent on the DEM accuracy [10], especially in small-scale flood modeling studies. Flood model simulation results show differences in water depth and inundation when using detailed DEMs, proving that DEM accuracy has a significant impact on flood hazard estimation [21,41]. Therefore, the need for high-resolution DEM explains the interest in exploring new technology to generate detailed elevation data. In this review, the promising applications in numerous flood studies demonstrate that the LiDAR system is capable of offering high-density and high-resolution DEM data to improve the flood model input, thus resulting in a higher accuracy of flood modeling results. However, LiDAR data also face several difficulties that need to be addressed in the future regarding the filtering process for DEM generation and enormous point density data that need huge data storage, resulting in a longer computational time to simulate flood models. Additionally, integration between terrestrial and airborne LiDAR or any remotely sensed products seems to be a promising approach to solve the problems associated with the inadequate representation of topographic data in topographically complex areas [99]; hence, more investigation and research work for the expansion of LiDAR systems can be foreseen in upcoming applications of flood detection and monitoring.

Author Contributions

N.A.M. executed the manuscript writing, coordinated the paper revisions, and contributed to the workflow implementation. A.F.A. contributed to the workflow implementation, as well as the manuscript compilation and revisions. S.K.B. proposed the research idea. M.R.M. and A.M. supervised the final manuscript. All authors have read and agreed to the published version of the manuscript.

Funding

This research was funded by Universiti Putra Malaysia, grant number UPM/800-3/3/1/GPB/2019/9678700.

Acknowledgments

The authors wish to acknowledge the assistance of the Department of Biological and Agricultural Engineering, Faculty of Engineering, Universiti Putra Malaysia for supplying the facilities for this study. The authors would also like to appreciate the support for this study from the Institute of Aquaculture and Aquatic Sciences.

Conflicts of Interest

The authors declare no conflict of interest.

References

  1. Chan, N.W. Impacts of Disasters and Disaster Risk Management in Malaysia: The Case of Floods BT—Resilience and Recovery in Asian Disasters: Community Ties, Market Mechanisms, and Governance; Aldrich, D.P., Oum, S., Sawada, Y., Eds.; Springer: Tokyo, Japan, 2015; pp. 239–265. ISBN 978-4-431-55022-8. [Google Scholar]
  2. DID. Department of Irrigation and Drainage (DID) Manual (Volume 1–Flood Management); Department of Irrigation and Drainage: Kuala Lumpur, Malaysia, 2009; Volume 1. [Google Scholar]
  3. Khan, H.; Vasilescu, L.G.; Khan, A. Disaster management cycle—A theoretical approach. J. Manag. Mark. 2008, 6, 43–50. [Google Scholar]
  4. National Research Council. Elevation Data for Floodplain Mapping; National Academies Press: Washington, DC, USA, 2007; ISBN 0309104092. [Google Scholar]
  5. Wilson, J.P.; Gallant, J.C. Terrain Analysis: Principles and Applications; John Wiley & Sons: Hoboken, NJ, USA, 2000; ISBN 0471321885. [Google Scholar]
  6. Schenk, T. Introduction to Photogrammetry; Department of Civil and Environmental Engineering and Geodetic Science The Ohio State University: Columbus, OH, USA, 2005; pp. 79–95. [Google Scholar]
  7. Dowman, I. Integration of LIDAR and IFSAR for mapping. Int. Arch. Photogramm. Remote Sens. 2004, 35, 90–100. [Google Scholar]
  8. Hodgson, M.E.; Jensen, J.R.; Schmidt, L.; Schill, S.; Davis, B. An evaluation of LIDAR- and IFSAR-derived digital elevation models in leaf-on conditions with USGS Level 1 and Level 2 DEMs. Remote Sens. Environ. 2003, 84, 295–308. [Google Scholar] [CrossRef]
  9. Merwade, V.; Olivera, F.; Arabi, M.; Edleman, S. Uncertainty in Flood Inundation Mapping: Current Issues and Future Directions. J. Hydrol. Eng. 2008, 608–620. [Google Scholar] [CrossRef] [Green Version]
  10. Sanyal, J.; Lu, X.X. Application of Remote Sensing in Flood Management with Special Reference to Monsoon Asia: A Review. Nat. Hazards 2004, 283–301. [Google Scholar] [CrossRef]
  11. Bates, P.D.; De Roo, A.P.J. A simple raster-based model for flood inundation simulation. J. Hydrol. 2000, 236, 54–77. [Google Scholar] [CrossRef]
  12. Chaubey, I.; Cotter, A.S.; Costello, T.A.; Soerens, T.S. Effect of DEM data resolution on SWAT output uncertainty. Hydrol. Process. 2005, 19, 621–628. [Google Scholar] [CrossRef] [Green Version]
  13. Puno, G.R.; Angelica Amper, R.L.; Allan Talisay, B.M. Flood simulation using geospatial and hydrologic models in Manupali Watershed, Bukidnon, Philippines. J. Biodivers. Environ. Sci. 2018, 294, 294–303. [Google Scholar]
  14. Ogania, J.L.; Puno, G.R.; Alivio, M.B.T.; Taylaran, J.M.G. Effect of digital elevation model’s resolution in producing flood hazard maps. Glob. J. Environ. Sci. Manag. 2019, 5, 95–106. [Google Scholar] [CrossRef]
  15. Tamiru, A.; Rientjes, T.H.M. Effects of Lidar Dem Resolution in Flood Modelling: A Model Sensitivity Study for the City of Tegucigalpa, Honduras. In Proceedings of the ISPRS WG III/3, III/4, V/3 Workshop, Enschede, The Netherlands, 12–14 September 2005; pp. 168–173. [Google Scholar]
  16. Casas, A.; Benito, G.; Thorndycraft, V.R.; Rico, M. The topographic data source of digital terrain models as a key element in the accuracy of hydraulic flood modelling. Earth Surf. Process. Landf. 2006, 31, 444–456. [Google Scholar] [CrossRef]
  17. Vaze, J.; Teng, J.; Spencer, G. Impact of DEM accuracy and resolution on topographic indices. Environ. Model. Softw. 2010, 25, 1086–1098. [Google Scholar] [CrossRef]
  18. Hsu, Y.C.; Prinsen, G.; Bouaziz, L.; Lin, Y.J.; Dahm, R. An Investigation of DEM Resolution Influence on Flood Inundation Simulation. Procedia Eng. 2016, 154, 826–834. [Google Scholar] [CrossRef]
  19. Ozdemir, H.; Sampson, C.C.; De Almeida, G.A.M.; Bates, P.D. Evaluating scale and roughness effects in urban flood modelling using terrestrial LIDAR data. Hydrol. Earth Syst. Sci. 2013, 17, 4015–4030. [Google Scholar] [CrossRef] [Green Version]
  20. Savage, J.T.S.; Bates, P.; Freer, J.; Neal, J.; Aronica, G. When does spatial resolution become spurious in probabilistic flood inundation predictions? Hydrol. Process. 2016, 30, 2014–2032. [Google Scholar] [CrossRef] [Green Version]
  21. de Almeida, G.A.M.; Bates, P.; Ozdemir, H. Modelling urban floods at submetre resolution: Challenges or opportunities for flood risk management? J. Flood Risk Manag. 2018, 11, S855–S865. [Google Scholar] [CrossRef] [Green Version]
  22. Erpicum, S.; Dewals, B.; Archambeau, P.; Detrembleur, S.; Pirotton, M. Detailed Inundation Modelling Using High Resolution DEMs. Eng. Appl. Comput. Fluid Mech. 2010, 4, 196–208. [Google Scholar] [CrossRef] [Green Version]
  23. Savage, J.T.S.; Pianosi, F.; Bates, P.; Freer, J.; Wagener, T. Quantifying the importance of spatial resolution and other factors through global sensitivity analysis of a flood inundation model. Water Resour. Res. 2015, 52, 9146–9163. [Google Scholar] [CrossRef]
  24. Olsen, M.J. Methodology for Assessing Coastal Change Using Terrestrial Laser Scanning. Ph.D. Thesis, University of California, San Diego, CA, USA, 2009. [Google Scholar]
  25. Lemmens, M. Geo-Information: Technologies, Applications and the Environment; Springer: London, UK, 2011; ISBN 9789400716667. [Google Scholar]
  26. Dong, P.; Chen, Q. LiDAR Remote Sensing and Applications; CRC Press: Boca Raton, FL, USA, 2017; ISBN 1351233343. [Google Scholar]
  27. Chen, Z. The Application of Airborne Lidar Data in the Modelling of 3D Urban Landscape Ecology; Cambridge Scholars Publishing: Cambridge, UK, 2016; ISBN 1443857602. [Google Scholar]
  28. Cracknell, A.P. Introduction to Remote Sensing; CRC press: Boca Raton, FL, USA, 2007; ISBN 1420008978. [Google Scholar]
  29. Li, Z.; Chen, J.; Baltsavias, E. Advances in Photogrammetry, Remote Sensing and Spatial Information Sciences: 2008 ISPRS Congress Book; CRC Press: Boca Raton, FL, USA, 2008; Volume 7, ISBN 0203888448. [Google Scholar]
  30. Pradhan, B. Laser Scanning Applications in Landslide Assessment; Springer: Berlin/Heidelberg, Germany, 2017; ISBN 3319553429. [Google Scholar]
  31. Vosselman, G.; Maas, H.-G. Airborne and Terrestrial Laser Scanning; Whittles Publishing: Scotland, UK, 2010; ISBN 9781904445876. [Google Scholar]
  32. Thenkabail, P. Remote Sensing Handbook-Three Volume Set; CRC Press: Boca Raton, FL, USA, 2018; ISBN 1482282674. [Google Scholar]
  33. Dassot, M.; Constant, T.; Fournier, M. The use of terrestrial LiDAR technology in forest science: Application fields, benefits and challenges. Ann. For. Sci. 2011, 68, 959–974. [Google Scholar] [CrossRef] [Green Version]
  34. National Research Council. Earth Materials and Health: Research Priorities for Earth Science and Public Health; National Academies Press: Washington, DC, USA, 2007; ISBN 030910470X. [Google Scholar]
  35. Olsen, M.J. Guidelines for the Use of Mobile LIDAR in Transportation Applications; Transportation Research Board: Washington, DC, USA, 2013; Volume 748, ISBN 0309259142. [Google Scholar]
  36. Priestnall, G.; Jaafar, J.; Duncan, A. Extracting urban features from LiDAR digital surface models. Comput. Environ. Urban Syst. 2000, 24, 65–78. [Google Scholar] [CrossRef]
  37. Teng, J.; Jakeman, A.J.; Vaze, J.; Croke, B.F.W.; Dutta, D.; Kim, S. Flood inundation modelling: A review of methods, recent advances and uncertainty analysis. Environ. Model. Softw. 2017, 90, 201–216. [Google Scholar] [CrossRef]
  38. Turner, A.B.; Colby, J.D.; Csontos, R.M.; Batten, M. Flood modeling using a synthesis of multi-platform LiDAR data. Water (Switzerland) 2013, 5, 1533–1560. [Google Scholar] [CrossRef] [Green Version]
  39. Kerle, N.; Heuel, S.; Pfeifer, N. Real-time data collection and information generation using airborne sensors. In Geospatial Information Technology for Emergency Response; CRC Press: Boca Raton, FL, USA, 2008; pp. 59–90. ISBN 9780415422475. [Google Scholar]
  40. Lim, S.; Thatcher, C.A.; Brock, J.C.; Kimbrow, D.R.; Danielson, J.J.; Reynolds, B.J. Accuracy assessment of a mobile terrestrial lidar survey at Padre Island National Seashore. Int. J. Remote Sens. 2013, 34, 6355–6366. [Google Scholar] [CrossRef]
  41. Leitão, J.P.; de Sousa, L.M. Towards the optimal fusion of high-resolution Digital Elevation Models for detailed urban flood assessment. J. Hydrol. 2018, 561, 651–661. [Google Scholar] [CrossRef]
  42. Awange, J. GNSS Environmental Sensing; Springer International Publishers: New York, NY, USA, 2018; Volume 10, pp. 973–978. [Google Scholar]
  43. Stoker, J.M.; Brock, J.C.; Soulard, C.E.; Ries, K.G.; Sugarbaker, L.J.; Newton, W.E.; Haggerty, P.K.; Lee, K.E.; Young, J.A. USGS Lidar Science Strategy—Mapping the Technology to the Science; US Department of the Interior, US Geological Survey: Reston, VA, USA, 2016. [Google Scholar]
  44. Duan, W.; He, B.; Nover, D.; Fan, J.; Yang, G.; Chen, W.; Meng, H.; Liu, C. Floods and associated socioeconomic damages in China over the last century. Nat. Hazards 2016, 82, 401–413. [Google Scholar] [CrossRef]
  45. Brasington, J.; Vericat, D.; Rychkov, I. Modeling river bed morphology, roughness, and surface sedimentology using high resolution terrestrial laser scanning. Water Resour. Res. 2012, 48, 1–18. [Google Scholar] [CrossRef] [Green Version]
  46. Mason, D.C.; Trigg, M.; Garcia-Pintado, J.; Cloke, H.L.; Neal, J.C.; Bates, P.D. Improving the TanDEM-X Digital Elevation Model for flood modelling using flood extents from Synthetic Aperture Radar images. Remote Sens. Environ. 2016, 173, 15–28. [Google Scholar] [CrossRef] [Green Version]
  47. Hawker, L.; Bates, P.; Neal, J.; Rougier, J. Perspectives on Digital Elevation Model (DEM) Simulation for Flood Modeling in the Absence of a High-Accuracy Open Access Global DEM. Front. Earth Sci. 2018, 6, 233. [Google Scholar] [CrossRef] [Green Version]
  48. Webster, T.L.; Forbes, D.L.; Dickie, S.; Shreenan, R. Using topographic lidar to map flood risk from storm-surge events for Charlottetown, Prince Edward Island, Canada. Can. J. Remote Sens. 2004, 30, 64–76. [Google Scholar] [CrossRef]
  49. Webster, T.L.; Forbes, D.L.; Mac Kinnon, E.; Roberts, D. Flood-risk mapping for storm-surge events and sea-level rise using lidar for southeast New Brunswick. Can. J. Remote Sens. 2006, 32, 194–211. [Google Scholar] [CrossRef]
  50. Bales, J.D.; Wagner, C.R.; Tighe, K.C.; Terziotti, S. LiDAR-Derived Flood-Inundation Maps for Real-Time Flood-Mapping Applications, Tar River Basin, North Carolina; Geological Survey (US): Reston, VA, USA, 2007. [Google Scholar]
  51. Fewtrell, T.J.; Duncan, A.; Sampson, C.C.; Neal, J.C.; Bates, P.D. Benchmarking urban flood models of varying complexity and scale using high resolution terrestrial LiDAR data. Phys. Chem. Earth 2011, 36, 281–291. [Google Scholar] [CrossRef]
  52. Sampson, C.C.; Fewtrell, T.J.; Duncan, A.; Shaad, K.; Horritt, M.S.; Bates, P.D. Use of terrestrial laser scanning data to drive decimetric resolution urban inundation models. Adv. Water Resour. 2012, 41, 1–17. [Google Scholar] [CrossRef]
  53. Poppenga, S.; Worstell, B. Evaluation of airborne lidar elevation surfaces for propagation of coastal inundation: The importance of hydrologic connectivity. Remote Sens. 2015, 7, 11695–11711. [Google Scholar] [CrossRef] [Green Version]
  54. Yin, J.; Yu, D.; Wilby, R. Modelling the impact of land subsidence on urban pluvial flooding: A case study of downtown Shanghai, China. Sci. Total Environ. 2016, 544, 744–753. [Google Scholar] [CrossRef] [PubMed] [Green Version]
  55. Chen, B.; Krajewski, W.F.; Goska, R.; Young, N. Using LiDAR surveys to document floods: A case study of the 2008 Iowa flood. J. Hydrol. 2017, 553, 338–349. [Google Scholar] [CrossRef]
  56. Krajewski, W.F.; Ceynar, D.; Demir, I.; Goska, R.; Kruger, A.; Langel, C.; Mantilllla, R.; Niemeier, J.; Quintero, F.; Seo, B.C.; et al. Real-time flood forecasting and information system for the state of Iowa. Bull. Am. Meteorol. Soc. 2017, 98, 539–554. [Google Scholar] [CrossRef]
  57. Dorn, H.; Vetter, M.; Höfle, B. GIS-based roughness derivation for flood simulations: A comparison of orthophotos, LiDAR and Crowdsourced Geodata. Remote Sens. 2014, 6, 1739–1759. [Google Scholar] [CrossRef] [Green Version]
  58. Straatsma, M.W.; Baptist, M.J. Floodplain roughness parameterization using airborne laser scanning and spectral remote sensing. Remote Sens. Environ. 2008, 112, 1062–1080. [Google Scholar] [CrossRef]
  59. Vetter, M.; Höfle, B.; Hollaus, M.; Gschöpf, C.; Mandlburger, G.; Pfeifer, N.; Wagner, W. Vertical Vegetation Structure Analysis and Hydraulic Roughness Determination Using Dense Als Point Cloud Data—A Voxel Based Approach. ISPRS-Int. Arch. Photogramm. Remote Sens. Spat. Inf. Sci. 2012, XXXVIII-5/W12, 265–270. [Google Scholar] [CrossRef] [Green Version]
  60. Joyce, K.E.; Samsonov, S.V.; Levick, S.R.; Engelbrecht, J.; Belliss, S. Mapping and monitoring geological hazards using optical, LiDAR, and synthetic aperture RADAR image data. Nat. Hazards 2014, 73, 137–163. [Google Scholar] [CrossRef]
  61. Brown, J.D.; Damery, S.L. Managing flood risk in the UK: Towards an integration of social and technical perspectives. Trans. Inst. Br. Geogr. 2002, 27, 412–426. [Google Scholar] [CrossRef]
  62. Aronica, G.; Hankin, B.; Beven, K. Uncertainty and equifinality in calibrating distributed roughness coefficients in a flood propagation model with limited data. Adv. Water Resour. 1998, 22, 349–365. [Google Scholar] [CrossRef]
  63. Fu, J.C.; Hsu, M.H.; Duann, Y. Development of roughness updating based on artificial neural network in a river hydraulic model for flash flood forecasting. J. Earth Syst. Sci. 2016, 125, 115–128. [Google Scholar] [CrossRef] [Green Version]
  64. Liu, Z.; Merwade, V.; Jafarzadegan, K. Investigating the role of model structure and surface roughness in generating flood inundation extents using one- and two-dimensional hydraulic models. J. Flood Risk Manag. 2019, 12, e12347. [Google Scholar] [CrossRef] [Green Version]
  65. Schumann, G.; Matgen, P.; Cutler, M.E.J.; Black, A.; Hoffmann, L.; Pfister, L. Comparison of remotely sensed water stages from LiDAR, topographic contours and SRTM. ISPRS J. Photogramm. Remote Sens. 2008, 63, 283–296. [Google Scholar] [CrossRef]
  66. Wang, Y.; Zheng, T. Comparison of light detection and ranging and national elevation dataset digital elevation model on floodplains of North Carolina. Nat. Hazards Rev. 2005, 6, 34–40. [Google Scholar] [CrossRef] [Green Version]
  67. Sanders, B.F. Evaluation of on-line DEMs for flood inundation modeling. Adv. Water Resour. 2007, 30, 1831–1843. [Google Scholar] [CrossRef]
  68. Coveney, S.; Fotheringham, A.S. The impact of DEM data source on prediction of flooding and erosion risk due to sea-level rise. Int. J. Geogr. Inf. Sci. 2011, 25, 1191–1211. [Google Scholar] [CrossRef]
  69. Papaioannou, G.; Loukas, A.; Vasiliades, L.; Aronica, G.T. Flood inundation mapping sensitivity to riverine spatial resolution and modelling approach. Nat. Hazards 2016, 83, 117–132. [Google Scholar] [CrossRef]
  70. Li, J.; Wong, D.W.S. Effects of DEM sources on hydrologic applications. Comput. Environ. Urban Syst. 2010, 34, 251–261. [Google Scholar] [CrossRef]
  71. Jakovljevic, G.; Govedarica, M.; Alvarez-Taboada, F.; Pajic, V. Accuracy assessment of deep learning based classification of LiDAR and UAV points clouds for DTM creation and flood risk mapping. Geosciences 2019, 9, 323. [Google Scholar] [CrossRef] [Green Version]
  72. Hsieh, Y.C.; Chan, Y.C.; Hu, J.C. Digital elevation model differencing and error estimation from multiple sources: A case study from the Meiyuan Shan landslide in Taiwan. Remote Sens. 2016, 8, 199. [Google Scholar] [CrossRef] [Green Version]
  73. Sampson, C.C.; Smith, A.M.; Bates, P.D.; Neal, J.C.; Trigg, M.A. Perspectives on open access high resolution digital elevation models to produce global flood hazard layers. Front. Earth Sci. 2016, 3, 85. [Google Scholar] [CrossRef] [Green Version]
  74. Courty, L.G.; Soriano-Monzalvo, J.C.; Pedrozo-Acuña, A. Evaluation of open-access global digital elevation models (AW3D30, SRTM, and ATSER) for flood modelling purposes. J. Flood Risk Manag. 2019, 12, e12550. [Google Scholar] [CrossRef] [Green Version]
  75. Hashemi-Beni, L.; Jones, J.; Thompson, G.; Johnson, C.; Gebrehiwot, A. Challenges and opportunities for UAV-based digital elevation model generation for flood-risk management: A case of princeville, north carolina. Sensors (Switzerland) 2018, 18, 3842. [Google Scholar] [CrossRef] [Green Version]
  76. Van de Sande, B.; Lansen, J.; Hoyng, C. Sensitivity of coastal flood risk assessments to digital elevation models. Water (Switzerland) 2012, 4, 568–579. [Google Scholar] [CrossRef]
  77. Laks, I.; Sojka, M.; Walczak, Z.; Wrózyński, R. Possibilities of using low quality digital elevation models of floodplains in hydraulic numerical models. Water (Switzerland) 2017, 9, 283. [Google Scholar] [CrossRef] [Green Version]
  78. Toda, L.L.; Yokingco, J.C.E.; Paringit, E.C.; Lasco, R.D. A LiDAR-based flood modelling approach for mapping rice cultivation areas in Apalit, Pampanga. Appl. Geogr. 2017, 80, 34–47. [Google Scholar] [CrossRef]
  79. Wang, Z.; Lai, C.; Chen, X.; Yang, B.; Zhao, S.; Bai, X. Flood hazard risk assessment model based on random forest. J. Hydrol. 2015, 527, 1130–1141. [Google Scholar] [CrossRef]
  80. Alfonso, L.; Mukolwe, M.M.; Di Baldassarre, G. Probabilistic Flood Maps to support decision-making: Mapping the Value of Information. Water Resour. Res. 2016, 52, 1026–1043. [Google Scholar] [CrossRef] [Green Version]
  81. Webster, T.L. Flood risk mapping using LiDAR for annapolis Royal, Nova Scotia, Canada. Remote Sens. 2010, 2, 2060–2082. [Google Scholar] [CrossRef] [Green Version]
  82. Haile, A.T.; Rientjes, T.H.M. Effects of LiDAR DEM resolution in flood modelling: A model sensitivity study for the city of Tegucigalpa, Honduras. In Proceedings of the ISPRS WG III/3, III/4, Enschede, The Netherlands, 12–14 September 2005; pp. 12–14. [Google Scholar]
  83. Mihu-Pintilie, A.; Cîmpianu, C.I.; Stoleriu, C.C.; Pérez, M.N.; Paveluc, L.E. Using high-density LiDAR data and 2D streamflow hydraulic modeling to improve urban flood hazard maps: A HEC-RAS multi-scenario approach. Water (Switzerland) 2019, 11, 1832. [Google Scholar] [CrossRef] [Green Version]
  84. Guerriero, L.; Ruzza, G.; Guadagno, F.M.; Revellino, P. Flood hazard mapping incorporating multiple probability models. J. Hydrol. 2020, 587, 125020. [Google Scholar] [CrossRef]
  85. Duan, W.; Hanasaki, N.; Shiogama, H.; Chen, Y.; Zou, S.; Nover, D.; Zhou, B.; Wang, Y. Evaluation and future projection of Chinese precipitation extremes using large ensemble high-resolution climate simulations. J. Clim. 2019, 32, 2169–2183. [Google Scholar] [CrossRef]
  86. Thatcher, C.; Lim, S.; Palaseanu-Lovejoy, M.; Danielson, J.; Kimbrow, D. Lidar-based mapping of flood control levees in South Louisiana. Int. J. Remote Sens. 2016, 37, 5708–5725. [Google Scholar] [CrossRef]
  87. Horritt, M.S.; Bates, P.D. Effects of spatial resolution on a raster based model of flood flow. J. Hydrol. 2001, 253, 239–249. [Google Scholar] [CrossRef]
  88. Podobnikar, T.; Vrečko, A. Digital Elevation Model from the Best Results of Different Filtering of a LiDAR Point Cloud. Trans. GIS 2012, 16, 603–617. [Google Scholar] [CrossRef]
  89. Zhang, K.; Chen, S.C.; Singh, P.; Saleem, K.; Zhao, N. A 3D visualization system for hurricane storm-surge flooding. IEEE Comput. Graph. Appl. 2006, 26, 18–25. [Google Scholar] [CrossRef]
  90. Abdullah, A.; Rahman, A.; Vojinovic, Z. LiDAR filtering algorithms for urban flood application: Review on current algorithms and filters test. Int. Arch. Photogramm. Remote Sens. Spat. Inf. Sci. 2009, 38, 30–36. [Google Scholar]
  91. Muhadi, N.A.; Abdullah, A.F.; Kassim, M.S.M. Quantification of terrestrial laser scanner (TLS) elevation accuracy in oil palm plantation for IFSAR improvement. IOP Conf. Ser. Earth Environ. Sci. 2016, 37, 012042. [Google Scholar] [CrossRef] [Green Version]
  92. Meng, X.; Currit, N.; Zhao, K. Ground filtering algorithms for airborne LiDAR data: A review of critical issues. Remote Sens. 2010, 2, 833–860. [Google Scholar] [CrossRef] [Green Version]
  93. Zhang, K.; Chen, S.C.; Whitman, D.; Shyu, M.L.; Yan, J.; Zhang, C. A progressive morphological filter for removing nonground measurements from airborne LIDAR data. IEEE Trans. Geosci. Remote Sens. 2003, 41, 872–882. [Google Scholar] [CrossRef] [Green Version]
  94. De Santis, R.; Macchione, F.; Costabile, P.; Costanzo, C. A comparative analysis of 3-D representations of urban flood map in virtual environments for hazard communication purposes. E3S Web Conf. 2018, 40, 8. [Google Scholar] [CrossRef]
  95. Dutta, D.; Teng, J.; Vaze, J.; Lerat, J.; Hughes, J.; Marvanek, S. Storage-based approaches to build floodplain inundation modelling capability in river system models for water resources planning and accounting. J. Hydrol. 2013, 504, 12–28. [Google Scholar] [CrossRef]
  96. Bates, P.D. Integrating remote sensing data with flood inundation models: How far have we got? Hydrol. Process. 2012, 26, 2515–2521. [Google Scholar] [CrossRef]
  97. Abucay, E.R.; Tseng, Y.-H. Assessing landscape visibility using LiDAR, SAR DEM and globally available elevation data: The case of Bongabong, Oriental Mindoro, Philippines. In Proceedings of the 40th Asian Conference on Remote Sensing: Progress of Remote Sensing Technology for Smart Future, Daejeon, Korea, 14–18 October 2019. [Google Scholar]
  98. Podhoranyi, M.; Fedorcak, D. Inaccuracy introduced by LiDAR-generated cross sections and its impact on 1D hydrodynamic simulations. Environ. Earth Sci. 2014, 73, 1–11. [Google Scholar] [CrossRef]
  99. Muhadi, N.A.; Mohd Kassim, M.S.; Abdullah, A.F. Improvement of Digital Elevation Model (DEM) using data fusion technique for oil palm replanting phase. Int. J. Image Data Fusion 2019, 10, 232–243. [Google Scholar] [CrossRef]
Figure 1. Light detection and ranging (LiDAR) survey data acquisition.
Remotesensing 12 02308 g001
Figure 2. The number of papers that discussed on LiDAR and flood applications by year in the Scopus database.
Remotesensing 12 02308 g002
Figure 3. A comparison of flood extent derived from LiDAR and the Advanced Spaceborne Thermal Emission and Reflection Radiometer Global Digital Elevation Model (ASTER GDEM) according to water level [71].
Remotesensing 12 02308 g003
Figure 4. Comparison of flood extent and flood depth obtained from flood model simulation: (a) original DEM; (b) corrected DEM; (c) reference DEM [77].
Remotesensing 12 02308 g004
Figure 5. Flood hazard map based on flood depth classification according to the Ministry of Land Infrastructure and Transport (MLIT) [83].
Remotesensing 12 02308 g005

