Technical Note

Whitecap Observations by Microwave Radiometers: With Discussion on Surface Roughness and Foam Contributions

Remote Sensing Division, U. S. Naval Research Laboratory, Washington, DC 20375, USA
Remote Sens. 2020, 12(14), 2277; https://doi.org/10.3390/rs12142277
Submission received: 12 June 2020 / Revised: 10 July 2020 / Accepted: 13 July 2020 / Published: 15 July 2020
(This article belongs to the Special Issue Passive Remote Sensing of Oceanic Whitecaps)

Abstract

:
Ocean surface whitecaps manifest surface wave breaking. Most of the whitecap data reported in the literature are based on optical observations through photographic or video recording. The air in whitecaps modifies the dielectric properties of microwave emissions and scattering. Therefore, whitecap information is intrinsic to microwave signals. This paper discusses a method to retrieve the ocean surface whitecap coverage from microwave radiometer signals.

1. Introduction

Observations of whitecaps have traditionally been conducted with optical sensing using photographs or video recording (e.g., [1,2,3,4,5,6,7,8,9,10,11,12,13,14] and references therein). The risks involved in conducting observation in inclement weather have limited the availability of high wind data. The maximum wind speed in published observations rarely exceeds 25 m/s [5,13,15]. Spaceborne microwave radiometer measurements offer a great opportunity to obtain whitecap information in a much broader range of wind and wave conditions, as well as to expand the geographic coverage throughout the global ocean [16,17,18,19,20,21]. In [21], it is emphasized that two components contribute to the received brightness temperature Tbp: ocean surface roughness and whitecaps; the subscript p refers to polarization, and is either vertical (V) or horizontal (H) in this paper. Quantitative evaluation shows that the roughness term dominates in most situations, and its accurate determination is critical to the retrieval of whitecap information in the microwave radiometer signal. This paper presents a brief description of whitecap retrieval from spaceborne microwave radiometers. The details of retrieving whitecap coverage from microwave radiometer signals have been published in [21]. Section 2 presents a summary of the method and the background theory. Section 3 compares the results derived from microwave sensors with those obtained through conventional approaches, and presents discussions on the surface roughness and foam contributions in the microwave radiometer signal. Section 4 presents conclusions.

2. A Brief Summary of Microwave Radiometry and Whitecap Retrieval

2.1. Theory

Microwave emission from the sea surface is represented by brightness temperature Tbp or emissivity ep=Tbp/Ts, which is brightness temperature normalized by the sea surface temperature Ts. The sea surface emissivity is composed of two terms:
e p = e p 0 + Δ e p
The flat surface (specular) term is given by
e 0 p ( f , θ ) = 1 | R p p ( 0 ) ( f , θ ) | 2
where R p p ( 0 ) is the Fresnel reflection coefficients of p polarization, f is microwave frequency, and θ is incidence angle. The wind contribution is evaluated from the excess emissivity Δ e p = e p e 0 p defined as the difference between the actual measured emissivity ep from wind-roughened sea surface and an ideal flat surface e0p. The excess emissivity is composed of foam and roughness components:
Δ e p = Δ e p f + Δ e p r
The foam component Δepf is defined as the difference between the air-entrained (foamed) specular emissivity e0pf and foamless specular emissivity e0psw, that is,
Δ e p f = e 0 p f e 0 p s w                   = e 0 p ( f , θ , ε e ) e 0 p ( f , θ , ε s w )                   = | R p p ( 0 ) ( f , θ , ε s w ) | 2 | R p p ( 0 ) ( f , θ , ε e ) | 2
where εsw is the (foamless) sea water relative permittivity and εe is an effective relative permittivity of air–water mixture, to be further discussed later. The roughness component is defined by
Δ e p r ( f , θ , ϕ ) = 0 0 2 π S ( k , ϕ ) g p ( f , θ , ϕ , ε , k , ϕ ) k d ϕ d k
where S(k, ϕ) is the surface wave directional spectrum, k is wavenumber, ϕ is azimuth angle with respect to the wind direction, and gp is a weighting function describing the thermal emission contribution of each wavenumber–directional surface wave component. The full expression of gp is given in [22,23,24]. The original gp formulation in [22,23,24] defines ε = ε s w , and whitecaps are not explicitly treated. In [25,26,27], ε = ε e is used to compute the roughness term for the more realistic condition with whitecap presence.
Many different formulations of ε e have been published; see discussions in [28]. A short summary is given in ([27], Appendix B). Based on those analyses, the refractive mixing rule [28,29,30,31] is selected:
ε e = [ F a ε a 1 / 2 + ( 1 F a ) ε s w 1 / 2 ] 2
where ε a = 1 is the relative permittivity of air, and Fa is the effective air volume fraction, which is formulated as a function of the whitecap coverage Wc [21,25,26,27].

2.2. Retrieval Algorithm

The foundation of microwave radiometer wind sensing is built on the observed Δep varying with U10. Indeed, the stepped frequency microwave radiometer (SFMR) has become an indispensable surface wind sensor for tropical cyclone (TC) monitoring [32,33,34,35,36,37,38]. The relation can be expressed symbolically as
Δ e p = f ( U 10 )
Following the analysis given in Section 2.1, the wind effect on the excessive emissivity is contributed by two major components: roughness and whitecaps. The roughness term is evaluated with (5), for which the wave spectrum S(k, ϕ) is a critical factor [21,27]. The whitecap term is evaluated by (4) with Wc embedded in the effective permittivity εe (6) through Fa. Both surface wave spectrum and whitecaps are determined by the ocean surface wind stress, which is proportional to the square of wind friction velocity u * . Thus, (7) can be expanded as
Δ e p = f [ S ( k , ϕ ) , W c , u * ; U 10 ]
The forward computation to evaluate Δep with U10 as the only atmospheric/oceanographic input requires the implementation of wave spectrum, wind stress, and whitecap coverage models in the computation process. There are many different wind speed functions of S(k, ϕ), u*, and Wc in published literature. Microwave remote sensing measurements have been an important source of data for their analyses. The determination of S(k, ϕ)—especially for short scale waves—is a complicated problem, and active radar data provide more direct connection with the surface wave spectrum. The passive microwave radiometer data can be used to assist in the validation and verification effort. The details are discussed in [21,27] and the references cited in those studies; they are not repeated here. On the other hand, the large volume of microwave radiometer measurements can be used to optimize the choice of whitecap coverage and surface wind stress models. The analyses presented in [21,27] lead to the selection of the following wind relationship for the whitecap coverage, which is introduced in [25] and established on the whitecap measurements of [11]:
W c = { 0 , u * 0.11   m / s 0.30 ( u * 0.11 ) 3 , 0.11 < u * 0.40   m / s 0.07 u * 2.5 , u * > 0.40   m / s
The whitecap formula (9) is given as a function of wind friction velocity u * , so a drag coefficient C10 formula is needed when U10 is the input. The C10 formula is derived from microwave radiometer data in TC wind conditions [19,21,27]:
C 10 = { 10 4 ( - 0.0160 U 10 2 + 0.967 U 10 + 8.058 ) , U 10 35   m / s 2 . 23 × 10 - 3 ( U 10 / 35 ) 1 , U 10 > 35   m / s
Figure 1 shows four examples of comparing microwave thermal emission computations with field observations of Δep. The SFMR and three frequencies of WindSat are illustrated here. Detail and more extensive comparisons are given in [21].
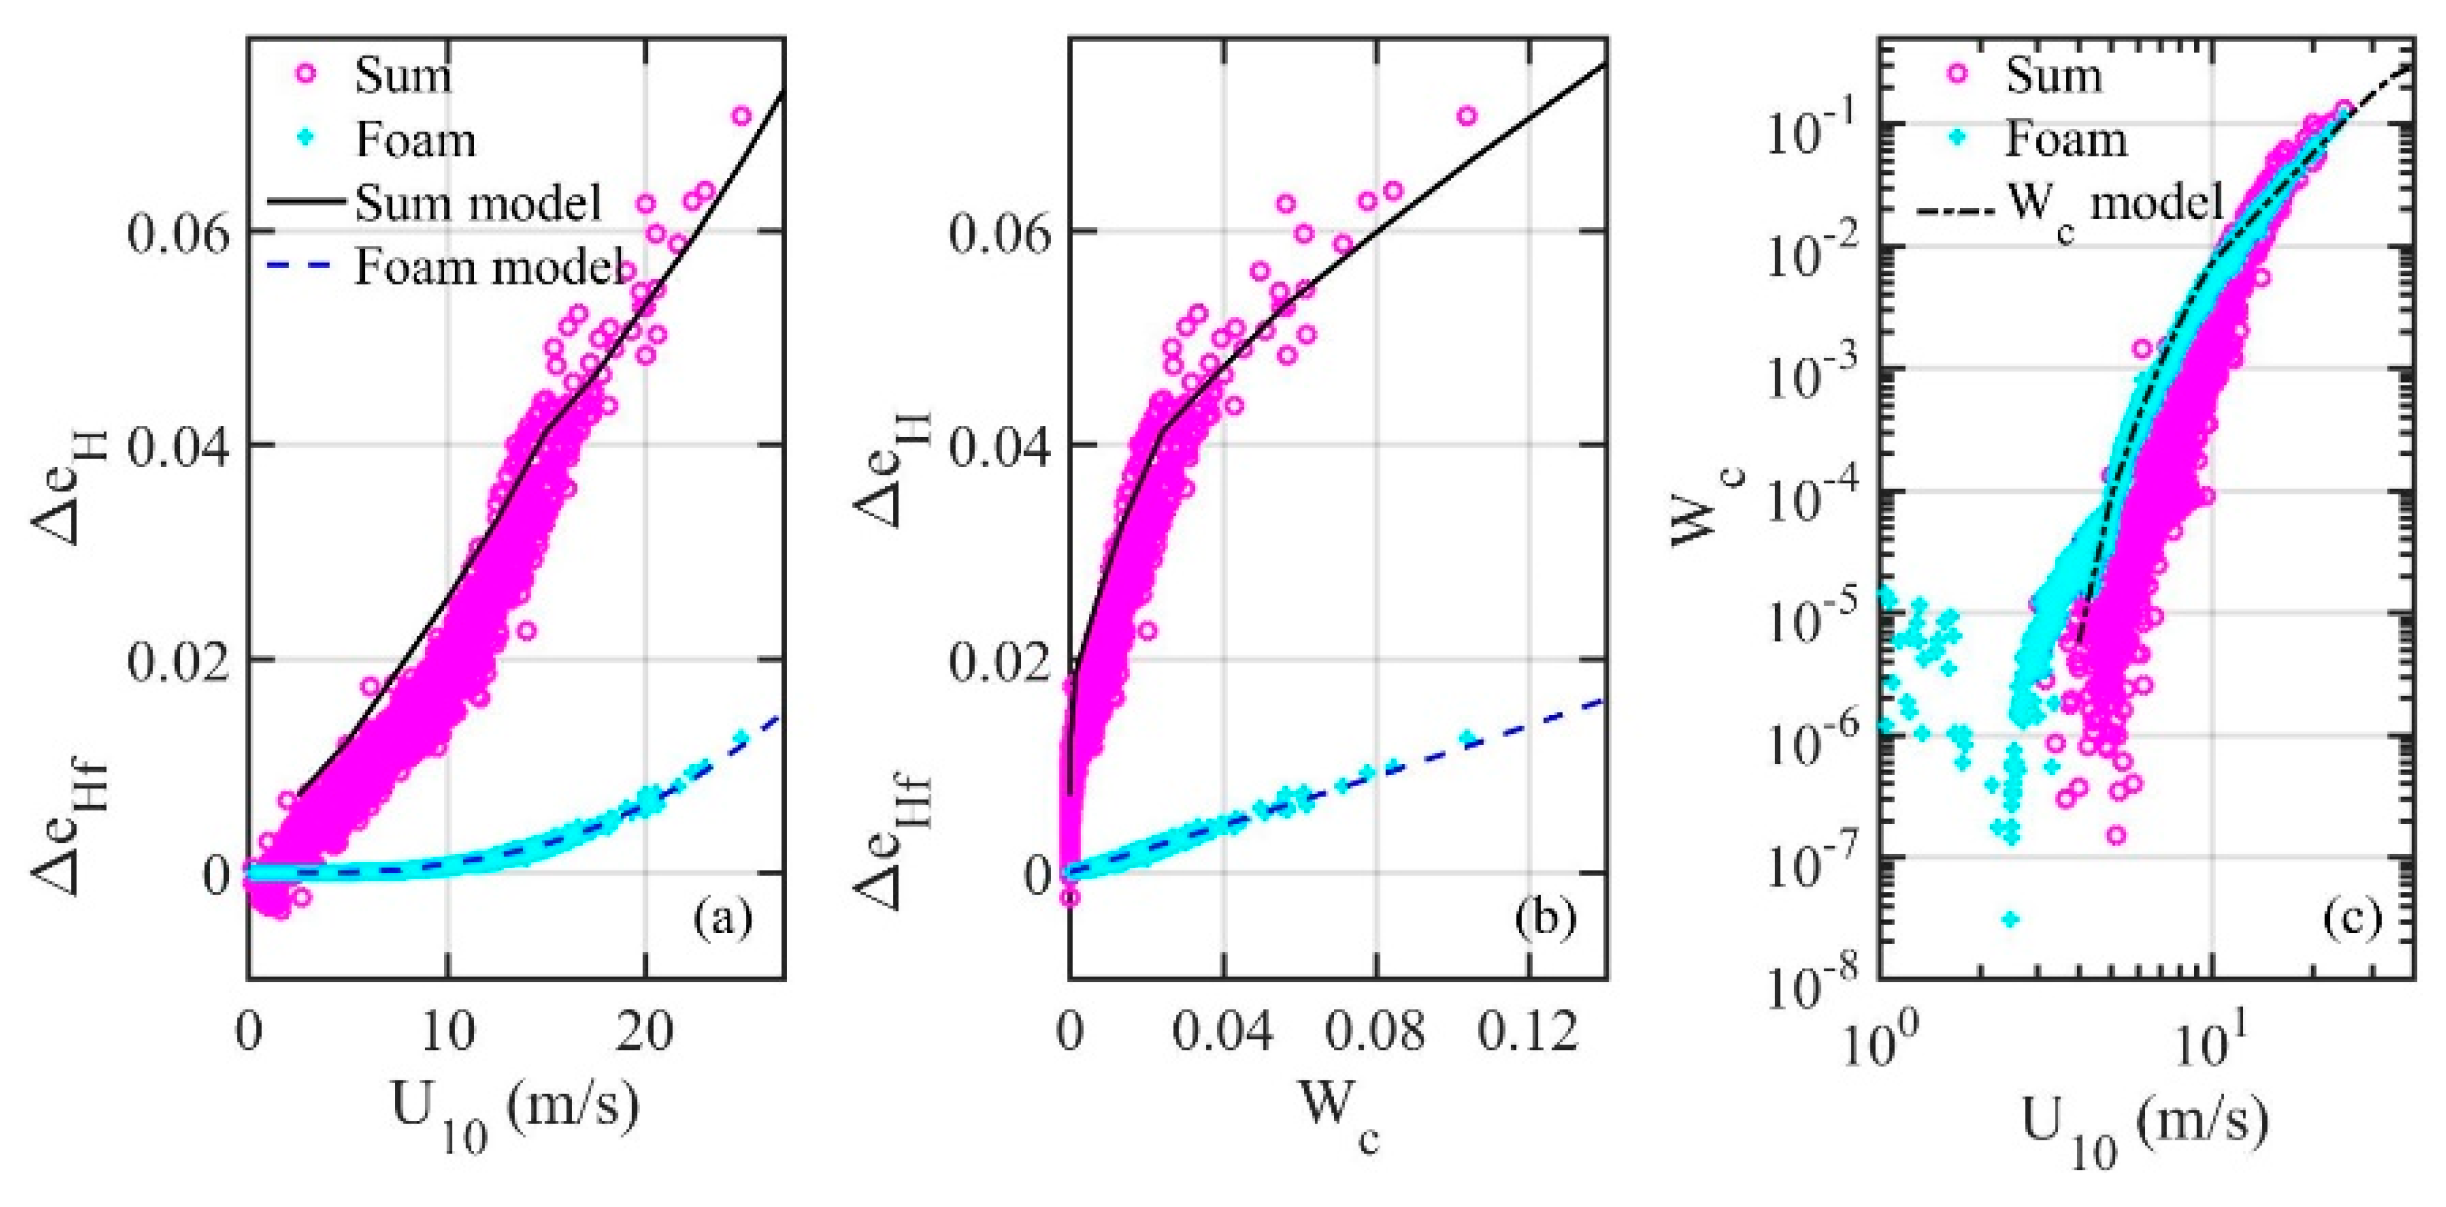
The Δep is presently used for retrieving U10 (7). As indicated by (8), it also contains information related to whitecaps, surface wind stress, and surface roughness. A procedure to use the pre-calculated solutions of Δep(U10, Wc, u*) for retrieving Wc and u* from Δep in addition to U10 is described in [21]. Figure 2 illustrates the procedure for Wc retrieval. The WindSat 6.8 GHz H polarization data are used as an example; there are 500 (U10, ΔeH) data pairs, and the maximum wind speed is 24.8 m/s. Figure 2a shows Δep(U10) and Δepf(U10); the data are shown with magenta circles and cyan crosses, and the analytical solutions are illustrated with black solid and dashed lines. The same data can be presented as Δep(Wc) and Δepf(Wc) in Figure 2b. The model solutions can then be used to obtain Wc from Δep or Δepf; and the derived Wc can be subsequently presented as functions of wind speed, as shown in Figure 2c, in which the Wc(U10) model curve (9–10) is illustrated with a black dashed-dotted line. Clearly, the results of Wc(U10) obtained with Δepf are in better agreement with the model curve and with less data scatter in comparison to those derived from Δep. Radiometer measurements from many SFMR, WindSat, SMAP, and SMOS missions in a wide range of frequency (1.4 to 37 GHz) and incidence angle (SFMR: 0°, SMAP: 40°, SMOS: 0° to 65°, and WindSat: ~53°) are assembled to optimize various parameters in the whitecap retrieval procedure. The maximum wind speed in the collection exceeds 90 m/s; details are given in [21].

3. Results and Discussion

3.1. Whitecap Coverage Retrieved from Microwave Radiometers

From the discussion presented in Section 2, it becomes clear that the whitecap coverage can be retrieved from the Δep(U10) data, such as those given in Figure 1. Many datasets from SFMR, WindSat, SMAP, and SMOS missions are analyzed in [21], a large portion of the data is collected in TCs, and the maximum wind speed in the collection exceeds 90 m/s. The retrieval procedure uses the foam component Δepf(U10), through the method presented in the discussion of Figure 2.
Figure 3 summarizes the results from all microwave sensors (green crosses). For comparison, measurements from conventional optical approaches reported in [2,3,4,5,7,8,9,10,11] are shown with magenta plus signs. The whitecap coverage model, (9–10), is shown with the black solid line.
The whitecap model (9) specifies that U10 = 3.3 m/s (u* = 0.11 m/s) is the minimum wind speed for whitecap appearance. Non-zero whitecap coverages are found in optical observations as well as in the retrieved results from microwave radiometers; the magnitude, however, is generally smaller than 10–4. For U10 < 25 m/s, the Wc derived from microwave radiometers is similar to that obtained by optical methods, and the data scatter in the radiometer dataset is much smaller. Most significantly, the wind speed coverage of whitecap databases expands considerably by incorporating the microwave radiometer results, from about 25 m/s to 90 m/s.

3.2. Foam and Roughness Contributions

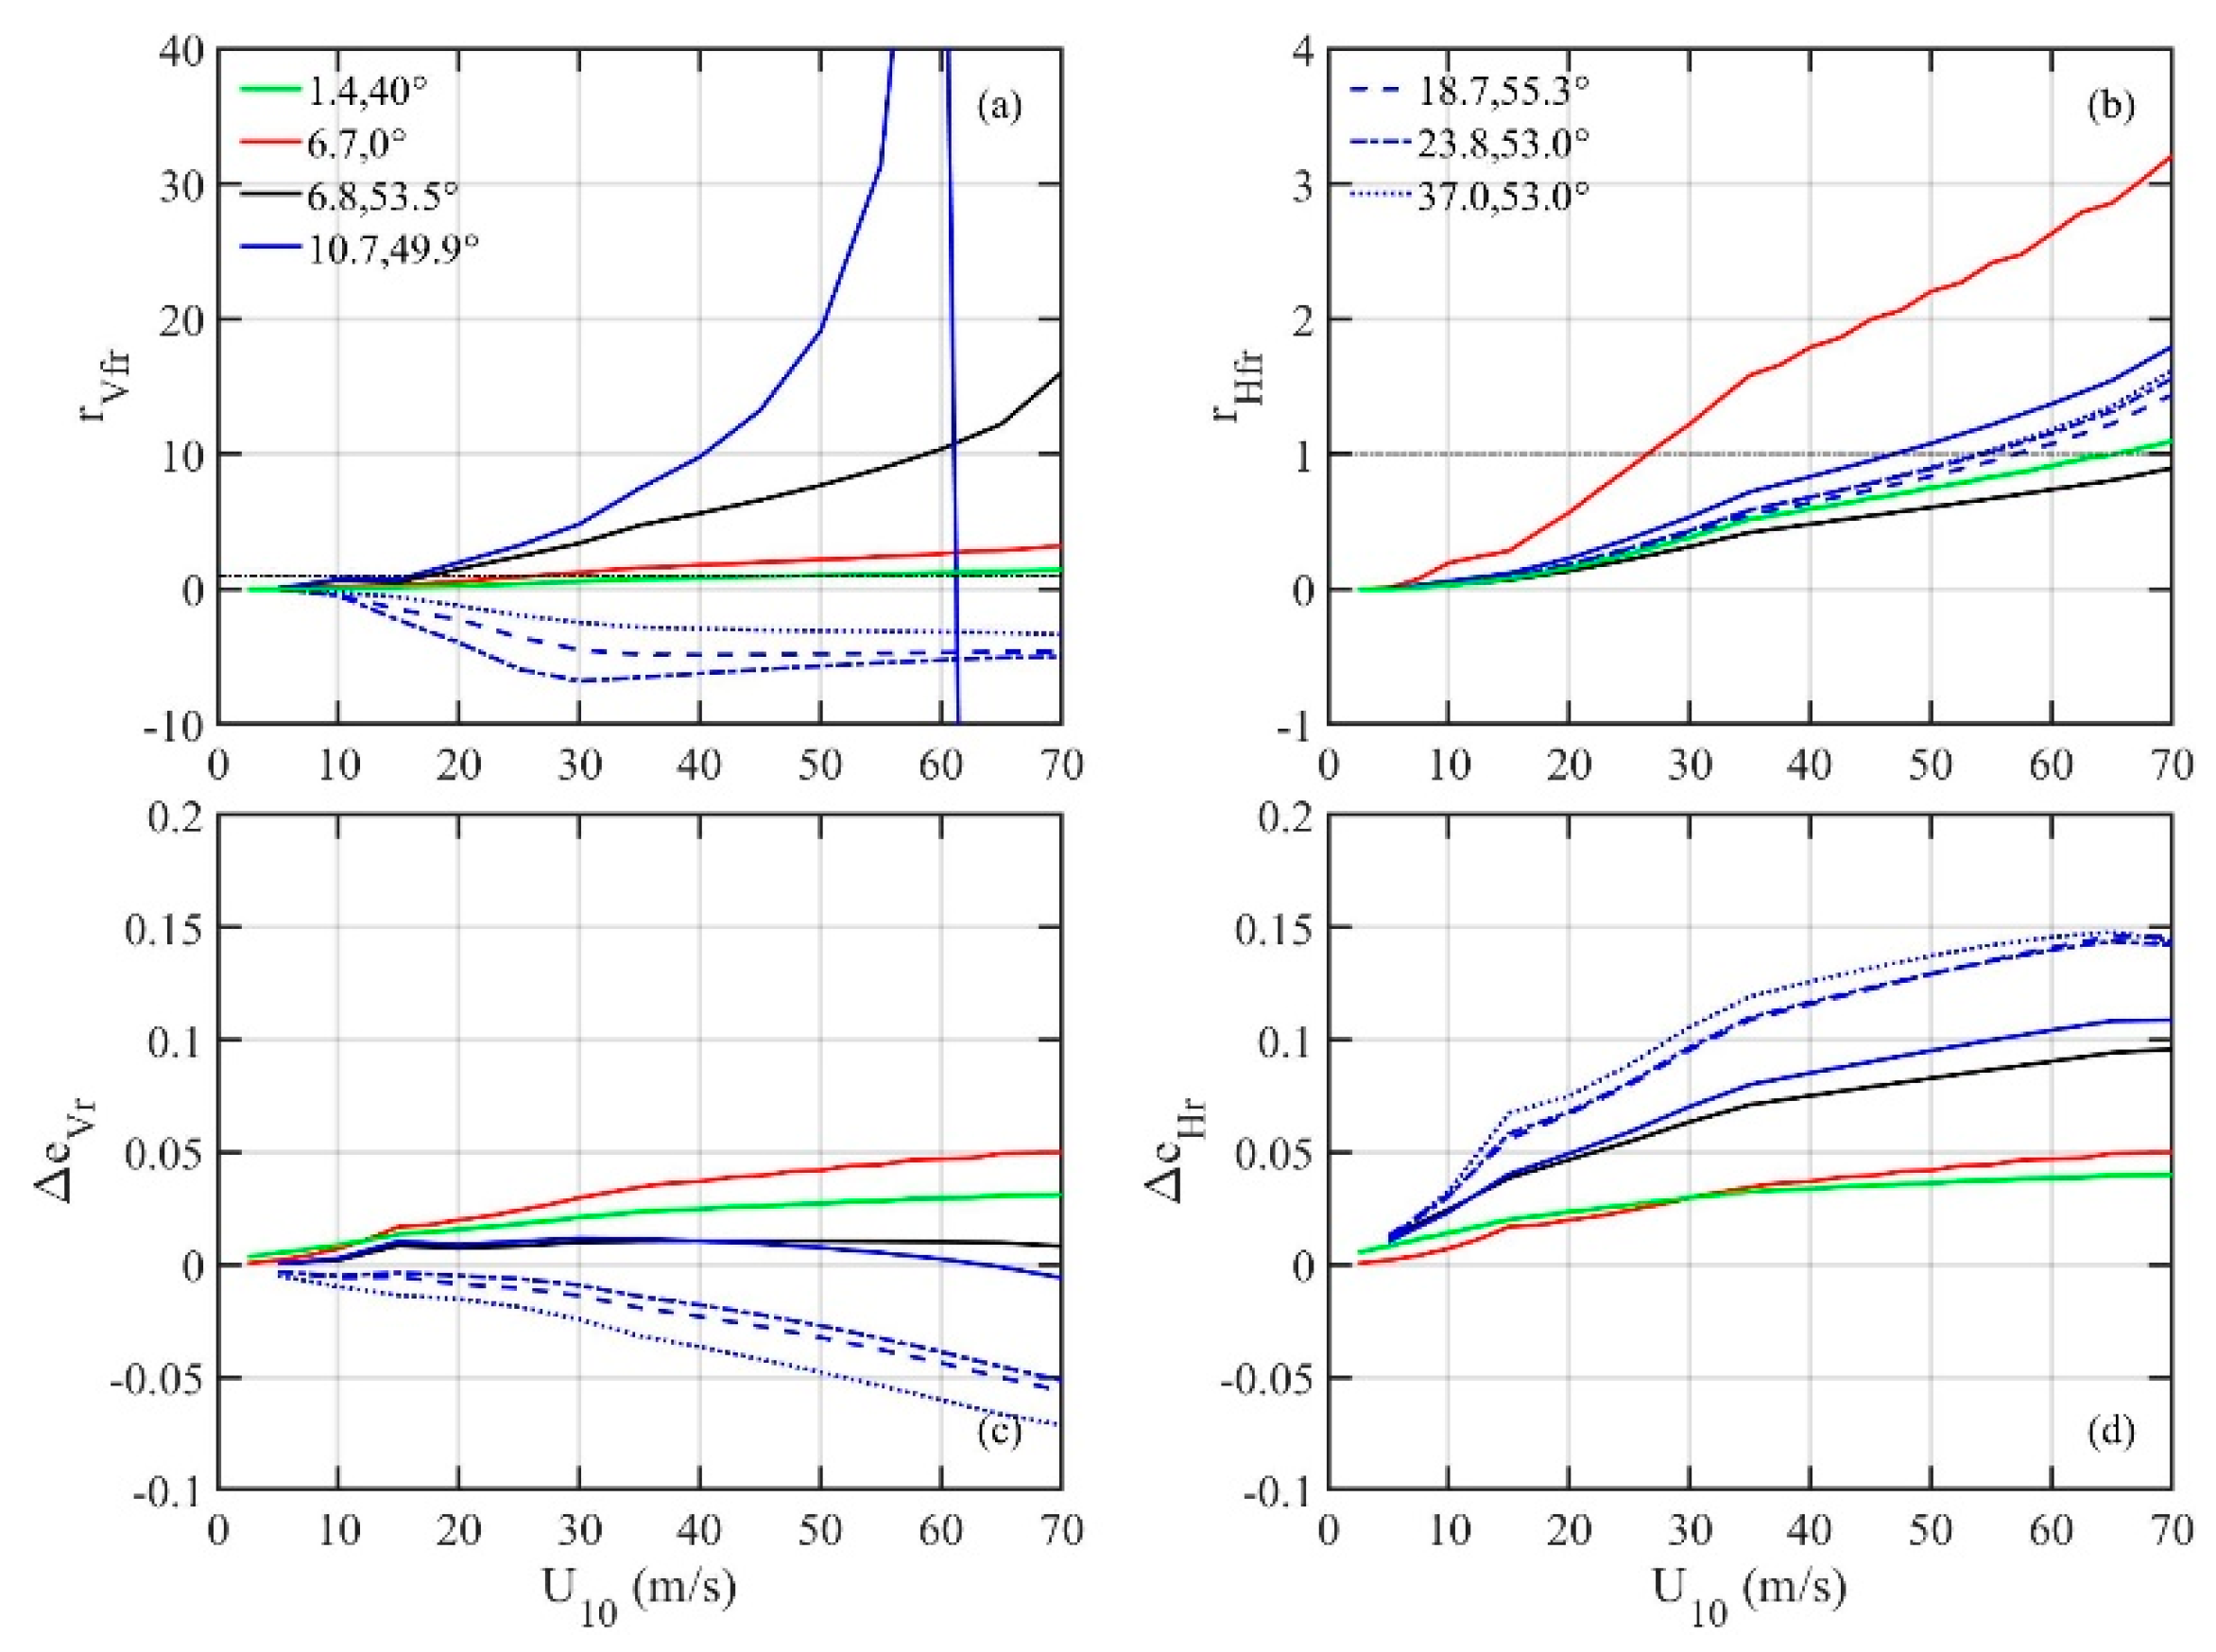
The sum, foam, and roughness components, respectively Δep, Δepf, and Δepr, can be obtained from the analytical electromagnetic (EM) model (black, red, and blue curves in Figure 1). Figure 4a,b shows the foam-to-roughness ratio rpfrepfepr for vertical and horizontal polarizations. Note that the range of the vertical scale is 10 times larger in the plot of vertical polarization in Figure 4a, than that of the horizontal polarization in Figure 4b. The roughness contributions of the vertical polarization for 10.7, 18.8, 23.0, and 37.0 GHz of WindSat near 53° are partially or wholly negative, as shown by the examples in Figure 4c,d; therefore, the vertical polarization foam-to-roughness ratios rVfr are partially or wholly negative for those four frequencies, as shown in Figure 4a. In contrast, the foam and roughness components of the horizontal polarization are all positive. For convenience, the roughness components of the excess emissivity of vertical and horizontal polarizations of the five WindSat frequencies are shown in Figure 4c,d, respectively.
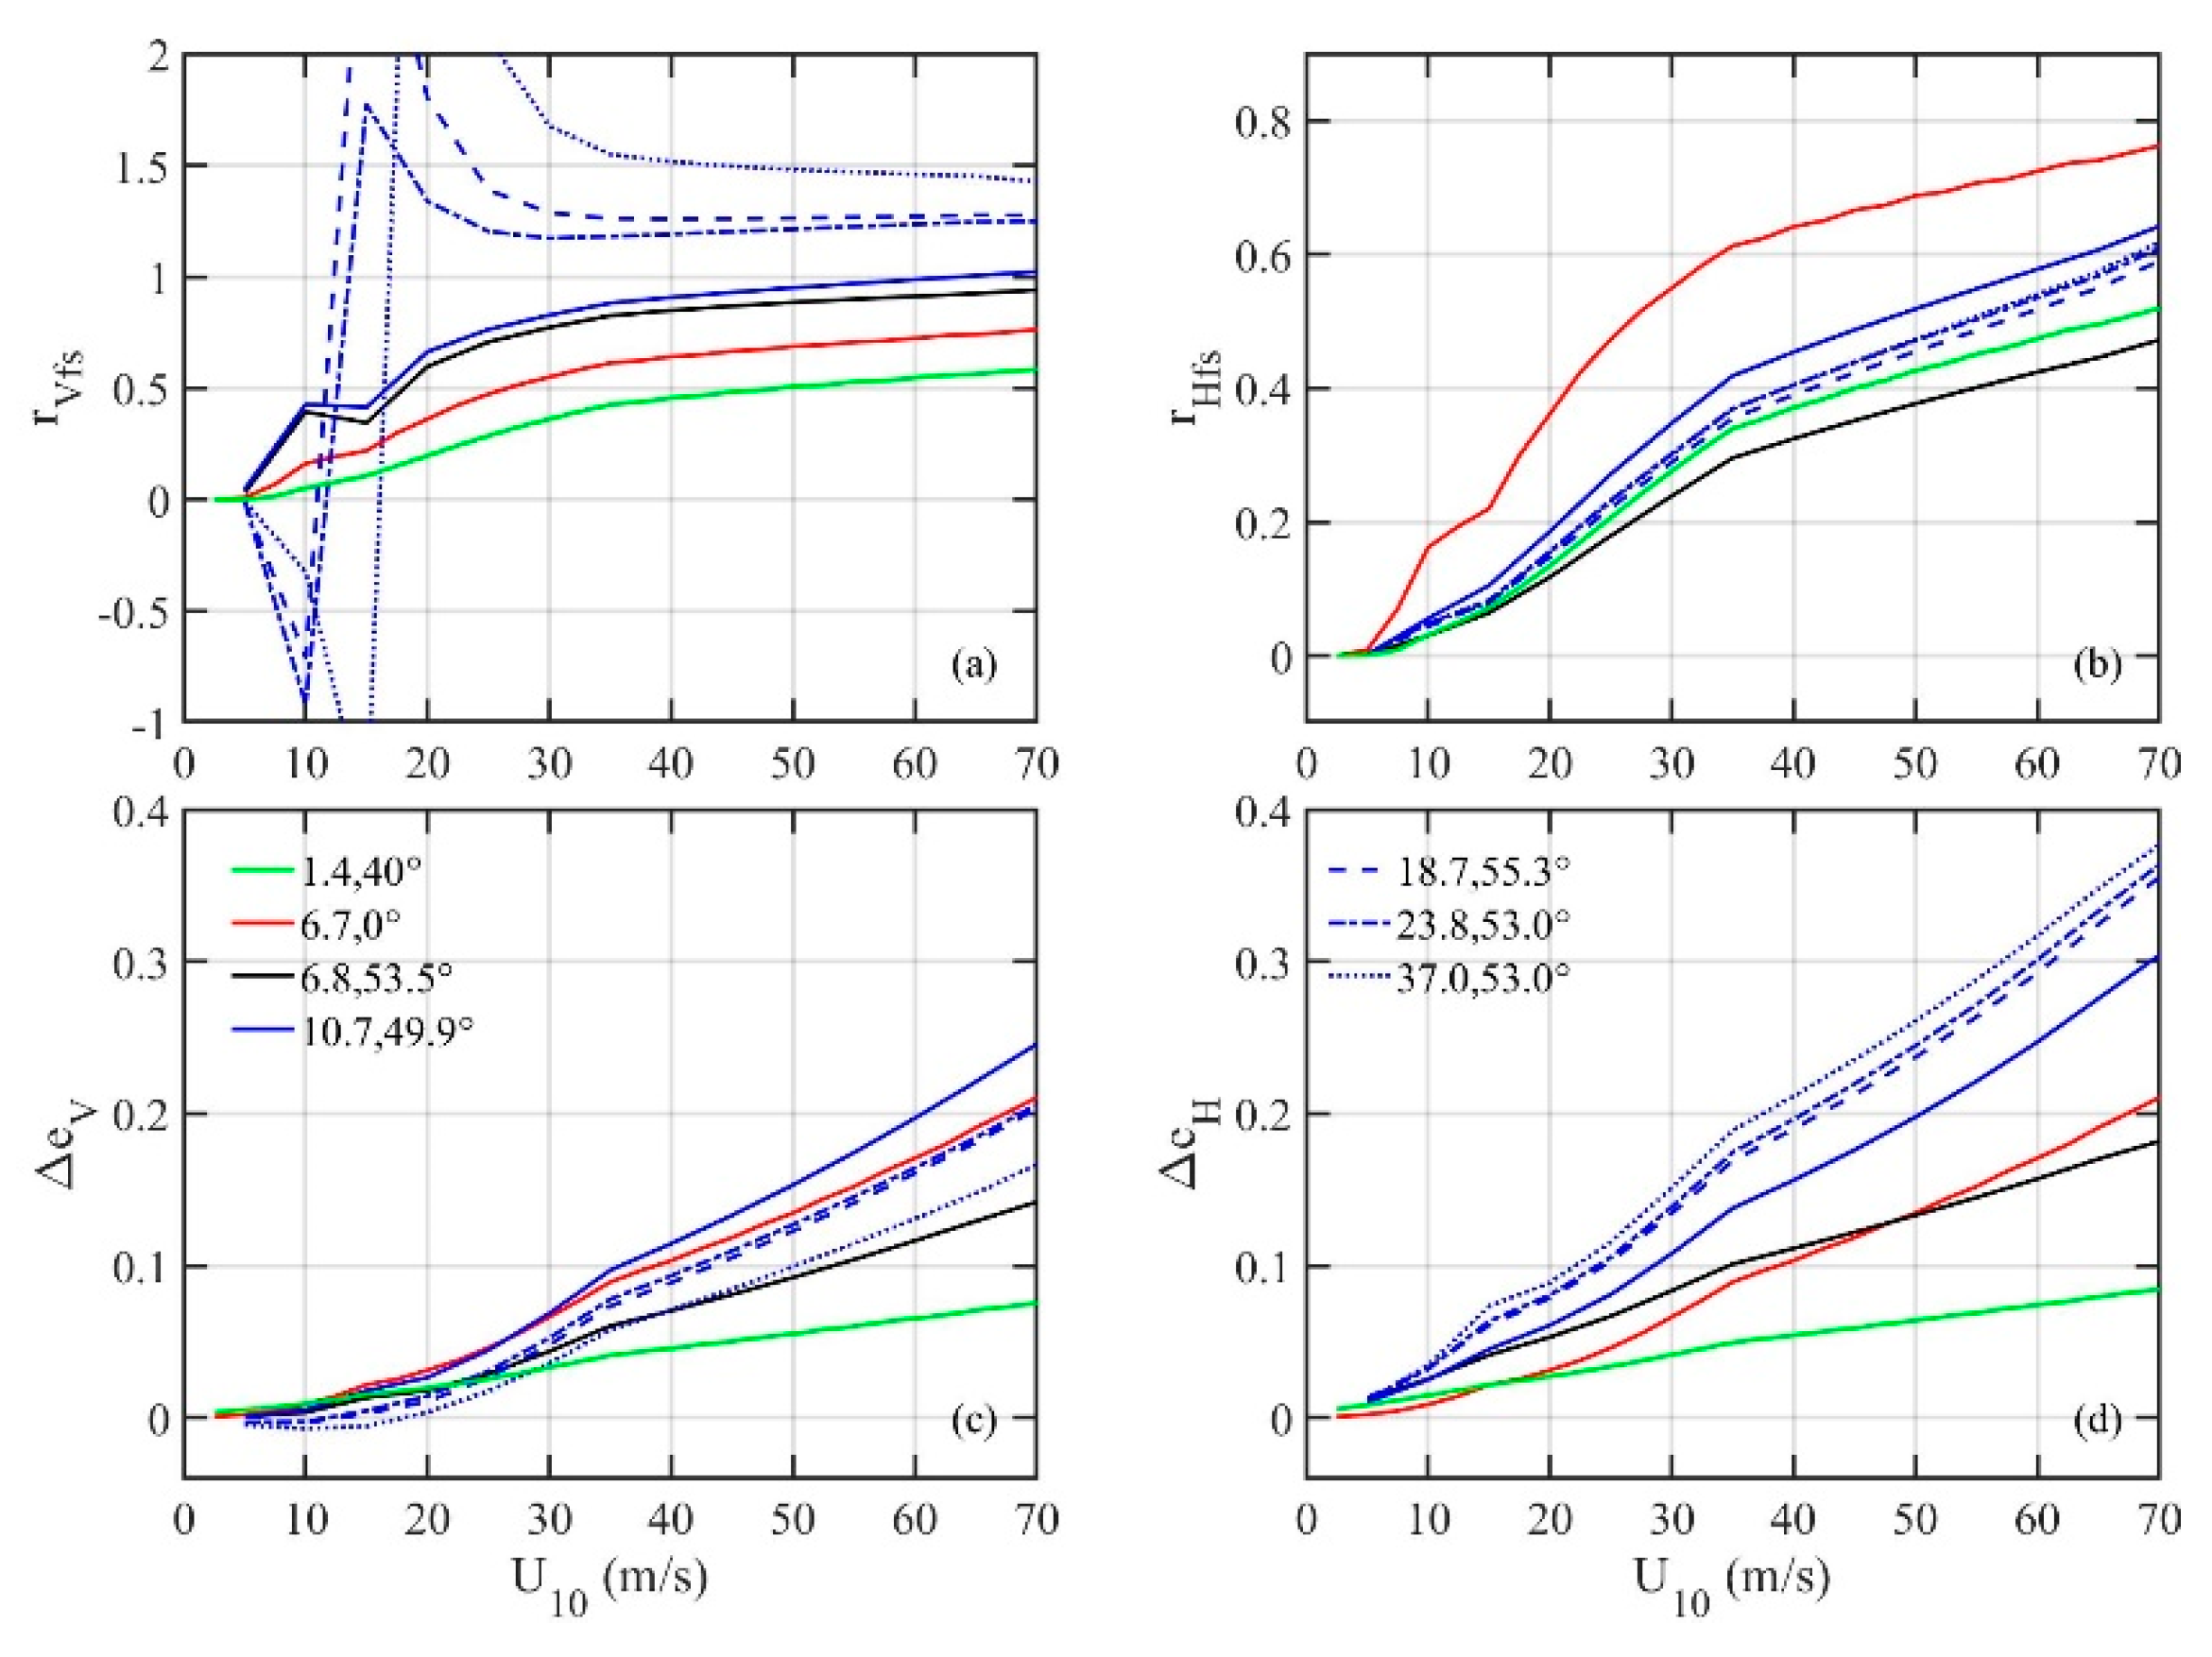
The vertical roughness component Δepr transitions from positive to negative near Brewster’s angle. This is an important practical consideration in the present design of whitecap retrieval algorithm. The algorithm uses the analytical foam-to-sum ratio rpfsepfep to obtain the foam component of the observed excess emissivity Δepf. Figure 5 shows the analytical solutions of rpfs and Δep for both horizontal and vertical polarizations. For the vertical polarization, rVfs for 18.8, 23.0, and 37.0 GHz near 53° flips from negative to positive in the wind speed range below about 20 m/s. This behavior becomes problematic during the whitecap retrieval step and produces negative whitecap coverage. For this reason, for WindSat measurements collected near 53° earth incidence angle (EIA) only the horizontal polarization data are used for whitecap retrieval. For L band (~1.4 GHz), the Brewster angle moves to about 70° [27,39,40,41,42,43]. Data from both polarizations in the collected L-band measurements can be used for whitecap retrieval, including those from SMAP at 40° and SMOS covering 0° to 65° EIA.

4. Conclusions

Whitecap contribution is an important element in the microwave radiometer signal. There are many published datasets offering the opportunity to obtain the whitecap information in global oceans and under extreme wind conditions. Two major components, roughness (surface waves) and foam (whitecaps), contribute to the microwave radiometer signal from the ocean surface. The roughness component is the dominant one over a wide range of wind speeds, so retrieving whitecap information from microwave radiometer measurements requires an accurate accounting of the surface roughness contribution. An algorithm is described for whitecap retrieval from microwave systems, including SFMR, WindSat, SMAP, and SMOS. Many of the assembled data are collected in TCs, with the maximum wind speed exceeding 90 m/s. In the wind speed range below 25 m/s, whitecap coverages derived from microwave radiometers are similar to those obtained by optical methods, and the data scatter of the radiometer datesets is much smaller. Incorporating the microwave radiometer results expands the wind speed coverage range of whitecap databases from about 25 to 90 m/s.

Funding

This work is sponsored by the Office of Naval Research (Funding Doc. No. N0001416WX00044).

Acknowledgments

This is NRL Publication Number JA/7260—20–0590.

Conflicts of Interest

The author declares no conflict of interest. The funders had no role in the design of the study; in the collection, analyses, or interpretation of data; in the writing of the manuscript; or in the decision to publish the results.

References

  1. Monahan, E.C. Fresh water whitecaps. J. Atmos. Sci. 1969, 26, 1026–1029. [Google Scholar] [CrossRef] [Green Version]
  2. Monahan, E.C. Oceanic whitecaps. J. Phys. Oceanogr. 1971, 1, 139–144. [Google Scholar] [CrossRef]
  3. Toba, Y.; Chaen, M. Quantitative expression of the breaking of wind waves on the sea surface. Rec. Oceanogr. Works Jpn. 1973, 12, 1–11. [Google Scholar]
  4. Ross, D.B.; Cardone, V. Observations of oceanic whitecaps and their relation to remote measurements of surface wind stress. J. Geophys. Res. 1974, 79, 444–452. [Google Scholar] [CrossRef]
  5. Black, P.; Burpee, R.W.; Dorst, N.M.; Adams, W.L. Appearance of the sea surface in tropical cyclones. Weather Forecast. 1986, 1, 102–107. [Google Scholar] [CrossRef]
  6. Walker, R.E. Marine Light Field Statistics; John Wiley: Hoboken, NJ, USA, 1994; 675p. [Google Scholar]
  7. Xu, D.; Liu, X.; Yu, D. Probability of wave breaking and whitecap coverage in a fetch-limited sea. J. Geophys. Res. 2000, 105, 14253–14259. [Google Scholar] [CrossRef]
  8. Lafon, C.; Piazzola, J.; Forget, P.; Le Calve, O.; Despiau, S. Analysis of the variations of the whitecap fraction as measured in a coastal zone. Bound. Layer Meteorol. 2004, 111, 339–360. [Google Scholar] [CrossRef]
  9. Lafon, C.; Piazzola, J.; Forget, P.; Despiau, S. Whitecap coverage in coastal environment for steady and unsteady wave field conditions. J. Mar. Syst. 2007, 66, 38–46. [Google Scholar] [CrossRef]
  10. Sugihara, Y.; Tsumori, H.; Ohga, T.; Yoshioka, H.; Serizawa, S. Variation of whitecap coverage with wave-field conditions. J. Mar. Syst. 2007, 66, 47–60. [Google Scholar] [CrossRef]
  11. Callaghan, A.H.; de Leeuw, G.; Cohen, L.H.; O’Dowd, C.D. The relationship of oceanic whitecap coverage to wind speed and wind history. Geophys. Res. Lett. 2008, 35, L23609. [Google Scholar] [CrossRef] [Green Version]
  12. Kleiss, J.M.; Melville, W.K. The analysis of sea surface imagery for whitecap kinematics. J. Atmos. Ocean. Technol. 2011, 28, 219–243. [Google Scholar] [CrossRef]
  13. Holthuijsen, L.H.; Powell, M.D.; Pietrzak, J.D. Wind and waves in extreme hurricanes. J. Geophys. Res. 2012, 117, C09003. [Google Scholar] [CrossRef] [Green Version]
  14. Brumer, S.E.; Zappa, C.J.; Brooks, I.M.; Tamura, H.; Brown, S.M.; Blomquist, B.W.; Fairall, C.W.; Cifuentes-Lorenzen, A. Whitecap coverage dependence on wind and wave statistics as observed during SO GasEx and HiWinGS. J. Phys. Oceanogr. 2017, 47, 2211–2235. [Google Scholar] [CrossRef]
  15. Weather Squadron Two. Wind Estimations from Aerial Observations of Sea Conditions; NAS Jacksonville Florida: 1952. Available online: http://www.aoml.noaa.gov/hrd/hurdat/seastate-aircraft.pdf (accessed on 23 January 2019).
  16. Pandey, P.; Kakar, R. An empirical microwave emissivity model for a foam-covered sea. J. Ocean. Eng. 1982, 7, 135–140. [Google Scholar] [CrossRef]
  17. Wentz, F.J. A model function for ocean microwave brightness temperatures. J. Geophys. Res. 1983, 88, 1892–1908. [Google Scholar] [CrossRef]
  18. Anguelova, M.D.; Webster, F. Whitecap coverage from satellite measurements: A first step toward modeling the variability of oceanic whitecaps. J. Geophys. Res. 2006, 111, C03017. [Google Scholar] [CrossRef] [Green Version]
  19. Hwang, P.A. High wind drag coefficient and whitecap coverage derived from microwave radiometer observations in tropical cyclones. J. Phys. Oceanogr. 2018, 48, 2221–2232. [Google Scholar] [CrossRef]
  20. Anguelova, M.D.; Bettenhausen, M.H. Whitecap fraction from satellite measurements: Algorithm description. J. Geophys. Res. 2019, 124, 1827–1857. [Google Scholar] [CrossRef]
  21. Hwang, P.A.; Reul, N.; Meissner, T.; Yueh, S.H. Whitecap and wind stress observations by microwave radiometers: Global coverage and extreme conditions. J. Phys. Oceanogr. 2019, 49, 2291–2307. [Google Scholar] [CrossRef]
  22. Yueh, S.H.; Tang, W.; Fore, A.G.; Neumann, G.; Hayashi, A.; Freedman, A.; Chaubell, J.; Lagerloef, G.S.E. L-band passive and active microwave geophysical model functions of ocean surface winds and applications to Aquarius retrieval. IEEE Trans. Geosci. Remote Sens. 2013, 51, 4619–4632. [Google Scholar] [CrossRef]
  23. Yueh, S.H.; Fore, A.G.; Tang, W.; Hayashi, A.; Stiles, B.; Reul, N.; Weng, Y.; Zhang, F. SMAP L-band passive microwave observations of ocean surface wind during severe storms. IEEE Trans. Geosci. Remote Sens. 2016, 54, 7339–7350. [Google Scholar] [CrossRef]
  24. Johnson, J.T.; Zhang, M. Theoretical study of the small slope approximation for ocean polarimetric thermal emission. IEEE Trans. Geosci. Remote Sens. 1999, 37, 2305–2316. [Google Scholar] [CrossRef]
  25. Hwang, P.A. Foam and roughness effects on passive microwave remote sensing of the ocean. IEEE Trans. Geosci. Remote Sens. 2012, 50, 2978–2985. [Google Scholar] [CrossRef]
  26. Hwang, P.A. Surface foam and L-band microwave radiometer measurements in high winds. IEEE Trans. Geosci. Remote Sens. 2019, 57, 2766–2776. [Google Scholar] [CrossRef]
  27. Hwang, P.A.; Reul, N.; Meissner, T.; Yueh, S.H. Ocean surface foam and microwave emission: Dependence on frequency and incidence angle. IEEE Trans. Geosci. Remote Sens. 2019, 57, 2766–2776. [Google Scholar] [CrossRef]
  28. Anguelova, M.D. Complex dielectric constant of sea foam at microwave frequencies. J. Geophys. Res. 2008, 113, C08001. [Google Scholar] [CrossRef] [Green Version]
  29. Birchak, J.R.; Gardner, L.G.; Hipp, J.W.; Victor, J.M. High dielectric constant microwave probes for sensing soil moisture. Proc. IEEE 1974, 62, 93–98. [Google Scholar] [CrossRef]
  30. Sihvola, A.H. Mixing rules with complex dielectric coefficients. Subsurf. Sens. Technol. Appl. 2000, 1, 393–415. [Google Scholar] [CrossRef]
  31. Sihvola, A.H.; Kong, J.A. Effective permittivity of dielectric mixtures. IEEE Trans. Geosci. Remote Sens. 1988, 26, 420–429. [Google Scholar] [CrossRef]
  32. Jones, W.L.; Black, P.G.; Delnore, V.E.; Swift, C.T. Airborne Microwave Remote–Sensing Measurements of Hurricane Allen. Science 1981, 214, 274–280. [Google Scholar] [CrossRef]
  33. Swift, C.T.; DeHority, D.C.; Black, P.G.; Chein, J.-Z. Microwave remote sensing of ocean surface wind speed and rain rates over tropical storms. In Frontiers of Remote Sensing of the Oceans and Troposphere from Air and Space Platforms. Proceedings of the URSI Commission F Symposium and Workshop; NASA Conference Publication; NASA: Washington, DC, USA, 1984; Volume 2303, pp. 281–286. [Google Scholar]
  34. Uhlhorn, E.W.; Black, P.G. Verification of remotely sensed sea surface winds in hurricanes. J. Atmos. Ocean. Technol. 2003, 20, 99–116. [Google Scholar] [CrossRef]
  35. Klotz, B.W.; Uhlhorn, E.W. Improved Stepped Frequency Microwave Radiometer tropical cyclone surface winds in heavy precipitation. J. Atmos. Ocean. Technol. 2014, 31, 2392–2408. [Google Scholar] [CrossRef]
  36. Sapp, J.W.; Alsweiss, S.O.; Jelenak, A.; Chang, P.S.; Carswell, J. Stepped frequency microwave radiometer wind-speed retrieval improvements. Remote Sens. 2019, 11, 214. [Google Scholar] [CrossRef] [Green Version]
  37. Meissner, T.; Wentz, F.J. Wind-vector retrievals under rain with passive satellite microwave radiometers. IEEE Trans. Geosci. Remote Sens. 2009, 47, 3065–3083. [Google Scholar] [CrossRef]
  38. Meissner, T.; Ricciardulli, L.; Wentz, F. Capability of the SMAP mission to measure ocean surface winds in storms. Bull. Am. Meteorol. Soc. 2017, 98, 1660–1677. [Google Scholar] [CrossRef]
  39. Reul, N.; Chapron, B.; Zabolotskikh, E.; Donlon, C.; Quilfen, Y.; Guimbard, S.; Piolle, J.F. A revised L-band radio-brightness sensitivity to extreme winds under tropical cyclones: The five year SMOS-storm database. Remote Sens. Environ. 2016, 180, 274–291. [Google Scholar] [CrossRef] [Green Version]
  40. Reul, N.; Tenerelli, J.; Chapron, B.; Vandemark, D.; Quilfen, Y.; Kerr, Y. SMOS satellite L-band radiometer: A new capability for ocean surface remote sensing in hurricanes. J. Geophys. Res. 2012, 117, C02006. [Google Scholar] [CrossRef] [Green Version]
  41. Powell, M.D.; Houston, S.H.; Amat, L.R.; Morisseau-Leroy, N. The HRD real-time hurricane wind analysis system. J. Wind Eng. Ind. Aerodyn. 1998, 77, 53–64. [Google Scholar] [CrossRef]
  42. Hollinger, J.P. Passive microwave measurements of sea surface roughness. IEEE Trans. Geosci. Electron. 1971, 9, 165–169. [Google Scholar] [CrossRef]
  43. Yueh, S.H.; Dinardo, S.J.; Fore, A.G.; Li, F.K. Passive and active L-band microwave observations and modeling of ocean surface winds. IEEE Trans. Geosci. Remote Sens. 2010, 48, 3087–3100. [Google Scholar] [CrossRef]
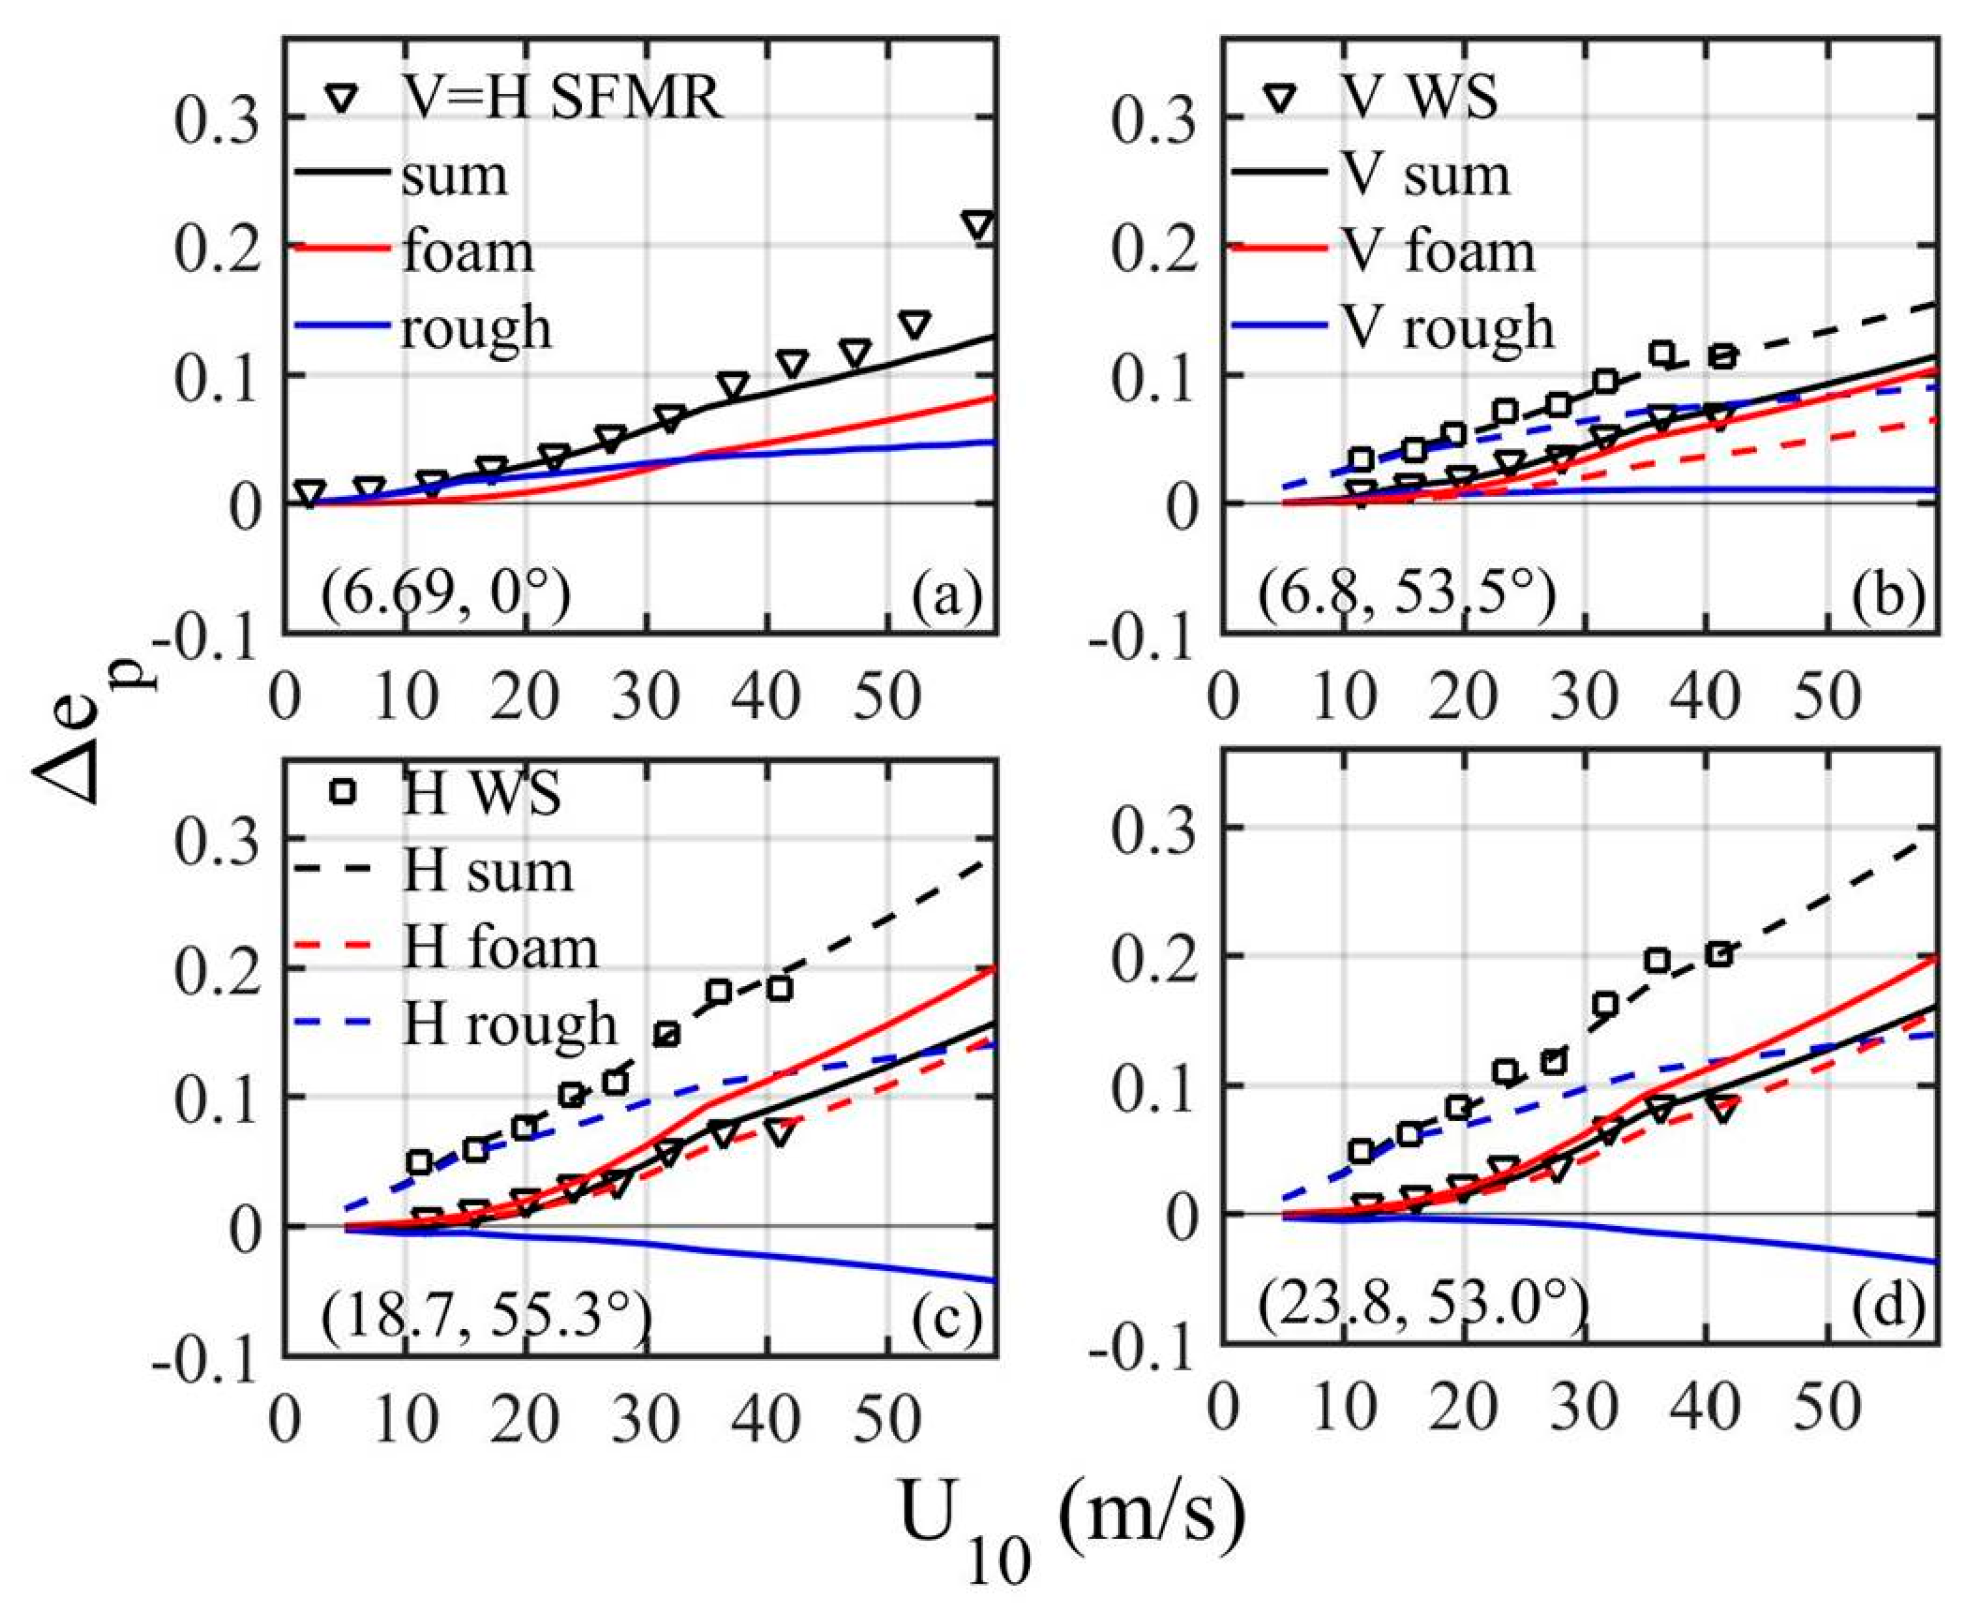
Figure 1. Calculated ΔeH and ΔeH at various microwave frequencies and incidence angles, and comparison with field data: (a) 6.69 GHz SRMR, (b) 6.8 GHz WindSat, (c) 18.7 GHz WindSat, and (d) 23.8 GHz WindSat. Sum, foam and roughness contributions are given by black, red and blue curves, solid and dashed lines show vertical and horizontal polarizations, respectively; the two numbers in parentheses are frequency (in GHz) and earth incidence angle (EIA). Reproducing part of ([21], Figure 1).
Remotesensing 12 02277 g001
Figure 2. Illustration of whitecap retrieval using Δep. WindSat 6.8 GHz horizontal polarization data are used for example (p = H): (a) ΔeH(U10) and ΔeHf(U10), (b) ΔeH(Wc) and ΔeHf(Wc), (c) Wc(U10) retrieved with ΔeH and ΔeHf. Reproducing part of ([21], Figure 2).
Remotesensing 12 02277 g002
Figure 3. Whitecap fraction dependence on wind speed; green crosses: data retrieved from microwave radiometer measurements; magenta plus signs: optical measurements; black solid line: the whitecap model (9–10).
Remotesensing 12 02277 g003
Figure 4. Foam-to-roughness ratio rpfr: (a) vertical polarization, (b) horizontal polarization. Roughness component of excess emissivity Δepr: (c) vertical polarization, (d) horizontal polarization.
Remotesensing 12 02277 g004
Figure 5. Foam-to-sum ratio rpfs: (a) vertical polarization, (b) horizontal polarization. Excess emissivity Δep: (c) vertical polarization, (d) horizontal polarization.
Remotesensing 12 02277 g005