Article

Inspecting the Food–Water Nexus in the Ogallala Aquifer Region Using Satellite Remote Sensing Time Series

1
Department of Geography, Oklahoma State University, Stillwater, OK 74078, USA
2
Department of Geological Sciences and Environmental Studies, State University of New York at Binghamton, Binghamton, NY 13902, USA
*
Author to whom correspondence should be addressed.
Remote Sens. 2020, 12(14), 2257; https://doi.org/10.3390/rs12142257
Submission received: 29 May 2020 / Revised: 6 July 2020 / Accepted: 10 July 2020 / Published: 14 July 2020

Abstract

:
Agricultural production in the Great Plains provides a significant amount of food for the United States while contributing greatly to farm income in the region. However, recurrent droughts and expansion of crop production are increasing irrigation demand, leading to extensive pumping and attendant depletion of the Ogallala aquifer. In order to optimize water use, increase the sustainability of agricultural production, and identify best management practices, identification of food–water conflict hotspots in the Ogallala Aquifer Region (OAR) is necessary. We used satellite remote sensing time series of agricultural production (net primary production, NPP) and total water storage (TWS) to identify hotspots of food–water conflicts within the OAR and possible reasons behind these conflicts. Mean annual NPP (2001–2018) maps clearly showed intrusion of high NPP, aided by irrigation, into regions of historically low NPP (due to precipitation and temperature). Intrusion is particularly acute in the northern portion of OAR, where mean annual TWS (2002–2020) is high. The Oklahoma panhandle and Texas showed large decreasing TWS trends, which indicate the negative effects of current water demand for crop production on TWS. Nebraska demonstrated an increasing TWS trend even with a significant increase of NPP. A regional analysis of NPP and TWS can convey important information on current and potential conflicts in the food–water nexus and facilitate sustainable solutions. Methods developed in this study are relevant to other water-constrained agricultural production regions.

1. Introduction

Food, energy, and water are basic needs of each human being and thus the whole of society. These resources are also highly intertwined, resulting in the need to study them from an integrative standpoint. The food–energy–water (FEW) nexus approach has emerged as a powerful ontological tool for understanding and sustainably managing these resources [1,2]. The challenges to food, water, and energy from the continued rise of global population and associated rates of consumption are compounded by the political, economic, and social consequences of climate change. The forecast of increased threats to these resources highlights an increasing necessity to study the FEW nexus in an integrated manner. Although studies involving in situ observations are illuminative for the FEW nexus [3,4], government funding for resource monitoring is limited and faces gradual reduction and re-prioritization at the local and national level.
Remote sensing provides consistent and region-wide observations that can guide policy making and decisions in support of in situ observations. Various remote sensing products can be used to study food, energy, and water at the regional scale. For example, the U.S. Department of Agriculture’s Cropland Data Layer, a satellite-derived land cover map, provides annual crop classifications at a 30-m spatial resolution for the U.S. [5]. The primary production products from the Moderate Resolution Imaging Spectroradiometer (MODIS) provide a regular measure of the growth of terrestrial vegetation [6]. Recent studies have used nighttime light imagery to estimate electricity consumption [7,8,9], and high-resolution global surface water [10] and total water storage derived from measuring changes in Earth’s gravity field [11] have been used to study groundwater withdrawals for agricultural irrigation [12].
Nevertheless, effective and novel uses of remote sensing data to study the FEW nexus remain challenging. Water is the most investigated component [12,13,14,15], while the other two are less studied due to difficulties in directly linking remotely sensed observations. Additional studies are needed to explore the potential of using different remote sensing products to reflect food and energy components within the nexus. Furthermore, few studies integrate two or all three components of the FEW nexus through evolving remote sensing technologies [16,17].
This study aimed to demonstrate the potential of using remotely sensed data to study food and water components of the FEW nexus in an agriculturally productive groundwater-dependent area—the Ogallala Aquifer Region of the United States. Specifically, we showed how a spatial and temporal collection of remotely sensed imagery can be combined and analyzed to reveal points of conflict, or hotspots within a region. These hotspots reflect a convergence of increasing agricultural production and decreasing total water storage, and represent a reliable approach for assessing vulnerability. Such observations and evaluations are becoming increasingly important as climate change and variability alter the hydrologic cycle, and subsequently, inter-connected food, water, and energy landscapes. This is particularly relevant to irrigated crops, which account for over $118 billion of U.S. agricultural value and 80% of U.S. consumptive water use [18].

2. Location and Methods

2.1. Study Area
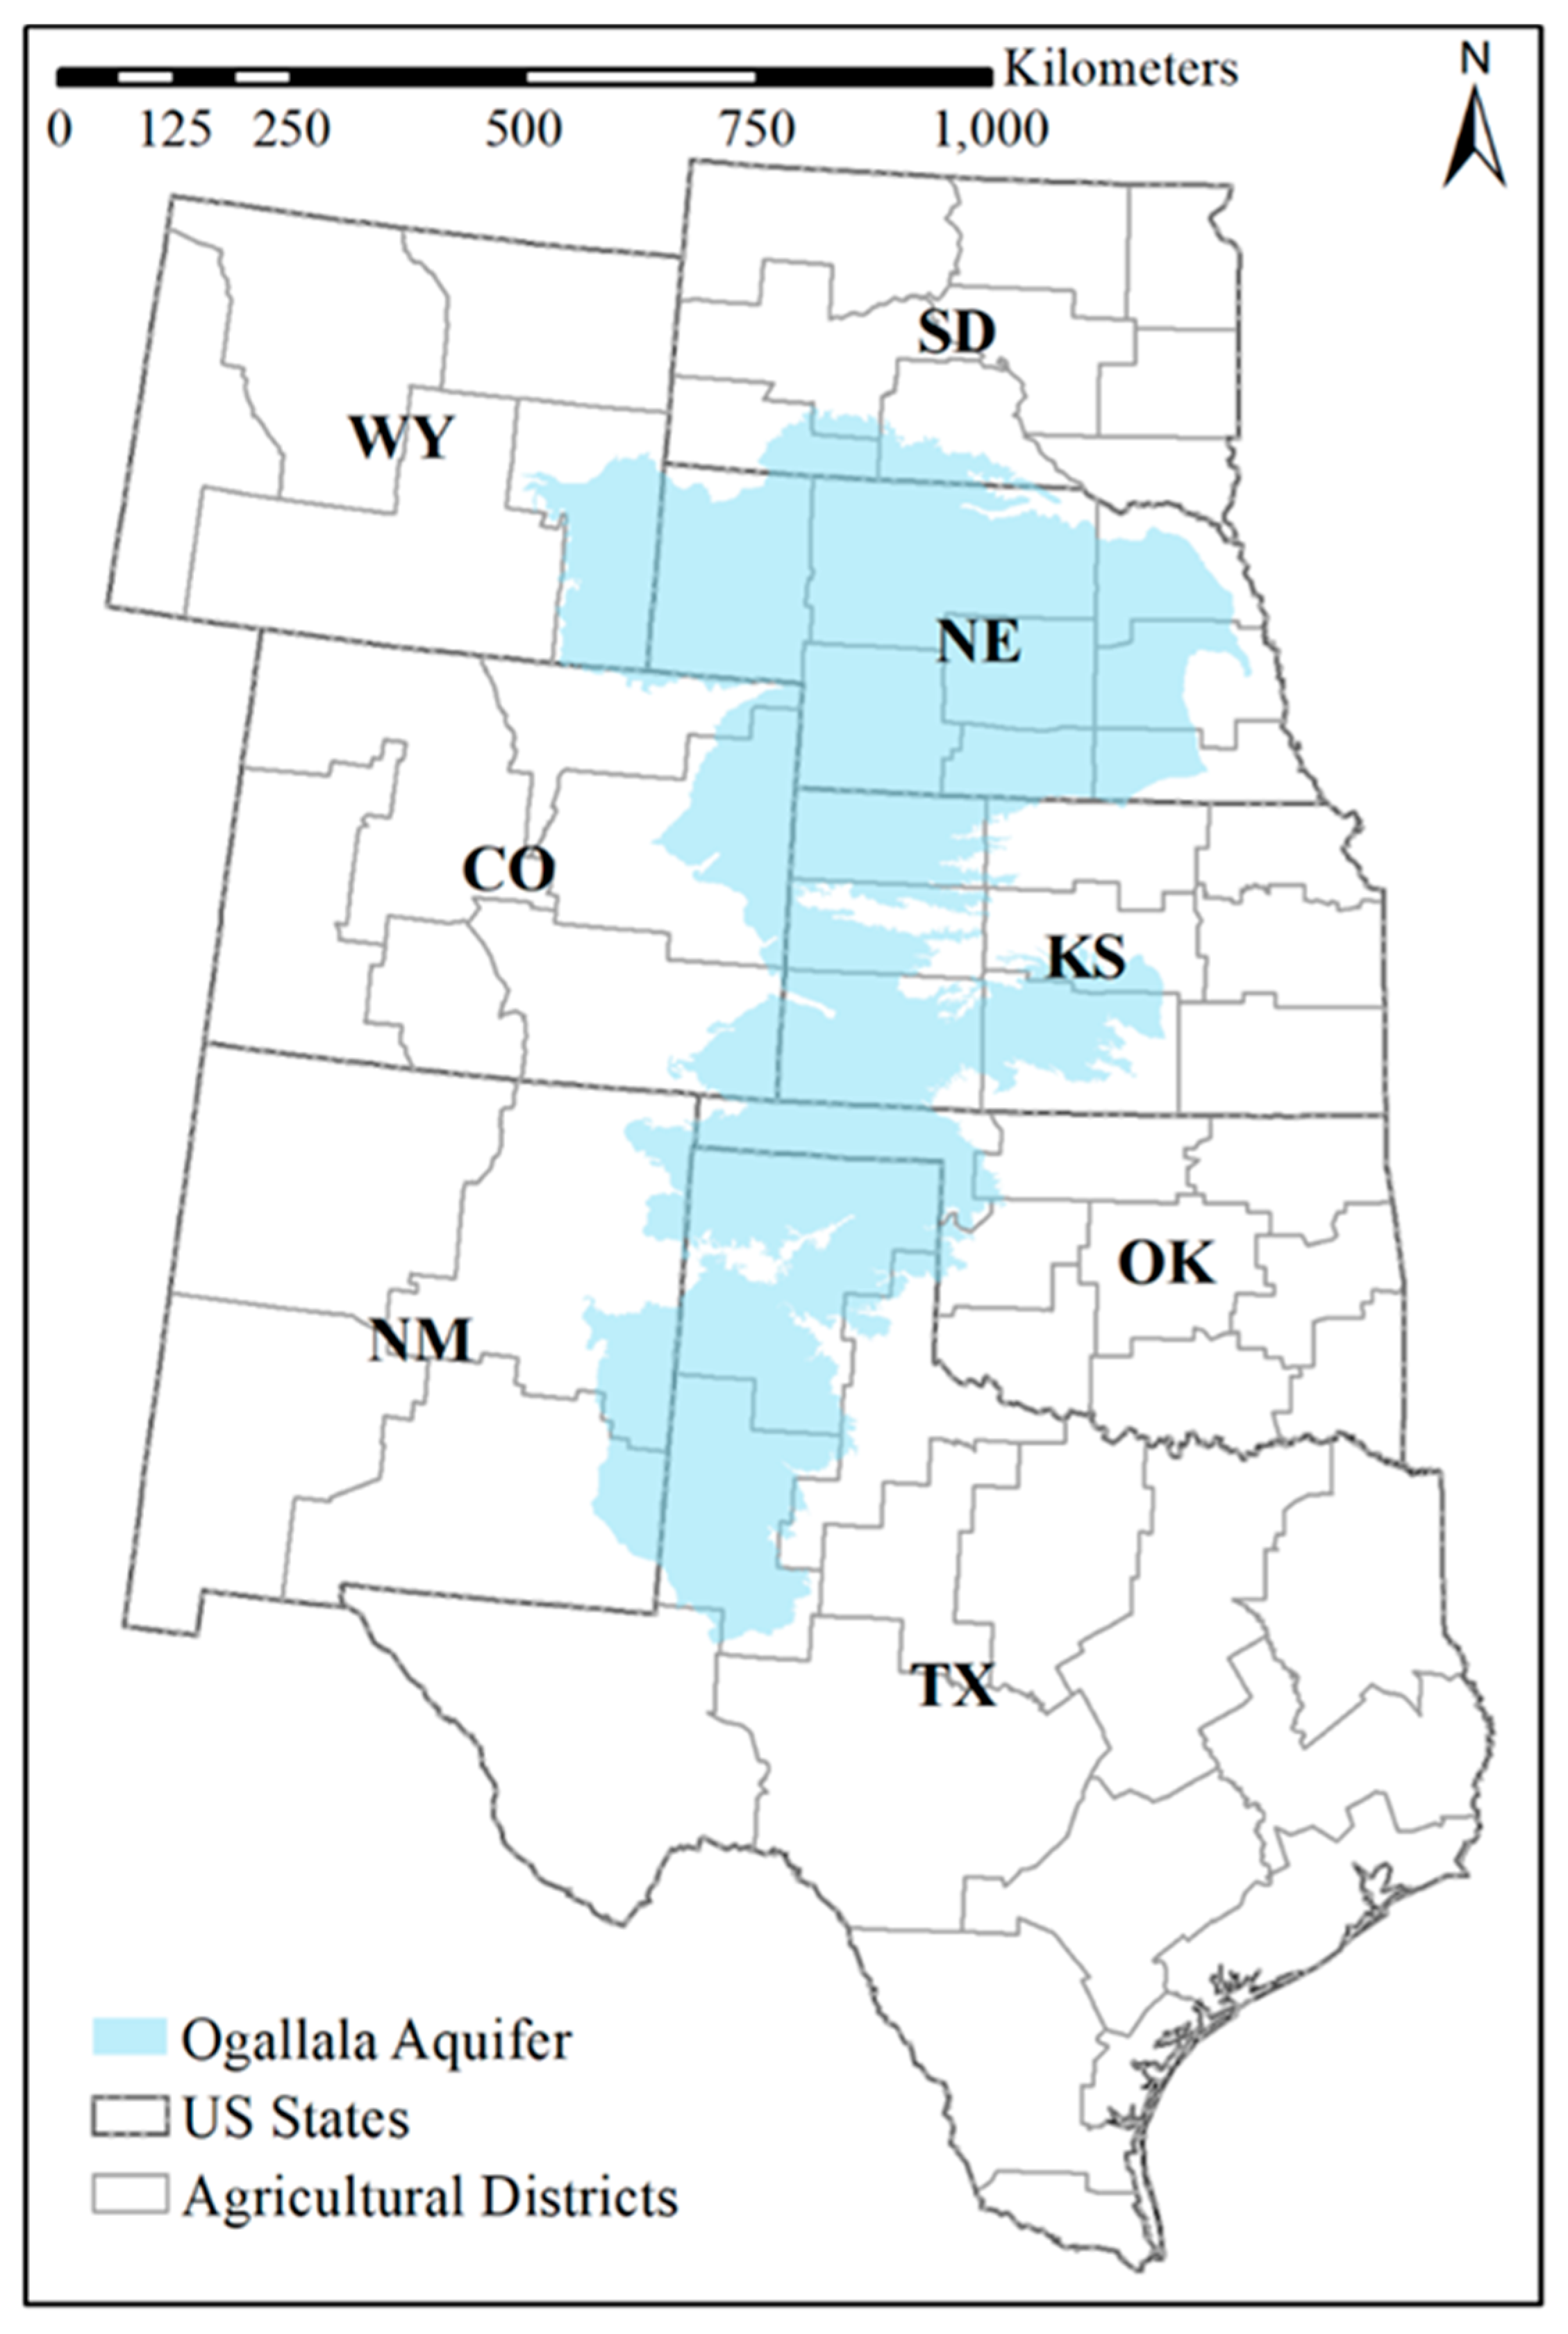
The Ogallala Aquifer extends over an area of 111.8 million acres (45.2 million hectares) in portions of eight states in the United States—Colorado (CO), Kansas (KS), Nebraska (NE), New Mexico (NM), Oklahoma (OK), South Dakota (SD), Texas (TX), and Wyoming (WY) (Figure 1). The Ogallala Aquifer Region (OAR) is characterized mostly as semi-arid grassland and steppe, historically suitable only for dryland agriculture. However, technological advances in the early to mid-20th century allowed for expansion of both crop type and farming area. The wide adoption of irrigation technology and extensive use of groundwater for irrigation has transformed the region into one of the primary agricultural regions in the United States. The major crops include corn, wheat, and soybean [19]. Additionally, the OAR also produces a significant portion of the nation’s red meat (TX, NE, KS, OK, SD, and CO account for about 40% of the cattle inventory in the United States) [20], while contributing greatly to farm income in the region.
Portions of the Ogallala Aquifer receive very little recharge from rainfall today. Groundwater withdrawn in these regions represents “fossil” water, so termed because of its infiltration during the Ice Age tens of thousands of years ago. Effectively, this means irrigation-dependent agriculture in the OAR faces a formidable challenge in balancing short-term water demand with long-term water supply. The bank account of water (i.e., Ogallala Aquifer) received a substantial initial deposit from nature, but very little subsequent investment (i.e., recharge). Thus, balancing sustainable yield with demand from agriculture is difficult for farmers across the region. This can be observed practically by noting the decline in water tables across the aquifer since 1940 (when expanded electricity access and improved pumping technology converged). During this period, the Ogallala Aquifer has lost an estimated 266 million acre-feet (328 billion cubic meters) of water [21]. Water tables in northern Texas, the panhandle of Oklahoma, and southwest Kansas have dropped 10–150 feet (30–60 m) [22]. It is worth noting that the Ogallala Aquifer is highly heterogenous with respect to groundwater flow rates, thus abstraction in Nebraska has no discernible effect on water levels in Oklahoma or Texas. However, management of water resources remains important at smaller levels of scale to ensure sustainability, equity, and productivity.
Figure 1. Map of study area [23].
Remotesensing 12 02257 g001

2.2. Climate Data

Vegetation production is constrained by climate parameters, particularly precipitation and temperature. Thus, distinguishing climate conditions within a given area can help identify regions requiring irrigation for agricultural production. To include these climatic forcings in our data analysis, we used the long-term average precipitation and temperature in the Parameter-elevation Regressions on Independent Slopes Model (PRISM) [24]. PRISM combines point-based observations collected from ground stations with a digital elevation model to generate gridded estimates of daily and monthly climate data.

2.3. Moderate-Resolution Imaging Spectroradiometer (MODIS) for Net Primary Production (NPP)

Net primary production (NPP) is the amount of carbon accumulated as plant biomass. It is an annual measure of growth of vegetation which provides food for all heterotrophic activities [25]. NPP is highly correlated with crop production [26,27], grassland aboveground biomass production [28,29], and forest production [30]. As a result, NPP can be considered a strong indicator of overall food production. Spatial patterns of NPP are highly heterogenous due to a variety of environmental and anthropogenic factors, thus calculation can require an extensive investment of human time and energy. Additionally, the Ogallala Aquifer Region is simply too large to comprehensively sample NPP using traditional time-consuming field surveying methods (calculating the difference in the mass of tissue harvested at the beginning and end of the growing season) [31]. Thus, satellite remote sensing is the only viable data tool for quantifying the variability of NPP at regional scales. As a result of its robustness and long-term record, the Moderate Resolution Imaging Spectroradiometer (MODIS) NPP [32] has been used to evaluate spatial and interannual patterns of productivity worldwide [33,34,35]. The MODIS NPP is a land productivity product based on the radiation use efficiency concept. It first estimates the daily gross primary production (GPP) using incoming photosynthetically active radiation (PAR) and other surface meteorological variables, such as temperature and vapor pressure deficit. Next, NPP is calculated through subtracting maintenance and growth respiration terms (derived from another MODIS product) from GPP. Further details of the MODIS NPP/GPP algorithm can be found in previous publications [36,37]. In this study, we used the yearly MODIS NPP at a 1000-m spatial resolution (MOD17A3) to study the annual dynamics of NPP, the mean annual NPP, and the NPP trend for the study area. MODIS NPP includes cropland, as well as grassland and forest; thus, we created a mask layer that combined cultivated croplands and hay/pasture using the latest (2016) United States National Land Cover Database (NLCD) [38]. Hay/pasture was included as these could also be irrigated.

2.4. Gravity Recovery and Climate Experiment (GRACE) and Total Water Storage (TWS)

Since both surface and groundwater are used in irrigation for crop production, our research was interested in monitoring total water storage (combined surface and groundwater) over time, utilizing different remote sensing and land surface model (LSM) datasets. To arrive at total water storage (TWS), we used Gravity Recovery and Climate Experiment (GRACE) and its successor league, GRACE Follow On (GRACE-FO), satellite observations. These data were acquired from the Center for Space Research (CSR) [39] and the Jet Propulsion Laboratory (JPL) [40] using the mass concentration blocks (mascons) solutions of release-06, RL06. The data covered the period from April 2002 to June 2017; a representative TWS ensemble was created from both solutions. GRACE-FO data were utilized for the CSR spherical harmonics (CSR-SH) solution between June 2018 and January 2020 [41]. GRACE/GRACE-FO TWS observations monitor the overall changes in the available water storage as a sum of the surface, soil moisture, and groundwater storage (GRACE is considered a blind satellite in that it does not discriminate between different storage constituents). Herein, for instance, groundwater storage represents the main source for irrigation and crop production in the OAR. Therefore, to express a sole constituent, either ground or surface water, we utilized another ancillary observation from Noah land surface model version 3.3, Noah land water content (LWC) [42]. The LWC data are equivalent to GRACE TWS, despite missing the groundwater component. The associated uncertainty with TWS and LWC data were calculated according to standard approaches [43,44,45,46,47]; to illustrate the uncertainty bounds, the residuals (R1) were calculated after removing the deterministic components (long-term trend), annual, and semi-annual components using a STL (seasonal and trend decomposition using LOESS [48]) decomposition model. Next, a linear regression approach was applied to remove any further trend signals, and a second residual series (R2) was calculated. The standard deviation of the residual was interpreted as maximum uncertainty or measurement error (the amplitude of the measurement error).

2.5. Agricultural Statistics Data from the USDA National Agricultural Statistics Service

Statistical data from the USDA National Agricultural Statistics Service (NASS) were used to explain the dynamics of NPP, which is closely related to crop production in the region. Specifically, we used the harvested area and yield of corn between 2000–2018 for each agricultural district (a contiguous group of counties having relatively similar agricultural characteristics). Corn was chosen as an explanatory variable as it is one of the most water-demanding crops in the OAR.

2.6. Trend Analysis of NPP, TWS, and LWC

The frequently used non-parametric Mann–Kendall Z trend analysis [49] was utilized to gain an understanding of the trends of NPP, TWS, and LWC between 2001 and 2018, 2002 and 2020, and 2002 and 2017, respectively. The obtained Z value was compared to Z1-α/2 of the normal cumulative distribution function. The trend was considered significant in this study if p-value ≤ 0.05. To aid regional interpretation of our trend analysis and illustrate the extent of increasing or decreasing trends, we quantified the slope of the trends for each NPP, TWS, and LWC pixel using the Theil–Sen robust linear regression technique [50]. Thiel–Sen is a non-parametric and computationally efficient technique for estimating the trend slope, which is robust to outliers. The slope derived from this technique is simply the median slope of lines crossing all pairs of data points.

3. Results and Discussion

3.1. Precipitation and Temperature Regimes from Long-Term Climate Data

The 30-year (1981–2010) normals derived from PRISM showed distinct spatial patterns of precipitation and temperature within the OAR (Figure 2). An east-west precipitation gradient is apparent, with annual values over 2000 mm in the east to less than 150 mm in the west. Simultaneously, an increasing temperature gradient from north to south occurs in the region. The orthogonal nature of the temperature and precipitation gradients create different combinations of climate conditions (e.g., dry and hot in the south while dry and cool in the north) for vegetation growth. The impact of local terrain on climate, for example the Rocky Mountains in WY and CO, was manifested with higher precipitation and lower temperature than their neighbor areas.

3.2. Mean and Trend of Net Primary Production (NPP) during 2001–2018

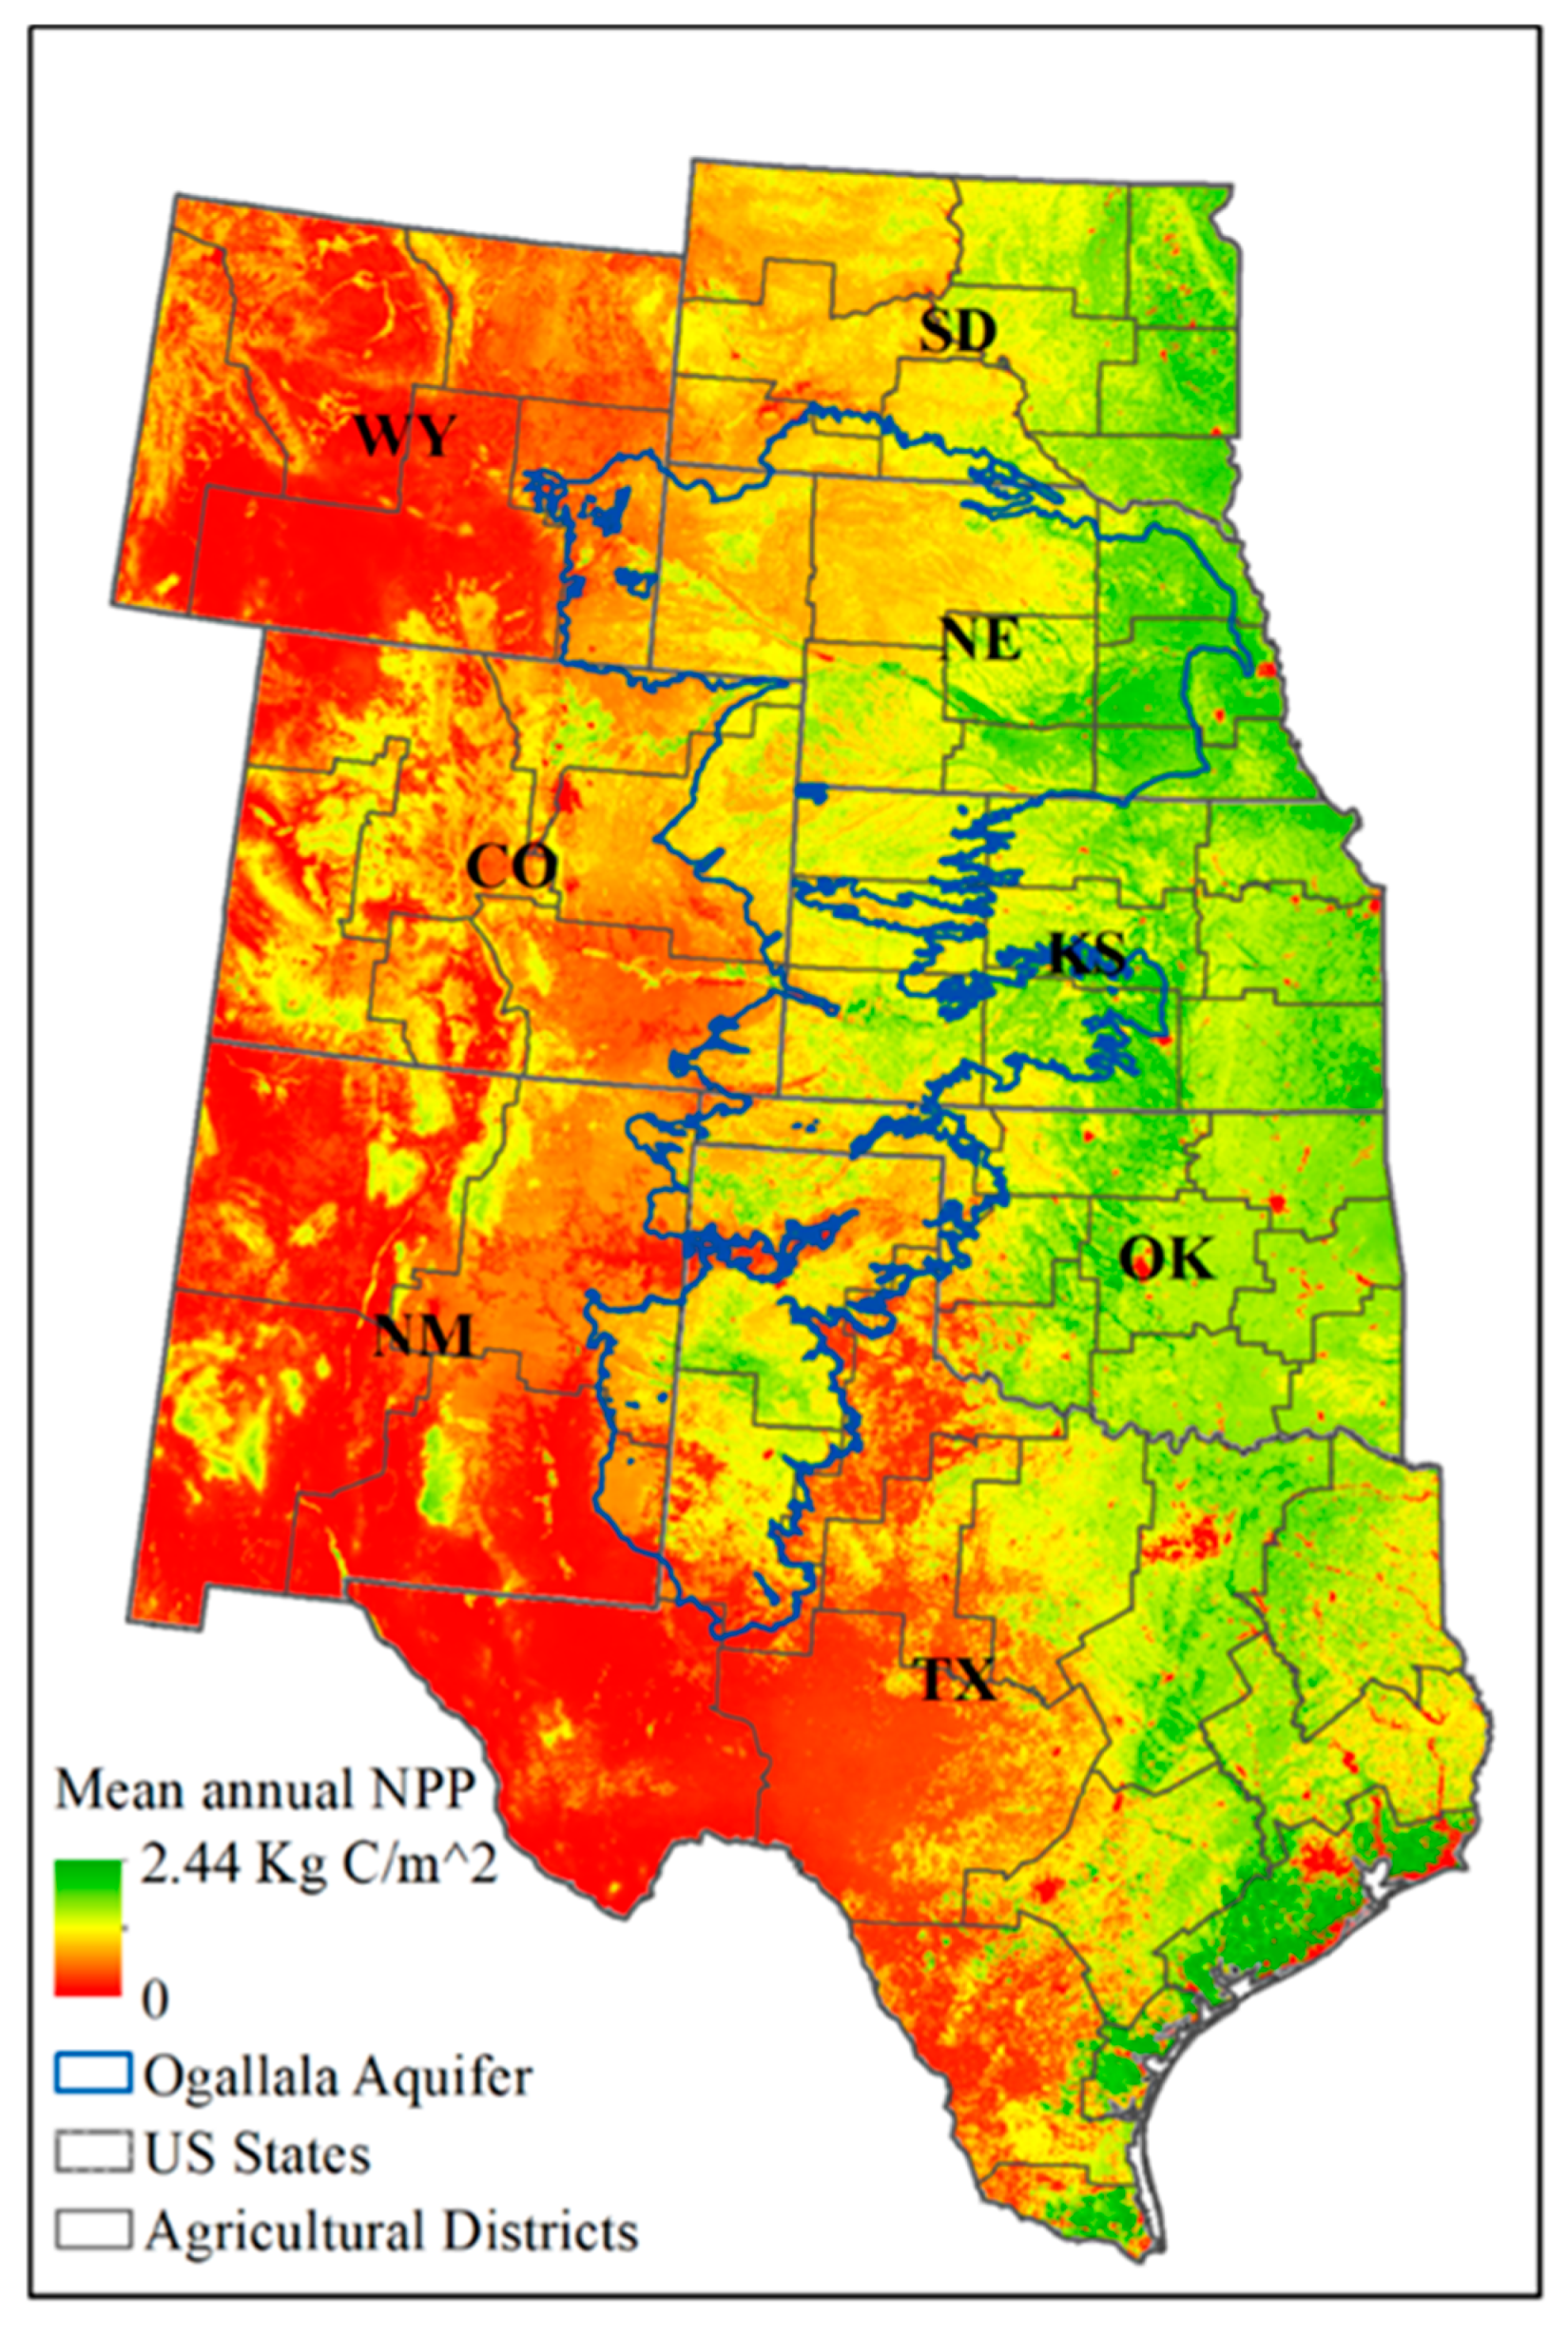
The mean annual NPP during the period 2001–2018 indicates the normal of overall food production (Figure 3). There is a decreasing trend of mean annual NPP, agreeing with the overall decreasing precipitation gradient from east to west. However, above the Ogallala Aquifer, spatial patterns of NPP did not follow those of the precipitation and temperature. Expressly, NPP within the OAR was much higher than regions outside of the OAR with a comparable climate. These patterns indicate that high NPP values within the OAR were driven by irrigation from the Ogallala Aquifer. Another apparent pattern is the relatively higher NPP in mountain terrain than its nearby areas in CO and NM, which again agrees well with the patterns of long-term precipitation (Figure 2a).
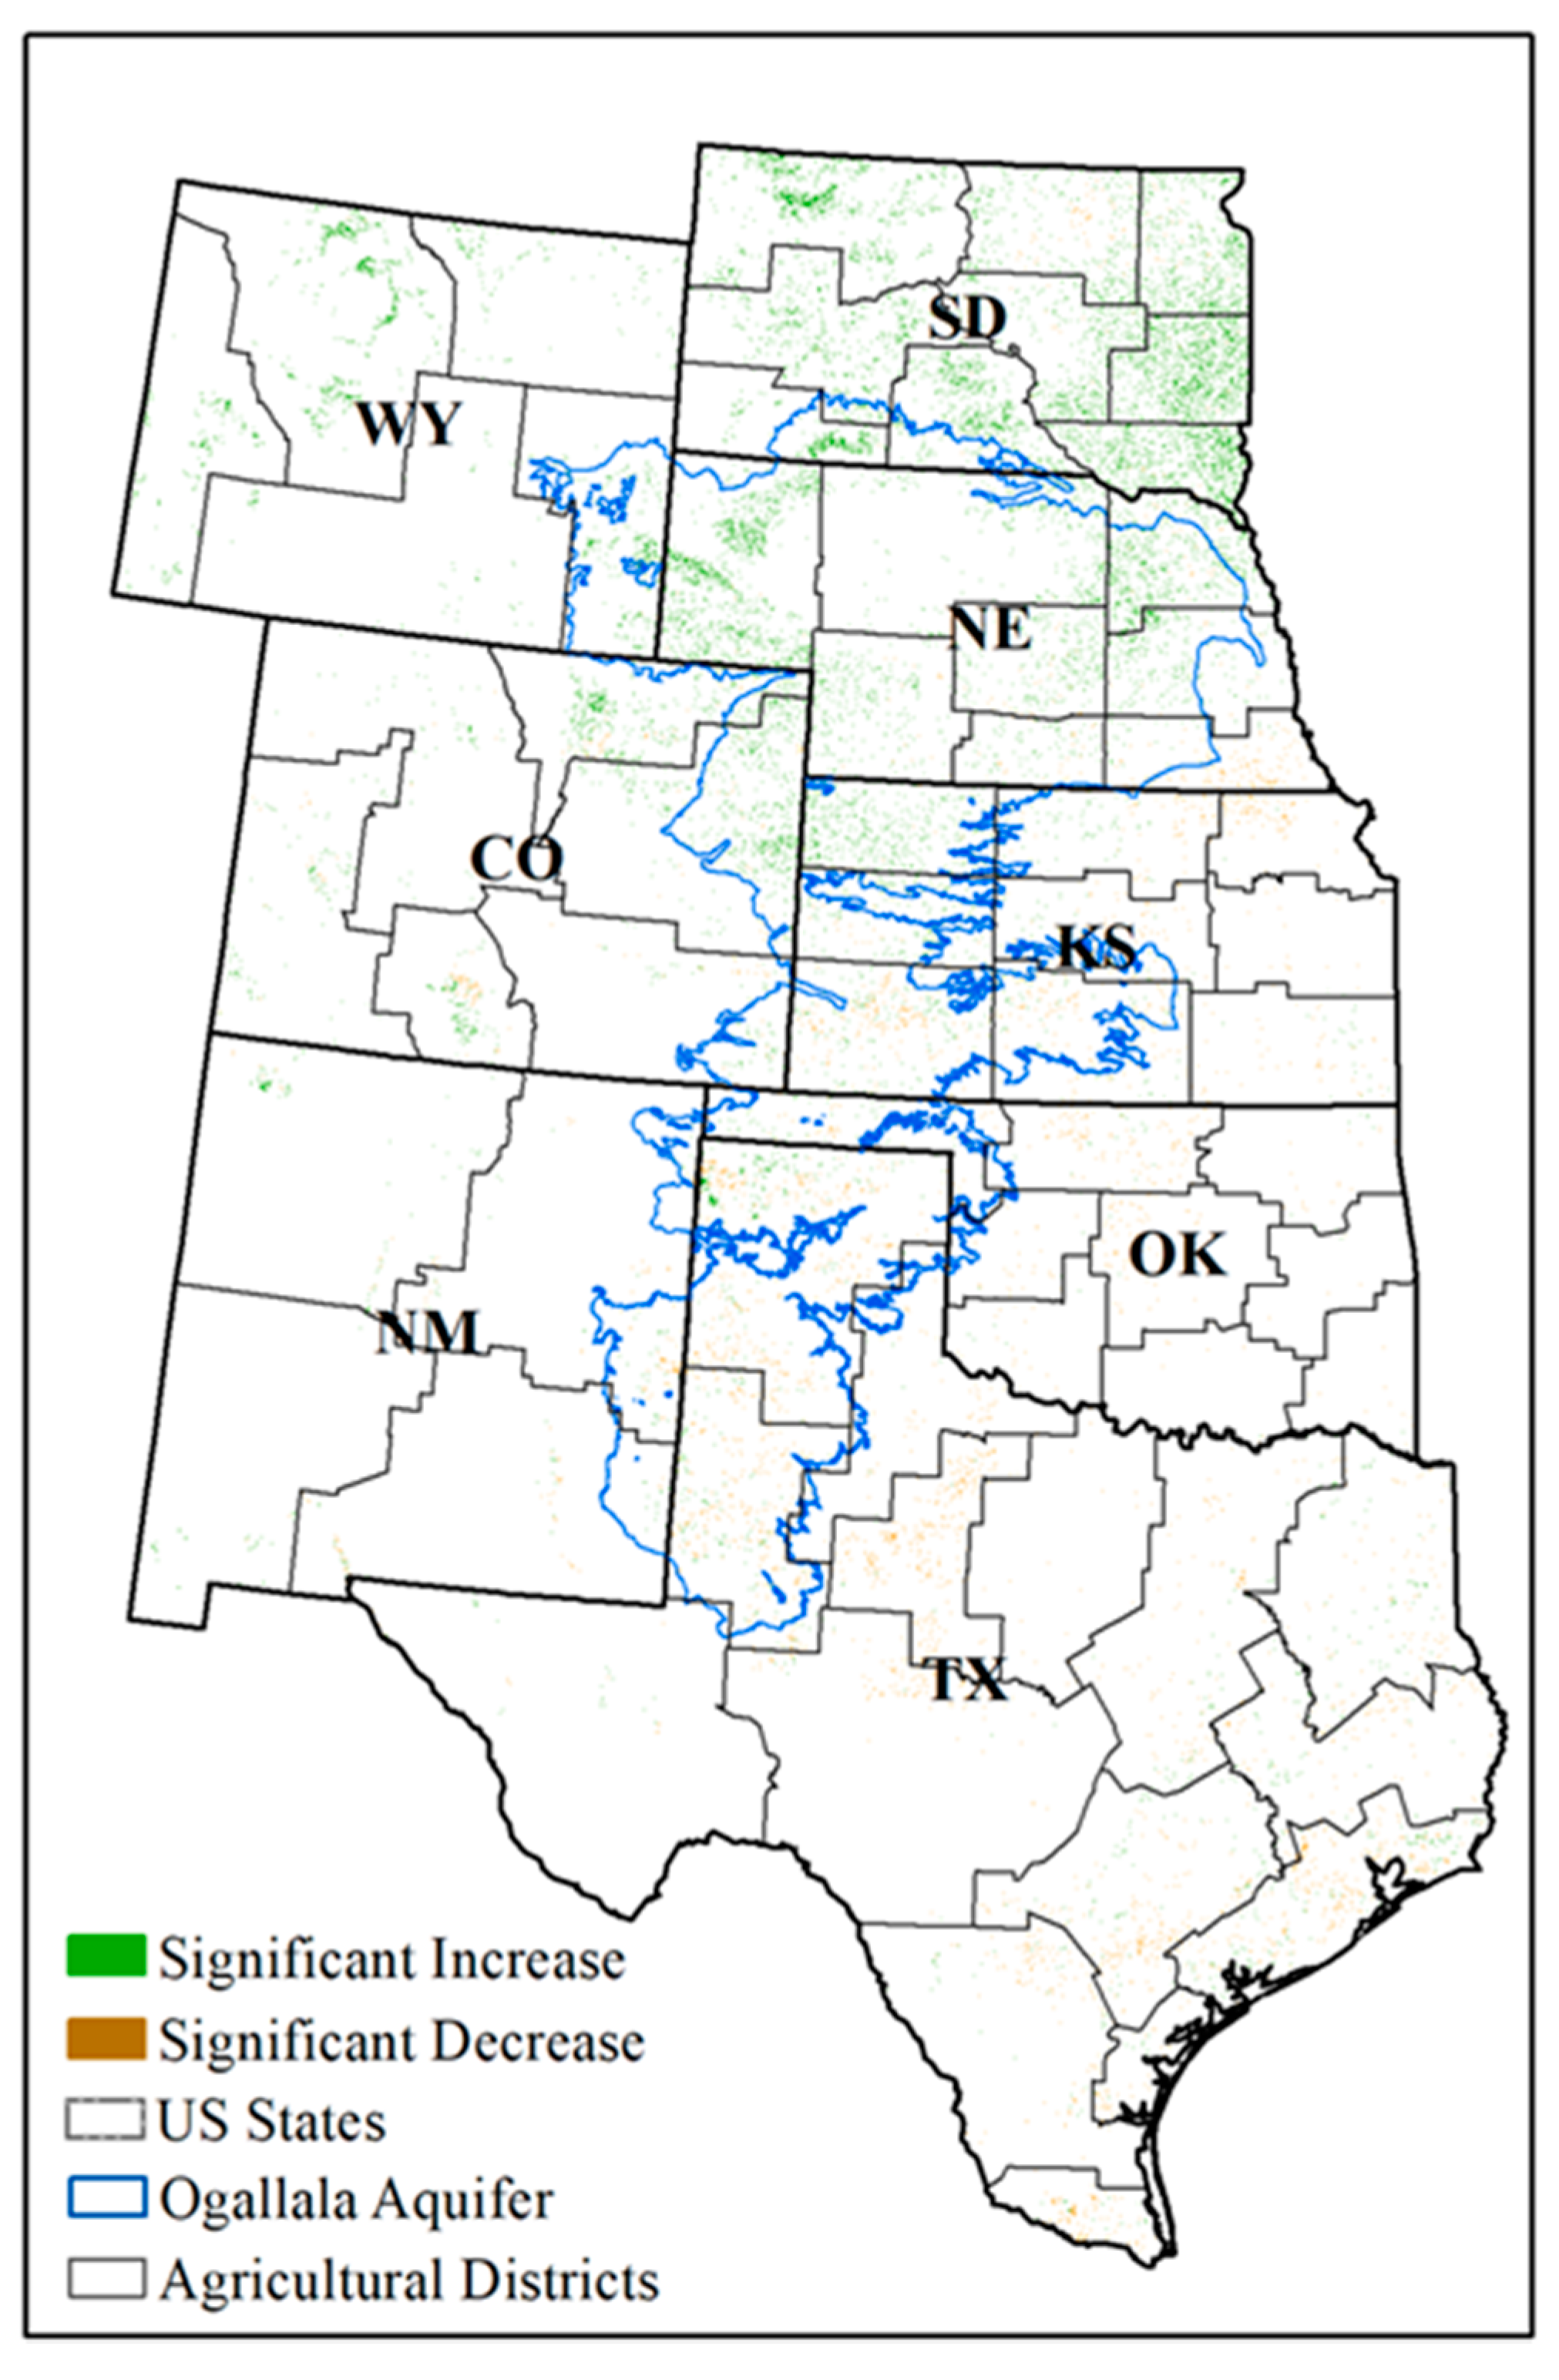
Besides the mean annual NPP, the trend of NPP was used to show the general tendency of change over the study years. The NPP exhibited a large increasing trend in the northern portion of the OAR, especially in northern NE and western SD (Figure 4a). In comparison, portions of southern OK and northern TX showed a decreasing trend. However, not all of these trends are significant at the significance level of p < 0.05 (Figure 4b). Most areas showing significant changes are located in the northern OAR. By overlaying the trend (Figure 4a) and significance of the trend (Figure 4b), we can see that within the OAR, only northern NE experienced a significant increase of NPP throughout the study years (Figure 5). The trend of NPP was not significant for other areas within the OAR.

3.3. Mean and Trend of Total Water Storage (TWS) during 2002–2017 and 2018–2020

The mean annual TWS during the periods between 2002–2017 and 2018-2020 from both GRACE and GRACE-FO observations indicated the overall changes in the available water storage in the OAR (Figure 6). Consistent with the precipitation pattern, GRACE showed a slight east-west TWS gradient with pronounced northward increase of 6.11 cm/year, ±1.32 cm/year (or ~141.79 Gt/year, ±30.62 Gt/year) (Figure 6a). On the contrary, the southeast aquifer region displayed a significant TWS decline of −7.11 cm/year, ±0.90 cm/year (or ~−164.94 Gt/year, ±20.88 Gt/year). The overall annual average TWS for the Ogallala Aquifer was −0.60 cm/year, ±0.93 cm/year (or ~−14 Gt/year, ±21.57 Gt/year). Consistent with these patterns, GRACE-FO displayed a persistent TWS increase over the northeast area, and a substantial decline in the southwest region of 12.91 cm/year (or ~299.48 Gt/year) and −8.91 cm/year (or ~−206.70 Gt/year), respectively (Figure 6b). The GRACE-FO overall mean annual TWS for the Ogallala Aquifer was 1.20 cm/year (or ~27.88 Gt/year).
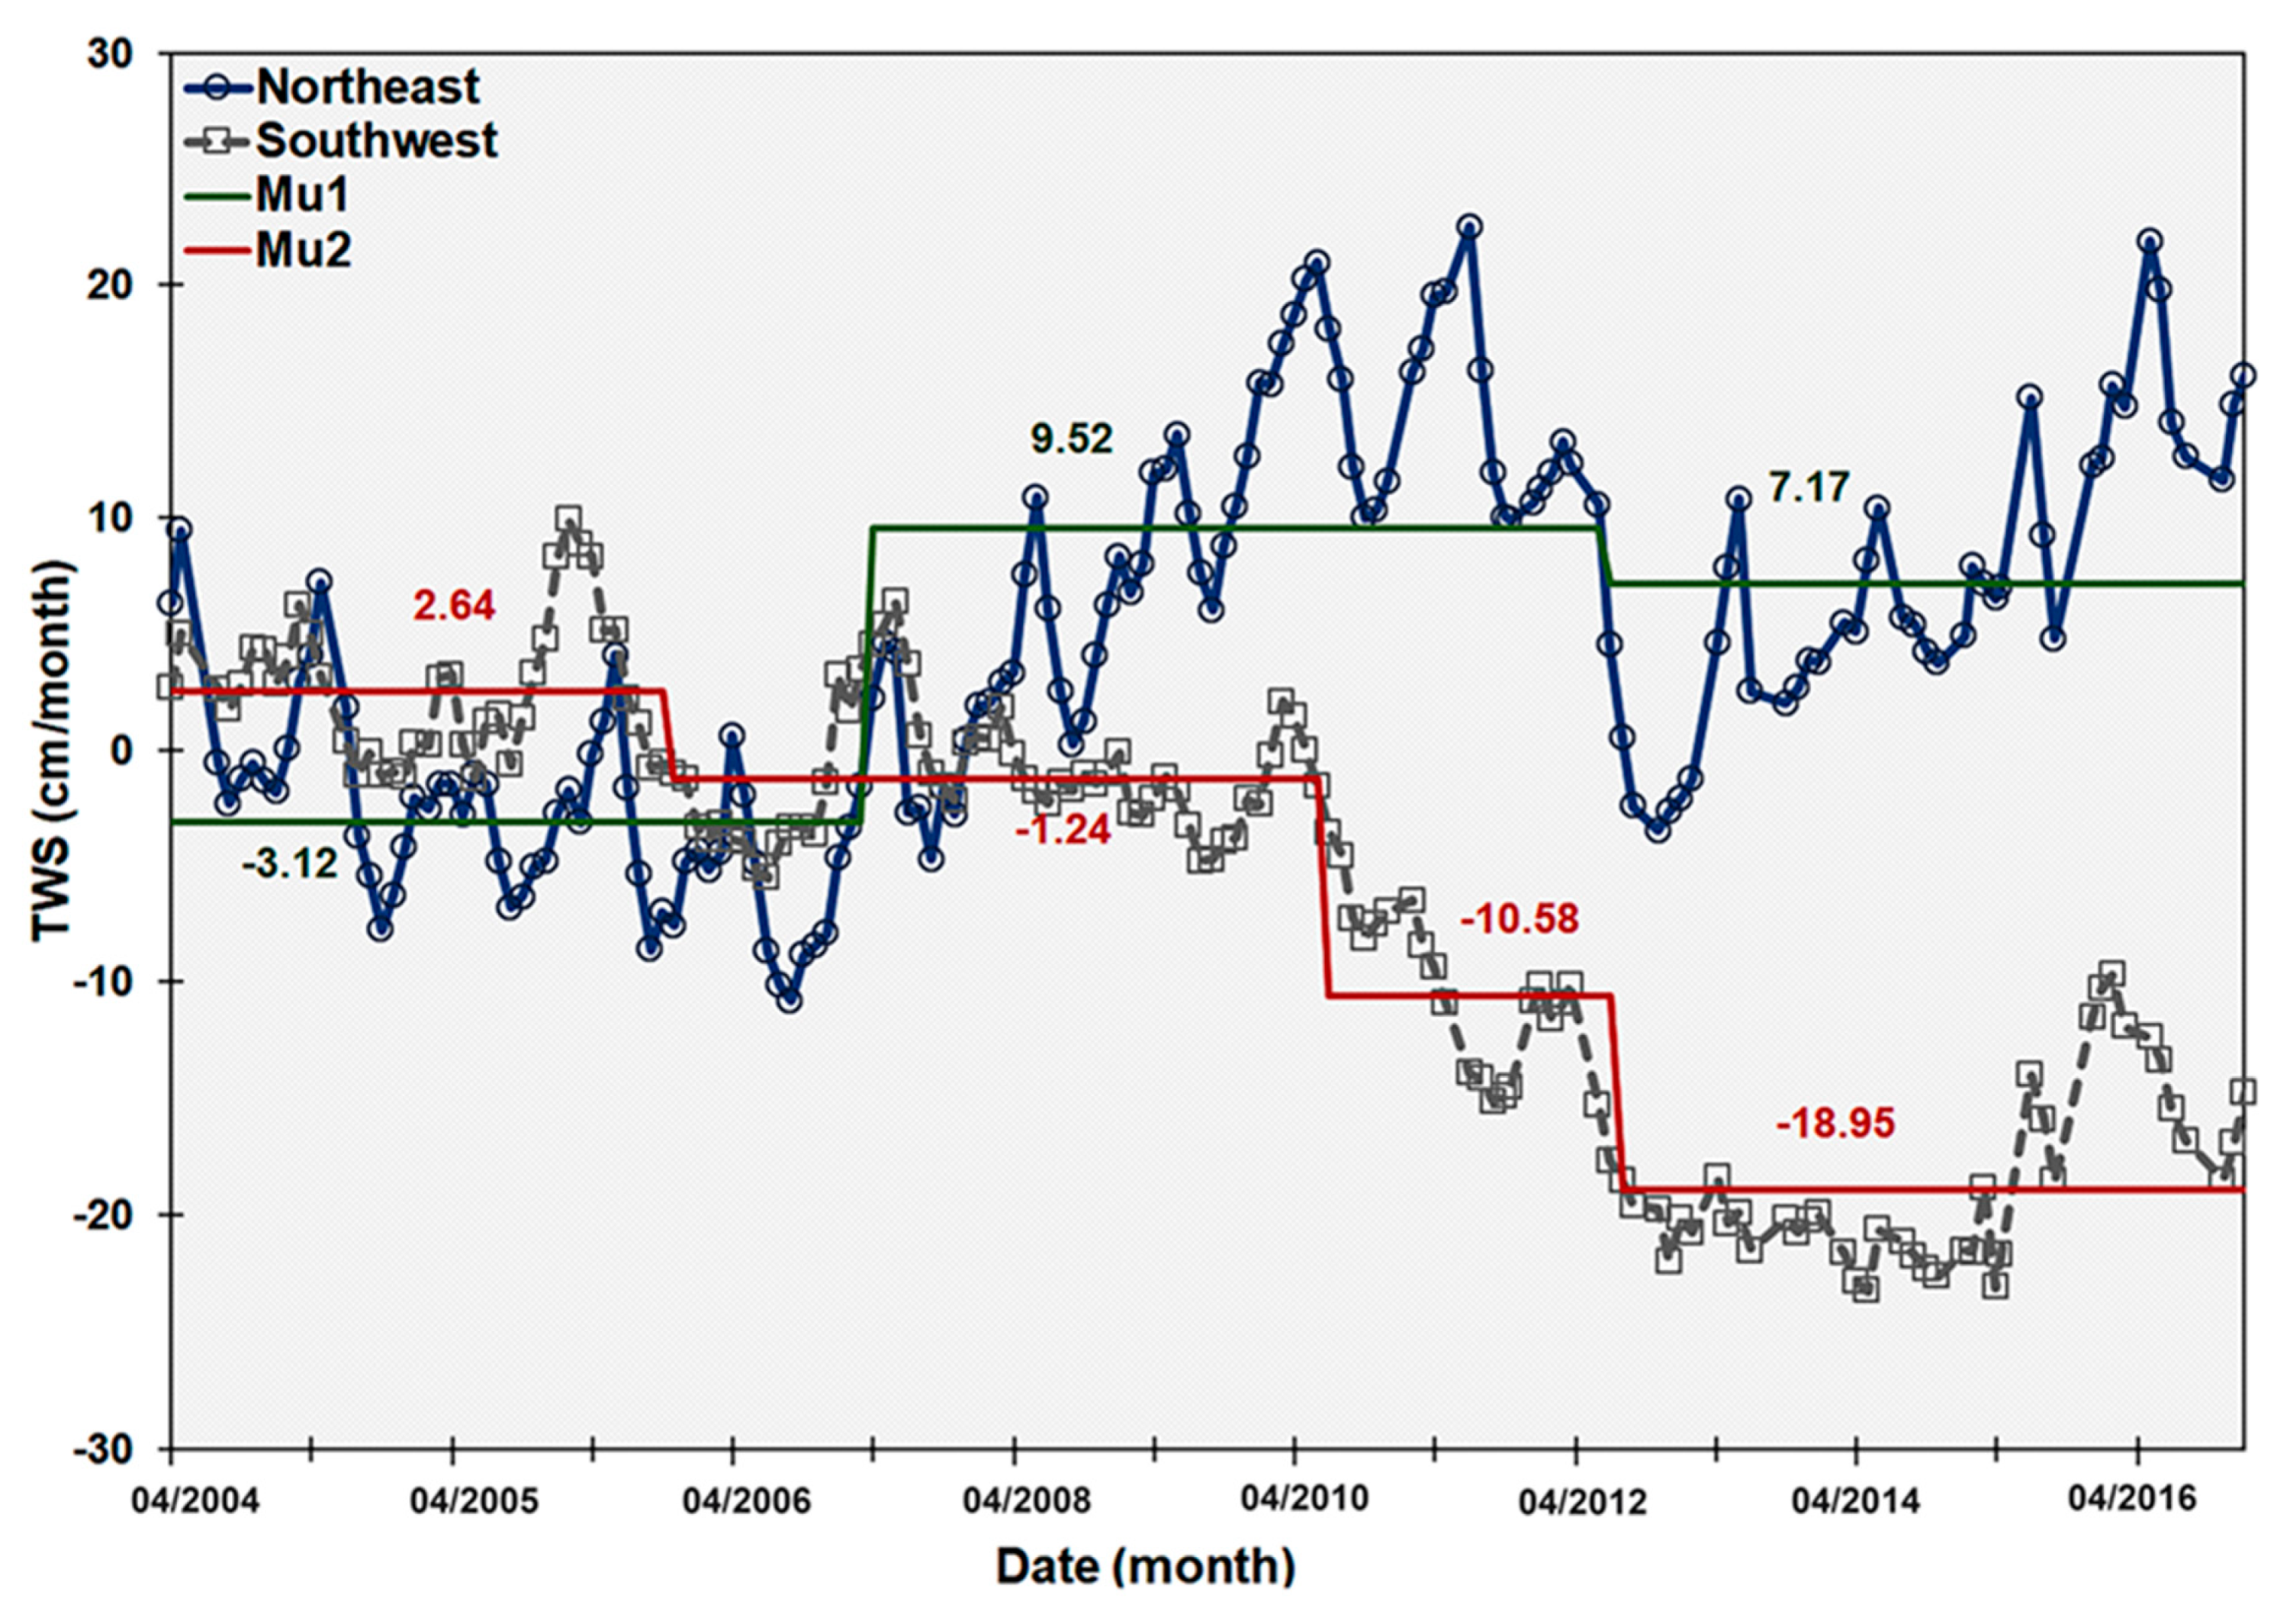
Temporally, Figure 7 compares the northeast and southwest regions of the OAR with contrasting TWS patterns between 2002 and 2017. Results showed a significant upward TWS trend in the northeast and a substantial declining trend in the southwest region. Specifically, the northeast region shows three distinct time-shifts (p < 0.0001) over the study years. The first period from April 2002 to March 2007 (57 months) with a mean of −3.12 cm, the second period from April 2007 to June 2012 (60 months) with a significant increase in the mean to 9.52 cm, and the third period from July 2012 to January 2017 (42 months) with a slight decrease in the mean to 7.17 cm. The southwest hotspot displayed four distinct TWS regime-shifts in the mean, a positive regime from April 2002 to October 2005 (40 months) with a TWS mean of 2.64 cm. Then, three significant negative regimes of −1.24, −10.58, and −18.95 cm in periods from November 2005 to June 2010 (56 months), July 2010 to July 2012 (22 months), and August 2012 to January 2017 (41 months), respectively. Further research is required to understand the sources and discrepancies in the regime-shifts between the time series of the two regions.
The TWS and LWC trends were calculated to display the general tendency of change in the available water storage over the study years (Figure 8). The TWS showed a large increasing trend in the north and northeast portion of the OAR, especially in northern NE and SD (Figure 8a). In contrast, portions of KS, southern OK panhandle, and TX showed a decreasing trend. Figure 8b shows the LWC trend, where the northwest portion of the OAR, especially north SD, northwest WY, and CO exhibited a positive trend. The areas in central KS, west OK, and north and south TX displayed significant declining LWC trends; Figure 8c and d indicate the significance levels for TWS and LWC, respectively. Overall, different parts of OAR (north, central, and southern regions) experienced significant fluctuations in the available water storage throughout the study years.
Comparing overlapping, or nexus, regional trends of NPP, LWC, and TWS (Figure 5, Figure 6 and Figure 8) helps to identify sustainable dimensions of groundwater usage within the OAR. The northern portion of the OAR, particularly northern Nebraska, showed increasing patterns in NPP, but also increasing patterns in LWC and TWS. This indicates that current water resource use by agricultural practices in northern OAR are sustainable. However, critical regions, or hotspots, were also revealed by our study. Of note are the southern regions of the OAR, specifically the Oklahoma panhandle and Texas, where there has been a significant decrease in both LWC and TWS trends over time, while the NPP trend has been constant. This indicates a mismatch between available water resources and long-term agricultural practices in these regions. As noted in Section 2.1, [21] documented the severe decline in water tables within these same regions using in situ data. Our study, using remotely sensed imagery, was able to corroborate this hydrological trend, plus demonstrate the connection to agricultural production. This identification of hotspots can serve as a prompt for further focused study on the influence of drought, management policies, or international commodity trends.

4. Conclusions

Evaluating the food–water nexus of the Ogallala Aquifer Region (OAR) is critical for the sustainable management of natural resources and stability of communities dependent upon agricultural enterprises. In this study, we assessed the food–water nexus using remotely sensed imagery, demonstrating the potential for savings in time and money over in situ monitoring, the capacity for continuous evaluation, and the ability to span transboundary water management differences. Specifically, we showed how a spatial and temporal collection of remotely sensed imagery of food and water can be combined (nexus) and analyzed to reveal points of conflict, or hotspots within a region. These hotspots reflect a convergence of increasing agricultural production and decreasing total water storage, and represent a reliable method for assessing vulnerability. These data are valuable to managers of agricultural and water districts. Based on the results of this study, we conclude that the southern portions of the OAR, specifically the Oklahoma panhandle and Texas, reflect an area of concern. Possible management responses to reduce groundwater depletion include improving irrigation efficiency, tilling to increase water infiltration, and converting to rainfed crops. However, each of these possess inherent challenges and trade-offs, and are often accompanied by further deleterious outcomes. Although improving irrigation efficiency could ostensibly reduce the decline in TWS, [50] noted that center pivot systems are highly efficient and are dominant in the OAR, yet contribute to soil salinization in the southern region due to insufficient rainfall. Converting irrigation crops to rainfed crops could also reduce depletion of TWS; however, it would likely require changing crop types and involve a subsequent decrease in crop yields [51].
The methodological approach introduced in this paper may also be applied to the other major aquifers of Earth’s arid and semi-arid mid-latitudes. As noted by [13], most of the world’s great agricultural regions are underlain by extensive often vulnerable, aquifers. The associated hydrological resources are hidden from sight, thus being susceptible to overexploitation. Subsequent declines in the water table contribute to increased costs for pumping from greater depths, degraded ecological functions and services, and potential food insecurity. Further, climate change is already altering hydrological dynamics within the soil and atmosphere, upending the stationarity premise used in water management strategies in agriculturally productive areas. Observed changing patterns of precipitation and groundwater recharge thus complicate the process of achieving balance between water supply and agriculture demand in regions like the OAR, and underscore the value of aquifer-scale investigations.
Although hotspot mapping provides a useful, and less complex, tool for communication to decision-makers and the public at large, we acknowledge there are certain limitations inherent in the methods employed in this study. One source of uncertainty in our analyses is the mismatch between agricultural statistics and remotely sensed and climate data. This issue is specifically important as the pixel (grain) size of our gridded data is coarse. As such, we expect there will be a large-scale mismatch between remote sensing and agricultural data. Further exploration of data fusion techniques, such as machine learning, can help harmonize multi-source data in food–water nexus research.
Lastly, we focused on the food–water nexus within the OAR but also recognize the potential for including an energy component in a nexus study. A purely remotely sensed investigation such as this one precludes a meaningful analysis of energy; however, incorporating in situ data through a mixed-methods approach would no doubt lend a more nuanced understanding of the interconnections between food and/or water in the OAR. Potential lines of investigations include:
  • The relationships between declining water tables and subsequent increases in energy required to pump water from lower depths.
  • The linkage between energy and water for corn grown as a biofuel.
  • Use of nighttime light images to explore the connections between oil and gas activities and groundwater abstraction or injection.

Author Contributions

Conceptualization, Y.Z., H.G. and G.T.L.; methodology, Y.Z. and H.G.; validation, H.G.; formal analysis, Y.Z., H.G., G.T.L. and E.H.; investigation, Y.Z. and E.H.; resources, Y.Z. and E.H.; data curation, Y.Z.; writing—original draft preparation, Y.Z., H.G., G.T.L., and E.H.; writing—review and editing, Y.Z., H.G., G.T.L., and E.H.; visualization, Y.Z., G.T.L. and E.H. All authors have read and agreed to the published version of the manuscript.

Funding

This research received no external funding.

Acknowledgments

We thank two anonymous reviewers for providing valuable comments that have improved this manuscript.

Conflicts of Interest

The authors declare no conflict of interest.

References

  1. Simpson, G.B.; Jewitt, G.P.W. The Development of the Water-Energy-Food Nexus as a Framework for Achieving Resource Security: A review. Front. Environ. Sci. 2019, 7, 8. [Google Scholar] [CrossRef] [Green Version]
  2. D’Odorico, P.; Davis, K.F.; Rosa, L.; Carr, J.A.; Chiarelli, D.; Dell’Angelo, J.; Gephart, J.; MacDonald, G.K.; Seekell, D.A.; Suweis, S.; et al. The Global Food-Energy-Water Nexus. Rev. Geophys. 2018, 56, 456–531. [Google Scholar] [CrossRef]
  3. Sophocleous, M. Groundwater recharge and sustainability in the High Plains aquifer in Kansas, USA. Hydrogeol. J. 2005, 13, 351–365. [Google Scholar] [CrossRef]
  4. Dennehy, K.F.; Litke, D.W.; McMahon, P.B. The High Plains Aquifer, USA: Groundwater development and sustainability. In Sustainable Groundwater Development; Hiscock, K.M., Rivett, M.O., Davison, R.M., Eds.; Geological Society, Special Publications: London, UK, 2002; Volume 193, pp. 99–119. [Google Scholar]
  5. Boryan, C.; Yang, Z.; Mueller, R.; Craig, M. Monitoring US agriculture: The US department of agriculture, national agricultural statistics service Cropland Data Layer Program. Geocarto Int. 2011, 26, 341–358. [Google Scholar] [CrossRef]
  6. Zhao, M.; Heinsch, F.A.; Nemani, R.R.; Running, S.W. Improvements of the MODIS terrestrial gross and net primary production global data set. Remote Sens. Environ. 2005, 95, 164–176. [Google Scholar] [CrossRef]
  7. Xie, Y.; Weng, Q. World energy consumption pattern as revealed by DMSP-OLS nighttime light imagery. GIScience Remote Sens. 2016, 53, 265–282. [Google Scholar] [CrossRef]
  8. Jasiński, T. Modeling electricity consumption using nighttime light images and artificial neural networks. Energy 2019, 179, 831–842. [Google Scholar] [CrossRef]
  9. Lu, L.; Weng, Q.; Xie, Y.; Guo, H.; Li, Q. An assessment of global electric power consumption using the Defense Meteorological Satellite Program-Operational Linescan System nighttime light imagery. Energy 2019, 189, 116351. [Google Scholar] [CrossRef]
  10. Pekel, J.-A.; Cottam, A.; Gorelick, N.; Belward, A.S. High-resolution mapping of global surface water and its long-term changes. Nature 2016, 540, 418–422. [Google Scholar] [CrossRef]
  11. Swenson, S.; Wahr, J.; Milly, P.C.D. Estimated accuracies of regional water storage variations inferred from the Gravity Recovery and Climate Experiment (GRACE). Water Resour. Res. 2003, 39, 1223. [Google Scholar] [CrossRef]
  12. Rodell, M.; Velicogna, I.; Famiglietti, J.S. Satellite-based estimates of groundwater depletion in India. Nature 2009, 460, 999–1002. [Google Scholar] [CrossRef] [Green Version]
  13. Famiglietti, J.S. The global groundwater crisis. Nat. Clim. Chang. 2014, 4, 945–948. [Google Scholar] [CrossRef]
  14. Rodell, M.; Famiglietti, J.S.; Wiese, D.N.; Reager, J.T.; Beaudoing, H.K.; Landerer, F.W.; Lo, M.-H. Emerging trends in global freshwater availability. Nature 2018, 557, 651–659. [Google Scholar] [CrossRef] [PubMed]
  15. Koppa, A.; Gebremichael, M. Improving the Applicability of Hydrologic Models for Food-Energy-Water Nexus Studies Using Remote Sensing Data. Remote Sens. 2020, 12, 599. [Google Scholar] [CrossRef] [Green Version]
  16. Sanders, K.T.; Masri, S.F. The energy-water agriculture nexus: The past present and future of holistic resource management via remote sensing technologies. J. Clean. Prod. 2016, 117, 73–88. [Google Scholar] [CrossRef]
  17. Alam, S.; Gebremichael, M.; Li, R. Remote Sensing-Based Assessment of the Crop, Energy and Water Nexus in the Central Valley, California. Remote Sens. 2019, 11, 1701. [Google Scholar] [CrossRef] [Green Version]
  18. USDA National Agricultural Economic Research Service. Available online: https://www.ers.usda.gov/topics/farm-practices-management/irrigation-water-use/#importance (accessed on 27 May 2020).
  19. Houston, N.A.; Gonzales-Bradford, S.L.; Flynn, A.T.; Qi, S.L.; Peterson, S.M.; Stanton, J.S.; Ryter, D.W.; Sohl, T.L.; Senay, G.B. Geodatabase Compilation of Hydrogeologic, Remote Sensing, and Water-Budget-Component Data for the High Plains Aquifer 2011; U.S. Geological Survey Data Series; USGS: Reston, VA, USA, 2013; Volume 777, p. 12.
  20. USDA National Agricultural Statistics Service. Available online: http://www.nass.usda.gov (accessed on 29 May 2020).
  21. Stanton, J.S.; Qi, S.L.; Ryter, D.W.; Houston, S.E.; Peterson, N.A.; Westenbroek, S.M.; Christenson, S.C. Selected Approaches to Estimate Water-Budget Components of the High Plains, 1940 through 1949 and 2000 through 2009; U.S. Geological Survey Scientific Investigations Report 2011-5183; USGS: Reston, VA, USA, 2011; p. 79.
  22. Sophocleous, M. Review: Groundwater management practices, challenges, and innovation in the High Plains Aquifer, USA—Lessons and recommended actions. Hydrogeol. J. 2010, 18, 559–575. [Google Scholar] [CrossRef]
  23. Qi, S.L. Digital Map of the Aquifer Boundary of the High Plains Aquifer in Parts of Colorado, Kansas, Nebraska, New Mexico, Oklahoma, South Dakota, Texas, and Wyoming; U.S Geological Survey Data Series 543; USGS: Reston, VA, USA, 2010.
  24. PRISM Climate Group, Oregon State University. Available online: http://prism.oregonstate.edu (accessed on 4 January 2020).
  25. Schowalter, T.D. Insect Ecology: An Ecosystem Approach, 4th ed.; Academic Press: London, UK, 2016; p. 774. [Google Scholar]
  26. Tao, F.; Yokozawa, M.; Zhang, Z.; Xu, Y.; Hayashi, Y. Remote sensing of crop production in China by production efficiency models: Models, comparisons, estimates and uncertainties. Ecol. Model. 2005, 183, 385–396. [Google Scholar] [CrossRef]
  27. Prince, S.D.; Haskett, J.; Steininger, M.; Wright, R. Net Primary Production of U.S. Midwest Croplands from Agricultural Harvest Yield Data. Ecol. Appl. 2001, 11, 1194–1205. [Google Scholar] [CrossRef]
  28. Zhao, F.; Xu, B.; Yang, X.; Jin, Y.; Li, J.; Xia, L.; Chen, S.; Ma, H. Remote Sensing Estimates of Grassland Aboveground Biomass Based on MODIS Net Primary Productivity (NPP): A Case Study in the Xilingol Grassland of Northern China. Remote Sens. 2014, 6, 5368–5386. [Google Scholar] [CrossRef] [Green Version]
  29. Reeves, M.C.; Winslow, J.C.; Running, S.W. Mapping Weekly Rangeland Vegetation Productivity Using MODIS Algorithms. J. Range Manag. 2001, 54, A90–A105. [Google Scholar]
  30. Jenkins, J.C.; Birdsey, R.A.; Pan, Y. Biomass and NPP Estimation for the Mid-Atlantic Region (USA) using plot-level forest inventory data. Ecol. Appl. 2001, 11, 1174–1193. [Google Scholar] [CrossRef]
  31. Chapin, F.S., III; Matson, P.A.; Vitousek, P.M. Principles of Terrestrial Ecosystem Ecology, 2nd ed.; Springer: New York, NY, USA, 2011; p. 529. [Google Scholar]
  32. Running, S.W.; Nemani, R.R.; Heinsch, F.A.; Zhao, M.; Reeves, M.; Hashimoto, H. A Continuous Satellite-Derived Measure of Global Terrestrial Primary Production. BioScience 2004, 54, 547–560. [Google Scholar] [CrossRef]
  33. Turner, D.P.; Ritts, W.D.; Cohen, W.B.; Gower, S.T.; Running, S.W.; Zhao, M.; Costa, M.H.; Kirschbaum, A.A.; Ham, J.M.; Saleska, S.R.; et al. Evaluation of MODIS NPP and GPP products across multiple biomes. Remote Sens. Environ. 2006, 102, 282–292. [Google Scholar] [CrossRef]
  34. Zhang, Y.; Xu, M.; Chen, H.; Adams, J. Global pattern of NPP to GPP ratio derived from MODIS data: Effects of ecosystem type, geographical location and climate. Glob. Ecol. Biogeog. 2009, 18, 280–290. [Google Scholar] [CrossRef]
  35. Reeves, M.C.; Zhao, M.; Running, S.W. Applying improved estimates of MODIS productivity to characterize grassland vegetation dynamics. Range Ecol. Manag. 2006, 59, 1–10. [Google Scholar] [CrossRef]
  36. Heinsch, F.A.; Reeves, M.; Bowker, C.F. User’s Guide, GPP and NPP (MOD 17A2/A3) Products, NASA MODIS Land Algorithm. Available online: http://www.forestry.umt.edu/ntsg/ (accessed on 20 January 2020).
  37. Running, S.W.; Mu, Q.; Zhao, M. MOD17A3HGF MODIS/Terra Net Primary Production Yearly Gap-Filled L4 Global 500 m SIN Grid V006 [Data set]. NASA EOSDIS Land Processes DAAC. Available online: https://doi.org/10.5067/MODIS/MOD17A3HGF.006 (accessed on 31 October 2019).
  38. Jin, S.; Homer, C.; Yang, L.; Danielson, P.; Dewitz, J.; Li, C.; Zhu, Z.; Xian, G.; Howard, D. Overall methodology design for the United States Land Cover Database 2016 products. Remote Sens. 2019, 11, 2971. [Google Scholar] [CrossRef] [Green Version]
  39. Save, H. CSR GRACE RL06 Mascon Solutions. 2019, Texas Data Repository Dataverse. Available online: https://doi.org/10.18738/T8/UN91VR (accessed on 15 March 2020).
  40. Wiese, D.N.; Yuan, D.-N.; Boening, C.; Landerer, F.W.; Watkins, M.M. JPL GRACE and GRACE-FO Mascon Ocean, Ice, and Hydrology Equivalent Water Height Coastal Resolution Improvement (CRI) Filtered Release 06 Version 02. Ver. 02. PO.DAAC, CA, USA. 2019. Available online: https://doi.org/10.5067/TEMSC-3JC62 (accessed on 15 March 2020).
  41. Felix Landerer. CSR TELLUS GRACE-FO Level-3 Monthly Land Water-Equivalent-Thickness Surface Mass Anomaly Release 6.0 Version 03 in netCDF/ASCII/GeoTIFF Formats. Ver. RL06 v03. PO.DAAC, CA, USA. 2020. Available online: https://doi.org/10.5067/GFLND-3AC63 (accessed on 15 March 2020).
  42. ASA/JPL. Monthly Gridded Global Land Data Assimilation System (GLDAS) from Noah-v3.3 Land Hydrology Model for GRACE and GRACE-FO over Nominal Months. Ver. 3.3. PO.DAAC, CA, USA. 2020. Available online: https://doi.org/10.5067/GGDAS-3NH33 (accessed on 15 March 2020).
  43. Tiwari, V.M.; Wahr, J.S.; Swenson, S. Dwindling groundwater resources in northern India, from satellite gravity observations. Geophys. Res. Lett. 2009, 36, L18401. [Google Scholar] [CrossRef] [Green Version]
  44. Strassberg, G.; Scanlon, B.R.; Rodell, M. Comparison of seasonal terrestrial water storage variations from GRACE with groundwater-level measurements from the High Plains Aquifer (USA). Geophys. Res. Lett. 2007, 34, L14402. [Google Scholar] [CrossRef] [Green Version]
  45. Scanlon, B.R.; Zhang, Z.; Save, H.; Wiese, D.N.; Landerer, F.W.; Long, D.; Longuevergne, L.; Chen, J. Global evaluation of new GRACE mascon products for hydrologic applications. Water Resour. Res. 2016, 52, 9412–9429. [Google Scholar] [CrossRef]
  46. Hasan, E.; Tarhule, A.; Hong, Y.; Moore, B., III. Assessment of Physical Water Scarcity in Africa Using GRACE and TRMM Satellite Data. Remote Sens. 2019, 11, 904. [Google Scholar] [CrossRef] [Green Version]
  47. Hasan, E.; Tarhule, A.; Zume, J.T.; Kirstetter, P.E. +50 Years of Terrestrial Hydroclimatic Variability in Africa’s Transboundary Waters. Sci. Rep. 2019, 9, 12327. [Google Scholar] [CrossRef] [PubMed] [Green Version]
  48. Cleveland, W.S.; Devlin, S.J.; Grosse, E. Regression by Local Fitting. J. Econ. 1988, 37, 87–114. [Google Scholar] [CrossRef]
  49. Hamed, K.H.; Rao, A.R. A modified Mann-Kendall trend test for autocorrelated data. J. Hydrol. 1998, 204, 182–196. [Google Scholar] [CrossRef]
  50. Gilbert, R.O. Statistical Methods for Environmental Pollution Monitoring; Van Nostrand Reinhold Company: New York, NY, USA, 1987; p. 320. [Google Scholar]
  51. Scanlon, B.R.; Faunt, C.C.; Longuevergne, L.; Reedy, R.C.; Alley, W.M.; McGuire, V.L.; McMahon, P.B. Groundwater depletion and sustainability of irrigation in the US High Plains and Central Valley. Proc. Natl. Acad. Sci. USA 2012, 109, 9320–9325. [Google Scholar] [CrossRef] [PubMed] [Green Version]
Figure 2. Mean annual average total precipitation showing an increasing east-west gradient (a) and mean annual temperature showing an increasing north-south gradient (b). Data obtained from [23].
Remotesensing 12 02257 g002
Figure 3. Mean annual net primary production (NPP) for the period 2001 to 2018. Data obtained from [35].
Remotesensing 12 02257 g003
Figure 4. Net primary production (NPP) trend (a) and NPP trend significance level for the period 2001 to 2018 (b). (Forest and grassland are masked to better relate NPP to agriculture).
Remotesensing 12 02257 g004
Figure 5. Net primary production (NPP) positive and negative significant trends for the period 2001 to 2018. (Forest and grassland are masked to better relate NPP to agriculture).
Remotesensing 12 02257 g005
Figure 6. Mean annual total water storage (TWS). GRACE observations for the period 2002 to 2017 (a) and GRACE-FO observation for the period 2018–2019 (b).
Remotesensing 12 02257 g006
Figure 7. Temporal variability of TWS from 2002–2017 in two hotspot areas (northeast and southwest). Changes in Mu1 and Mu2 indicate regime-shifts in the TWS patterns over the two regions.
Remotesensing 12 02257 g007
Figure 8. TWS (a) and LWC (b) trends for the period 2002 to 2017. p values for TWS (c) and LWC (d) indicate significance level of the trend.
Remotesensing 12 02257 g008