Abstract
Accurate estimates of tree crop orchard age and historical crop area are important to develop yield prediction algorithms, and facilitate improving accuracy in ongoing crop forecasts. This is particularly relevant for the increasingly productive macadamia industry in Australia, where knowledge of tree age, as well as total planted area, are important predictors of productivity, and the area devoted to macadamia orchards is rapidly increasing. We developed a technique to aggregate more than 30 years of historical imagery, generate summary tables from the data, and search multiple combinations of parameters to find the most accurate planting year prediction algorithm. This made use of known planting dates of more than 90 macadamia blocks spread across multiple growing regions. The selected algorithm achieved a planting year mean absolute error of 1.7 years. The algorithm was then applied to all macadamia features in east Australia, as defined in an recent Australian tree crops map, to determine the area planted per year and the total cumulative area of macadamia orchards in Australia. The area estimates were refined by improving the resolution of the mapped macadamia features, by removing non-productive areas based on an optimal vegetation index threshold.
1. Introduction
The macadamia nut is indigenous to Australia, but is now grown in many places including Hawaii, Central America, and South Africa [1]. It accounts for ~2% of global tree nut consumption.
Crop yield prediction is important for growers and industry, as it guides marketing, finance and logistic decisions. Region-scale predictions rely on accurate estimates of crop productive area [2]. In addition, predicting the yield of tree crops also requires accurate estimates of tree age. For example, macadamias are typically unproductive until the tree is 5 years old, then productivity rises between 5 and 10 years, and plateaus for trees greater than 10 years old [3]. Other applications for historical planted area data for tree crops are to facilitate forecasts of future productivity and water resource usage at a regional or national level [4,5].
Estimates of crop productive area per year may be obtained from land cover maps based on automatic classification methods [6]. This is challenging for tree crops, where there are many trees with similar reflectance and phenological characteristics [7], such as macadamia, avocado, and mango trees in Australia. Another possibility is to use a fixed-time map of particular crops, for example, that provided by the 2017 Australian Tree Crop Rapid Response Map (ATCRRM) [8]. Then, using a planting date estimate within each of the identified locations, the newly planted area per year and total area per year can be calculated.
Predicting tree planting date from satellite imagery has been the subject of several studies. The authors of [9,10] estimated tree age using regression against reflectances measured by Landsat TM for oil palm and rubber plantations, respectively. The work in [11] estimated oil palm crown area from high-resolution WorldView-2 data, and tree age was then predicted from crown area.
Recent work has used satellite image time series (SITS) to detect features indicating the year trees were planted. Rubber plantations were classified into 5-year age categories using multiple vegetation indices by the authors of [12]. For the same crop, the work in [13] predicted the planting year by finding the last year an area was non-vegetated, indicated by the normalized difference moisture index (NDMI) being less than 0. The authors of [14] compared NDVI growth curves per-pixel to expected rubber tree characteristics to estimate tree age. The work in [15] found the maximum normalized difference vegetation index (NDVI) per year for fruit and nut orchards in the Central Valley, California. The mean and standard deviation of the resulting time series was computed, and planting year predicted based on when there was a significant “dip” in the time series, assuming that planting year is coincident with low NDVI due to removal of previous vegetation. Apple age was predicted by the authors of [16] by comparing typical apple phenological curves with those extracted from each known orchard area over previous years.
In this work, we consider the problem of determining the planting year of macadamia orchards, which is an important variable in yield prediction models [2]. We aim to predict the planting year of macadamia trees at the pixel scale, then apply these predictions to calculate total productive area per year across the macadamia industry in Australia. First, the study area is defined in Section 2. The methods used are described in Section 3, including remote sensing data preprocessing, plant-year detection algorithms, and how we apply the selected algorithm to estimate total productive area per year across Australia. Section 4 contains the results, including assessment of the accuracy of the optimal plant-year prediction algorithm, extraction of the productive macadamia area from a national fruit map, and prediction of the total macadamia area per-year and per-region in Australia. We then discuss the relationship of this work to other plant-year prediction work, the limitations of our method, and other possible methods that could be investigated in Section 5, before conclusions are drawn.
2. Study Areas
The majority (>99%) of Australia’s macadamias are grown on the east coast of Australia. One macadamia farm often includes numerous blocks. For the purpose of this study, we define a block as an area of a farm which has had its annual yields recorded. Often the trees within a block have identical planting date, variety, and density. This study included 95 macadamia blocks, belonging to nine orchards. The orchards are grouped in three important macadamia growing areas in Australia as shown in Figure 1. Block boundaries and planting year per block were obtained from the growers. Table 1 describes the number of blocks per region, along with the distribution of block sizes and planting years. The average block size is 6.9 hectares, and the average planting year is 2004. The total area of the study blocks is 653 hectares, which is more than 2.3% of the total 2017 Australia macadamia growing area, estimated by the ATCRRM.
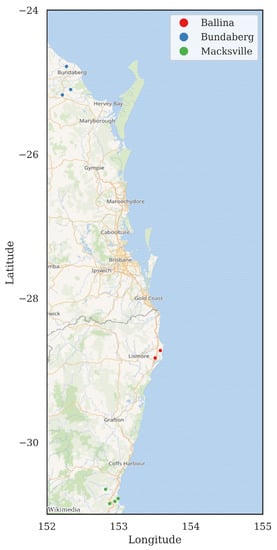
Figure 1.
Locations of the macadamia orchards (each encompassing multiple blocks), grouped into the three regions.

Table 1.
Distribution of blocks, block sizes, and planting years.
3. Methods
3.1. Remote Sensing Data Preprocessing
All surface reflectance image tiles from the Landsat-5, -7, and -8 satellites overlapping any of the blocks from 1988 to 2019 were accessed in Google Earth Engine (GEE, ref. [17]). Areas indicated as being influenced by shadow or cloud were masked. Normalized Difference Spectral Indices (NDSIs) are defined as a function of two reflectances bands, and :
We calculated all NDSIs formed as combinations of the green (G), red (R), and near-infrared (NIR) bands, which are related to tree health [18,19]. In addition to these, we calculated two NDSIs using the shortwave infrared bands (SWIR1 and SWIR2) that have been used in tree age determination in other studies [13]. The NDSIs are defined in Table 2 and were calculated per-pixel for all images.
Table 2.
Normalized Difference Spectral Index (NDSI) definitions using Equation (1), which were calculated for each satellite image.
Thirty-two yearly images (1988–2019) were produced, by aggregating the yearly minimum, mean, median, and maximum of each NDSI for each pixel. The total count of images with unmasked pixels over each block for each year was also computed. The minimum number of images in a year for any of the 95 blocks was 5, and the mean number of images per year over all blocks and years was 19.
Finally, for each year, the median value of the yearly NDSI aggregate images within each block was found. The spatial median was used instead of the mean, to avoid outlying pixels (for example, those lying on block boundaries) with high or low values skewing the data. This resulted in a table with 3040 rows (32 years × 95 blocks). Table columns included the block identifier, block planting year and all NDSI yearly aggregates (e.g., , , , , , etc.).
3.2. Search for Optimal Plant-Year Prediction Algorithm
A search was run using the data in the table described above to find the optimal algorithm to predict planting year. We first tried methods that seek a year where vegetation was removed. We tried all NDSIs and annual aggregates (min, mean, median, and max), searching for a fixed threshold [13], and a z-score (mean − z × standard deviation of the NDSI time series [15]) that could predict planting year. However, because of variable delays between vegetation clearing and tree planting, and variation in pre-planting vegetation removal across the macadamia industry in Australia, these methods were not promising.
We therefore propose an alternative threshold method, which attempts to find the most recent year that an NDSI crosses a fixed threshold, due to growth of newly planted trees. The method is illustrated in Figure 2, and described by the equation and description below.
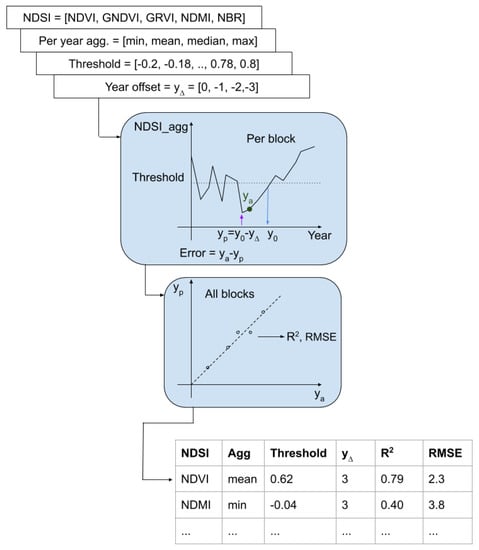
Figure 2.
Search for optimal planting year prediction algorithm, by sweeping over all NDSIs, thresholds, and deltas, and finding RMSE and between predicted () and actual () planting years.
- The time-series for each NDSI and annual aggregation was searched backwards to find the most recent year where the NDSI fell below a predefined threshold. This year is designated . If a crossing was not found, the earliest year of the imagery (1988) is assigned.
- A delta was subtracted to find the predicted planting year .
- All unique NDSIs, aggregations, thresholds (from −0.2 to 0.8), and year deltas were tried, each combination called a parameter set.
- For each parameter set, the root mean squared error (RMSE) of the actual plant year vs predicted plant year over the 95 blocks was calculated. RMSE was used instead of mean absolute error (MAE) to rank the parameter sets, as it penalizes larger errors more.
- The parameter set that produced the lowest RMSE was selected.
3.3. Creating a Productive Macadamia Area Mask
The Australian Tree Crop Rapid Response Map (ATCRRM) [8] provides vector features of all avocado, mango, and macadamia orchards in Australia, with a minimum mapping unit of 2 hectares, current at 2017. We accessed the shapefile, then filtered and retained only macadamia features on the east coast of Australia. Features often encompass large farms, or several farms. They thus include non-productive areas such as roads, houses, dams, and very recently planted blocks. To determine the actual productive macadamia area, we created a mask, retaining only pixels with a selected NDSI above a threshold. The method to select the NDSI and threshold are now described.
The features from the ATCRRM that intersect the 95 study blocks were selected. Two multi-polygons were then calculated:
- The polygons that exactly delineate the blocks used in this study, which we define as productive macadamia areas.
- The geometric difference between the features from the ATCRRM that overlap the study macadamia blocks, and the geometries of these blocks. The resulting multi-polygon areas are outside the actual macadamia tree blocks (but inside the corresponding ATCRRM macadamia feature) and so are defined as the non-productive areas.
The productive area mask made use of all Sentinel-2 surface reflectance images from 2019 intersecting the above polygons. Sentinel-2 was used instead of Landsat images to take advantage of the 10 meter resolution. The NDSIs defined in Table 2 were computed, and an aggregate image (minimum, mean, median, and maximum per-pixel) from the 2019 image collection was produced.
The pixels of this aggregate image from within the non-productive and productive multi-polygons were sampled, and a table of all the NDSIs for these two classes produced. A threshold for each NDSI was found, such that NDSI values above this threshold included 90% of the productive area pixels (resulting in a 10% omission error, i.e., productive macadamia area pixels that are misclassified as non-productive). Then, for each of these NDSI threshold combinations, the proportion of pixels from the non-productive samples above the threshold was computed (which is the commission error, i.e., proportion of non-productive pixels that are included in the productive class). The NDSI threshold combination that gave the lowest commission error was selected. This mask could then be applied to the 2019 Sentinel-2 aggregate images intercepting the ATCRRM macadamia features over the whole growing region of the east of Australia. The area of the macadamia features with the mask applied gives an estimate of the actual productive area of macadamias in 2017 (the year of the ATCRRM).
3.4. Computing the Historical Area of Macadamia Orchards Per Year
It is now possible to compute a yearly estimate of total macadamia area. In GEE, the yearly aggregate Landsat images are used together with the optimal planting year prediction algorithm to calculate the planting year for all pixels within the ATCRRM macadamia features. The total area was computed with and without the productive area mask applied. Previous versions of regional yield estimation have not used this mask [2], but it is expected that using the mask will enhance prediction accuracy.
Within many of the ATCRRM macadamia features, there are multiple planting dates. Therefore, simply assigning a single median planting date to each feature will not produce accurate results so area computations were done pixel-by-pixel. To find the newly planted area for a given year we did the following.
- Selected all macadamia features from the ATCRRM.
- Optionally, mask non-productive areas (Section 3.3).
- Selected all pixels with predicted planting year equal to the given year.
- Summed the area of all these pixels.
The result is a table with a row for each year, and the total area planted in that year as columns. This was further be broken down into regional areas in separate columns to enable per growing region area prediction. The cumulative sum of the area columns in this table produces the total area planted up until and including each year.
4. Results
4.1. Optimal Plant-Year Prediction Model
Examples of the annual mean of NDVI for three blocks, one from each of the three study regions, are shown in Figure 3. The red vertical line shows the actual planting year as recorded by the growers. The figure highlights some challenges with macadamia planting year prediction.
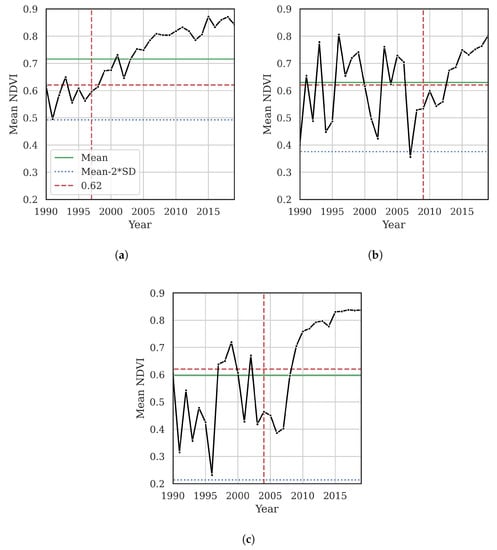
Figure 3.
Mean NDVI per year for three macadamia blocks. Actual planting year is indicated by the vertical red line, the selected threshold of by the horizontal red lines, time-series mean by the green lines, and mean − 2 × SD by the blue lines. One example from each of the three regions is shown: (a) Macksville, (b) Ballina, and (c) Bundaberg.
- In Figure 3a, there is no significant dip in the NDVI around the planting year, which appeared common for the Macksville region. This may be due to grower practices, such as less extensive vegetation removal before planting. The orchards in that region are relatively old, so that the time series statistics are weighted towards post-planting characteristics.
- In Figure 3b, there is a significant drop in vegetation in 2007, and NDVI drops to below the mean − 2 × SD in that year. However, planting did not occur until two years later. Discussion with growers revealed that planting can be delayed due to cash flow, weather and tree availability. In case of planting occurring after clearing, grass can regrow before planting, thus causing a rise in NDSIs which is not due to tree growth.
- In Figure 3c, there is large variation in the annual mean NDVI before planting macadamias, probably indicating annual cropping where fields are left fallow some years and have crops with high NDVI in other years. This leads to a very large standard deviation in the time series, so reduced probability that planting will coincide with a significant deviation from the mean.
We tested a similar z-score method to that proposed in [15], but because of the large variation in planting practices noted above, the z-score had to be as small as 1 to find the planting year consistently. Similarly, other approached of finding the most recent year with no vegetation (e.g., NDMImin < 0 in [13]) could not find planting year consistently, because there was often vegetation present in the year the macadamia trees were planted. Therefore, we focused on the threshold method depicted in Figure 2.
A total of parameter sets were tested (five NDSIs, with four yearly aggregations, four year offsets × 51 thresholds) to find the best set using the threshold method. The plant year prediction RMSE of two example parameter combinations ((NDMI,) and (NDVI,)) with swept NDSI threshold are shown in Figure 4. Each point on each curve summarizes the prediction RMSE for the 95 blocks.
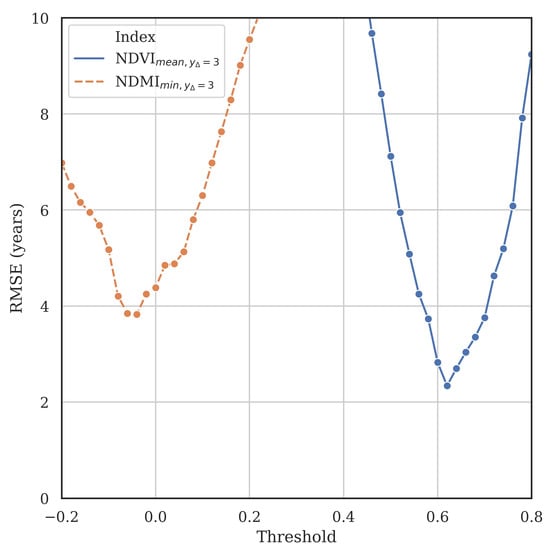
Figure 4.
Search for optimal plant-year prediction algorithm by minimizing prediction error. Two of the 80 parameter sets are shown, including the best set (NDVI with a threshold of 0.62).
The best results were achieved using NDVI, with a threshold of 0.62. This is the selected parameter set for the rest of the study, and produced an RMSE of 2.3 years and MAE of 1.7 years. To find the planting date for each block, the time series (such as shown in Figure 3) is searched backwards to find when most recently dropped below 0.62, then subtracting 3 years from this. This indicates the average for a 3-year-old orchard is 0.62.
To assess stability of the optimal parameters considering regional differences, the planting year prediction algorithm search was run for the blocks from each of the three study regions independently. The best three parameter sets from each region are shown in Table 3. In all cases, the best parameter set was exactly the same as when the data from all regions was pooled, NDVI with a threshold of 0.62. This is equivalent to training a model on a subset of regions, and holding out a test set from a separate region. The consistency of the selected optimal parameter set gives confidence in the ability of the algorithm to be generalized to other areas. The RMSE was 2.8, 2.5, and 1.7 years for the Ballina, Bundaberg, and Macksville regions, respectively.
Table 3.
Best 3 parameter sets when the optimal parameter search was performed per region.
A regression plot of actual vs. predicted planting year for the 95 blocks is shown in Figure 5. The largest prediction error was for a block that was actually planted in 1998, but the prediction was 1988. Investigation of the data revealed that the minimum NDVI was 0.63 in 1996. The value never dropped below 0.62, so the algorithm predicted the earliest possible year (1988). This could be due to an unusually large amount of vegetation being present around planting. More than 75% of the plant year prediction errors are 2 years or less, and only 7.5% of the errors are 4 years or more.
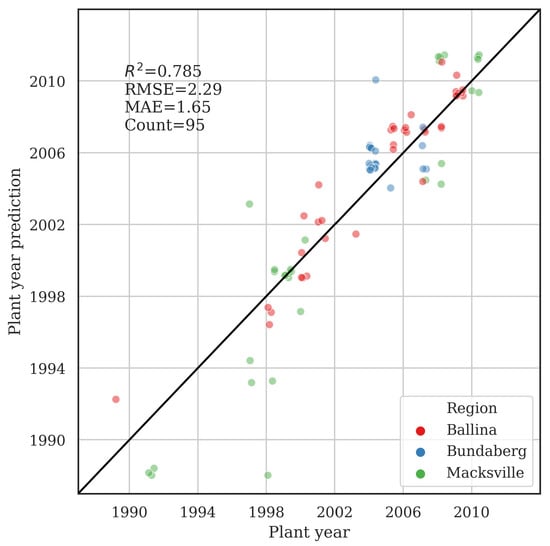
Figure 5.
Predicted vs. actual planting year, using the best algorithm with NDVI with a threshold of 0.62. Slight jitter has been added to the x and y values of each point so multiple points lying on the same co-ordinates are visible.
4.2. Generating a Productive Macadamia Area Mask
Having developed a plant-year prediction algorithm, we then sought to apply this to the whole macadamia industry in Australia. The ATCRRM macadamia features are coarse due to aggregating areas smaller than 2 hectares, so many macadamia features include non-productive areas (roads, infrastructure, etc.). An example macadamia feature is shown in orange in Figure 6a, with the actual block boundaries drawn in green.
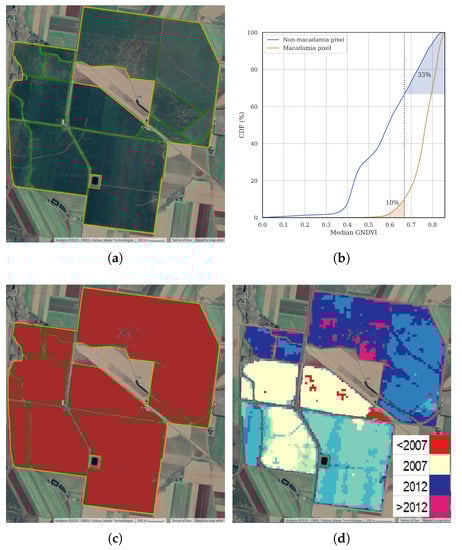
Figure 6.
(a) Example Bundaberg macadamia orchard, with the ATCRRM feature shown in orange, and block boundaries in green. (b) Cumulative distribution plot showing proportion of pixels inside and outside macadamia areas as a function of . (c) The productive area mask for the Bundaberg example, and (d) per-pixel planting year prediction.
The 2019 Sentinel-2 pixels from the blocks used in this study were sampled (productive areas), as well as areas outside the blocks but still inside the features (non-productive areas). Figure 6b shows the cumulative density function of the annual median GNDVI pixels inside and outside the macadamia blocks. GNDVI values greater than 0.668 include 90% of the productive area pixels (10% omission error). On the other hand, the commission error is 33%, which is the proportion of non-macadamia pixels included. A similar search was run using all NDSIs to find the threshold giving an omission error of 10%. GNDVI was the optimal NDSI and threshold, other NDSIs gave larger commission errors.
The results of applying this mask to the example feature is shown in Figure 6c. The mask successfully removes roads, boundaries, and houses. The mask does omit some pixels from actual macadamia blocks. However, as discussed in [20], macadamia yield is strongly correlated with NDSIs such as GNDVI. Therefore, areas with low NDSI likely correspond to trees that are less productive and contribute less to the overall yield and so these omission errors would not have a significant impact on yield predictions.
The planting year predictions (masked by the productive area mask) are shown for the same feature in Figure 6d. There are a variety of planting dates within the one ATCRRM feature, leading to the importance of using a per-pixel calculation of area planted per year, rather than simply taking the median planting year and assigning this to the total feature area.
4.3. Historical Total Planted Area Per Growing Region
Having developed an algorithm to predict macadamia planting year, and a mask to remove unproductive areas from each macadamia feature of the ATCRRM, it is now possible to estimate total area of macadamia trees planted each year across the east of Australia. GEE enables the collection of 32 years of Landsat images for plant-year prediction, 1 year of Sentinel-2 images for mask generation, and all the aggregations and geospatial calculations to produce such results quickly. Planting year maps such as shown in Figure 6d can be calculated and displayed in a browser in real-time, and national area calculations can be finished in hours.
The total macadamia area planted in Australia each year was estimated, and saved as a data table, as described in Section 3.4. A similar table was produced with columns separating each of the major growing regions. The planted area per year and the total cumulative area are shown in Figure 7 for the whole of Australia, and for the Bundaberg region alone. The trend in Bundaberg shows plantings increasing significantly around 2005–2010, and again after 2015. The productive area curves are generated using the pixel mask described in the previous section. These curves do not show the uptick in area in 2017, as the mask was generated from 2019 imagery and the young trees may not have reached the productivity threshold by that year.
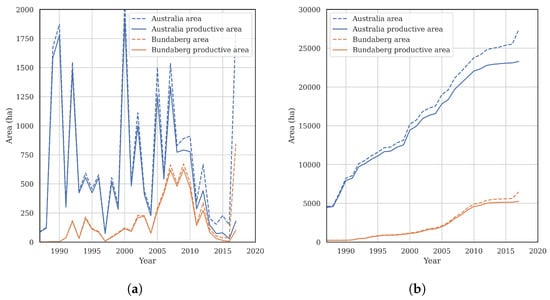
Figure 7.
Estimates of macadamia area in all Australia and just the Bundaberg region, both with and without the productive area mask applied. (a) Planted per year and (b) cumulative area.
5. Discussion
This work developed techniques that can be used by industry to determine planted macadamia area per year over large regions. We noted the variability in planting conditions, non-macadamia vegetation that sometimes is growing before planting, and variable delays between vegetation clearing and planting. This led us to reject the use of algorithms which search for dips in NDSI time series, and to instead find an optimal algorithm that defines an NDSI threshold corresponding to the average NDSI of trees of a particular age (in our case, three years old). In contrast, other works have been able to predict planting dates from significant dips in the time series for rubber tree [13] and a variety of fruit and nut crops in California [15], presumably due to more uniform practices around planting than those seen for the macadamia industry in Australia. Despite the variability we observed in the observed NDSI growth curves of the macadamia blocks used in this study, the optimum plant-year algorithm was consistent across growing regions.
This work relied on the ATCRRM, a national commodity-level map [8], that gives a snapshot of total crop area in a single year. This was combined with automatic per-pixel plant year estimation, and non-productive area masking, to calculate newly planted and total macadamia area per year. Given the rate of increase of macadamia planted area in Australia, to ensure ongoing currency of area estimates, such maps will need to be updated regularly. There is an effort at present to update the ATCRRM to 2020, and also to reduce the minimum mapped feature to 1 hectare. Other recent efforts have made use of machine learning [7] and convolutional neural network techniques [21] to map specific tree crops. This could potentially be performed annually to provide up-to-date area estimates. However, using such methods to distinguish between many tree crops with similar reflectance, phenelogical, and structural characteristics is challenging. Work is still needed to understand the required spatial and temporal resolutions to achieve required accuracies [22]. Historical imagery is limited in resolution, so it may not be feasible to use these land cover classification techniques to produce historical commodity-level area estimates.
We used Landsat images, which are of high radiometric quality and have the required historical database, but the 30 meter resolution could be a limitation. While this resolution is reasonable to ensure sufficient pixels covering macadamia blocks of typical sizes, determining planting date for smaller blocks may be difficult due to a significant number of boundary pixels having mixed characteristics. Moreover, it is possible that variation in the vegetation between tree rows could be a source of non-negligible planting year prediction errors [11], as these vary between orchards and regions. Row spacings in macadamia plantations in Australia are typically 4–10 m. These effects cannot be easily characterized or removed using the 30 meter pixel resolution, which leads to higher prediction uncertainty.
6. Conclusions
In this study, we found that due to variation in macadamia pre-planting land preparation practices across Australia, planting year prediction methods relying on finding the year land was cleared were not accurate. Instead, we determined the year when trees reached a certain age, indicated by a selected vegetation index crossing a threshold, which then enabled calculating the planting year. The optimal vegetation index, threshold, and age was found using a search algorithm. The prediction mean absolute error was 1.7 years and root mean squared error (RMSE) was 2.3 years for all regions. The RMSE varied from 1.7 to 2.8 years between regions. The best plant year prediction algorithm was identical between the regions, indicating the robustness of the technique when generalizing to other areas. The algorithm was applied to the macadamia industry in Australia, determining the planted area per year from 1988–2017. The outputs of this work are suitable for use in current industry-wide macadamia yield prediction programs.
Author Contributions
J.B.: Methodology, Validation, Formal analysis, Data curation, Writing—Original Draft. A.J.R.: Conceptualization, Writing—Review and Editing, Funding acquisition. All authors have read and agreed to the published version of the manuscript.
Funding
This research was funded by the Australian Government Department of Agriculture and Water Resources as part of its Rural Research and Development for Profit program, and Horticulture Innovation Australia Ltd., grant number ST19008 (Multi-scale Monitoring Tools for Managing Australian Tree Crops—Phase 2).
Acknowledgments
The authors are grateful for the support of the Australian Macadamia Society, and for helpful discussions with David Mayer, Chris Searle, Janus Erasmus, and data from collaborating macadamia growers including Macadamias Australia, Chris Cook of Dymocks Farm and Graham Wessling of LNL Australia Pty Ltd.
Conflicts of Interest
The authors declare no conflicts of interest.
References
- Stephenson, R. Macadamia: Domestication and commercialization. Chron. Hortic. 2005, 45, 11–15. [Google Scholar]
- Mayer, D.G.; Chandra, K.A.; Burnett, J.R. Improved crop forecasts for the Australian macadamia industry from ensemble models. Agric. Syst. 2019, 173, 519–523. [Google Scholar] [CrossRef]
- Mayer, D.G.; Stephenson, R.A.; Jones, K.H.; Wilson, K.J.; Bell, D.J.D.; Wilkie, J.; Lovatt, J.L.; Delaney, K.E. Annual forecasting of the Australian macadamia crop—Integrating tree census data with statistical climate-adjustment models. Agric. Syst. 2006, 91, 159–170. [Google Scholar] [CrossRef]
- Blatchford, M.L.; Mannaerts, C.M.; Zeng, Y.; Nouri, H.; Karimi, P. Status of accuracy in remotely sensed and in-situ agricultural water productivity estimates: A review. Remote Sens. Environ. 2019, 234, 111413. [Google Scholar] [CrossRef]
- Schauer, M.; Senay, G.B. Characterizing Crop Water Use Dynamics in the Central Valley of California Using Landsat-Derived Evapotranspiration. Remote Sens. 2019, 11, 1782. [Google Scholar] [CrossRef]
- Howard, D.M.; Wylie, B.K. Annual Crop Type Classification of the US Great Plains for 2000 to 2011. Photogramm. Eng. Remote Sens. 2014, 80, 537–549. [Google Scholar] [CrossRef]
- Brinkhoff, J.; Vardanega, J.; Robson, A.J. Land Cover Classification of Nine Perennial Crops Using Sentinel-1 and 2 Data. Remote Sens. 2020, 12, 96. [Google Scholar] [CrossRef]
- Shephard, C.; McKechnie, J. 2017 Australian Tree Crop Rapid Response Map. State of Queensland (Department of Science, Information Technology and Innovation). Available online: https://qgsp.maps.arcgis.com/home/item.html?id=17213a10236f465590fe80d4298e5256 (accessed on 25 May 2020).
- McMorrow, J. Linear regression modelling for the estimation of oil palm age from Landsat TM. Int. J. Remote Sens. 2001, 22, 2243–2264. [Google Scholar] [CrossRef]
- Chen, B.; Cao, J.; Wang, J.; Wu, Z.; Tao, Z.; Chen, J.; Yang, C.; Xie, G. Estimation of rubber stand age in typhoon and chilling injury afflicted area with Landsat TM data: A case study in Hainan Island, China. For. Ecol. Manag. 2012, 274, 222–230. [Google Scholar] [CrossRef]
- Chemura, A.; van Duren, I.; van Leeuwen, L.M. Determination of the age of oil palm from crown projection area detected from WorldView-2 multispectral remote sensing data: The case of Ejisu-Juaben district, Ghana. ISPRS J. Photogramm. Remote Sens. 2015, 100, 118–127. [Google Scholar] [CrossRef]
- Kou, W.; Xiao, X.; Dong, J.; Gan, S.; Zhai, D.; Zhang, G.; Qin, Y.; Li, L. Mapping Deciduous Rubber Plantation Areas and Stand Ages with PALSAR and Landsat Images. Remote Sens. 2015, 7, 1048–1073. [Google Scholar] [CrossRef]
- Beckschäfer, P. Obtaining rubber plantation age information from very dense Landsat TM & ETM+ time series data and pixel-based image compositing. Remote Sens. Environ. 2017, 196, 89–100. [Google Scholar] [CrossRef]
- Chen, G.; Thill, J.C.; Anantsuksomsri, S.; Tontisirin, N.; Tao, R. Stand age estimation of rubber (Hevea brasiliensis) plantations using an integrated pixel- and object-based tree growth model and annual Landsat time series. ISPRS J. Photogramm. Remote Sens. 2018, 144, 94–104. [Google Scholar] [CrossRef]
- Chen, B.; Jin, Y.; Brown, P. Automatic mapping of planting year for tree crops with Landsat satellite time series stacks. ISPRS J. Photogramm. Remote Sens. 2019, 151, 176–188. [Google Scholar] [CrossRef]
- Zhu, Y.; Yang, G.; Yang, H.; Wu, J.; Lei, L.; Zhao, F.; Fan, L.; Zhao, C. Identification of Apple Orchard Planting Year Based on Spatiotemporally Fused Satellite Images and Clustering Analysis of Foliage Phenophase. Remote Sens. 2020, 12, 1199. [Google Scholar] [CrossRef]
- Gorelick, N.; Hancher, M.; Dixon, M.; Ilyushchenko, S.; Thau, D.; Moore, R. Google Earth Engine: Planetary-scale geospatial analysis for everyone. Remote Sens. Environ. 2017, 202, 18–27. [Google Scholar] [CrossRef]
- Gitelson, A.A.; Kaufman, Y.J.; Merzlyak, M.N. Use of a green channel in remote sensing of global vegetation from EOS-MODIS. Remote Sens. Environ. 1996, 58, 289–298. [Google Scholar] [CrossRef]
- Motohka, T.; Nasahara, K.N.; Oguma, H.; Tsuchida, S. Applicability of Green-Red Vegetation Index for Remote Sensing of Vegetation Phenology. Remote Sens. 2010, 2, 2369–2387. [Google Scholar] [CrossRef]
- Robson, A.; Rahman, M.M.; Muir, J.; Saint, A.; Simpson, C.; Searle, C. Evaluating satellite remote sensing as a method for measuring yield variability in Avocado and Macadamia tree crops. Adv. Anim. Biosci. 2017, 8, 498–504. [Google Scholar] [CrossRef]
- Clark, A.; McKechnie, J. Detecting Banana Plantations in the Wet Tropics, Australia, Using Aerial Photography and U-Net. Appl. Sci. 2020, 10, 2017. [Google Scholar] [CrossRef]
- Peña, M.A.; Liao, R.; Brenning, A. Using spectrotemporal indices to improve the fruit-tree crop classification accuracy. ISPRS J. Photogramm. Remote Sens. 2017, 128, 158–169. [Google Scholar] [CrossRef]
© 2020 by the authors. Licensee MDPI, Basel, Switzerland. This article is an open access article distributed under the terms and conditions of the Creative Commons Attribution (CC BY) license (http://creativecommons.org/licenses/by/4.0/).