Abstract
Applications of machine learning on remote sensing data appear to be endless. Its use in damage identification for early response in the aftermath of a large-scale disaster has a specific issue. The collection of training data right after a disaster is costly, time-consuming, and many times impossible. This study analyzes a possible solution to the referred issue: the collection of training data from past disaster events to calibrate a discriminant function. Then the identification of affected areas in a current disaster can be performed in near real-time. The performance of a supervised machine learning classifier to learn from training data collected from the 2018 heavy rainfall at Okayama Prefecture, Japan, and to identify floods due to the typhoon Hagibis on 12 October 2019 at eastern Japan is reported in this paper. The results show a moderate agreement with flood maps provided by local governments and public institutions, and support the assumption that previous disaster information can be used to identify a current disaster in near-real time.
1. Introduction
Floods produce significant socioeconomic impacts [1,2,3]. A great deal of urban areas are located in floodplains with a high risk of floods [4]. A recent study on river flood discharge in Europe says climate change has led to increasing river floods in certain regions and decreasing in others [5]. These changes in flood discharge have relevant implications in flood risk analysis. A flood map extent is a primary necessity for damage assessment. Field survey-based flood maps might not be feasible because of the inaccessibility of the area and the human exposure to the hazardous area. Remote sensing can provide data on flood extent [6,7]. Applications of remote sensing on tsunami-based floods are summarised in [8]. It is worth noting that optical satellite imagery might be covered by clouds during the period of heavy rainfall, and thus, its contribution for flood mapping might be limited. However, a recent study pointed out that the large amount of optical satellite imagery, together with other spectral bands, represents a great advantage for flood mapping and time-series flood analysis [9,10]. SAR imagery is designed to penetrate clouds. In addition, it is very sensitive to water and it is capable to collect data independent of time of day. Therefore, SAR imagery is perhaps the most effective technology for flood extent identification.
Supervised machine learning has been extensively applied for to identify the effects of tsunami floods in the built-up environment [11,12,13,14,15] and its great success in terms of accuracy is undeniable. However, for operational purposes supervised machine learning is limited by the lack of training data. Some efforts to overcome the referred issue has been performed. From SAR images, the clear physical mechanism of the microwaves to discriminate flooded and non-flooded areas has been exploited greatly. In floodplain areas, for instance, the water bodies produce specular reflection, and thus, the returned radar pulse is very low. That is to say, dark tones in the SAR intensity image. Therefore, most of the studies on flood identification use the backscattering intensity, either extracted from the pixel or averaged from an area defined from an arbitrary object-based-algorithm, as the solely input to discriminate flooded and non-flooded areas. In such cases, thresholding method of SAR intensity imagery is perhaps the simplest, but the fastest and the most efficient method to map water bodies [16,17,18]. Different strategies have been proposed to define the threshold. In [17,19] the histogram of permanent water bodies and/or land areas were used as training data to set the SAR intensity threshold. Unsupervised classification methods been applied as well. It is worth noting that in most cases, the disaster-affected area represents a small fraction of the area covered by a satellite image. Thus, a direct application of binary unsupervised classification method over the complete image would lead to an unbalanced data set problem. To overcome the unbalanced data problem, the image is split into subimages [18,20,21] and the threshold is estimated in each subimage that exhibit a bi-modal distribution. This procedure is referred as tile-based thresholding. In [22], the tile-based thresholding is used as a first estimation. Then, a refinement is performed using a fuzzy logic based algorithm. In [23], the Bayes theory was applied to compute a probabilistic flood map. It performed a pixel based analysis. That is to say, the probability that a pixel belong to the set of flooded pixels, F, given its backscattering intensity value, I, , is computed. It was assumed that the set F and its complement (i.e., the set of non-flooded pixels) follow Gaussian distributions; furthermore, the priors were set to . The referred study represent one of the first attempt to provide the uncertainties associated with the SAR-based flood mapping processing chain. However, the study area was manually cropped in order to overcome the unbalanced data set issue. In [24], the Bayes theory was employed in a tile-based approach. Using electromagnetic scattering model, a set of thresholds to identify floods in bare soil, agricultural land, and forest areas is proposed in [25]. Electromagnetic scattering model-based thresholds are also used in [26], which also used hydrodynamic models to monitor the natural drainage of the floodplain, an extremely relevant information for recovery phase.
In urban and rural areas, the joint effect of the double bounce and specular reflection makes the interpretation of microwave images more challenging. It has been pointed out that flood extent is recognized from medium-resolution (about 15 m resolution) microwave imagery by searching for stronger backscattering intensity than the backscattering intensity from adjacent non-flooded areas. On the other hand, in high resolution microwave images, like the stripmap mode of TerraSAR-X, dark tones are observed in specific flooded locations, such as wide roads and streets, because of the solely effect of specular reflection mechanism. Unfortunately, dark tones produced by radar-shadow is a handicap to the flood mapping chain process in urban areas [4,27,28]. Radar-shadow refers to the areas where the radar-pulses were unable to reach, as consequence of the side looking nature of SAR, because of obstructions of objects like buildings. Shadow-radar-based dark tones could be identified in advance from a digital surface models and a SAR simulator [4]; then, it can be filtered out from the SAR-based flood map. In addition, using a reference image recorded before the flood, a single difference can be used to discriminate shadow-radar and specular-reflection based dark tones [28].
As already stated, most of the studies on flood identification use the backscattering intensity. There are, however, some studies that used additional features such as coherence [29], texture [30], semantic labels [31], different sensor images [14], and phase correlation [15]. A high dimensional feature space requires, however, a more complex discriminant function, and, as stated previously, its calibration requires training data. For the case of tsunami-based floods, near-real time frameworks that uses numerical tsunami models, statistical damage functions, and remote sensing is proposed in [32,33]. An additional, and more intuitive, solution for the lack of training data is the use of data collected from previous disasters. The fully application of this approach requires collection of training data from different available sensors (i.e., microwave, optical, multispectral), under different acquisition conditions (i.e., polarization, incident angle, etc.), should consider the effect of seasonal variation of the target areas on the imagery, need to consider variations in building typologies, and the different nature of disasters (i.e., earthquake, landslide, tsunami, floods). However, given the number of satellite constellations and the open access to many of them, it is expected that such approach will be one of the solutions. Pioneering studies are reported in [9], from which multispectral data from Landsat TM, ETM+, OLI, and Sentinel-2 were collected to train a U-Net convolutional neural network (CNN).
In this study, a machine learning classifier is calibrated from SAR-based features collected during the 2018 western Japan floods. Then, we evaluate the performance of the classifier in detecting floods induced by the 2019 Hagibis typhoon. Note that the two events are heavy-rainfall-based flood, and occurred in the same country. Thus, the areas share the same building material and typology. There are, however, certain contrast between the two events. Take for instance the intensity of the disaster. It is unfeasible, and perhaps impossible considering that one of the events occurred recently, to find two event with the same intensity. Thus, although the two event are similar in certain aspects, the two events are not 100% comparable. The study focuses the attention in urban areas. The interferometric coherence computed before and during the events are used as a bi-dimensional feature space. The rest of this manuscript is structured as follows: The next section introduces the floods that occurred in both the 2018 heavy rainfall and the 2019 Hagibis typhoon, and the SAR images recorded during the referred events. Section 3 introduces the feature space, the training data, and the calibrated discriminant functions. Section 4 provides the flooding map and a quantification of its accuracy. In Section 5 the concluding remarks are drawn.
2. Study Area and Dataset
From about 28 June to 11 July 2018, the Japanese Prefectures of Hiroshima and Okayama, were hit by a heavy rainfall produced by the convergence of the weather front and the typhoon Prapiroon [34]. The total rainfall in the referred period was 2–4 times the average value for July. It was reported 220 casualties, nine missing and 381 injured people. Furthermore, thousands of houses were collapsed, partially damaged and flooded [35].
About a year later, on 12 October 2019, the typhoon Hagibis landed Japan and produced several floods in eastern region. As of 29 October 2019, 91 casualties, 10 missing, and 465 injured people were reported. Furthermore, 4044 destroyed, 5307 partially damaged, and 70,270 flooded houses were reported [36]. It has been pointed out that the 2018 heavy rainfall lasted more than 72 h, while the 2019 heavy rainfall lasted only about 24 h. Thus, the Hagibis typhoon-induced heavy rainfall was considered stronger than that from the 2018 event [37].
C-band SAR images provided by the Sentinel-1 constellation are used in this study. Table 1 indicates the acquisition dates of the images. The images are grouped according to their common location into four sets, TR, PR1, PR2, and PR3, as depicted in Figure 1. Each set consists of three images. For every set, one image was recorded just after a heavy rainfall event, hereafter referred to as post-event image, and the other two images were recorded before the referred event, hereafter referred as pre-event images. The TR-set consists of images associated to the 2018 western Japan floods. The training data is going to be collected (hence the acroynm TR) from this set. It contains the town of Mabi, which was flooded during the 2018 heavy rainfall. The inset of Figure 1 shows the flooded area provided by the Geospatial Information Authority of Japan (GSI) [38]. The sets PR1, PR2, and PR3 contain images that are associated to the 2019 Hagibis typhoon, and therefore, the areas from which the floods are going to be predicted (hence the acroynm PR). The post event images from PR1 and PR2 were recorded right after the Hagibis typhoon left Japan. The post-event image from PR3 was recorded about 5 days after the floods. To the best of our knowledge, the post-event images from PR1 and PR2 were recorded and provided for early disaster response. A remarkable achievement from Sentinel-1 constellation is that within any set, the three images were recorded within a period of less than a month. The relevance of the short time-baseline and the acquisition condition of the images is that most of the changes observed between the post-event and the pre-event images are associated to the effect of the heavy rainfall. In addition, the images of each set share the same adquisition conditions, such as orbit path and incident angle. Note also that all images were recorded in VV polarization.

Table 1.
Acquisition dates of the imagery used in this study.
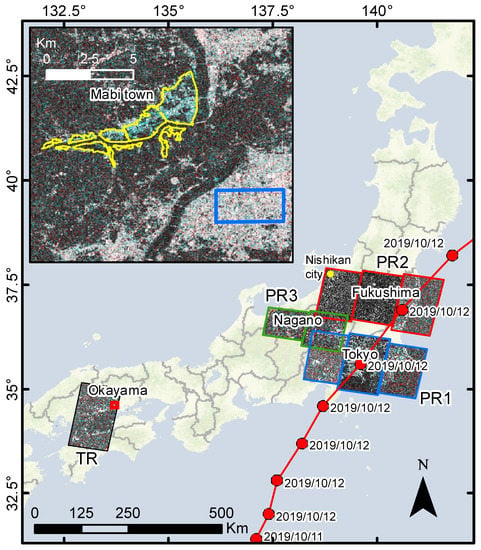
Figure 1.
RGB color composite of co-event (R) and pre-event (G and B) coherence images. PR1, PR2, and PR3 are the areas where the predictions of floods associated with the 2019 Hagibis typhoon are intended. The yellow mark within PR2 denotes the location of the city of Nishikan, Niigata Prefecture. TR denotes the area associated with the 2018 western Japan floods, from which the training data is collected. The inset denotes a close-up of the flooded area in the town of Mabi, Okayama Prefecture. The yellow polygon indicates the extension of the flooded area. The blue rectangle is an instance of a non-flooded urban area.
On 15 October 2019, the GSI published a flood estimation map from the information collected until 13 October [39]. The map was elaborated based on aerial images and height elevation data. The estimation considered the topographic elevation as a reference to calculate inundation depth values within the affected area. The actual values may differ from the ones presented in the map; however, the extension of the inundated area should have less inaccuracies. In addition to the inundation maps provided by GSI, a preliminary inundation map of the city of Iwaki was released in a press conference by the Mayor of the city [40] in 30 October 2019. The inundation map was elaborated by the local officers through field reconnaissance. The map corresponds to the situation after heavy rains following the 12th and 13th of October, 2019. The effects from floods of subsequent rain events, such as from 25th October, are not included in this map. It is worth noting that the Iwaki city has not released yet another version of this map with further detailed information.
In this study, the flood inundation maps provided by GSI and the city of Iwaki are used as reference data to assess the performance of the predictions quantitatively. It has been pointed out that in order to perform predictions at agricultural areas it is necessary to verify the irrigation periods in advance [41]. Thus, this study restricts its attention to floods in the built environment. The High-Resolution Land Use and Land Cover Map Products provided by Jaxa [42] are used to mask built-up areas.
3. Feature Space and Discriminant Function
It is often mentioned that backscattering intensity can be used to identify flooded urban areas. As pointed out before, in the case of medium resolution SAR images, flooded urban areas exhibit stronger backscattering intensity than non-flooded urban areas. However, it may not be always the case. It dependt on the inundation depth and the buildings height. Figure 2a illustrates a simplified scheme of the interaction of the electromagnetic pulse over an area that contains a single building. It is assumed that the paper is perpendicular to the azimuth direction. The radar pulse bounces off the ground towards the building wall, and then, it is reflected from the wall to the satellite sensor, producing bright pixels. This backscattering mechanism is often referred as double-bouncing. Consider now that the area is flooded with an low inundation depth (Figure 2b). The water in the ground acts like a smooth surface, and most of the radar pulse energy bounces off the ground toward the building wall. The backscattering mechanism at a smooth surface is referred as specular reflection. The intensity energy that is reflected from the wall to the satellite sensor is, therefore, larger than the previous case. Note that the increment of the intensity depends also on the effective area of the building wall. The larger the area, the larger the increment of the backscattering intensity. When the effective area is very low, that is to say when the inundation depth is about the same as the building height (Figure 2c), there is not increment of intensity but a reduction. From these considerations, it follows that there is an inundation depth, between the two extreme cases shown in Figure 2b,c, where the intensity remains unchanged (Figure 2d). In real situations, where there are several buildings, the backscattering mechanism is much more complex.
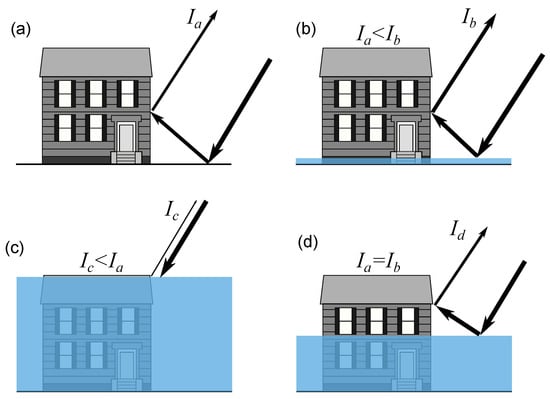
Figure 2.
Simplified scheme of the of backscattering intensity mechanism and the effect of the inundation depth and building height in the backscattering magnitude. (a) double bounce mechanism. (b) specular reflection and double bounce mechanisms over a large wall area (). (c) specular reflection and double bounce over a small wall area (). (d) specular reflection and double bounce with backscattering intensity equal to the case shown in (a).
Because the complex patterns that the backscattering intensity may exhibit in flooded urban areas, in this study we only use the interferometric coherence to construct the feature space. The interferometric coherence is computed from a pair of complex SAR data, and , and can be expressed as
where and denote the complex backscattering of the images, and * denotes the complex conjugate. The interferometric coherence varies between the range [0, 1], where 1 indicates full correlated data, and 0 is for totally uncorrelated data. Equation (1) tends to be large in urban areas, unless significant changes have occurred, such as the condition immediately after a flood.
A bidimensional feature space is constructed from the SAR images. One feature denotes the interferometric coherence computed from the two pre-events SAR images, and the second feature denotes the interferometric coherence computed from the post-event and the closest pre-event images. The former is termed as pre-event coherence and the latter co-event coherence. It has been pointed out that interferometric coherence is effective in identifying floods in urban areas [16], and it is independent of the orientation angle of buildings [29]. Furthermore, results from [29] show that coherence is more robust than difference of intensity to identify floods in urban areas. Figure 1 depicts the RGB color composite of the co-event (R) and the pre-event (G and B) coherence images for all the test areas. All the images have approximately 14-m resolution. Figure 3 depicts the feature samples of flooded and non-flooded built-up areas associated to the 2018 heavy rainfall (i.e., samples collected from the TR-set of SAR images). The flooded samples were collected from the area outlined by GSI, shown as yellow polygons in the inset of Figure 1. A total of 15,058 samples were collected at pixels labeled as built-up by the Jaxa’s land use map. The same number of non-flooded built-up samples were extracted randomly from the blue polygon shown in the same inset. The color marks in the scatter plot represent the density samples. Note that, for flooded samples, the co-event coherence is lower than the pre-event coherence; whereas, non-flooded samples are clustered around the identify function (i.e., pre-event coherence = co-event coherence).
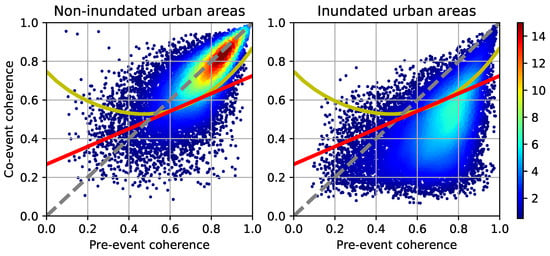
Figure 3.
Feature samples of non-flooded and flooded classes collected during the 2018 western Japan floods at the city of Mabi, Okayama Prefecture. The color marks depicts the density samples. The red and yellow solid lines denote the linear and non-linear discriminant functions calibrated using the SVM algorithm, respectively. The dashed line denotes the identity function.
The support vector machine (SVM) [43] algorithm was used to calibrate the following discriminant function:
where is a vector that contains the pre-event and co-event coherence, is a function that maps to a higher-dimensional feature space, , is a vector perpendicular to the hyperplane , and is a constant offset. A sample is classified as flooded if ; otherwise, the sample is classified as non-flooded. The parameters of Equation (2) are calibrated using training data to solve the following quadratic programming problem.
where is a slack variable, is a regularization parameter, if the training sample belongs to the class flooded; otherwise, , N denotes the number of traning samples. Instead of solving Equation (3), most algorithms solve the dual problem:
where is a kernel function that computes a dot-product in F. The solution of Equation (4) allows to express the discriminant function ins terms of the parameters and the training data:
The red line in Figure 3 depicts the resulted discriminant function (Equation (5)) using a linear kernel function, , and the yellow line is the resulted discriminant function using a Gaussian kernel function, . The kernel parameter c was set to 0.1. The gray dashed line represents the identity function. Recall the coherence tends to be high in urban areas, given that no changes occurred. Therefore, most of the pre-event coherence is larger than about 0.5. Low pre-event coherence can be attributed to the speckle noise, imprecision in the land use map, and small/local changes between the two pre-event images. Consequently, because the few samples with low pre-event coherence, the discriminant function in this range should exhibit low performance. For instance, it is inconsistent that a sample with a co-event coherence larger than its pre-event coherence (i.e., samples placed above the identity function) should be classified as flooded. Therefore, the classification will be performed only in samples with pre-event coherence larger than 0.45.
A second discriminant function, , was calibrated, but with training samples collected from the 2019 Hagibis typhoon. Flooded training samples were collected from the reference flood maps provided by GSI and the city of Iwaki (Figure 4). Non-flooded training samples were collected from the city of Nishikan, Niigata Prefecture, which is located in the westernmost side of the PR2-area (See Figure 1). Unexpected, unlike the non-flooded samples from the 2018 event, the non-flooded samples are slightly off the identity function. Furthermore, in general, the co-event coherence of flooded samples collected from the Hagibis typhoon is slightly lower than those collected from the 2018 floods. One of the reason of the different distribution of the data from the two events might be related to the difference of intensity of the events. As mentioned previously, the 2019 heavy rainfall is considered stronger than that from the 2018. The stronger wind due to the 2019 Hagibis typhoon may have induced slight changes even in non-flooded urban areas, such as perturbation of trees and other small objects. Such small changes, distributed over the all area from which the typhoon crosses, probably affected the co-event coherence. In addition, it is reported in [26,44,45] that very intense precpitations can affect high frecuency microwaves. However, the referred studies focused in X-band sensors, while Sentinel-1 constellation uses C-band sensors. Overall, the discriminant functions calibrated from samples collected from the 2019 floods (Figure 4) differ from those shown in Figure 3.
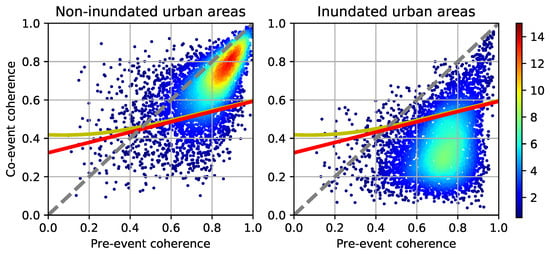
Figure 4.
Feature samples collected during the 2019 Hagibis typhoon. The color marks depicts the density samples. The red and yellow solid lines denote the linear and non-linear discriminant functions calibrated using the SVM algorithm, respectively. The dashed line denotes the identity function.
4. Results
The linear discriminant function is used here to identify floods in the PR1, PR2, and PR3 test areas. In the following, the flood maps produced from the Sentinel-1 imagery are referred to as predicted flood maps, and those published by local/regional public agencies are termed reference flood maps. Figure 5 shows the predicted flood map, from which the blue and gray pixels denote the flooded and non-flooded built-up areas, respectively. Note a median filter, with a window size of , was employed to remove small areas predicted as flooded. However, it is observed that the predicted floods still exhibit some level of noise at specific targets. Figure 5b,c show a closer look at areas where no floods were reported. Figure 5b shows the predictions around the Tokyo Imperial Palace, which is located in the city of Tokyo and consist of a high dense urban areas with high-rise buildings mainly devoted to business activities. Figure 5c shows the predictions in a low dense residential area near the coast of the city of Chigasaki, Kanagawa prefecture. Note the low-dense residential area exhibit far more misclassifications. However, this level of misclassification is only observed in the residential areas of PR1. It has been found that the main reason for such errors is due to the use of training data from another event; that is, the 2018 floods. Figure 5d,e show the predictions using the function at the same locations as shown in Figure 5b,c. Note that the predictions from are less noisy. Table 2 reports the number of pixels predicted as flooded and non-flooded at the areas shown in Figure 5b–e. With a difference of 2% in misclassifications, it is ocserved that has about the same performance as in high dense urban areas, such as the city of Tokyo. On the other hand, shows 20% more misclassifications than in low dense residential areas.
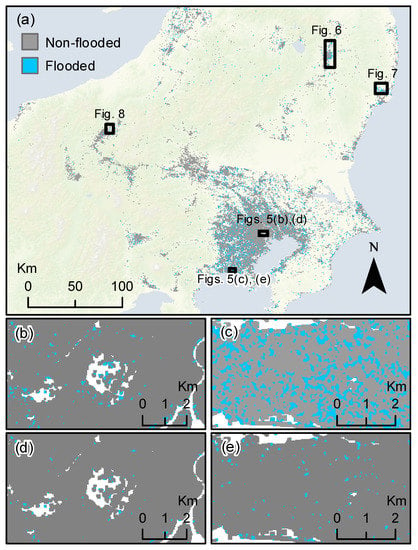
Figure 5.
(a–c) Predicted flood map computed from the discriminant function . (a) Predictions at the PR1, PR2, and PR3 test areas. (b) Closer look at around the Tokyo Imperial Palace. (c) Closer look at a residential area. (d,e) Predictions computed from the discriminant function .

Table 2.
Predictions in non-flooded areas.
Despite the observed noise, floods produced by river overflow were identified because of their large extent. Figure 6, Figure 7 and Figure 8 show a comparison of the predicted and reference flood maps at the cities of Koriyama, Iwaki, and Nagano, respectively. The RGB coherence color composite maps are shown as well. Recall the reference flood map includes built-up and vegetation areas, whereas the predicted flood map focuses only on built-up areas. A good agreement between the predicted and reference flood maps is observed for the Koriyama city (Figure 6). Regarding the city of Iwaki, a partial agreement is observed (Figure 7). The floods in Iwaki city are associated with the overflow of Natsui, Yoshima, and Shin rivers. The predicted floods produced by the Natsui and Yoshima rivers are consistent with the reference map. However, a poor agreement is observed in the floods produced by the Shin river. The main reason for the disagreement lies in the inundation depth. Evidence from local inhabitants shows that the inundation due to the Shin river was very shallow [46], whereas the inundation due to the Natsui river was considerably deeper [47]. No evidence was found for the Yoshima river. Regarding the flood in Nagano city (Figure 8), the predicted flood area is smaller than that reported in the reference map. The reason is related to the acquisition date of the post-event image. Nagano city is located within the PR3 test area, from which the post-event image was acquired five days after the floods. During this interval, the inundation extent has shrunk. For instance, it was reported that the water bodies at the Nagano shinkansen vehicle center (Figure 8a) were drained by 15 October 2019 [48], two days before the post-event image was acquired.
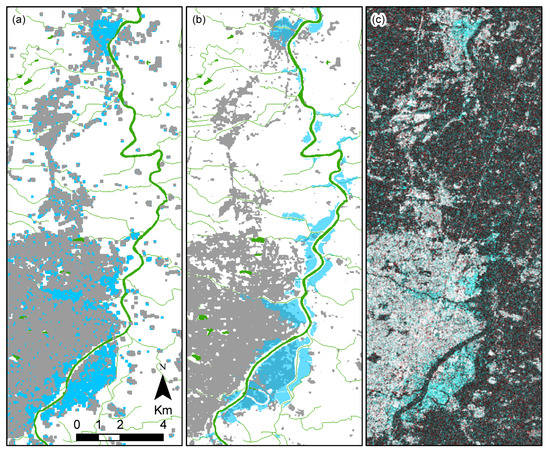
Figure 6.
Closer look of the affected area in the city of Koriyama, Fukushima Prefecture. (a) The predicted flood map. (b) The reference flood map provided by GSI. (c) The RGB coherence color composite. Their locations are indicated in Figure 5a.

Figure 7.
Closer look of the affected area in the city of Iwaki, Fukushima Prefecture. (a) The predicted flood map. (b) The reference flood map provided by the Iwaki city. (c) The RGB coherence color composite. Their locations are indicated in Figure 5a.
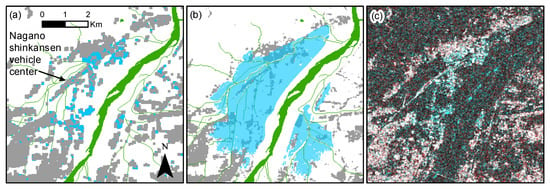
Figure 8.
Closer look of the affected area in the city of Nagano, Nagano Prefecture. (a) The predicted flood map. (b) The reference flood map provided by GSI. (c) The RGB coherence color composite. Their locations are indicated in Figure 5a.
The city of Saitama, Tokyo, was also reported as flooded (Figure 9). Saitama is located in the PR1, which contains the largest level of misclassifications. A closer look showed that most of the flooded built-up areas consisted of low-dense residential buildings (Figure 9d,e). Such residential areas were not completely covered in the land use map provided by Jaxa, and thus, it was not detected in the predicted flood map.
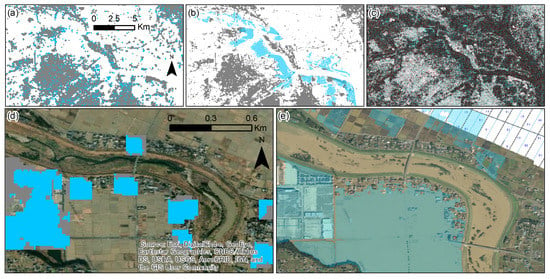
Figure 9.
Closer look of the affected area in the city of Nagano, Nagano Prefecture. (a) The predicted flood map. (b) The reference flood map provided by GSI. (c) The RGB coherence color composite. (d) low dense rural area, image recorded before the flood. (e) Aerial image of the flooded area shown in (d). The image is provided by the GSI.
Table 3 shows the predictions within the flooded areas according to the reference maps. Note two aggregates are reported for the case of Iwaki city: Iwaki-A considers the all flooded area, and Iwaki-B considers only the floods produced by Natsui and Yoshima river. Table 4 reports the producer accuracy (PA), user accuracy (UA), and the scores, which are commonly used to assess machine learning classifiers. The UA is the percentage of samples that were referenced as flooded (non-flooded) and at the same time predicted as flooded (non-flooded). Likewise, the PA represents the percentage of samples predicted as flooded (non-flooded) that were actually flooded (non-flooded) according to the references. The predictions of all the pixels located in the areas delimited by the reference flood maps of Koriyama and Iwaki cities are used as testing data of actual flooded samples. A total of 75,178 flooded samples were collected. Likewise, 75,178 pixels were randomly extracted from the areas shown in Figure 5b,c, and used as testing data of actual non-flooded samples. The scores range from 0.65 to 0.90. Additionally, an overall accuracy of 0.77 and a Cohen’s kappa coefficient of 0.54 were computed. In, [49], two additional scores are suggested for accuracy assessment: quantity disagreement and allocation disagreement. From the two subsets collected to compute the scores, a quantity disagreement of 0.25 is obtained. That is, the number of pixels predicted as flooded (non-flooded) is 25% lower/greater than the number of pixels referenced as flooded (non-flooded). Regarding the allocation disagreement, a value of 0.10 is obtained, which denotes that 10% of the pixels can be reallocated to increase the agreement between the predicted and reference map. These scores indicate a moderate agreement between the predictions and the reference data. However, it is worth noting that the scores only report the consistency between our results and the reference maps; and thus, inaccuracies in the reference maps may induce underestimations in the accuracy scores.

Table 3.
Predictions in reference flooded areas.

Table 4.
Classification scores.
5. Conclusions
In this study we evaluated the performance of a discriminant function clalibrated from one disaster event to identify the affected area of another disaster event. The relevance of this setting is that remote sensing data from past disaster events are available in advance, and thus, a discriminant function can be ready to identify damage in real time. We believe the complexity of this approach for real time damage identification is immense. However, we have imposed the following conditions to simplify the experiment: (i) The nature of the two disaster events are similar, that is, heavy-rainfall-based floods; (ii) we used hand-engineered features (i.e., interferometric coherence), whose interpretation is comprehensible and helpful to filter out outlier samples; (iii) we used the same remote sensing data, Sentinel-1 microwave images with medium resolution, in the two disaster events, and were recorded in almost the same conditions (i.e., same polarization, incident angle, and orbit path); and (iv) the calibration and predictions were performed within the same country, which shows the same conditions regarding building materials and typology.
The discriminant function was calibrated with the support vector machine algorithm using training data collected from the 2018 western Japan floods, and with the aim to identify floods due to the 2019 Hagibis typhoon. The results show a moderate agreement with the flood maps provided by local and regional governmental agencies in Japan. Although the feature space remained the same in both events, we noticed the distribution of the samples collected form the 2018 event were slightly different than the distribution of samples collected from the 2019 event, and as a result, the predictions produced noise-like misclassifications. We believe the difference in magnitude of the heavy rainfall events played a main role in the difference of the sample distributions. However, the noise in the results were smaller enough to identify floods produced by the overflow of rivers. We also noticed the acquisition date of the post-event Sentinel-1 images played an essential role in the performance of flood detection. For instance, the post-event image that recorded the city of Nagano was acquired after the water bodies began to drainage. Furthermore, shallow inundation at the city of Iwaki could not be detected from the discriminant function. We think, based on evidence posted by the inhabitant of Iwaki city, that the medium resolution of the Sentinel-1 interferometric coherence could not detect shallow inundations.
Overall, the agreement between the predictions and the reference data is moderate, which suggests that the use of the previous disaster to identify damage on future events is a promising option. As a future work, we suggest it is necessary an additional calibration of the discriminant function with samples collected from the target disaster event. That is, for example, an initial calibration of the discriminant function is performed with training data collected from previous events. Then, the discriminant function is adjusted using modifications of unsupervised classification algorithms using samples of the current disaster.
Author Contributions
Conceptualization, L.M., E.M., and S.K.; methodology, L.M., E.M., and S.K.; software, L.M., E.M., and S.K.; validation, L.M., E.M., and S.K.; formal analysis, L.M., E.M., and S.K.; investigation, L.M., E.M., and S.K.; resources, L.M., E.M., and S.K.; data curation, L.M., E.M., and S.K.; writing—original draft preparation, L.M., E.M., and S.K.; visualization, L.M., E.M., and S.K.; supervision, E.M., and S.K.; project administration, L.M., E.M., and S.K.; funding acquisition, L.M., E.M., and S.K. All authors have read and agreed to the published version of the manuscript.
Funding
This study was partly funded by the JSPS Kakenhi Program (17H06108 and 17H02050); the Core Research Cluster of Disaster Science at Tohoku University; the National Fund for Scientific, Technological and Technological Innovation Development (Fondecyt - Peru) [contract number 038-2019]; Japan Aerospace Exploration Agency (JAXA), and the MEXT Next Generation High-Performance Computing Infrastructures and Applications R&D Program.
Acknowledgments
The satellite images were preprocessed with ArcGIS 10.6 and ENVI 5.5, and the other processing and analysis steps were implemented in Python using GDAL and NumPy libraries.
Conflicts of Interest
The authors declare no conflict of interest.
References
- Molinari, D.; Menoni, S.; Ballio, F. Flood Damage Survey and Assessment: New Insights from Research and Practice, 1st ed.; John Wiley & Sons, Inc.: Hoboken, NJ, USA, 2017. [Google Scholar]
- Hallegatte, S.; Green, C.; Nicholls, R.J.; Corfee-Morlot, J. Future flood losses in major coastal cities. Nat. Clim. Chang. 2013, 3, 802–806. [Google Scholar] [CrossRef]
- Pitt, M. Learning Lessons from the 2007 Floods. 2008. Available online: https://www.designingbuildings.co.uk/wiki/Pitt_Review_Lessons_learned_from_the_2007_floods (accessed on 4 February 2020).
- Mason, D.C.; Speck, R.; Devereux, B.; Schumann, G.J.; Neal, J.C.; Bates, P.D. Flood Detection in Urban Areas Using TerraSAR-X. IEEE Trans. Geosci. Remote Sens. 2010, 48, 882–894. [Google Scholar] [CrossRef]
- Blöschl, G.; Hall, J.; Viglione, A.; Perdigão, R.A.P.; Parajka, J.; Merz, B.; Lun, D.; Arheimer, B.; Aronica, G.T.; Bilibashi, A.; et al. Changing climate both increases and decreases European river floods. Nature 2019, 573, 108–111. [Google Scholar] [CrossRef]
- Rahman, M.; Ningsheng, C.; Islam, M.M.; Dewan, A.; Iqbal, J.; Washakh, R.M.A.; Shufeng, T. Flood Susceptibility Assessment in Bangladesh Using Machine Learning and Multi-criteria Decision Analysis. Earth Syst. Environ. 2019, 3, 585–601. [Google Scholar] [CrossRef]
- Mas, E.; Paulik, R.; Pakoksung, K.; Adriano, B.; Moya, L.; Suppasri, A.; Muhari, A.; Khomarudin, R.; Yokoya, N.; Matsuoka, M.; et al. Characteristics of Tsunami Fragility Functions Developed Using Different Sources of Damage Data from the 2018 Sulawesi Earthquake and Tsunami. Pure Appl. Geophys. 2020, 177, 2437–2455. [Google Scholar] [CrossRef]
- Koshimura, S.; Moya, L.; Mas, E.; Bai, Y. Tsunami Damage Detection with Remote Sensing: A Review. Geosciences 2020, 10, 177. [Google Scholar] [CrossRef]
- Wieland, M.; Martinis, S. A Modular Processing Chain for Automated Flood Monitoring from Multi-Spectral Satellite Data. Remote Sens. 2019, 11, 2330. [Google Scholar] [CrossRef]
- Rättich, M.; Martinis, S.; Wieland, M. Automatic Flood Duration Estimation Based on Multi-Sensor Satellite Data. Remote Sens. 2020, 12, 643. [Google Scholar] [CrossRef]
- Wieland, M.; Liu, W.; Yamazaki, F. Learning Change from Synthetic Aperture Radar Images: Performance Evaluation of a Support Vector Machine to Detect Earthquake and Tsunami-Induced Changes. Remote Sens. 2016, 8, 792. [Google Scholar] [CrossRef]
- Bai, Y.; Gao, C.; Singh, S.; Koch, M.; Adriano, B.; Mas, E.; Koshimura, S. A Framework of Rapid Regional Tsunami Damage Recognition From Post-event TerraSAR-X Imagery Using Deep Neural Networks. IEEE Geosci. Remote Sens. Lett. 2018, 15, 43–47. [Google Scholar] [CrossRef]
- Moya, L.; Zakeri, H.; Yamazaki, F.; Liu, W.; Mas, E.; Koshimura, S. 3D gray level co-occurrence matrix and its application to identifying collapsed buildings. ISPRS J. Photogramm. Remote Sens. 2019, 149, 14–28. [Google Scholar] [CrossRef]
- Adriano, B.; Xia, J.; Baier, G.; Yokoya, N.; Koshimura, S. Multi-Source Data Fusion Based on Ensemble Learning for Rapid Building Damage Mapping during the 2018 Sulawesi Earthquake and Tsunami in Palu, Indonesia. Remote Sens. 2019, 11, 886. [Google Scholar] [CrossRef]
- Moya, L.; Muhari, A.; Adriano, B.; Koshimura, S.; Mas, E.; Marval-Perez, L.R.; Yokoya, N. Detecting urban changes using phase correlation and l1-based sparse model for early disaster response: A case study of the 2018 Sulawesi Indonesia earthquake-tsunami. Remote Sens. Environ. 2020, 242, 111743. [Google Scholar] [CrossRef]
- Liu, W.; Yamazaki, F. Review article: Detection of inundation areas due to the 2015 Kanto and Tohoku torrential rain in Japan based on multi-temporal ALOS-2 imagery. Nat. Hazards Earth Syst. Sci. 2018, 18, 1905–1918. [Google Scholar] [CrossRef]
- Nakmuenwai, P.; Yamazaki, F.; Liu, W. Automated Extraction of Inundated Areas from Multi-Temporal Dual-Polarization RADARSAT-2 Images of the 2011 Central Thailand Flood. Remote Sens. 2017, 9, 78. [Google Scholar] [CrossRef]
- Bovolo, F.; Bruzzone, L. A Split-Based Approach to Unsupervised Change Detection in Large-Size Multitemporal Images: Application to Tsunami-Damage Assessment. IEEE Trans. Geosci. Remote Sens. 2007, 45, 1658–1670. [Google Scholar] [CrossRef]
- Westerhoff, R.S.; Kleuskens, M.P.H.; Winsemius, H.C.; Huizinga, H.J.; Brakenridge, G.R.; Bishop, C. Automated global water mapping based on wide-swath orbital synthetic-aperture radar. Hydrol. Earth Syst. Sci. 2013, 17, 651–663. [Google Scholar] [CrossRef]
- Martinis, S.; Twele, A.; Voigt, S. Towards operational near real-time flood detection using a split-based automatic thresholding procedure on high resolution TerraSAR-X data. Nat. Hazards Earth Syst. Sci. 2009, 9, 303–314. [Google Scholar] [CrossRef]
- Boni, G.; Ferraris, L.; Pulvirenti, L.; Squicciarino, G.; Pierdicca, N.; Candela, L.; Pisani, A.R.; Zoffoli, S.; Onori, R.; Proietti, C.; et al. A Prototype System for Flood Monitoring Based on Flood Forecast Combined With COSMO-SkyMed and Sentinel-1 Data. IEEE J. Sel. Top. Appl. Earth Obs. Remote Sens. 2016, 9, 2794–2805. [Google Scholar] [CrossRef]
- Martinis, S.; Kersten, J.; Twele, A. A fully automated TerraSAR-X based flood service. ISPRS J. Photogramm. Remote Sens. 2015, 104, 203–212. [Google Scholar] [CrossRef]
- Giustarini, L.; Hostache, R.; Kavetski, D.; Chini, M.; Corato, G.; Schlaffer, S.; Matgen, P. Probabilistic Flood Mapping Using Synthetic Aperture Radar Data. IEEE Trans. Geosci. Remote Sens. 2016, 54, 6958–6969. [Google Scholar] [CrossRef]
- Bioresita, F.; Puissant, A.; Stumpf, A.; Malet, J.P. A Method for Automatic and Rapid Mapping of Water Surfaces from Sentinel-1 Imagery. Remote Sens. 2018, 10, 217. [Google Scholar] [CrossRef]
- Pulvirenti, L.; Chini, M.; Pierdicca, N.; Guerriero, L.; Ferrazzoli, P. Flood monitoring using multi-temporal COSMO-SkyMed data: Image segmentation and signature interpretation. Remote Sens. Environ. 2011, 115, 990–1002. [Google Scholar] [CrossRef]
- Pulvirenti, L.; Pierdicca, N.; Boni, G.; Fiorini, M.; Rudari, R. Flood Damage Assessment through Multitemporal COSMO-SkyMed Data and Hydrodynamic Models: The Albania 2010 Case Study. IEEE J. Sel. Top. Appl. Earth Obs. Remote Sens. 2014, 7, 2848–2855. [Google Scholar] [CrossRef]
- Mason, D.C.; Davenport, I.J.; Neal, J.C.; Schumann, G.J.; Bates, P.D. Near Real-Time Flood Detection in Urban and Rural Areas Using High-Resolution Synthetic Aperture Radar Images. IEEE Trans. Geosci. Remote Sens. 2012, 50, 3041–3052. [Google Scholar] [CrossRef]
- Giustarini, L.; Hostache, R.; Matgen, P.; Schumann, G.J.; Bates, P.D.; Mason, D.C. A Change Detection Approach to Flood Mapping in Urban Areas Using TerraSAR-X. IEEE Trans. Geosci. Remote Sens. 2013, 51, 2417–2430. [Google Scholar] [CrossRef]
- Ohki, M.; Tadono, T.; Itoh, T.; Ishii, K.; Yamanokuchi, T.; Watanabe, M.; Shimada, M. Flood Area Detection Using PALSAR-2 Amplitude and Coherence Data: The Case of the 2015 Heavy Rainfall in Japan. IEEE J. Sel. Top. Appl. Earth Obs. Remote Sens. 2019, 12, 2288–2298. [Google Scholar] [CrossRef]
- Insom, P.; Cao, C.; Boonsrimuang, P.; Liu, D.; Saokarn, A.; Yomwan, P.; Xu, Y. A Support Vector Machine-Based Particle Filter Method for Improved Flooding Classification. IEEE Geosci. Remote Sens. Lett. 2015, 12, 1943–1947. [Google Scholar] [CrossRef]
- Dumitru, C.O.; Cui, S.; Faur, D.; Datcu, M. Data Analytics for Rapid Mapping: Case Study of a Flooding Event in Germany and the Tsunami in Japan Using Very High Resolution SAR Images. IEEE J. Sel. Top. Appl. Earth Obs. Remote Sens. 2015, 8, 114–129. [Google Scholar] [CrossRef]
- Moya, L.; Mas, E.; Adriano, B.; Koshimura, S.; Yamazaki, F.; Liu, W. An integrated method to extract collapsed buildings from satellite imagery, hazard distribution and fragility curves. Int. J. Disaster Risk Reduct. 2018, 31, 1374–1384. [Google Scholar] [CrossRef]
- Moya, L.; Marval Perez, L.R.; Mas, E.; Adriano, B.; Koshimura, S.; Yamazaki, F. Novel Unsupervised Classification of Collapsed Buildings Using Satellite Imagery, Hazard Scenarios and Fragility Functions. Remote Sens. 2018, 10, 296. [Google Scholar] [CrossRef]
- Tsuguti, H.; Seino, N.; Kawase, H.; Imada, Y.; Nakaegawa, T.; Takayabu, I. Meteorological overview and mesoscale characteristics of the Heavy Rain Event of July 2018 in Japan. Landslides 2019, 16, 363–371. [Google Scholar] [CrossRef]
- Cabinet Office of Japan. Summary of Damage Situation Caused by the Heavy Rainfall in July 2018. 2018. Available online: http://www.bousai.go.jp/updates/h30typhoon7/index.html (accessed on 7 August 2018).
- Cabinet Office of Japan. Damage Situation Pertaining to Typhoon No. 19. 2019. Available online: http://www.bousai.go.jp/updates/r1typhoon19/ (accessed on 29 October 2019).
- Takemi, T.; Unuma, T. Environmental Factors for the Development of Heavy Rainfall in the Eastern Part of Japan during Typhoon Hagibis (2019). SOLA 2020, in press. [Google Scholar] [CrossRef]
- Geospatial Information Authority of Japan. Information about Heavy Rain in July 2018. 2018. Available online: https://www.gsi.go.jp/BOUSAI/H30.taihuu7gou.html (accessed on 19 July 2019).
- Geospatial Information Authority of Japan. Information about Typhoon No. 19. 2019. Available online: https://www.gsi.go.jp/BOUSAI/R1.taihuu19gou.html (accessed on 25 October 2019).
- Iwaki City. Flood Damage Debris Removal Enhancement Period. 2019. Available online: http://www.city.iwaki.lg.jp/www/contents/1572477821789/simple/1030.pdf (accessed on 18 November 2019).
- Moya, L.; Endo, Y.; Okada, G.; Koshimura, S.; Mas, E. Drawback in the Change Detection Approach: False Detection during the 2018 Western Japan Floods. Remote Sens. 2019, 11, 2320. [Google Scholar] [CrossRef]
- Japan Aerospace Exploration Agency. Homepage of High-Resolution Land Use and Land Cover Map Products. 2018. Available online: https://www.eorc.jaxa.jp/ALOS/en/lulc/lulc_index.htm (accessed on 25 October 2019).
- Vapnik, V.N. An overview of statistical learning theory. IEEE Trans. Neural Netw. 1999, 10, 988–999. [Google Scholar] [CrossRef]
- Pulvirenti, L.; Marzano, F.S.; Pierdicca, N.; Mori, S.; Chini, M. Discrimination of Water Surfaces, Heavy Rainfall, and Wet Snow Using COSMO-SkyMed Observations of Severe Weather Events. IEEE Trans. Geosci. Remote Sens. 2014, 52, 858–869. [Google Scholar] [CrossRef]
- Pulvirenti, L.; Pierdicca, N.; Chini, M.; Guerriero, L. Monitoring Flood Evolution in Vegetated Areas Using COSMO-SkyMed Data: The Tuscany 2009 Case Study. IEEE J. Sel. Top. Appl. Earth Obs. Remote Sens. 2013, 6, 1807–1816. [Google Scholar] [CrossRef]
- YouTube. 令和元年台風19号 いわき市新川沿い. 2019. Available online: https://www.youtube.com/watch?v=DhX2UlWkCr8 (accessed on 14 November 2019).
- YouTube. いわき市平赤井地区 夏井川堤防決壊空撮. 2019. Available online: https://www.youtube.com/watch?v=gokf0Ci9b3w (accessed on 14 November 2019).
- JR-East Japan Railway Company. 台風19号による北陸新幹線の設備等の主な被害状況について. 2019. Available online: https://www.jreast.co.jp/press/2019/20191013_ho04.pdf (accessed on 14 November 2019).
- Pontius, R.G., Jr.; Millones, M. Death to Kappa: Birth of quantity disagreement and allocation disagreement for accuracy assessment. Int. J. Remote Sens. 2011, 32, 4407–4429. [Google Scholar] [CrossRef]
© 2020 by the authors. Licensee MDPI, Basel, Switzerland. This article is an open access article distributed under the terms and conditions of the Creative Commons Attribution (CC BY) license (http://creativecommons.org/licenses/by/4.0/).