Letter

SST Comparison of AVHRR and MODIS Time Series in the Western Mediterranean Sea

by
María José López García
Department of Geography, Facultat de Geografia i Història, Universitat de València, Av. Blasco Ibañez 28, 46010 Valencia, Spain
Remote Sens. 2020, 12(14), 2241; https://doi.org/10.3390/rs12142241
Submission received: 9 June 2020 / Revised: 6 July 2020 / Accepted: 9 July 2020 / Published: 13 July 2020

Abstract

:
Sea Surface Temperature (SST) is a key parameter for understanding atmospheric and oceanic processes. Since the late 1980s, infrared satellite images have been used to complement in situ records for studying the temporal and spatial variability of SST. The Advanced Very High Resolution Radiometer (AVHRR) of the National Oceanic and Atmospheric Administration (NOAA)’s satellite was the first sensor successfully used to compute SST following the development and validation of the atmospheric correction algorithm known as “split-window”. More recently, the MODerate-resolution Imaging Spectroradiometer (MODIS) on board the National Aeronautics and Space Administration (NASA)’s Terra and Aqua satellites, launched in 1999 and 2002, respectively, also provides SST products which can be combined with AVHRR series to complete the analysis of time series. This paper presents a comparison of the monthly SST data derived from both sensors, AVHRR and MODIS, in a series of ten years (2000–2009) in the Western Mediterranean basins. The results showed a high correlation (R2 = 0.99) between the sensors when averaged values at the regional scale were compared. SST obtained from AVHRR were slightly higher (+0.18 °C ± 0.2 °C, on average) than SST from MODIS. The series were most similar during winter and spring (+0.09 °C ± 0.1 °C for January to May) with a greater difference from June to December (+0.24 °C ± 0.2 °C). The comparative analysis showed that the two sensors can be used jointly to estimate long-term trends at the regional scale.

Graphical Abstract

1. Introduction

Sea Surface Temperature (SST) is one of the most important parameters for understanding oceanographic and climate processes. It has been defined by the Global Climate Observing System (GCOS) as one of the essential climate variables (ECVs) required to systematically observe the Earth’s changing climate. Knowing the spatial, seasonal, and temporal variability of SST is critical to understanding both changes in climate and in the thermohaline circulation of the oceans. In the current context of global warming, the availability of accurate SST time series is highly valuable for monitoring and predicting the state of the ocean.
It is not easy to estimate SST trends in marine ecosystems primarily due to the scarcity of long time series of in situ measurements, but also because of the sensitivity of the data to instrumental biases, and due to differences in data acquisition methods. Satellite remote sensing provides an alternative to and complement for deriving SST at the global and regional scales due to its wide coverage and its high radiometric resolution. Since the late 1980s, infrared satellite images have been used as a complement to in situ records for studying temporal and spatial variability of SST around the world (see Emery et al. [1] and a recent review by Minnet et al. [2]). The Advanced Very High Resolution Radiometer (AVHRR) on board the National Oceanic and Atmospheric Administration (NOAA)’s satellite was the first sensor successfully used to compute SST following the development and validation of the atmospheric correction algorithm known as “split-window” [3,4,5]. In 1990, the National Aeronautics and Space Administration (NASA) conceived the AVHRR Pathfinder SST Program, which provided accurate and consistently processed SST datasets for global climate applications for more than 30 years [6]. The Pathfinder program distributed five versions of datasets, the latest providing daily 4 km resolution data from 1981 to 2014. More recently, the MODerate-resolution Imaging Spectroradiometer (MODIS) on board the NASA Terra and Aqua satellites has been producing high-quality global SST since their launch, in 1999 and 2002, respectively [7,8,9].
Much effort has been made in recent years to integrate SST data obtained from satellites with in situ oceanographic records for different regions of the world, contributing to a better understanding of global ocean warming. The AR5 of the Intergovernmental Panel on Climate Change (IPCC) [10] indicates that since 1970 the oceans have accumulated a large amount of the energy, which has given rise to a warming rate in the superficial sea layers of 0.11 °C/decade since that decade. The Mediterranean region has been considered by many authors [11,12,13,14] as a “hot spot”, an especially vulnerable region in climate change projections. Some studies [15,16] have pointed out an increase of 0.71 °C in the Mediterranean Sea for the period 1982 to 2006, being one of the regions on the planet classified by the authors [16] as subject to “rapid warming”, together with the Baltic Sea, the North Sea, the Sea of Japan, and the China Sea. In all these regions, the warming rate was 2 to 4 times greater than the average global rate. More recent studies [17] from the Copernicus Marine Environment Monitoring Service (CMEMS) indicate a recent warming in the Mediterranean Sea of 0.04 °C/year, much higher than the average rate in the oceans, which is estimated at 0.016 °C/year.
Consequently, there is no doubt of the interest shown by studies of recent warming focused on the Mediterranean Sea, a semi-enclosed basin surrounded by populated countries where there are intense urbanization rates in most coastal areas. Many studies in the past decades have employed AVHRR images to detect thermal fronts and study mesoscale surface circulation [18,19,20,21]. Other papers have focused on the analysis of the spatial and temporal variability of SST [22,23] and, more recently, as longer satellite data series have become available, climate studies have proliferated that address the recent changes in SST and calculate warming rates over the Mediterranean Sea [24,25,26,27,28,29,30,31]. Some of these studies have reported an advance of the summer season in the Mediterranean [25,28,31,32], suggesting the need for a greater focus on seasonal trends.
The AVHRR sensor, as probably the most widely used sensor for deriving SST from satellite images in the world, has been the subject of many data validation studies [33,34,35]. In the last decade, the new-generation MODIS sensor also incorporates thermal infrared bands, which allows accurate SST to be computed. Some studies [7,8,36,37,38] have validated MODIS SST through the comparison of satellite data with in situ measurements. These studies have been carried out for different case studies and for various temporal periods, but all of them report accuracies ranging from −0.06 °C to 0.8 °C depending on the satellite (Terra or Aqua), the path (daytime or nighttime), and the study region. A higher bias of 2 °C was reported in a study of the Bay of Bengal (India) [39] when in situ measurements of SST collected during two campaigns in July and August 2010 were compared with coincident satellite data.
Although, in general, it has been demonstrated that both sensors provide an accurate estimation of SST, it is of interest to verify the similarity between the SST obtained from MODIS and AVHRR so that they can be used together in time series climate studies. In a 2001 study [40] based on one year of daily data over some regions in the Eastern Atlantic Ocean and the Mediterranean Sea, it was found that the average of the differences between SST from AVHRR and MODIS was +0.1 °C (±0.5 °C), with higher temperatures obtained from AVHRR. The differences, however, vary depending on the zone and the number or quality of images available, reaching +0.4 °C (±0.5 °C) in some areas of the Atlantic. Therein, the authors were comparing MODIS SST data provided by NASA with AVHRR derived using their own software. More recently, a study carried out on a sector of the middle Argentina continental shelf off the San Jorge Gulf from 2003 to 2006 [41] compared monthly products provided by NASA and found a mean difference of +0.41 °C from AVHRR over MODIS, with a higher deviation (close to 1 °C) during the warmer months. Those authors concluded that the temperature estimated by both sensors was quite similar and that the products could be used to analyze large and continuous time series.
In this paper, we present a comparison of the monthly SST data derived from both sensors, AVHRR and MODIS, provided by NASA’s Earth Observing System Data and Information System (EOSDIS), Physical Oceanography Distributed Active Archive Center (PO.DAAC), Jet Propulsion Laboratory. A series of ten years of monthly data, from February 2000 to December 2009 were processed for the Western Mediterranean basins. The purpose of the study was to determine whether the two datasets could be used jointly to analyze the temporal evolution of SST and to calculate warming rates at the regional and seasonal scales.

2. Materials and Methods

All the images processed in this work were obtained from the Physical Oceanography Distributed Active Archive Center at the NASA Jet Propulsion Laboratory, Pasadena, CA, USA. This Center provides the longest time series of historical global datasets currently available online (http://podaac.jpl.nasa.gov/) covering a wide variety of products, of several sensors at different spatial and temporal resolutions.
We based the analysis on monthly images, at 4 km resolution, which we considered a robust product for a climatological analysis of SST because daily or weekly data may contain missing values due to the cloud cover in the images. Only nighttime images were selected to avoid the effect of intense diurnal heating, which can be very important in the Mediterranean during the spring and summer [2,42]. A more detailed description of both datasets follows in the next subsections.

2.1. AVHRR SST Data

The Advanced Very High Resolution Radiometer (AVHRR) on board the series of Tiros-NOAA satellites was the first infrared sensor successfully used to provide information about land and sea surface temperature at a global scale. The first satellite of this series, the Tiros N, was launched in 1978, followed by the NOAA 6 in 1980 and others until the last NOAA-19 launched in 2009. The AVHRR provides images in five spectral bands: Visible (0.58–0.68 μm), Near-Infrared (0.78–1.10 μm), Mid-Infrared (3.55–3.93 μm), and two Thermal Infrared (10.3–11.3 μm and 11.5–12.5 μm), which allowed the retrieval of accurate SST. Early in the 1980s, thermal images of the NOAA satellite were first used to detect thermal fronts in the Mediterranean [43], to infer mesoscale surface circulation ([19,44], as examples), and to act as a complement to in situ oceanographic data. Soon afterwards, the development of correction algorithms such as the “split-window” [3] allowed quite accurate SST values to be obtained and, over time, the availability of long data series has allowed global observing and climate monitoring.
We used version 5 of the Pathfinder database SST Project (Pathfinder V5), which provided several products for temporal averages of 5-day, 7-day, 8-day, monthly, and annual [34,45]. In order to estimate SST values, an algorithm was used whose coefficients were continuously updated, making the data suitable for studying multi-year SST trends. A validation of AVHRR Pathfinder SST over the Mediterranean Sea using independent data obtained from MEDATLAS CTD and XBT casts was performed by D’Ortenzio et al. [33] who found a mean bias of 0.2 °C, and by Marullo et al. [35] who evaluated Pathfinder by comparing satellite SST to in situ data from 1985 to 2005, concluding that satellite data are able to reproduce in situ measurements with a mean bias of less than 0.1 °C, and an RMSE of about 0.5 °C.

2.2. MODIS SST Data

MODerate-resolution Imaging Spectroradiometer (MODIS) is a radiometer on board the NASA Terra and Aqua satellite platforms, launched in 1999 and 2002, respectively, to study the global dynamics of the Earth’s atmosphere, land, ice, and oceans. These satellites are in sun-synchronous and near-polar orbits providing complete global coverage of the Earth every 1 to 2 days, since their launch. MODIS captures data in 36 bands ranging from 0.4 μm to 14.4 μm at a varying spatial resolution (250 m, 500 m, and 1 km) [46]. Sea Surface Temperature can be retrieved both from Mid-Infrared bands 3–4 μm (MODIS bands 22 and 23) and Thermal Infrared bands 11–12 μm (MODIS bands 31 and 32) by applying algorithms developed by the MODIS Science Team Leads for SST [7]. Those authors estimated the SST accuracy for the global ocean as 0.07 °C. A variety of SST products of different temporal (daily, weekly, monthly, and annual) and spatial (4 km, 9 km) resolutions have been derived by the NASA Ocean Biology Processing Group (OBPG) and are freely available from the NASA Jet Propulsion Laboratory, Physical Oceanography Distributed Active Data Center (PO.DAAC) at the following site: https://podaac.jpl.nasa.gov.
In this study, we used monthly SST data from the Terra satellite, obtained from Thermal Infrared bands at a spatial resolution of 4 km. We used the dataset “MODIS_TERRA_MONTHLY-4KM_NIGHTTIME_V2014.0” accessible via OPenDAP Web services (see the technical notes for detailed information [46]). Nighttime images were selected for the reasons given above.

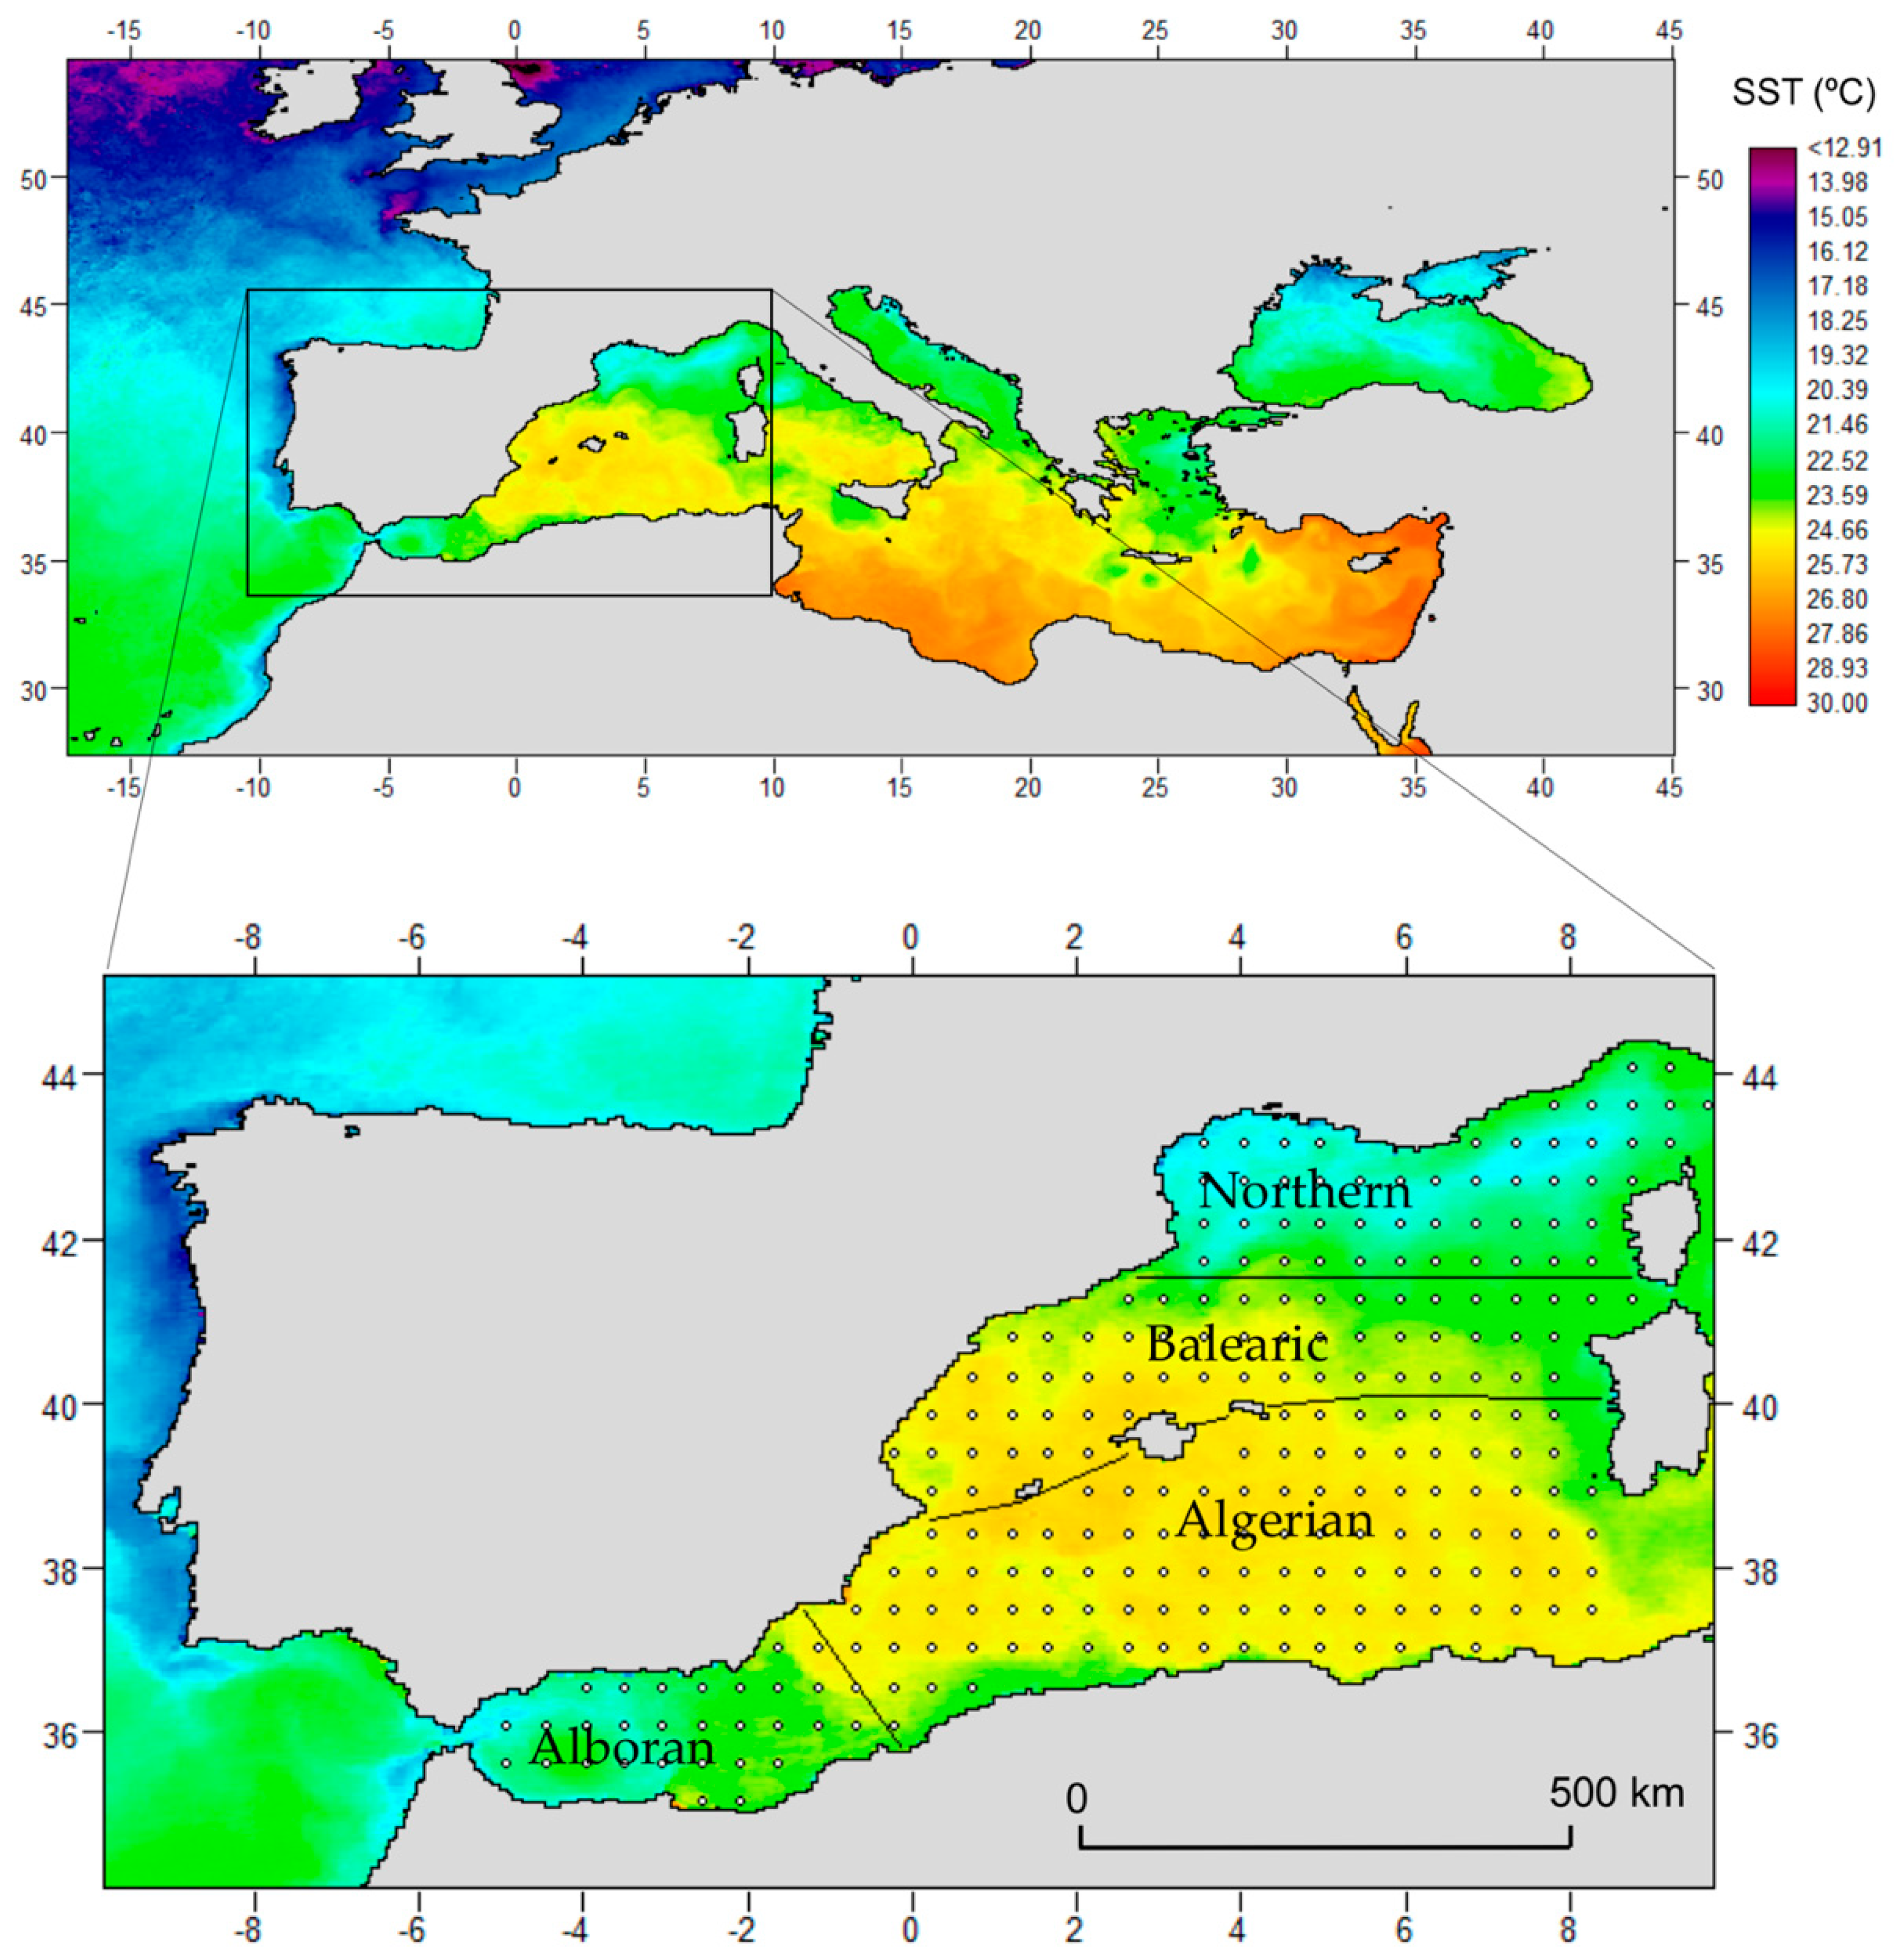
2.3. Study Area and Analysis of Data

The study zone covers an area of about 575,000 km2 in the Western Mediterranean Sea, which includes four basins, namely Northern, Balearic, Algerian, and Alboran (Figure 1). According to previous studies [25,47,48], it is known that these basins share common thermal and oceanographic characteristics. The analysis extended over a period of almost ten years, from February 2000 to December 2009, for which data from both datasets were available. A total of 119 monthly images were processed for each sensor using the Image Processing software Idrisi-Taiga v.16.0 from Clark Labs, Clark University, Worcester, MA, USA (https://clarklabs.org).
In order to compare SST obtained from both sensors, we used average monthly SST values calculated over the sub-basins. We considered that, for the validation of the data of both sensors, it was more appropriate to use spatially averaged values since the image-to-image comparison could distort the results due to possible errors in the geometric corrections of the images. These statistics were calculated over the whole study area (WMed) and for the four sub-basins by applying a regular sampling grid of 248 points (one point at every 0.5 degrees of latitude and longitude). The comparison was made following both a regional and a seasonal approach.

3. Results

The evolution of SST over the period analyzed, from February 2000 to December 2009, can be observed in Figure 2, which represents monthly data calculated for the whole basin (WMed) from both AVHRR and MODIS databases. The graph shows the variation in the monthly temperatures from both sensors over the whole period (lines) and the monthly differences between the two sensors (bars). Although there is no apparent trend in the differences, which varied between −0.42 °C and 0.63 °C, the AVHRR values are +0.18 °C higher on average. Positive differences are registered in 86% of the data and the highest negative differences, i.e. MODIS data higher than AVHRR, are mostly observed at the beginning of the MODIS records (−0.35 °C in May 2001, and −0.42 °C in June 2002). In Figure 3, we plotted the differences between AVHRR and MODIS against the monthly SST data registered by MODIS. We can observe that although positive differences predominate (AVHRR SST is higher than MODIS SST) and that there is a trend towards higher bias associated with higher temperatures, the correlation is extremely weak (R2 = 0.143). In order to better evaluate the deviation between the sensors, we analyze the regional and seasonal differences in the following subsections.

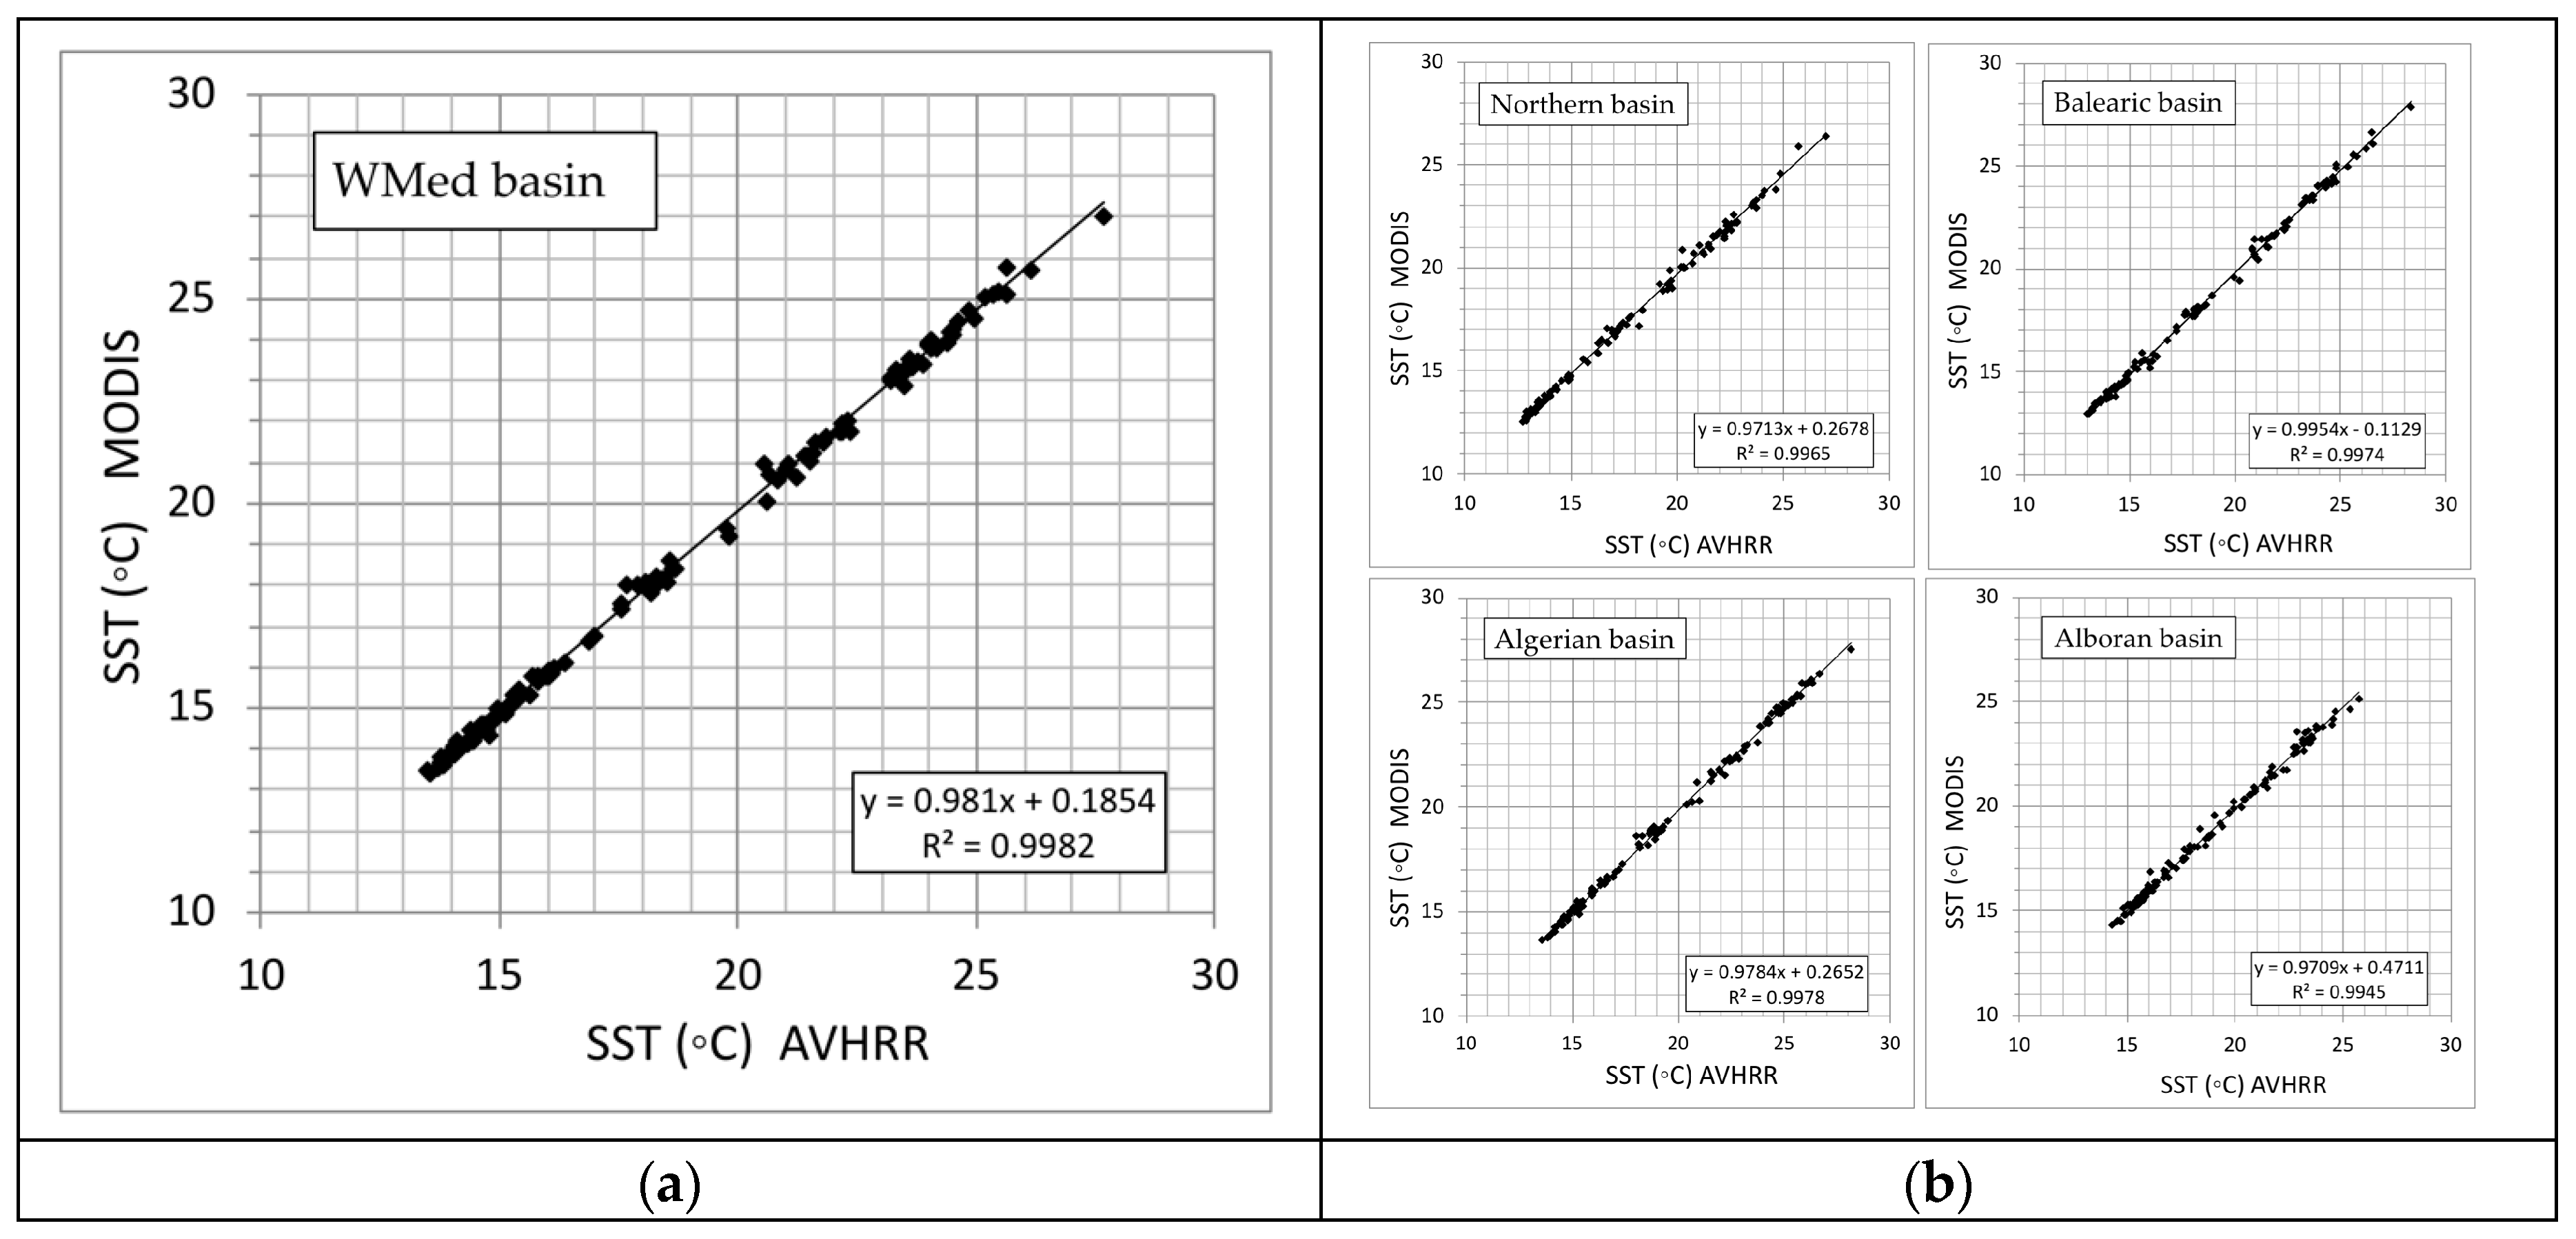
3.1. Regional Analysis

We plotted the monthly SST obtained from the AVHRR versus SST from MODIS for the whole WMed basin (Figure 4a) and for each one of the smaller basins (Figure 4b). The series showed a strong agreement in all the cases, with a coefficient R2 = 0.998 for the whole area and R2 > 0.99 for the smaller basins, which demonstrates a high correlation between both series when using spatially aggregated values in all the sub-basins (Table 1). The best correspondence was obtained in Alboran, the smallest basin, where the average difference was 0.08 °C ± 0.26 °C. The maximum difference was in the Northern basin, with 0.24 °C ± 0.25 °C. In all the sub-basins, the differences between average monthly values registered by the two sensors show a similar pattern, AVHRR SST being mostly higher than MODIS SST, but the proportion of records where AVHRR SST is lower than MODIS SST increases from north to south with 13% of the records in the Northern basin, 16% in Balearic, 24% in Algerian, and 34% in Alboran.

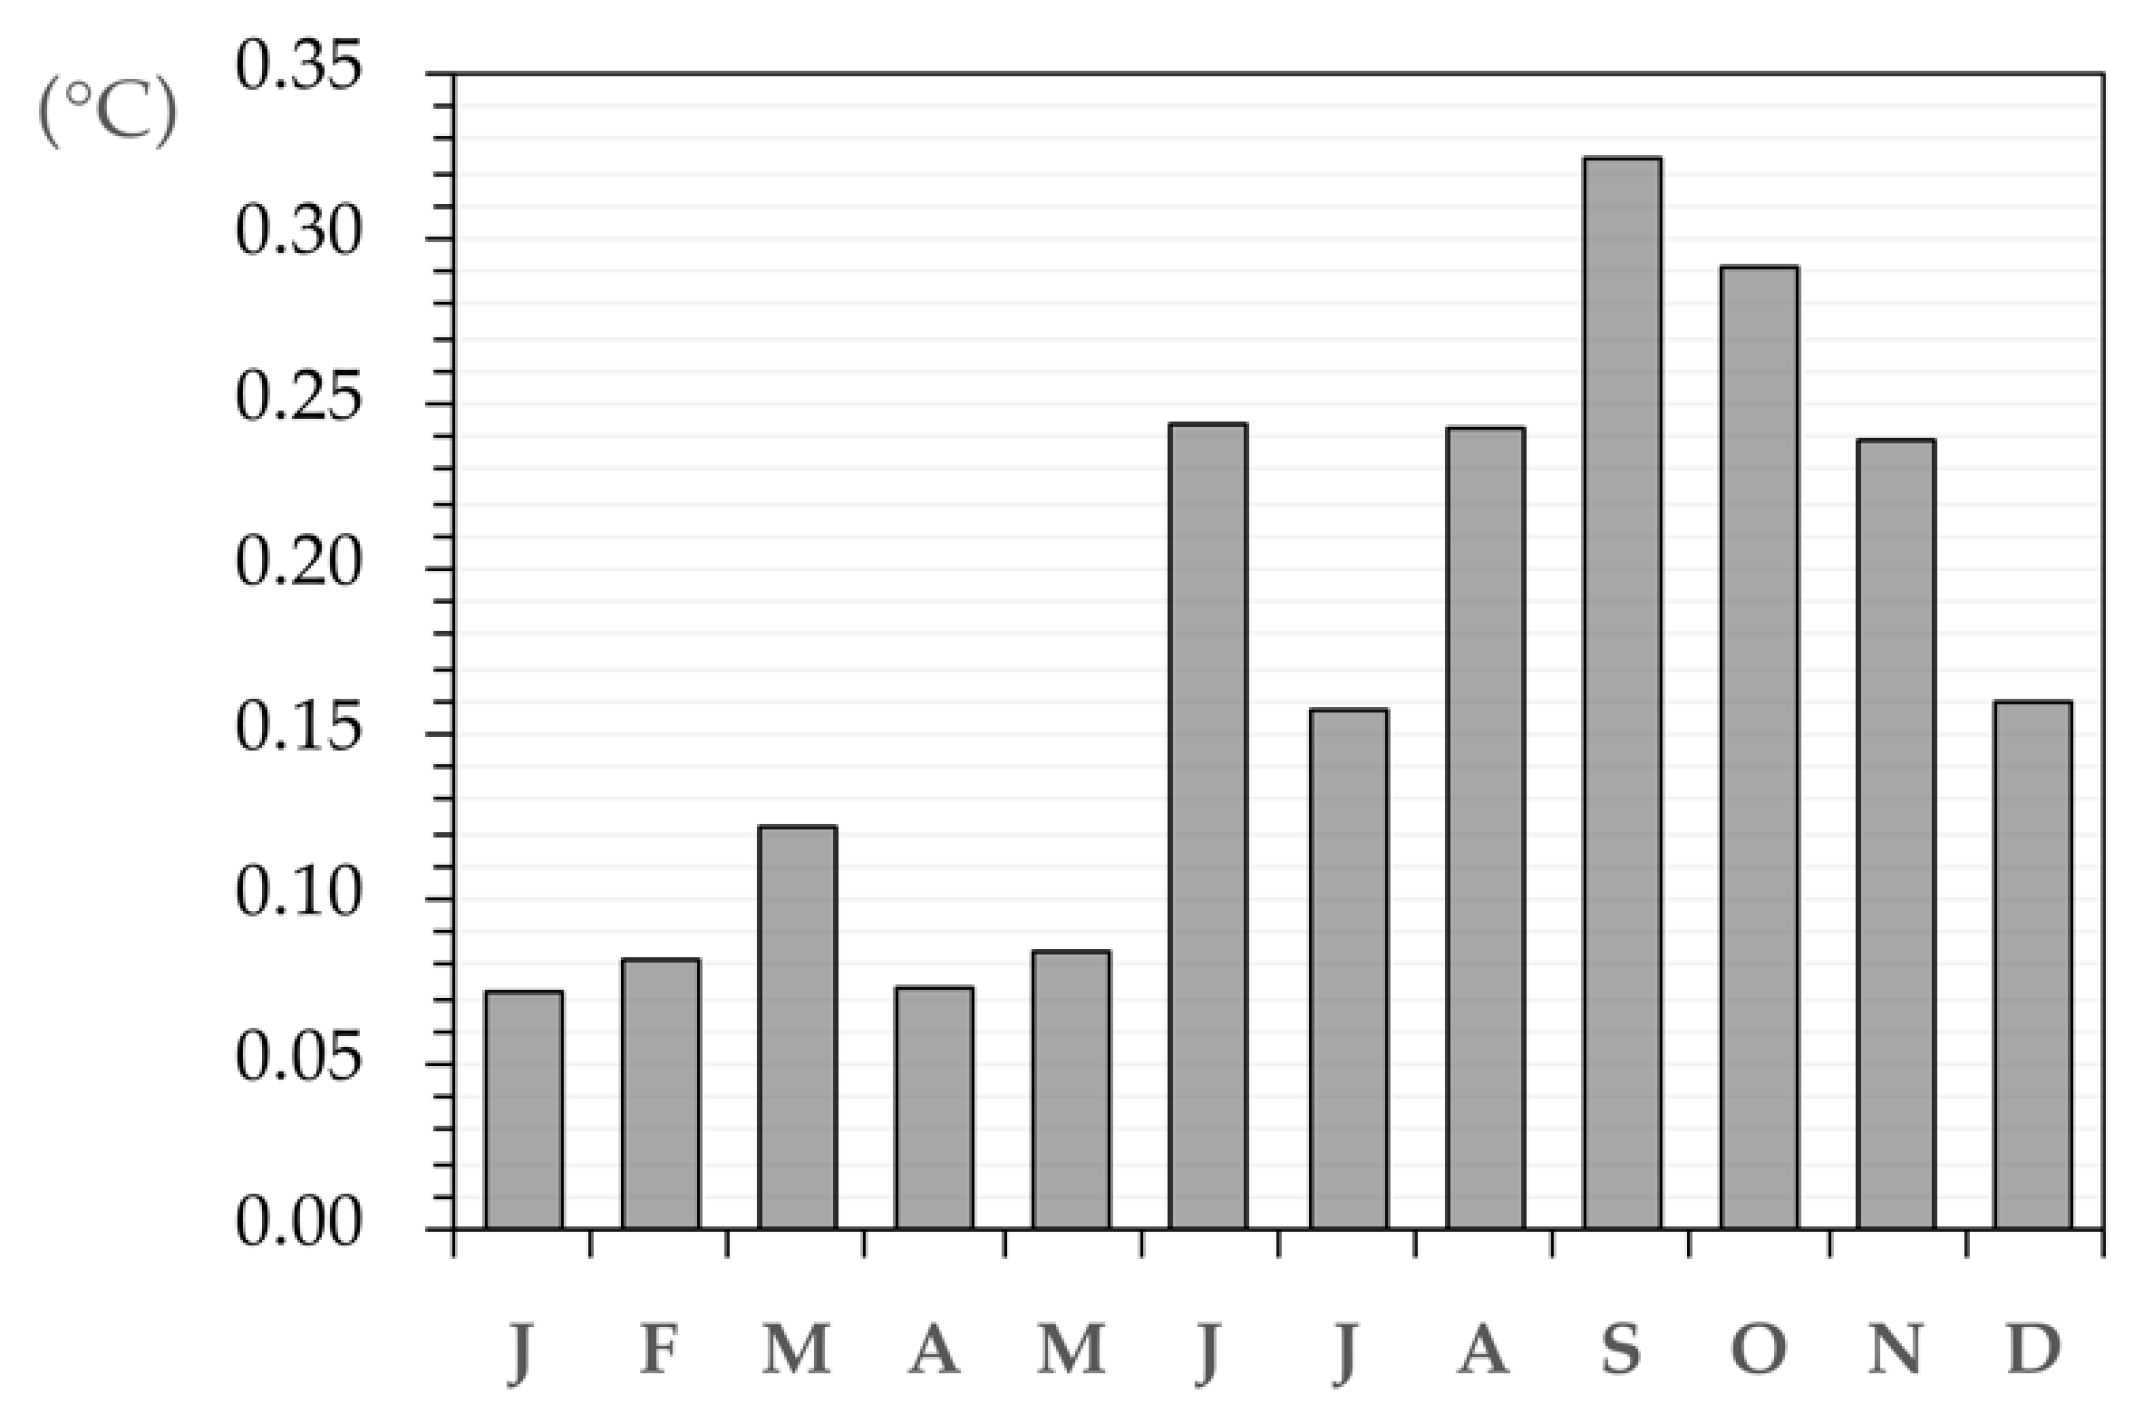
3.2. Seasonal Analysis

In order to analyze whether the deviation between the sensors shows any seasonal pattern, we also calculated the correlation for every month and the average difference for the entire study area (WMed). The data show a high correlation for each month, with coefficients (R2) ranging from 0.86 in May to 0.99 in August. Average differences obtained for each month showed a certain pattern, with the highest values obtained during the warmer months, as can be seen in Figure 5. During the cool period for the sea (from January to May), AVHRR and MODIS showed smaller differences, being on average +0.09 °C ± 0.1 °C. During the warm season (from June to December), the differences were slightly higher, i.e., +0.24 °C ± 0.2 °C, with September being the month when the highest difference (+0.32 °C ± 0.1 °C) between the two sensors was recorded. In all the months, AVHRR SST values were higher than MODIS SST values.

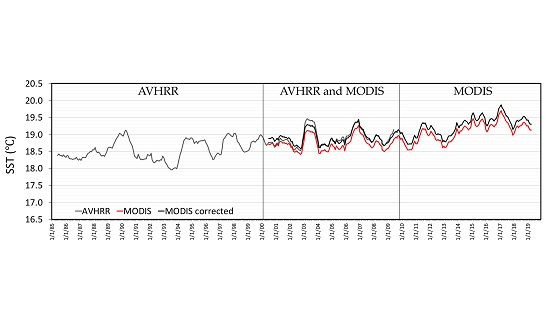
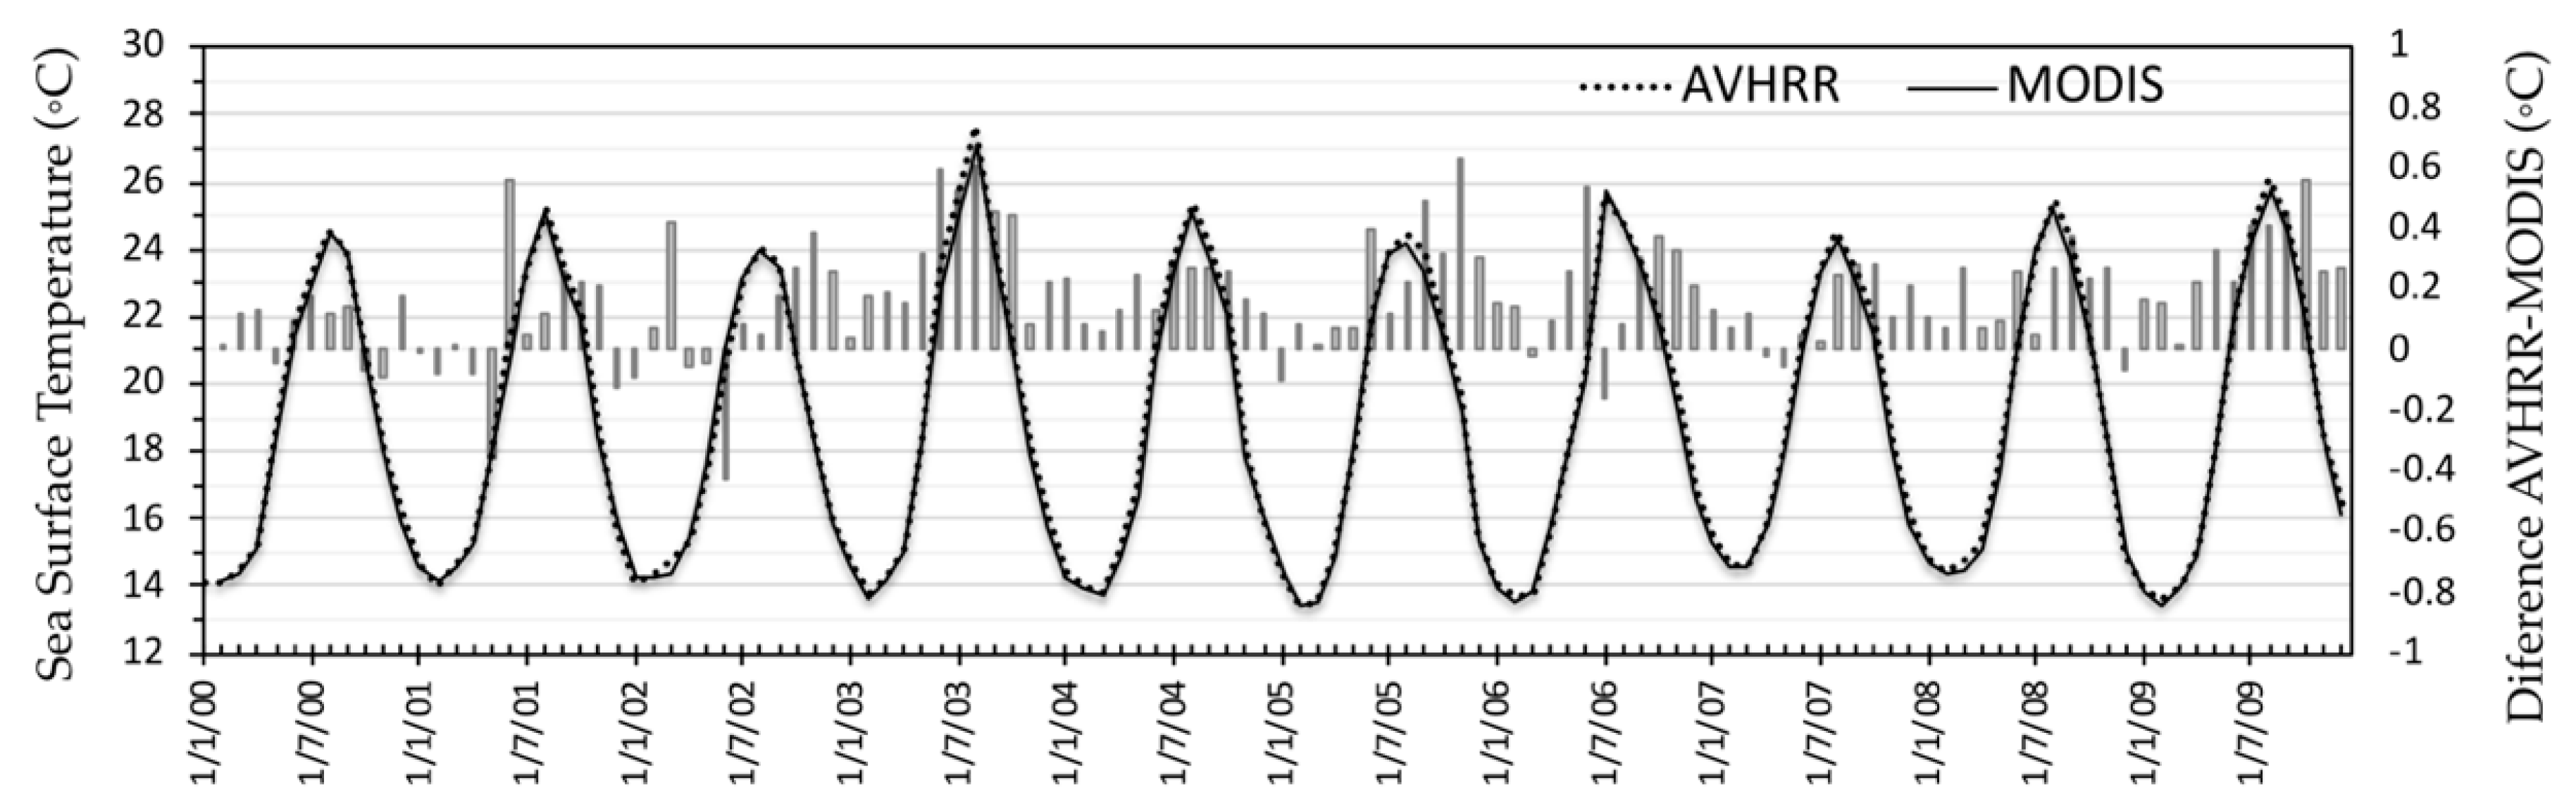
3.3. Analysis of Time Series

In spite of the seasonal differences, our analysis shows a very high correlation between the sensors for spatially averaged data, which allows us to conclude that the MODIS data can be used to complete time series of SST obtained from the AVHRR sensor when working with spatially averaged data. As an example, we adjusted the MODIS time series by adding the average monthly differences between the two series calculated above for the whole period for which the two series overlap (Figure 5). We adopted this method by way of illustration. Other approaches could be considered and we continue to investigate the most accurate and reliable. This combination of the original AVHRR series and the “corrected” MODIS time series allows the analysis of temporal trends of the recent warming of the Mediterranean Sea covering a period of 35 years and forward into the future, for as long as data continue to be available.
In Figure 6, we show the result of the analysis of temperature evolution carried out on the entire study area (WMed) between January 1985 and October 2019. The graph combines the monthly data from the AVHRR sensor for the period 1985–2009 and MODIS sensor data corrected for the monthly mean deviation calculated for the common period 2000–2019. A moving average of 12 months was applied to the monthly data to smooth out seasonal effects. In the graph, we represented in red the original MODIS series (from February 2000 to October 2019), in grey the original series of AVHRR (from January 1985 to February 2009), and in black the MODIS “corrected” series. The average differences between the AVHRR series and the MODIS “corrected” series for the overlapping period was 0.002 °C ± 0.16 °C. The largest deviation between the series is observed during the first years of MODIS data (in June 2002, with a deviation of +0.7 °C and during the European heat wave in summer 2003, −0.4 °C).
The concatenated series of AVHRR and MODIS data allowed us to quantify a global increase of 1.1 °C for the years 1985–2019, or an average rate of 0.033 °C/year. A recent study using the above “corrected” MODIS series jointly with AVHRR SST [49] allowed us to confirm the conclusions of previously published works [25,28] about the advance of the summer season in the Western Mediterranean. The highest trends were obtained in June and July (0.060 °C/year and 0.055 °C/year, respectively), which corresponds to a warming of 2 °C in these months over the last 35 years. These trends are consistent with those estimated by other authors using remote sensing data [24,26,27,29,30,31] in the Mediterranean Sea.

4. Discussion

Our analysis showed a high correlation (R2 = 0.99) between the AVHRR and MODIS sensors when monthly averaged values at the regional scale were compared. SST obtained from AVHRR are slightly higher than SST from MODIS in all the sub-basins and in every season. No significant trend was detected in the overlapping series; however, certain regional and seasonal patterns were detected that deserve further discussion.
The regional analysis shows that the lowest bias and the highest proportion of negative biases were found in Alboran, the smallest basin. This could be related to the thermal characteristics of this basin. We know from a previous analysis [25] that the lowest annual thermal amplitude of the entire study area is recorded in this basin (8.9 °C), because during the winter it shows the warmest waters and during the summer it has lower temperatures, similar to those registered in the northern basin. The reason for this is that the Alboran Sea is filled by the Atlantic water that flows at surface level towards the Mediterranean through the Strait of Gibraltar. This flow of water is constant throughout the year [18,48,50,51,52], which makes the temperature less variable than the waters in the other basins. The greater coincidence between the sensors could be related to a lower thermal variability over the year.
From the seasonal analysis, the lowest differences between the two sensors (<0.1 °C) are registered between January and May. This could be related to less bias of both sensors for lower temperatures, but it could also be related to less spatial SST variability observed in the basin during these months. In a previous study on SST trends in the Western Mediterranean (López García and Camarasa [25]), we identified the smallest SST spatial variability between January and April, whereas the highest variability was registered in autumn.
These seasonal differences in the SST values may also be related to lower spatial variability in the cooler months. During the cool season, when the solar forcing is less and the winds are stronger, the diurnal variations between warm layer/cool skin of the water surface are less pronounced. It is known that this mixing effect in the surface layer reduces the daily variation in the SST, which would reduce any possible effects of the differences in timing of the AVHRR and MODIS satellite overpasses.
Other authors, e.g., Riffler et al. [53], consider that a potential source of the difference between the two sensors could be residual cloud contamination in the MODIS as they found some scenes where the clouds were not properly detected. Their study of daily surface temperature of European Alpine lakes compared data from AVHRR and MODIS and found a good agreement between both datasets with biases between −0.5 °C and 0.2 °C, which is similar to the results presented here. However, the robustness of the MODIS monthly data [9] does not appear to be called into question by our results.
Finally, our results agree with those found by Allega et al. [41] in other geographical areas. For a study centered on a sector of the middle Argentina continental shelf off the San Jorge Gulf for the 2003–2006 period, those authors indicate a difference of +0.41 °C between AVHRR and MODIS data, the MODIS values being lower. Although the comparison is made using a different approach, the authors also pointed out a higher deviation (>1 °C) during the warm season and concluded that the temperature estimated by the sensors were similar.

5. Conclusions

This paper presents a comparison of the monthly SST data derived from two sensors, AVHRR and MODIS, in a series of ten years (2000–2009) in the Western Mediterranean basins. The comparison is based on average monthly values calculated in different sub-basins. The results showed a strong correlation (>0.99) between the series and a positive bias for AVHRR in all the sub-basins and also during all the months. On average, the difference between SST from NOAA-AVHRR and the SST obtained from Terra-MODIS is +0.18 °C ± 0.2 °C. The regional analysis found the smallest bias in the Alboran basin (+0.08 °C ± 0.26 °C) and the largest in the Northern basin (+0.24 °C ±0.25 °C). Seasonal differences showed that the bias was lower when the sea was cooler, with averaged differences of +0.09 °C ± 0.1 °C for the cold months (January to May) and the smallest difference recorded in January (+0.07 °C ± 0.1 °C), whereas the average difference was +0.24 °C ± 0.2 °C for the warmer months (June to December) reaching a maximum in September (+0.32 °C ± 0.1 °C).
The very high correlations and the predictability in their differences lead us to conclude that the sensors can be reliably used in combination to complete time series and to estimate temporal trends when working with spatially aggregated values. The study confirmed that AVHRR and MODIS products are consistently calibrated, but further adjustments may be necessary for time series analysis. The availability of overlapping data from quite a long period (2000–2009) allows the differences between both datasets to be calculated in different ways and, therefore, the most appropriate method for performing such adjustments is a matter for further investigation. While the bias between the datasets can be found precisely for specific geographic areas, to analyze temporal trends, including such phenomena as advancing summer, it may be better to tailor the adjustments to particular months or seasons.

Funding

This research received no external funding.

Acknowledgments

The author wishes to acknowledge the NASA EOSDIS PO.DAAD (Physical Oceanography Distributed Active Archive Center), Jet Propulsion Laboratory, Pasadena, California (USA) for providing the SST dataset used in the study and for the additional technical assistance.

Conflicts of Interest

The author declares no conflict of interest.

References

  1. Emery, W.J.; Castro, S.; Wick, G.A.; Schlüssel, P.; Donlon, C. Estimating Sea Surface Temperature from Infrared Satellite and In Situ Temperature Data. Bull. Am. Meteorol. Soc. 2001, 82, 2773–2785. [Google Scholar] [CrossRef] [Green Version]
  2. Minnett, P.J.; Alvera-Azcárate, A.; Chin, T.; Corlett, G.; Gentemann, C.; Karagali, I.; Li, X.; Marsouin, A.; Marullo, S.; Maturi, E.; et al. Half a century of satellite remote sensing of sea-surface temperature. Remote Sens. Environ. 2019, 233, 111366. [Google Scholar] [CrossRef]
  3. Deschamps, P.Y.; Phulpin, T. Atmospheric correction of infrared measurements of sea surface temperature using channels at 3.7, 11 and 12 Mm. Boundary-Layer Meteorol. 1980, 18, 131–143. [Google Scholar] [CrossRef]
  4. McMillin, L.M.; Crosby, D.S. Theory and validation of the multiple window sea surface temperature technique. J. Geophys. Res. Space Phys. 1984, 89, 3655. [Google Scholar] [CrossRef]
  5. McClain, E.P.; Pichel, W.G.; Walton, C.C. Comparative performance of AVHRR-based multichannel sea surface temperatures. J. Geophys. Res. Space Phys. 1985, 90, 11587. [Google Scholar] [CrossRef]
  6. Casey, K.S.; Brandon, T.B.; Cornillon, P.; Evans, R. The Past, Present, and Future of the AVHRR Pathfinder SST Program. In Oceanography from Space; Springer Science and Business Media LLC: New York, NY, USA, 2010; pp. 273–287. [Google Scholar]
  7. Minnett, P.; Evans, R.; Kearns, E.; Brown, O. Sea-surface temperature measured by the Moderate Resolution Imaging Spectroradiometer (MODIS). In Proceedings of the IEEE International Geoscience and Remote Sensing Symposium, Toronto, ON, Canada, 24–28 June 2002; Volume 2, pp. 1177–1179. [Google Scholar]
  8. Hosoda, K.; Murakami, H.; Sakaida, F.; Kawamura, H. Algorithm and validation of sea surface temperature observation using MODIS sensors aboard terra and aqua in the western North Pacific. J. Oceanogr. 2007, 63, 267–280. [Google Scholar] [CrossRef]
  9. Kilpatrick, K.; Podestá, G.; Walsh, S.; Williams, E.; Halliwell, V.; Szczodrak, M.; Brown, O.; Minnett, P.J.; Evans, R. A decade of sea surface temperature from MODIS. Remote Sens. Environ. 2015, 165, 27–41. [Google Scholar] [CrossRef]
  10. Stocker, T.F.; Qin, D.; Plattner, G.K.; Tignor, M.M.B.; Allen, S.K.; Boschung, J.; Nauels, A.; Xia, Y.; Bex, V.; Midgley, P.M. Climate Change 2013: The Physical Science Basis. Contribution of Working Group I to the Fifth Assessment Report of the Intergovernmental Panel on Climate Change; Cambridge University Press: Cambridge, UK; New York, NY, USA, 2013; ISBN 978-1-107-05799-1. [Google Scholar]
  11. Giorgi, F. Climate change hot-spots. Geophys. Res. Lett. 2006, 33, 08707. [Google Scholar] [CrossRef]
  12. Lionello, P.; Malanotte-Rizzoli, P.; Boscolo, R.; Alpert, P.; Artale, V.; Li, L.; Luterbacher, J.; May, W.; Trigo, R.M.; Tsimplis, M.; et al. The Mediterranean climate: An overview of the main characteristics and issues. In Mediterranean Climate Variability; Elsevier BV: Amsterdam, The Netherlands, 2006; Volume 4, pp. 1–26. [Google Scholar]
  13. Giorgi, F.; Lionello, P. Climate change projections for the Mediterranean region. Glob. Planet. Chang. 2008, 63, 90–104. [Google Scholar] [CrossRef]
  14. Lejeusne, C.; Chevaldonné, P.; Pergent-Martini, C.; Boudouresque, C.F.; Perez, T. Climate change effects on a miniature ocean: The highly diverse, highly impacted Mediterranean Sea. Trends Ecol. Evol. 2010, 25, 250–260. [Google Scholar] [CrossRef]
  15. Trenberth, K.E.; Jones, P.D.; Ambenje, P.; Bojariu, R.; Easterling, D.; Klein Tank, A.; Parker, D.; Rahimzadeh, F.; Renwick, J.A.; Rusticucci, M.; et al. Observations. Surface and Atmospheric Climate Change. In Climate Change 2007: The Physical Science Basis; Solomon, S., Qin, D., Manning, M., Marquis, M., Averyt, K.B., Tignor, M., Miller, H.L., Chen, Z., Eds.; Contribution of Working Group I to the Fourth Assessment Report of the Intergovernmental Panel on Climate Change, Chapter 3; Cambridge University Press: Cambridge, UK, 2007; pp. 235–336. [Google Scholar]
  16. Belkin, I.M. Rapid warming of Large Marine Ecosystems. Prog. Oceanogr. 2009, 81, 207–213. [Google Scholar] [CrossRef]
  17. Von Schuckmann, K.; Le Traon, P.-Y.; Smith, N.; Pascual, A.; Brasseur, P.; Fennel, K.; Djavidnia, S.; Aaboe, S.; Fanjul, E.A.; Autret, E.; et al. Copernicus Marine Service Ocean State Report. J. Oper. Oceanogr. 2018, 11, S1–S142. [Google Scholar] [CrossRef] [Green Version]
  18. Millot, C. Some features of the Algerian Current. J. Geophys. Res. Oceans 1985, 90, 7169–7176. [Google Scholar] [CrossRef]
  19. La Violette, P.E.; Tintore, J.; Font, J. The surface circulation of the Balearic Sea. J. Geophys. Res. Oceans 1990, 95, 1559. [Google Scholar] [CrossRef]
  20. López García, M.J.; Millot, C.; Font, J.; García-Ladona, E. Surface circulation variability in the Balearic Basin. J. Geophys. Res. Oceans 1994, 99, 3285. [Google Scholar] [CrossRef]
  21. Millot, C.; Taupier-Letage, I.; Le Borgne, P.; López-García, M.J.; Wald, L. Dynamical Oceanography Studies from Infrared Remote Sensing in the Western Mediterranean Sea. Mém. l’Inst. Océanograph. Monaco 1994, 18, 1–11. [Google Scholar]
  22. Santoleri, R.; Bohm, E.; Schiano, M.E. The sea surface temperature of the western Mediterranean Sea: Historical satellite thermal data. Coast. Estuar. Stud. 1994, 46, 155–176. [Google Scholar] [CrossRef]
  23. Marullo, S.; Santoleri, R.; Malanotte-Rizzoli, P.; Bergamasco, A. The sea surface temperature field in the Eastern Mediterranean from advanced very high resolution radiometer (AVHRR) data. J. Mar. Syst. 1999, 20, 63–81. [Google Scholar] [CrossRef]
  24. Nykjaer, L. Mediterranean Sea surface warming 1985–2006. Clim. Res. 2009, 39, 11–17. [Google Scholar] [CrossRef]
  25. López García, M.J.; Camarasa-Belmonte, A.M. Recent trends of SST in the Western Mediterranean basins from AVHRR Pathfinder data (1985–2007). Glob. Planet. Chang. 2011, 78, 127–136. [Google Scholar] [CrossRef] [Green Version]
  26. Skliris, N.; Sofianos, S.; Gkanasos, A.; Mantziafou, A.; Vervatis, V.; Axaopoulos, P.; Lascaratos, A. Decadal scale variability of sea surface temperature in the Mediterranean Sea in relation to atmospheric variability. Ocean Dyn. 2011, 62, 13–30. [Google Scholar] [CrossRef]
  27. Shaltout, M.; Omstedt, A. Recent sea surface temperature trends and future scenarios for the Mediterranean Sea. Oceanologia 2014, 56, 411–443. [Google Scholar] [CrossRef] [Green Version]
  28. López García, M.J. Recent warming in the Balearic Sea and Spanish Mediterranean coast. Towards an earlier and longer summer. Atmósfera 2015, 28, 149–160. [Google Scholar] [CrossRef]
  29. Pastor, F.; Valiente, J.A.; Palau, J.L. Sea Surface Temperature in the Mediterranean: Trends and Spatial Patterns (1982–2016). Pageoph Top. Vol. 2019, 175, 297–309. [Google Scholar] [CrossRef]
  30. Mohamed, B.; Abdallah, A.M.; Alam El-Din, K.; NagyiD, H.; Shaltout, M.; Mohamed, A. Inter-Annual Variability and Trends of Sea Level and Sea Surface Temperature in the Mediterranean Sea over the Last 25 Years. Pure Appl. Geophys. PAGEOPH 2019, 176, 3787–3810. [Google Scholar] [CrossRef]
  31. Pisano, A.; Marullo, S.; Artale, V.; Falcini, F.; Yang, C.; Leonelli, F.E.; Santoleri, R.; Nardelli, B.B. New Evidence of Mediterranean Climate Change and Variability from Sea Surface Temperature Observations. Remote Sens. 2020, 12, 132. [Google Scholar] [CrossRef] [Green Version]
  32. Salat, J.; Pascual, J.; Flexas, M.; Chin, T.M.; Vazquez-Cuervo, J. Forty-five years of oceanographic and meteorological observations at a coastal station in the NW Mediterranean: A ground truth for satellite observations. Ocean Dyn. 2019, 69, 1067–1084. [Google Scholar] [CrossRef] [Green Version]
  33. D’Ortenzio, F.; Marullo, S.; Santoleri, R. Validation of AVHRR Pathfinder SST’s over the Mediterranean Sea. Geophys. Res. Lett. 2000, 27, 241–244. [Google Scholar] [CrossRef]
  34. Kilpatrick, K.; Podestá, G.; Evans, R. Overview of the NOAA/NASA advanced very high resolution radiometer Pathfinder algorithm for sea surface temperature and associated matchup database. J. Geophys. Res. Space Phys. 2001, 106, 9179–9197. [Google Scholar] [CrossRef]
  35. Marullo, S.; Nardelli, B.B.; Guarracino, M.; Santoleri, R. Observing the Mediterranean Sea from space: 21 years of Pathfinder-AVHRR sea surface temperatures (1985 to 2005): Re-analysis and validation. Ocean Sci. 2007, 3, 299–310. [Google Scholar] [CrossRef] [Green Version]
  36. Oesch, D.C.; Jaquet, J.-M.; Hauser, A.; Wunderle, S. Lake surface water temperature retrieval using advanced very high resolution radiometer and Moderate Resolution Imaging Spectroradiometer data: Validation and feasibility study. J. Geophys. Res. Oceans 2005. [Google Scholar] [CrossRef] [Green Version]
  37. Qin, H.; Chen, G.; Wang, W.; Wang, D.; Wang, D. Validation and application of MODIS-derived SST in the South China Sea. Int. J. Remote Sens. 2014, 35, 4315–4328. [Google Scholar] [CrossRef]
  38. Ghanea, M.; Moradi, M.; Kabiri, K.; Mehdinia, A. Investigation and validation of MODIS SST in the northern Persian Gulf. Adv. Space Res. 2016, 57, 127–136. [Google Scholar] [CrossRef]
  39. Narayanan, M.; Vasan, D.T.; Bharadwaj, A.K.; Thanabalan, P.; Dhileeban, N. Comparison and validation of sea surface temperature (SST) using MODIS and AVHHRR sensor data. Int. J. Remote Sens. Geosci. 2013, 2, 2319–3484. [Google Scholar]
  40. Robles-González, C.; López Gordillo, N.; Fernández Renau, A.; García-Sevilla, A.; Santana-Suárez, J. Comparación de la temperatura de la superficie del mar calculada a partir de datos AVHRR y MODIS. Rev. Teledetec. 2011, 35, 5–16. Available online: http://www.aet.org.es/revistas/revista35/Numero35_01.pdf (accessed on 29 May 2020).
  41. Allega, L.; Cozzolino, E.; Pisoni, J.P.; Piccolo, M.C. Comparación de los productos de TSM L3 generados a partir de los sensores AVHRR y MODIS frente al Golfo San Jorge, Argentina. Rev. Teledetec. 2017, 50, 17–26. [Google Scholar] [CrossRef]
  42. Deschamps, P.Y.; Frouin, R. Large Diurnal Heating of the Sea Surface Observed by the HCMR Experiment. J. Phys. Oceanogr. 1984, 14, 177–184. [Google Scholar] [CrossRef] [Green Version]
  43. Philippe, M.; Harang, L. Surface Temperature Fronts in the Mediterranean Sea from Infrared Satellite Imagery. In Polynyas: Windows to the World; Elsevier BV: Amsterdam, The Netherlands, 1982; Volume 34, pp. 91–128. [Google Scholar]
  44. Millot, C.; Wald, L. Infra-red remote sensing in the Gulf of Lions. In Oceanography from Space; Marine Science; Springer: Boston, MA, USA, 1981; Volume 13, pp. 183–187. [Google Scholar]
  45. Vázquez, J.; Perry, K.; Kilpatrick, K. NOAA/NASA AVHRR Oceans Pathfinder Sea Surface Temperature Data Set User’s Reference Manual, Version 4.0; Technical Report for JPL Publication D-14070; Jet Propulsion Laboratory: Pasadena, CA, USA, 1998. [Google Scholar]
  46. OBPG. MODIS Terra Level 3 SST Thermal IR Monthly 4km Nighttime v2014.0. Ver. 2014.0. PO.DAAC, CA, USA. 2015. Available online: https://doi.org/10.5067/MODST-MO4N4 (accessed on 29 May 2020).
  47. López García, M.J. La temperatura del Mar. Balear a partir de imágenes de satélite; Universitat de València: Valencia, Spain, 1990. [Google Scholar]
  48. Millot, C. Circulation in the Western Mediterranean Sea. J. Mar. Syst. 1999, 20, 423–442. [Google Scholar] [CrossRef] [Green Version]
  49. LópezGarcía, M.J. What is the temperature rise in the Mediterranean? Metode Sci. Stud. J. 2020. under review. [Google Scholar]
  50. Millot, C.; Taupier-Letage, I.; Benzohra, M. The Algerian eddies. Earth-Science Rev. 1990, 27, 203–219. [Google Scholar] [CrossRef]
  51. Bryden, H.L.; Kinder, T.H. Recent Progress in Strait Dynamics. Rev. Geophys. 1991, 29, 617–631. [Google Scholar] [CrossRef]
  52. Candela, J. The Gibraltar Strait and its role in the dynamics of the Mediterranean Sea. Dyn. Atmos. Oceans 1991, 15, 267–299. [Google Scholar] [CrossRef]
  53. Riffler, M.; Lieberherr, G.; Wunderle, S. Lake surface water temperatures of European Alpine lakes (1989–2013) based on the Advanced Very High Resolution Radiometer (AVHRR) 1 km data set. Earth Syst. Sci. Data 2015, 7, 1–17. [Google Scholar] [CrossRef] [Green Version]
Figure 1. Example image of Sea Surface Temperature (SST) of the Mediterranean Sea used in the study. It corresponds to August 2000 from the Terra-MODerate-resolution Imaging Spectroradiometer (MODIS) satellite. The zoom shows the study area (WMed) and the four sub-basins with the grid points used to calculate the average values.
Remotesensing 12 02241 g001
Figure 2. Monthly SST (left-hand scale) for 2000–2009 in the Western Mediterranean obtained from the Advanced Very High Resolution Radiometer (AVHRR) and MODIS data. The bars represent the monthly differences (right-hand scale) between the sensors.
Remotesensing 12 02241 g002
Figure 3. Difference (AVHRR-MODIS) SST vs. monthly MODIS SST for the period 2000–2009 in the Western Mediterranean. Positive values indicate that AVHRR SST are higher than MODIS SST and negative values indicate the contrary. A slight trend towards higher bias at higher temperatures was observed but the correlation was weak (R2 = 0.143).
Remotesensing 12 02241 g003
Figure 4. Correlation between monthly SST obtained from AVHRR and MODIS sensors in different basins: (a) Western Mediterranean and (b) Northern, Balearic, Algerian, and Alboran sub-basins.
Remotesensing 12 02241 g004
Figure 5. Monthly average differences (°C) between SST derived from AVHRR and MODIS calculated from a 9-year series covering the entire study area (WMed).
Remotesensing 12 02241 g005
Figure 6. A 12-month moving average time series of SST in the Western Mediterranean between 1985 and 2019 obtained from the combination of monthly data from AVHRR (1985–2009), in grey, and MODIS (2000–2019), in red. In black are the MODIS data corrected for the average deviation per month between the sensors.
Remotesensing 12 02241 g006
Table 1. Comparison of the monthly mean SST values obtained in each basin from AVHRR and MODIS data for the period 2000–2009.
BasinsCorrelation Coefficient (R2)Average Difference 1 AVHRR-MODIS (°C)Range of the Differences (min/max) (°C)Positive Differences over the Total Cases (%)
Northern0.990.24 ± 0.25−0.65/1.0387
Balearic0.990.20 ± 0.22−0.45/0.8284
Algerian0.990.16 ± 0.22−0.54/0.7676
Alboran0.990.08 ± 0.26−0.82/0.7066
WMed0.990.18 ± 0.19−0.42/0.6386
Note: 1 These data show the mean of the differences in the entire period analyzed.

