Abstract
Mangrove migration, or transgression in response to global climatic changes or sea-level rise, is a slow process; to capture it, understanding both the present distribution of mangroves at individual patch (single- or clumped trees) scale, and their rates of change are essential. In this study, a new method was developed to delineate individual patches and to estimate mangrove cover from very high-resolution (0.08 m spatial resolution) true color (Red (R), Green (G), and Blue (B) spectral channels) aerial photography. The method utilizes marker-based watershed segmentation, where markers are detected using a vegetation index and Otsu’s automatic thresholding. Fourteen commonly used vegetation indices were tested, and shadows were removed from the segmented images to determine their effect on the accuracy of tree detection, cover estimation, and patch delineation. According to point-based accuracy analysis, we obtained adjusted overall accuracies >90% in tree detection using seven vegetation indices. Likewise, using an object-based approach, the highest overlap accuracy between predicted and reference data was 95%. The vegetation index Excess Green (ExG) without shadow removal produced the most accurate mangrove maps by separating tree patches from shadows and background marsh vegetation and detecting more individual trees. The method provides high precision delineation of mangrove trees and patches, and the opportunity to analyze mangrove migration patterns at the scale of isolated individuals and patches.
1. Introduction
Mangroves form an important coastal wetland ecosystem, dominating tropical and subtropical coastlines globally [1,2]. They are crucial not only for human economic activities, but also for a diverse group of terrestrial and marine species that are dependent on mangrove ecosystems for habitat [3,4]. Mangroves attenuate overland flow of water and therefore act as a shield that protects both natural and human infrastructure from storm surges [5]. Threatened by global climatic changes, sea-level rise, and human developments, mangrove response is variable, either retreating seaward or transgressing landward into other ecosystems [6,7,8,9,10,11,12]. To better comprehend these alternative trajectories, it is necessary to understand how mangroves are presently distributed and how their distributions have changed over time across a range of coastal environments. However, long-term monitoring of coastal and marine systems is rare [13], and, therefore, deciphering the changes in distribution of mangroves through time is a challenging task. In part, the reason is that mangroves typically occupy periodically inundated and remote regions where it is challenging, time-consuming, and cost-intensive to survey them through traditional field-based methods [2]. In contrast, information acquisition with greater coverage at lower cost is achievable through remote sensing methods. Remote sensing methods have been increasingly used in the past few decades to extract information for mapping and monitoring of forests [14].
Mangrove retreat or expansion is likely to be observed first in ecotones, the brackish transition zones between the coastal ecosystems and the interior freshwater ecosystems where mangrove trees mix with freshwater marsh vegetation. We expect that the leaves of evergreen mangrove trees will absorb more light in the blue and red spectra and reflect more light in the green spectrum, resulting in a large reflectance difference between green and red/blue bands. In contrast, partially senesced marsh vegetation, especially during the dry season, has a relatively small reflectance difference between green and red/blue bands. This distinct difference in spectral reflectance between mangroves and the graminoids that dominate in marshes, will allow the separation of these two vegetation growth forms using remote sensing imagery.
Vegetation mapping involving multispectral images are commonly applied in global studies [15,16]. Medium resolution multispectral images (e.g., Landsat, NASA, Greenbelt, MD, USA) are free of charge, have temporal coverage dating to the late 1970s, and spatial resolutions of 10s to 100s of meters that are adequate for detecting large-scale disturbances caused by episodic events such as hurricanes [17]. Though Giri et al. [15] mapped the global distribution of mangroves using medium resolution Landsat images and Global Land Survey data, and mangrove related vegetation mapping studies are becoming commonplace [18,19], we did not find any study that addressed tree crown detection, delineation, and cover estimation of mangroves at the individual patch level using true color or multi-spectral images. Detection of the early stages of mangrove invasion into freshwater marshes necessitates higher spatial resolution images (e.g., WorldView-2, DigitalGlobe, Westminster, CO, USA). Medium resolution imagery from satellites such as Landsat is too coarse to detect the subtle changes occurring at the patch or individual tree scale. However, acquisition of high-resolution images over large spatial extents with commercial satellites can be prohibitively expensive. In addition, mangrove transgression is inherently a slow process, and it takes multiple decades to detect mangroves as they mature starting from small seedlings. As such, the short temporal coverage of high-resolution multispectral images is insufficient to study mangrove transgression in much detail [20].
At the same time, a huge repository of high-resolution aerial photographs, some dating back as far as the early 1900s, are available for many parts of the world [21]. These aerial photographs are available as true color, infrared, or panchromatic photographs as hard or soft copies. The most commonly used method in mapping vegetation from aerial photography is manual digitization [22,23], which is not only time-consuming but also subject to the interpretation of the digitizing analyst, making repeatability and replication at the same accuracy and precision difficult.
Therefore, a desirable goal is to use automated detection, and delineation techniques to detect subtle changes in crown- and patch sizes at decadal time scales using high spatial resolution (sub-meter) true color (RGB), near-infrared and panchromatic aerial photographs that were acquired by conventional frame cameras. We present here an initial step toward that goal, an evaluation of the suitability of RGB aerial photography in a fully automated delineation process, differentiating tree patches against a graminoid marsh wetland matrix.
Researchers have successfully used true color (RGB) photographs in detection and delineation of tree crowns by various segmentation techniques [24,25,26,27,28,29]. Segmentation techniques separate an image into target plant and background components. Three widely used segmentation techniques are (i) color-index based segmentation, (ii) threshold-based segmentation, and (iii) learning-based segmentation [30]. Color-index or vegetation index is used to enhance the contrast between vegetation and non-vegetated classes. The rationale behind using color-based vegetation indices is to outline the vegetation region of interest, e.g., crops or trees, by combining information from several bands into a single grayscale image. Many color-based indices have been developed, among others Excess Green [31], Excess Red [32], Vegetative Index [33], Visible Atmospheric Resistance Index [34], Normalized Difference Index [35], Triangular Greenness Index [36], and Visible-band Difference Vegetation Index [28]. Other indices combine two or more vegetation indices such as Excess Green minus Excess Red [25], and the Combined index [27].
Despite promising outcomes, limitations of color-based indices to segment images have been reported when images are captured under variable light conditions [30]. Segmentation requires thresholding techniques which often depend on a user-selected threshold. Higher threshold selection may lead to under-segmentation, thereby merging plant pixels with background pixels, while lower threshold selection may lead to over-segmentation [30]. Among several thresholding techniques, Otsu’s automatic thresholding method [37] is one of the most widely used. Because thresholds are determined automatically in Otsu’s method, this approach is particularly applicable where several images must be processed, thereby reducing the time required to binarize the images.
Limitations of color-based vegetation indices and thresholding methods have prompted researchers to use machine learning approaches including both unsupervised [38] and supervised methods [39,40]. However, these approaches are complex and often require substantial user input and feedback at multiple stages of the process, making them labor intensive.
Wang et al. [41] categorized several other automatic recognition algorithms for individual tree delineation into four major types: contour-based, local maximum, template matching, and 3D-model. The contour-based method relies on intensity changes which in turn are scale dependent. Therefore, the biggest challenge with contour-based methods is to find a scale that is appropriate for all individual trees in the same image [41]. Local maximum methods underperform because of varied illumination conditions and irregular background phenomena in the image [41]. Model-based template matching requires detailed a priori knowledge about the object and is susceptible to varying illumination and noise in the image. Some researchers have applied 3D-based methods. One such method is the watershed segmentation algorithm, a region-based approach originally proposed by Digabel et al. [42] and revised by Beucher et al. [43]. Later, Meyer et al. [44] introduced marker-controlled watershed segmentation to overcome the problem of over-segmentation due to noise in the image [14]. The underlying principle stems from the geographical concept of watersheds and catchments.
Watershed segmentation requires a grayscale input image which is viewed as a topographic surface where the intensity (gray level) of each pixel represents elevation, and local maxima represent the tree crowns. To form catchment basins and delineate watersheds, the image is inverted so that local maxima become local minima, which form valleys [41,45]. As the surface is slowly flooded with water, water will start accumulating in the valleys (local minima) until it overflows into adjacent valleys. The idea is to prevent the water in neighboring catchments from merging by building dams on the watershed lines, thereby creating the boundary of each segment, or catchment basin [45]. Thus, a catchment basin becomes the tree crown or a contiguous patch region with several clumped trees, and the watershed lines become the edge of the crowns or patches.
There are two critical steps for accurate delineation of tree crowns by the watershed method:
- Generating a binary grayscale image;
- Delineating markers.
Various approaches have been used to implement these two steps [41,46,47,48]. Lamar et al. [48] developed an automated segmentation method to extract populations of hemlock trees for multi-temporal assessment from aerial images, using a spectrally classified binary image, and generated the markers by Euclidean distance map construction and Gaussian smoothing. Wang et al. [41] detected and delineated tree crowns from a high resolution multispectral aerial image. They identified and created two sets of treetops from the first component of a principal component analysis. The two sets were created using a local non-maximum suppression method, and a local maximum on morphologically transformed distance method, each producing a binary image of the treetops. The markers were generated by intersection of the two binary images based on well-defined criteria. Recently, Yin et al. [49] detected and delineated individual mangrove trees from light detection and ranging (LiDAR) data by seed region growing (SRG) and marker-controlled watershed segmentation (MCWS). The seeds/markers were assumed to be the treetops which were detected as local maxima from the canopy height model (CHM) using variable window filtering method. Although watershed segmentation holds the potential to use spectral imagery to differentiate and delineate tree crowns from a background matrix [48], this method has been evaluated mostly in non-mangrove forest settings.
Our objective was to fully automate an image segmentation technique to detect and delineate mangrove patches. By mangrove patches, we refer to mangroves that either occur as isolated individual trees that are large enough to be detected, or several trees that are clumped together. The mangroves were embedded in a graminoid dominated wetland landscape with a mixture of grasses, sedges, and rushes. Since true color aerial photographs have only three spectral bands (RGB), we evaluated which vegetation indices most effectively enhanced the contrast between target pixels (i.e., mangrove patches) and their background.
The application of a fully automated delineation of mangrove patches using the watershed algorithm to high-resolution true-color aerial photography was conducted in a two-step process: (1) Generation of a vegetation index and application of Otsu’s thresholding method, followed by morphological operations to delineate markers; (2) Delineation of tree patches with marker-controlled watershed segmentation. In this paper we present the process that identified the vegetation indices and parameter settings that best delineate markers for watershed segmentation to detect mangrove patches. Assessment of the best method was evaluated on the basis of (1) agreement between algorithm-detected tree cover compared to actual cover, (2) overall and class-specific user’s and producer’s accuracies, and (3) object-based (patch) accuracy estimates.
The remaining sections of the paper are arranged as follows: Section 2 describes the study area, the components of the watershed algorithm and the metrics used to evaluate algorithm performance; Section 3 presents the results of the sensitivity analysis, and the success of individual tree detection and extraction of tree patches; Section 4 discusses the effects of parameter selection, vegetation indices, Otsu’s thresholding method, and the presence of shadows on the detection and delineation of trees; and Section 5 presents the study’s conclusions.
2. Materials and Methods
2.1. Study Area and Image Acquisition
The study area is located adjacent to Everglades National Park, in Florida, USA, approximately 300 m south of the C-111 Canal and 3.6 km west of South Dixie Highway (Figure 1).
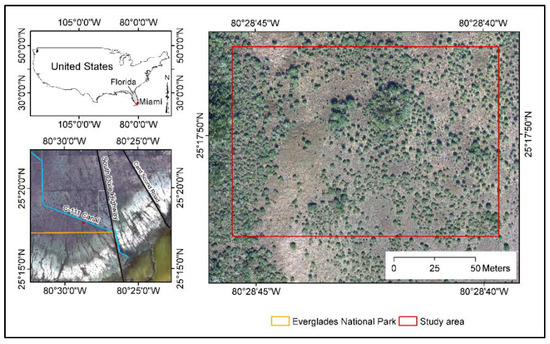
Figure 1.
Study area in the southern Everglades, adjacent to Everglades National Park, Florida, USA.
The study area consists of heterogeneous freshwater herbaceous marsh vegetation with scattered occurrences of red mangroves (Rhizophora mangle). A georeferenced true color aerial photograph was used with a spatial resolution of 0.08 m (0.25 foot), acquired in the dry season on January 24, 2017 by Miami-Dade County [50]. The RGB image was acquired using Vexcel Ultracam Eagle (UCEagle) large format aerial sensor and was processed with Inpho (Trimble, Sunnyvale, CA, USA) Photogrammetry software. Each channel recorded 8-bit digital number (DN) brightness values ranging from 0 to 255. The methodology is presented in a flowchart in Figure 2 and the steps are described in detail in the following sections. Digitization and visual interpretation of reference samples was conducted in ArcGIS 10.5 [51]; index calculation, thresholding, and watershed processing were scripted in Python [52] using openCV [53] and scikit-learn [54]; and data analysis, and accuracy assessment were performed in R [55].
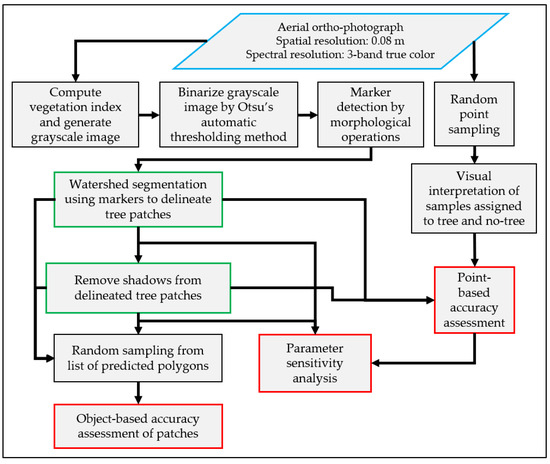
Figure 2.
Flowchart of individual mangrove tree patches delineated from aerial photograph (blue box) using vegetation indices, Otsu’s thresholding, and watershed segmentation. Parameter sensitivity analysis and accuracy assessments (red boxes) were performed on segmented images with and without shadow removal (green boxes).
2.2. Vegetation Indices
To determine the vegetation indices that delineated patches with highest accuracy, 14 commonly used indices were calculated (Table 1) from the RGB aerial image that covered the study area (Figure 1). The image contained individual and clumped mangrove trees within a graminoid marsh matrix. Through their interactions with incoming solar radiation, the two vegetation classes (marsh and mangrove) vary in absorption and reflection of electromagnetic radiation of different wavelengths, with trees also casting shadows onto other trees and marsh vegetation (Figure 3). As expected, mangroves reflected more light in the green spectrum than surrounding marsh vegetation or shadows (Figure 3). Suitable vegetation indices enhance the contrast between tree patches, marsh matrix, and shadows. The 14 vegetation indices (Table 1) were calculated with equations presented in Table 1.

Table 1.
Commonly used vegetation indices their equations and source references.
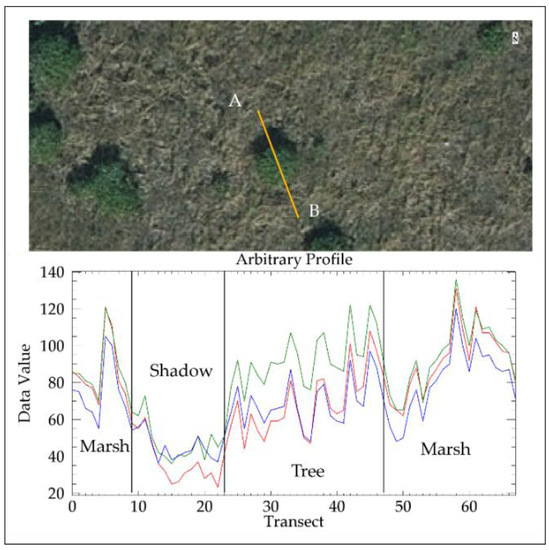
Figure 3.
RGB spectral values shown across a selected linear profile AB extracted from the aerial photograph.
No normalization was applied to the brightness values because the vegetation indices were mainly used to identify tree markers, and normalization does not necessarily enhance the contrast in index values between trees and marsh. The calculation of vegetation indices resulted in grayscale images as shown by ExG and ExR images (Figure 4). Gray index images were then binarized by Otsu’s automatic thresholding method and used for delineation of markers.
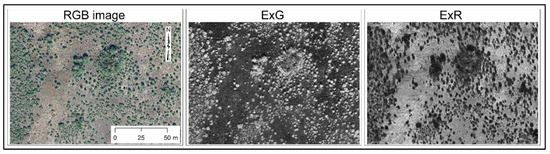
Figure 4.
The original RGB aerial photograph and grayscale images of vegetation indices ExG and ExR.
2.3. Otsu’s Thresholding Method
Otsu’s automatic thresholding method [37] was used to generate the binary images for tree patches (with values of 1) and background marsh matrix (with values of 0). This thresholding method is a non-parametric approach which uses the histogram of the pixel brightness values derived from grayscale images representing two normal intensity distributions that show a bimodal distribution [25]. One distribution represents the target pixels (i.e., mangrove patches) and the other represents the background (i.e., marsh matrix). Figure 5a shows the histograms of five vegetation indices that display narrow to widely spread bimodal distributions. Otsu’s method maximizes the between-class variance while minimizing the within-class variance of the intensity values in the image, thereby providing optimal thresholding for an index (Figure 5b).
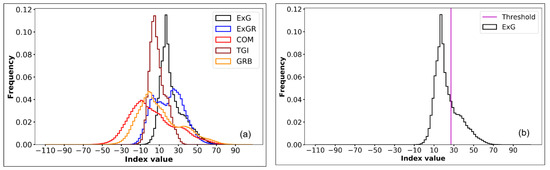
Figure 5.
(a) Histogram of five vegetation grayscale indices (ExG, ExGR, COM, TGI, and GRB); (b) Otsu’s automatic threshold for the ExG grayscale image.
2.4. Marker Detection and Watershed Segmentation
The markers for watershed segmentation were delineated from the binary image performing the following steps:
- Opening morphological transformations that conduct erosions followed by dilations were applied to remove noise from patch boundaries and break up tree patches with thin connections [56]. Since we were interested in removing small and isolated noisy pixels from patch boundaries, we chose the frequently used square kernel shape because it is computationally efficient and effective. We used several opening iterations with varying square kernel sizes to determine their effect on marker delineation and watershed segmentation.
- Unequivocal tree patch regions were identified by applying a distance transform followed by thresholding to the opening image generated in Step 1 (Figure 6b). The distance transform calculated the distances between the pixels inside a tree patch and the nearest background (marsh matrix) pixels. Euclidean distance was computed and the threshold was determined using the percentage of the maximum distance value in the image [57]. The optimum unequivocal tree patch image was generated by distance thresholding. This step ensured that the core portions of tree patches were identified.
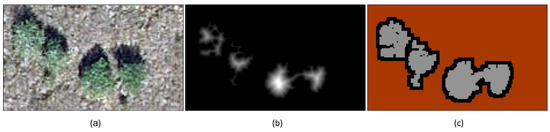 Figure 6. (a) Mangrove patches in the original RGB aerial photograph, (b) unequivocal tree patches derived from ExG index, and (c) marker image showing expanded tree patches (gray), background (brown), and indeterminate region (black) derived from ExG index.
 - A dilation was employed to expand tree patches in the opening image to include indeterminate regions (Figure 6c). Since tree patch boundaries were located in indeterminate regions between the outside boundaries of unequivocal patches and the outside boundaries of expanded tree patches (Figure 6c), consecutive dilations were conducted to ensure expanded tree patches were large enough to contain true patch boundaries. A number of consecutive dilations were tested to determine the effect of dilations on marker delineation and watershed segmentation.
- Indeterminate regions were identified by subtracting the unequivocal patch image generated in Step 2 from the expanded patch image generated in Step 3 (Figure 6c).
- Then, the marker image was generated by labeling connected regions in the unequivocal patch image with increasing integers from 1 to N and labeling the indeterminate regions as zero in the expanded patch image (Figure 6c).
- Finally, watershed segmentation was executed on the color image utilizing the delineated markers to derive tree patch boundaries.
2.5. Removal of Shadows
After applying the watershed segmentation algorithm, the following steps removed shadows:
- A mean RGB (mRGB) index image was calculated by summing intensity values from all the bands and dividing by three. A mask image of same size as the mRGB index was created, where values from the mRGB index image was kept at 0 if mRGB values were less than the first percentile, and 1 if mRGB was equal to or greater than the first percentile.
- The shadows were removed by multiplying the patch mask and the original image.
- Isolated pixels in the shadow-removed image were eliminated by applying a morphological closing operation using a kernel of 4 pixels.
- The morphologically filtered image was labeled for connected components and small objects were removed by using a size threshold of 4 pixels to generate the final shadow-removed patches.
2.6. Parameter Sensitivity
The marker-detection process consisted of three morphological operations as described in Section 2.4. The parameters of these operations were values for the morphological kernel size (MKS) for opening and dilation, the opening and dilation iterations, and the distance transform coefficient (DTC). A sensitivity analysis was performed to determine the parameter values that enhanced segmentation, which was evaluated on the basis of overall accuracy of tree detection. The parameters and test values are provided in Table 2. The full-factorial design produced 90 model combinations per index image, resulting in a total of 2520 models. Point-based accuracy estimates as described in Section 2.7 for each of these 2520 models were used to determine optimal parameter combinations and indices.
Table 2.
Parameters and their values used for sensitivity analysis.
2.7. Tree-Cover Estimation from Random Samples and Tree Detection Accuracy
To evaluate the performance of each index, a simple random sample reference data set was generated. The first objective was to estimate the tree cover (area of patches) within the study area as a reference, and the second was to establish a reference for overall and class-specific omission and commission errors for each of the predicted tree cover maps. Since each map was to be evaluated with the same sample set, we chose a simple random sampling design [58]. The required minimum number of simple random sample points was calculated for a 2% precision (d = ±2%) estimate within a 95% confidence interval (z = 1.96) (Equation (1)) [58].
Considering the worst-case sampling scenario of p = 50% tree cover, a minimum of 2401 samples were required to estimate the tree-cover proportion within a 2% margin and a 95% confidence, and the sample points were randomly generated within the study area. Since resolution and contrast of the aerial photograph were high enough to visually distinguish trees from marsh and shadow, and because it is optimal to evaluate maps from their photo source data to avoid potential changes [59], we visually evaluated each random sample from the 2017 aerial photograph and assigned class labels (tree, marsh, or shadow). The visually interpreted random points were then used to estimate the tree cover within the study area. For this estimate the marsh and shadow classes were combined to a no-tree class.
To estimate overall and class-specific user’s and producer’s accuracy for each of the algorithm-predicted maps, the classified cover type was extracted for all random samples from each tree-cover map. The extracted values and the reference labels were then cross tabulated to generate confusion matrices. From the confusion matrices we estimated adjusted overall, and adjusted class-specific user’s and producer’s accuracies for both tree and no-tree classes, along with their standard errors [60], as well as adjusted tree cover proportions, factoring in the class proportion information of each map [58]. We used the terms overall, user’s, and producer’s accuracy in Section 3, Section 4, Section 5 to refer to their adjusted values, respectively. Furthermore, we were interested in how the presence of shadows affected the accuracy of segmentation. For each index for which segmented images with and without shadow removal were generated, the differences in overall, user’s, and producer’s accuracy, and proportional area were calculated and compared.
2.8. Object-Based Overlap Accuracy Assessment
The performance of index images in delineating the patches was further evaluated by overlap analysis of automatically detected patches with a manually digitized reference dataset. We used an object-based approach with tree polygons as sampling units, and a post-classification simple random sampling design with equal probabilities for all polygons. Unlike point-based accuracy assessment where the same reference data can be used to evaluate the performance of all models, individual reference data have to be created for object-based evaluation of each model output, because each model generates a different number of polygons with different polygon sizes and, therefore, must be sampled individually. Consequently, it was not feasible to evaluate the performance of all 2520 models. Instead, we selected the two models with the highest point-based overall accuracy: one with shadows and the other with shadows removed. For both predicted tree cover maps, we selected 50 polygons using simple random sampling from a list frame. Random sampling from a list of all units within a population ensured equal selection probability for every polygon regardless of size. Point sampling would have increased the probability of including large polygons and over-representing large polygons at the cost of small polygons of individual trees [59]. We digitized tree patches manually from the original RGB aerial photograph. Since the patch polygons were of different sizes including either an individual tree or a group of trees (clumps), in addition to patch boundaries, when possible, we digitized individual tree crowns with their centers inside a predicted polygon. We then assigned the sample identifier of the predicted polygon to all digitized patches in order to evaluate the count of trees within each polygon that was delineated by the watershed segmentation. The spatial union of reference data and model-generated patches produced three types of areas: (1) Correctly predicted tree patches, i.e., areas where prediction and reference agreed; (2) areas of omission error, which included tree polygons in the reference data that were missed by the model; and (3) areas of commission error, i.e., algorithm-delineated portions of mangrove polygons that were not part of the reference data. We quantified the three area types using Equations (2)–(4).
We also tabulated the total number of individual trees in each predicted polygon to determine if the detected tree was an individual or part of a clump of trees.
3. Results
3.1. Parameter Sensitivity Analysis
The sensitivity analysis to determine optimum values of three morphological operations used to delineate markers indicated that overall accuracy was maximized for all models, with and without shadow removed, when the MKS was three (Figure 7b, Table 3). Overall accuracy decreased for all models when opening iteration was increased beyond one, except for the two ExGR models, in which case an opening iteration of two maximized the overall accuracy (Figure 7a, Table 3). Higher overall accuracy was achieved for ExGR_s, ExGR_ns, COM_s, and GRB_s when a dilation iteration of one was used (Figure 7c, Table 3). For the remaining models, a dilation iteration of three increased the overall accuracy. Optimum values for the DTC were inconclusive (Figure 7d). The results indicate that, depending on the index image used for watershed segmentation, DTC can be selected accordingly to maximize accuracy (Figure 7d, Table 3). Across all models, overall accuracy ranged from 11.5 ± 0.01% for CIVE_s to 93.4 ± 0.5% for GRB_ns, the user’s and producer’s accuracies varied from 0% to 99.4 ± 0.01%.
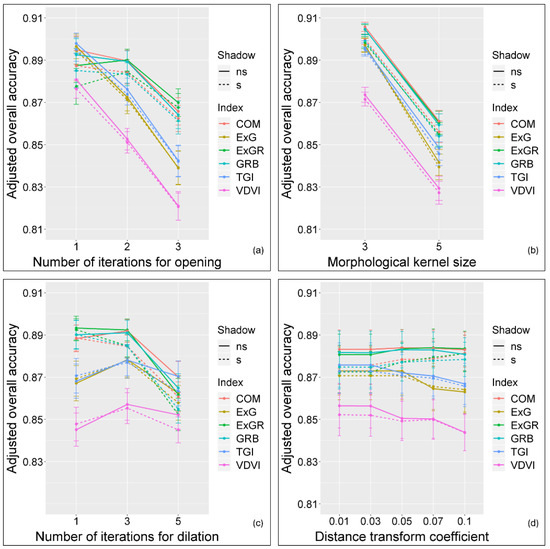
Figure 7.
Sensitivity analysis results for optimum values of (a) number of iterations for opening, (b) morphological kernel size, (c) number of iterations for dilation, and (d) distance transform coefficient for several vegetation indices (Table 2). ns = no shadow, s = with shadow. Error bars indicate 95% confidence intervals of the mean computed from the standard error.
Table 3.
Optimum parameter values for marker detection using vegetation indices. For description purpose, subscript “_ns” was added to the names of index images when shadows were removed after segmentation and “_s” was added when shadows were not removed, for example, shadow removed ExG index image were named ExG_ns and those with shadow present were named ExG_s. Index names as in Table 1.
3.2. Tree-Cover Area Estimation and Tree Detection Analysis
Further analysis only considered models that had an overall accuracy of tree detection greater than 90% and that fell inside the confidence interval of the reference area estimate. The reference area was estimated from the reference dataset consisting of 2401 random point samples. The number of tree and no-tree samples was 650 and 1751, respectively, thus, on the basis of the sampling design to provide a 2% precision with a 95% confidence level, the percent tree cover was 27.1 ± 2%. Six models with shadow (COM_s, ExG_s, ExGR_s, GRB_s, TGI_s, and VDVI_s) and seven models after shadow removal (COM_ns, ExG_ns, ExGR_ns, GRB_ns, R-G_ns, TGI_ns, and VDVI_ns) met both criteria (Table 4). Confusion matrix derived adjusted accuracy estimates for the selected shadow and shadow removed models are shown in Table 4. The overall accuracy for those 13 models ranged from 90.5 ± 0.6% to 93.4 ± 0.5% for VDVI_s and GRB_ns, respectively. User’s accuracy was highest for GRB_ns (90.1 ± 1.2%) and lowest for VDVI_s (82.6 ± 1.5%), and producer’s accuracy was highest for ExG_s (87.4 ± 1.2%) and lowest for VDVI_ns (81.1 ± 1.3%).
Table 4.
Metrics derived from confusion matrix of segmented images by shadow removed and with shadow vegetation index models. Accuracies in percent ± standard errors. Index names as in Table 1.
We found that GRB_ns model had highest overall accuracy of 93.4 ± 0.5%, closely followed by ExG_s (93.1 ± 0.5%). The GRB_ns also had the highest user’s accuracy of 90.1 ± 1.2% followed by ExG_ns (89.9 ± 1.2%). Higher user’s accuracy of trees implies that trees were detected with lower commission error. Although the user’s accuracy of ExG_s was 87.9 ± 1.3%, this model had the highest producer’s accuracy of 87.4 ± 1.2%. Higher producer’s accuracy indicates better performance of the models in detection of actual trees with the lowest omission error. The VDVI models, VDVI_s and VDVI_ns, had the lowest user’s and producer’s accuracy respectively (Table 4). The commission error in the GRB model decreased after shadow removal but the omission error increased slightly. When GRB_ns was used, it attained the lowest commission error among all the index images (user’s accuracy = 90.1 ± 1.2%), but had a higher omission error (producer’s accuracy = 85.2 ± 1.3%) compared to ExG_s, TGI_ns, COM_s, and GRB_s. In contrast, ExG_s and TGI_ns had the lowest omission error (producer’s accuracy = 87.4 ± 1.2% and 87.2 ± 1.2%, respectively). This indicated that the watershed segmentation using these two indices were able to detect trees with higher accuracy than other indices, but TGI_ns had higher commission error (user’s accuracy = 85.9 ± 1.4%) than ExG_s (user’s accuracy = 87.9 ± 1.3%).
We found that on an average overall accuracy and user’s accuracy increased by 0.5% (standard deviation (SD) = 0.7%) and 2.9% (SD = 4%), respectively, when shadows were removed (Table 5). However, average producer’s accuracy and the proportion of the area covered by trees decreased by 1.4% (SD = 3.2%) and 1.1% (SD = 2.1), respectively (Table 5). Although on an average accuracy increased or decreased only slightly, it must be noted that the overall accuracy and user’s accuracy increased for six out of seven indices when shadows were removed, whereas producer’s accuracy increased for only one index model (Table 5). The highest increase in user’s accuracy of ~10% was observed when shadows were removed from the R-G derived segmented image followed by VDVI (~4%), although user’s accuracy declined by 3% when TGI was used. The highest decrease in producer’s accuracy after shadow removal was observed for the R-G index (6.7%), although producer’s accuracy increased after shadow removal when TGI was used (4%). The estimated proportional area decreased in six index images when shadows were removed. The highest decrease in the proportion of tree-cover area was ~5% when the R-G index image was used (Table 5).
Table 5.
Difference in proportional area, user’s accuracy, producer’s accuracy, and overall accuracy between shadow removed and with shadow vegetation index models. SD = Standard Deviation.
3.3. Object-Based Overlap Analysis
Two models (one with shadow (ExG_s) and the other without shadow (GRB_ns) that had the highest point-based overall accuracy were selected for overlap accuracy assessment. Using an object-based approach, 50 randomly sampled polygons for each of the two maps covered polygon size distributions including the 5th up to the 97th percentile for ExG_s, and from the smallest polygon up to the 99th percentiles for GRB_ns. The highest overlap accuracy between predicted and reference data was achieved by ExG_s (~95%) when compared to GRB_ns (88%) (Table 6). Although the GRB_ns model had the highest overall accuracy (93.4%) based on the point-based accuracy assessment, the ExG_s model performed better in delineation of actual crowns by as much as 7%. The omission area was very low when ExG_s model was used (~5%) compared to GRB_ns model (~12%), but the commission error was much higher with ExG_s model (21.4%). This is in line with the point-based accuracy assessment, where the GRB_ns model had higher user’s accuracy and lower producer’s accuracy compared to ExG_s.
Table 6.
Percent (%) overlap, omission, and commission areas of predicted trees with reference trees by vegetation index models.
The mean patch sizes of tree clumps predicted by GRB_ns and ExG_s differed substantially. Patches predicted by GRB_ns were much larger than those predicted by ExG_s because ExG_s separated clumped trees better than GRB_ns. The mean size of patches delineated by GRB_ns was about 3.86 m2 compared to roughly 1.16 m2 by ExG_s. The data suggest that commission errors from GRB_ns- and ExG_s-predicted patches were similar, though GRB_ns had a higher mean commission error (0.58 m2) compared to ExG_s (~0.25 m2) (Figure 8). However, there was a significant difference in omission error between the two, in which GRB_ns had a higher mean omission error of 0.67 m2 compared to 0.06 m2 of ExG_s model (Figure 8). The total cover estimated by GRB_ns model was 0.49 hectare compared to ExG_s model which was estimated as 0.53 hectare.
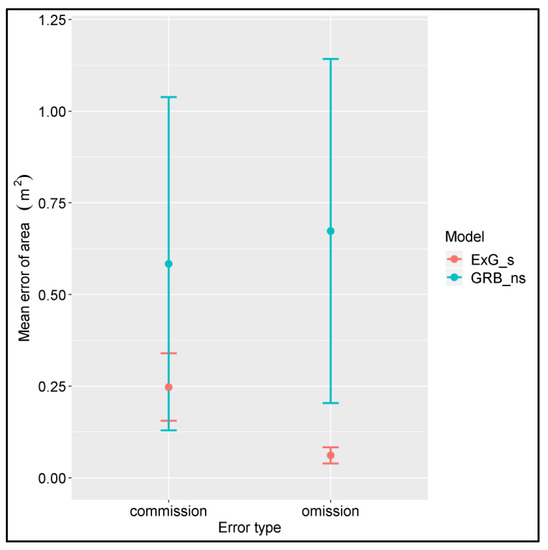
Figure 8.
Comparison of omission and commission errors of patches predicted by GRB_ns and EXG_s models. Error bars are the 95% confidence intervals of the mean computed from the standard error.
Comparing the number of reference tree crowns that were fully within each of the predicted tree patches from the two models (GRB_ns and ExG_s), we found that ExG_s detected more trees as individuals compared to GRB_ns. The largest tree patch predicted by GRB_ns had eleven reference trees compared to only three in ExG_s. (Table 7). Individual predicted trees that coincided with one tree from the reference data were more common for ExG_s, whereas more tree clumps were delineated by GRB_ns (Table 7).
Table 7.
Count of predicted tree crowns in patches versus number of reference tree crowns. 0 = tree not detected, 1 = individual isolated tree detected, >1 = number of tree crowns present in detected tree patch.
4. Discussion
4.1. Feasibility of the Method
In this study, a new fully automated tree-patch-delineation method using vegetation indices derived from RGB aerial photography was developed. Markers were delineated from vegetation indices, using Otsu’s automatic thresholding method, followed by the depiction of patch boundaries with watershed segmentation. The accurate delineation of markers is the key to the success of the method. The accuracy of tree patch delineation is dependent on two major factors: first, the contrast between the target tree pixels and the background in the index image, and second, Otsu’s automatic thresholding to separate target tree pixels from the background matrix. The efficiency of vegetation indices in producing contrast between target pixels and background is dependent in part on the aerial image itself. Thus, the method will be ineffective when vegetation indices are derived from aerial photographs with homogenous brightness values, as Otsu’s automatic thresholding will work well only when the brightness intensity values of a vegetation index produces a bimodal distribution. If the contrast is not high enough, or the bimodal distribution captures other properties of the landscape that are uncorrelated to the target pixel vs. background, then unreliable and imperfect threshold values are generated. Consequently, the delineation of markers will result in under- or over-detection of markers.
Correct marker delineation is also dependent on the parameter values of morphological operations. The parameters used for marker delineation were opening iterations, MKS, dilation iterations, and DTC. Morphological opening can be iterated and requires a kernel. It was found that increasing the number of iterations decreased the overall accuracy of tree detection as a direct consequence of incorrect marker delineation. This is to be expected because additional morphological openings not only remove noisy pixels from the tree patches but also valid tree pixels that resulted in a decline of marker delineation. Although dilation is the process to recover the objects of interest (i.e., mangrove trees) using the same kernel size, it cannot recover small objects that are completely removed by erosion [56]. In general, one iteration of morphological opening promoted higher overall accuracy (Figure 7a). The overall accuracy is high across all index images in watershed segmentation when MKS was 3 (Figure 7b), while an MKS of 5 removed actual tree pixels that led to significant decline in the overall accuracy (Figure 7b). The effect of the number of dilation iterations and DTC on marker delineation varies among index images. We therefore recommend using optimum values for these parameters based on the index image used for delineation of markers. Our results show that these indices obtained high overall accuracy and performed equally well when compared to each other except for VDVI (error bar overlap in Figure 7a–d). Although we found the best parameter values to use with these vegetation indices for marker detection, the values are specific to the geographical context of the acquired images. Therefore, the values should be used as a guide when this method is applied elsewhere, as optimal parameter values may change, because of lighting conditions that alter the contrast between foreground and background, or the heterogeneity of the vegetation matrix in which the trees are embedded.
Point-based accuracy showed that models of seven indices matched the proportional area estimate with overall accuracy estimates above 90%. The highest overall accuracy was obtained using GRB_ns model (93.4 ± 0.5%), and the highest producer’s accuracy and user’s accuracy were obtained using ExG_s (87.4 ± 1.2%) and GRB_ns (90.1 ± 1.2%) models, respectively. The object-based assessment indicated that the agreement between predicted and reference tree crowns was higher for the ExG_s (95%) when compared to the GRB_ns (88%) (Table 6), with a 7% lower omission error (Table 6, Figure 8).
Although there was little difference in the proportional area estimate between GRB_ns and ExG_s models, the average patch sizes of GRB_ns were three times larger than those of the ExG_s model, and in turn the GRB_ns model detected 1048 patches compared to 2600 detected by ExG_s. This indicates that GRB_ns grouped individual neighboring patches into a single larger patch (Figure 9), and therefore, we recommend the use of ExG_s when detection of individual trees is desired.
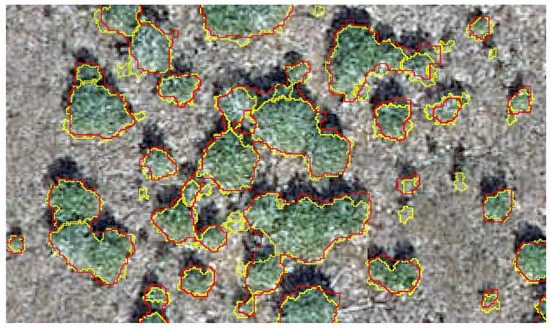
Figure 9.
ExG_s (yellow polygons) obtained better separation between patches and shadows compared to GRB_ns (red polygons). ExG_s detected more trees inside clumped mangrove patches (number of yellow polygons inside a single red polygon). ExG_s also detected more isolated trees (yellow polygons without corresponding red polygons).
Shadow removal produced a mixed effect on delineation of tree patches. The commission errors in GRB_s were concentrated in transition areas that were shaded, removing shadows lead to a 2.5% increase in user’s accuracy in GRB_ns (Table 5). However, removing shadows from ExG_s, though increasing user’ accuracy by 2.1%, also eliminated many tree pixels along with shadows, thereby reducing producer’s accuracy by 2.8% (Table 5). Since shadow removal is problematic with the current method, the vegetation index that performs best without shadow removal is preferred. An algorithm that corrects reflectance in shadow areas rather than removing shadow pixels should be developed to minimize the effect of shadows on tree detection and delineation. The ExG_s separated tree patches from shadows well without removing shadows (Figure 9). Most of the commission error for the ExG_s model occurred near the transition between the crown boundary and marsh matrix pixels (Figure 9). Unlike near the center of the tree crown, where the green intensity values are more homogenous, the separability in such transitional areas becomes more difficult because of the mixture of tree and marsh pixels. This uncertainty in boundary interpretation carries over to the manual digitization process, where some error is associated with imprecise digitization of tree boundaries. However, this source of error only marginally affected the proportional area estimation.
4.2. Comparison with Other Studies
In this study, we showed that our methodology is robust, efficiently achieving very high detection and delineation accuracies for mangrove patches in a graminoid background matrix. We identified individual patches of mangroves, consisting of either single or multiple crowns. Separation of each individual tree crown within a mangrove clump is not possible because of low contrast along neighboring tree boundaries in aerial photographs. For convex tree shapes or diverse tree heights in forests, height information may increase the performance of the watershed algorithm when delineating individual trees. However, using LiDAR derived height information, Yin et al. [49] achieved a detection accuracy of 76.9% for isolated trees but overall crown delineation accuracy was only 46%. Delineation of individual mangrove crowns with large branches can sometimes cause incorrect splits of single crowns into multiple trees. Applying size filters on optical data or height filters on LiDAR data may address some of these issues [61]. The combination of high-resolution spectral imagery and high-density LiDAR data may improve delineation of isolated and individual trees in patches, but this approach is limited for change detection because of the temporal coverage of LiDAR data.
Detection of encroachment or loss of woody vegetation in savannahs, prairies, other grasslands, and woodlands is of interest to many ecologists, and natural resource and protected area managers. Several studies have mapped the woody encroachment in grasslands such as savannah using multi-spectral imagery [62,63,64]. To understand the pattern of woody vegetation changes in grasslands, and graminoid wetlands requires detection of new emergence and growth of new trees at the individual tree level. Our method specifically aims at detecting these kinds of vegetation dynamics and can be applied to conduct studies that are interested in changes of woody vegetation in a graminoid dominated landscape.
4.3. Future Work and Challenges
In the small, homogenous, red mangrove-dominated wetland in which this pilot project was carried out, the method worked well for single isolated tree detection, tree patch delineation, and cover estimation, but not as well in delineation of individual tree crowns inside patches containing several clumped trees. With advances in technology to acquire very high resolution (sub-decimeter) images in the future, this method provides an opportunity to conduct baseline studies for long-term monitoring of woodlands. The results we achieved also provide a foundation for estimating and monitoring temporal changes in mangrove cover.
Some challenges may arise when applying this method to images acquired in different wetland settings or from aerial photography that has different spectral, radiometric, and spatial resolutions. First, not all wetlands exhibit as distinct a bimodal distribution as the area selected for this project. More sophisticated methods may need to be developed to threshold the multi-modal distribution of pixel brightness values from more heterogeneous landscapes. Second, images that enhance the contrast between grasses and trees are preferable. Because contrast is enhanced when trees are foliated and graminoid species are senescent, dried up, or dead, image acquisition time should be determined based on the phenological cycles of the dominant graminoids and the tree species of interest. Third, although older aerial photographs have high spatial resolution compared to medium-resolution multi-spectral images, their spatial resolution is low compared with the image used in this research. For meaningful comparison in change detection studies, more recent very-high resolution images may have to be downscaled to the resolution of older aerial photographs. Fourth, this method incorporates the usage of true color aerial image, therefore, use of infrared and panchromatic aerial images would require further modifications.
5. Conclusions
A new fully automated method was developed to successfully detect and delineate mangrove trees and patches in a coastal wetland environment from aerial photography. The introduced framework allows for the selection of the most suitable index images with and without shadow removal for detection and delineation of tree patches. High overall accuracy (>90%) with comparable user’s and producer’s accuracies in tree detection were obtained by using seven index images (COM, ExG, ExGR, GRB, R-G, TGI, and VDVI). The overlap accuracy of ExG_s (~95%) was better than GRB_ns (88%) in patch delineation. Despite having similar proportional area estimates, ExG_s performed better in separation of tree patches and shadows, and also delineated more trees than GRB_ns. The selection of optimum parameter values for morphological operations is crucial for the detection of markers for watershed segmentation. MKS of 3 produced the highest overall accuracy across all the index images. The parameter values of opening iterations, dilation iterations, and DTC affected marker delineation differently, and therefore, their values should be selected based on the index image used for watershed segmentation. The parameter values most effective in this study should be used only as an initial starting point when the method is applied in a different geographical setting, because optimal parameter values may change because of either lighting conditions or local contrast changes, which depends on the spatial distribution of trees within the surrounding vegetation matrix.
The shadow removal method had positive and negative effects; it increased the overall and the user’s accuracy for the majority of models, but also reduced the producer’s accuracy. Shadows in images are problematic and need to be dealt with carefully when applying automated delineation methods. To reduce shadow effects on the delineation of patches in the future, a more sophisticated algorithm to correct brightness values in shadows instead of removing shadowed areas deserves further study.
This method provides an opportunity to analyze mangrove migration patterns at the scale of isolated individuals and patches. It can be applied to reconstruction of change in mangrove distributions over time, and gain insight into the driving forces of their migration patterns. There is much potential in using widely available high-resolution aerial photography to understand not only mangrove transgression dynamics at the individual tree and patch levels, but also woody vegetation invasion in prairies and other grassland ecosystems.
Author Contributions
Conceptualization, K.Z. initiated the idea and H.B., K.Z., D.G., and M.S.R. developed the concept; methodology, K.Z. developed the watershed segmentation and shadow removal methods, D.G. and H.B. developed the methods to perform sensitivity and accuracy analysis; formal analysis, H.B. and D.G. processed images and conducted calculation and analysis; writing—original draft preparation, H.B. and D.G.; writing—review and editing, M.S.R., H.B., and D.G., and K.Z.; visualization, H.B. and D.G. All authors have read and agreed to the published version of the manuscript.
Funding
This research received no external funding.
Acknowledgments
This material is based upon work supported by the National Science Foundation under Grant No. HRD-1547798. This NSF Grant was awarded to Florida International University as part of the Centers for Research Excellence in Science and Technology (CREST) Program. This is contribution number 970 from the Southeast Environmental Research Center in the Institute of Environment at Florida International University.
Conflicts of Interest
The authors declare no conflict of interest.
References
- Mohd, O.; Suryanna, N.; Sahib Sahibuddin, S.; Faizal Abdollah, M.; Rahayu Selamat, S. Thresholding and Fuzzy Rule-Based Classification Approaches in Handling Mangrove Forest Mixed Pixel Problems Associated with in QuickBird Remote Sensing Image Analysis. Int. J. Agric. For. 2012, 2, 300–306. [Google Scholar] [CrossRef]
- Kuenzer, C.; Bluemel, A.; Gebhardt, S.; Quoc, T.V.; Dech, S. Remote Sensing of Mangrove Ecosystems: A Review. Remote Sens. 2011, 3, 878–928. [Google Scholar] [CrossRef]
- Ewel, K.C.; Twilley, R.R.; Ong, J.E. Different Kinds of Mangrove Forests Provide Different Goods and Services. Glob. Ecol. Biogeogr. Lett. 1998, 7, 83–94. [Google Scholar] [CrossRef]
- Costanza, R.; d’Arge, R.; de Groot, R.; Farber, S.; Grasso, M.; Hannon, B.; Limburg, K.; Naeem, S.; O’Neill, R.V.; Paruelo, J.; et al. The Total Value of the World’s Ecosystem Services and Natural Capital. Nature 1996, 387, 253–260. [Google Scholar] [CrossRef]
- Zhang, K.; Liu, H.; Li, Y.; Xu, H.; Shen, J.; Rhome, J.; Smith, T.J., III. The role of mangroves in attenuating storm surges. Estuar. Coast. Shelf Sci. 2012, 102, 11–23. [Google Scholar] [CrossRef]
- Gilman, E.L.; Ellison, J.; Duke, N.C.; Field, C. Threats to mangroves from climate change and adaptation options: A review. Aquat. Bot. 2008, 89, 237–250. [Google Scholar] [CrossRef]
- Alongi, D.M. The Impact of Climate Change on Mangrove Forests. Curr. Clim. Chang. Rep. 2015, 1, 30–39. [Google Scholar] [CrossRef]
- Ross, M.S.; Meeder, J.F.; Sah, J.P.; Ruiz, P.L.; Telesnicki, G.J. The Southeast Saline Everglades revisited: 50 years of coastal vegetation change. J. Veg. Sci. 2000, 11, 101–112. [Google Scholar] [CrossRef]
- Rogers, K.; Saintilan, N.; Heijnis, H. Mangrove encroachment of salt marsh in Western Port Bay, Victoria: The role of sedimentation, subsidence, and sea level rise. Estuaries 2005, 28, 551–559. [Google Scholar] [CrossRef]
- Yao, Q.; Liu, K.B. Dynamics of marsh-mangrove ecotone since the mid-Holocene: A palynological study of mangrove encroachment and sea level rise in the Shark River Estuary, Florida. PLoS ONE 2017, 12, e0173670. [Google Scholar] [CrossRef]
- Rodriguez, W.; Feller, I.C.; Cavanaugh, K.C. Spatio-temporal changes of a mangrove–saltmarsh ecotone in the northeastern coast of Florida, USA. Glob. Ecol. Conserv. 2016, 7, 245–261. [Google Scholar] [CrossRef]
- Saintilan, N.; Williams, R.J. Mangrove transgression into saltmarsh environments in south-east Australia. Glob. Ecol. Biogeogr. 1999, 8, 117–124. [Google Scholar] [CrossRef]
- Rosenzweig, C.; Karoly, D.; Vicarelli, M.; Neofotis, P.; Wu, Q.; Casassa, G.; Menzel, A.; Root, T.L.; Estrella, N.; Seguin, B.; et al. Attributing physical and biological impacts to anthropogenic climate change. Nature 2008, 453, 353. [Google Scholar] [CrossRef]
- Ke, Y.; Quackenbush, L.J. A comparison of three methods for automatic tree crown detection and delineation from high spatial resolution imagery. Int. J. Remote Sens. 2011, 32, 3625–3647. [Google Scholar] [CrossRef]
- Giri, C.; Ochieng, E.; Tieszen, L.L.; Zhu, Z.; Singh, A.; Loveland, T.; Masek, J.; Duke, N. Status and distribution of mangrove forests of the world using earth observation satellite data. Glob. Ecol. Biogeogr. 2011, 20, 154–159. [Google Scholar] [CrossRef]
- Thomas, N.; Bunting, P.; Lucas, R.; Hardy, A.; Rosenqvist, A.; Fatoyinbo, T. Mapping mangrove extent and change: A globally applicable approach. Remote Sens. 2018, 10, 1466. [Google Scholar] [CrossRef]
- Zhang, K.; Thapa, B.; Ross, M.; Gann, D. Remote sensing of seasonal changes and disturbances in mangrove forest: A case study from South Florida. Ecosphere 2016, 7, e01366. [Google Scholar] [CrossRef]
- Simard, M.; Zhang, K.; Rivera-monroy, V.H.; Ross, M.S.; Ruiz, P.L.; Castañeda-moya, E.; Twilley, R.R.; Rodriguez, E. Mapping Height and Biomass of Mangrove Forests in Everglades National Park with SRTM Elevation Data. Photogramm. Eng. Remote Sens. 2006, 72, 299–311. [Google Scholar] [CrossRef]
- Feliciano, E.A.; Wdowinski, S.; Potts, M.D.; Lee, S.K.; Fatoyinbo, T.E. Estimating mangrove canopy height and above-ground biomass in the Everglades National Park with airborne LiDAR and TanDEM-X data. Remote Sens. 2017, 9, 702. [Google Scholar] [CrossRef]
- Giri, C.P.; Long, J. Mangrove reemergence in the northernmost range limit of eastern Florida. Proc. Natl. Acad. Sci. USA 2014, 111, E1447–E1448. [Google Scholar] [CrossRef]
- USGS. Looking for an Old Aerial Photograph; Fact Sheet; Series Number 127-96; U.S. Geological Survey: Reston, VA, USA, 1997.
- Freeman, M.; Stow, D.; Roberts, D. Object-based Image Mapping of Conifer Tree Mortality in San Diego County based on Multitemporal Aerial Ortho-imagery. Photogramm. Eng. Remote Sens. 2016, 82, 571–580. [Google Scholar] [CrossRef]
- Rutchey, K.; Vilchek, L. Air photointerpretation and satellite imagery analysis techniques for mapping cattail coverage in a northern Everglades impoundment. Photogramm. Eng. Remote Sens. 1999, 65, 185–191. [Google Scholar]
- Kataoka, T.; Kaneko, T.; Okamoto, H.; Hata, S. Crop growth estimation system using machine vision. In Proceedings of the 2003 IEEE/ASME International Conference on Advanced Intelligent Mechatronics (AIM 2003), Kobe, Japan, 20–24 July 2003; Volume 2, pp. 1079–1083. [Google Scholar]
- Meyer, G.E.; Neto, J.C. Verification of color vegetation indices for automated crop imaging applications. Comput. Electron. Agric. 2008, 63, 282–293. [Google Scholar] [CrossRef]
- Ponti, M.P. Segmentation of low-cost remote sensing images combining vegetation indices and mean shift. IEEE Geosci. Remote Sens. Lett. 2013, 10, 67–70. [Google Scholar] [CrossRef]
- Yang, W.; Wang, S.; Zhao, X.; Zhang, J.; Feng, J. Greenness identification based on HSV decision tree. Inf. Process. Agric. 2015, 2, 149–160. [Google Scholar] [CrossRef]
- Xiaoqin, W.; Miaomiao, W.; Shaoqiang, W.; Yundong, W. Extraction of vegetation information from visible unmanned aerial vehicle images. Trans. Chin. Soc. Agric. Eng. 2015, 31, 152–159. [Google Scholar]
- Kazmi, W.; Garcia-Ruiz, F.J.; Nielsen, J.; Rasmussen, J.; Jørgen Andersen, H. Detecting creeping thistle in sugar beet fields using vegetation indices. Comput. Electron. Agric. 2015, 112, 10–19. [Google Scholar] [CrossRef]
- Hamuda, E.; Glavin, M.; Jones, E. A survey of image processing techniques for plant extraction and segmentation in the field. Comput. Electron. Agric. 2016, 125, 184–199. [Google Scholar] [CrossRef]
- Woebbecke, D.M.; Meyer, G.E.; Von Bargen, K.; Mortensen, D.A. Color Indices for Weed Identification Under Various Soil, Residue, and Lighting Conditions. Trans. ASAE 1995, 38, 259–269. [Google Scholar] [CrossRef]
- Meyer, G.E.; Hindman, T.W.; Laksmi, K. Machine Vision Detection Parameters for Plant Species Identification. In Precision Agriculture and Biological Quality; SPIE Proceedings: Bellingham, WA, USA, 1999; Volume 3543, pp. 327–336. [Google Scholar]
- Hague, T.; Tillett, N.D.; Wheeler, H. Automated Crop and Weed Monitoring in Widely Spaced Cereals. Precis. Agric. 2006, 7, 21–32. [Google Scholar] [CrossRef]
- Gitelson, A.A.; Kaufman, Y.J.; Stark, R.; Rundquist, D. Novel algorithms for remote estimation of vegetation fraction. Pap. Nat. Resour. 2002, 149, 76–87. [Google Scholar] [CrossRef]
- Woebbecke, D.M.; Meyer, G.E.; Von Bargen, K.; Mortensen, D.A. Plant Species Identification, Size, and Enumeration Using Machine Vision Techniques on Near-Binary Images. In Optics in Agriculture and Forestry; DeShazer, J.A., Meyer, G.E., Eds.; SPIE: Bellingham, WA, USA, 12 May 1993; Volume 1836, pp. 208–219. [Google Scholar]
- Hunt, E.R.; Daughtry, C.S.T.; Eitel, J.U.H.; Long, D.S. Remote sensing leaf chlorophyll content using a visible band index. Agron. J. 2011, 103, 1090–1099. [Google Scholar] [CrossRef]
- Otsu, N. A Threshold Selection Method from Gray-Level Histograms. IEEE Trans. Syst. Man. Cybern. 1979, 9, 62–66. [Google Scholar] [CrossRef]
- Meyer, G.; Camargo Neto, J.; Jones, D.; Hindman, T. Intensified fuzzy clusters for classifying plant, soil, and residue regions of interest from color images. Comput. Electron. Agric. 2004, 42, 161–180. [Google Scholar] [CrossRef]
- Tian, L.F.; Slaughter, D.C. Environmentally adaptive segmentation algorithm for outdoor image segmentation. Comput. Electron. Agric. 1998, 21, 153–168. [Google Scholar] [CrossRef]
- Guo, W.; Rage, U.K.; Ninomiya, S. Illumination invariant segmentation of vegetation for time series wheat images based on decision tree model. Comput. Electron. Agric. 2013, 96, 58–66. [Google Scholar] [CrossRef]
- Wang, L.; Gong, P.; Biging, G.S. Individual Tree-Crown Delineation and Treetop Detection in High-Spatial-Resolution Aerial Imagery. Photogramm. Eng. Remote Sens. 2004, 70, 351–357. [Google Scholar] [CrossRef]
- Digabel, H.; Lantuejoul, C. Iterative Algorithms. In Proceedings of the Actes du Second Symposium Europeen d’Analyse Quantitative des Microstructures en Sciences des Materiaux, Biologie et Medecine; Chermant, J.-L., Ed.; Riederer: Stuttgart, Germany, 1978; pp. 85–99. [Google Scholar]
- Beucher, S.; Lantuejoul, C. Use of Watersheds in Contour Detection. In Proceedings of the International Workshop on Image Processing CCETT, Rennes, France, 17 September 1979; pp. 2.1–2.12. [Google Scholar]
- Meyer, F.; Beucher, S. Morphological segmentation. J. Vis. Commun. Image Represent. 1990, 1, 21–46. [Google Scholar] [CrossRef]
- Ke, Y.; Quackenbush, L.J. A review of methods for automatic individual tree-crown detection and delineation from passive remote sensing. Int. J. Remote Sens. 2011, 32, 4725–4747. [Google Scholar] [CrossRef]
- Huang, H.; Li, X.; Chen, C. Individual tree crown detection and delineation from very-high-resolution UAV images based on bias field and marker-controlled watershed segmentation algorithms. IEEE J. Sel. Top. Appl. Earth Obs. Remote Sens. 2018, 11, 2253–2262. [Google Scholar] [CrossRef]
- Jing, L.; Hu, B.; Noland, T.; Li, J. An individual tree crown delineation method based on multi-scale segmentation of imagery. ISPRS J. Photogramm. Remote Sens. 2012, 70, 88–98. [Google Scholar] [CrossRef]
- Lamar, W.R.; McGraw, J.B.; Warner, T.A. Multitemporal censusing of a population of eastern hemlock (Tsuga canadensis L.) from remotely sensed imagery using an automated segmentation and reconciliation procedure. Remote Sens. Environ. 2005, 94, 133–143. [Google Scholar] [CrossRef]
- Yin, D.; Wang, L. Individual mangrove tree measurement using UAV-based LiDAR data: Possibilities and challenges. Remote Sens. Environ. 2019, 223, 34–49. [Google Scholar] [CrossRef]
- MDC Miami-Dade County Aerial Photography Find and Download Application. 2017. Available online: https://gisweb.miamidade.gov/imagerydownload/ (accessed on 6 November 2018).
- ESRI ArcGIS Desktop: Release 10.5; Environmental Systems Research Institute: Redlands, CA, USA, 2016.
- Python Software Foundation Python Language Reference. 2016.
- Bradski, G. The OpenCV Library. Dr. Dobb’s J. Softw. Tools. 2000. [Google Scholar]
- Pedregosa, F.; Varoquaux, G.; Gramfort, A.; Michel, V.; Thirion, B.; Grisel, O.; Blondel, M.; Prettenhofer, P.; Weiss, R.; Dubourg, V.; et al. Scikit-learn: Machine Learning in Python. J. Mach. Learn. Res. 2011, 12, 2825–2830. [Google Scholar]
- R Core Team. R: A language and Environment for Statistical Computing; R Foundation for Statistical Computing: Vienna, Austria, 2013; ISBN 3-900051-07-0. [Google Scholar]
- Soille, P. Morphological Image Analysis: Principles and Applications, 2nd ed.; Springer: Berlin/Heidelberg, Germany, 2004; ISBN 3540429883. (alk. paper). [Google Scholar]
- Borgefors, G. Distance transformations in digital images. Comput. Vision. Graph. Image Process. 1986, 34, 344–371. [Google Scholar] [CrossRef]
- Olofsson, P.; Foodu, G.M.; Martin, H.; Stehman Stephen, V.; Woodcock, C.E.; Wulder, M.A. Good practices for estimating area and assessing accuracy of land change. Remote Sens. Environ. 2014, 148, 42–57. [Google Scholar] [CrossRef]
- Radoux, J.; Bogaert, P. Good Practices for Object-Based Accuracy Assessment. Remote Sens. 2017, 9, 646. [Google Scholar] [CrossRef]
- Olofsson, P.; Foody, G.M.; Stehman, S.V.; Woodcock, C.E. Remote Sensing of Environment Making better use of accuracy data in land change studies: Estimating accuracy and area and quantifying uncertainty using strati fi ed estimation. Remote Sens. Environ. 2013, 129, 122–131. [Google Scholar] [CrossRef]
- Leckie, D.; Gougeon, F.; Hill, D.; Quinn, R.; Armstrong, L.; Shreenan, R. Combined high-density lidar and multispectral imagery for individual tree crown analysis. Can. J. Remote Sens. 2003, 29, 633–649. [Google Scholar] [CrossRef]
- Nagelkirk, R.L.; Dahlin, K.M. Woody cover fractions in African Savannas from landsat and high-resolution imagery. Remote Sens. 2020, 12, 813. [Google Scholar] [CrossRef]
- Huang, C.Y.; Archer, S.R.; McClaran, M.P.; Marsh, S.E. Shrub encroachment into grasslands: End of an era? PeerJ 2018, 2018, 1–19. [Google Scholar] [CrossRef] [PubMed]
- Mitchard, E.T.A.; Saatchi, S.S.; Gerard, F.F.; Lewis, S.L.; Meir, P. Measuring woody encroachment along a forest-savanna boundary in Central Africa. Earth Interact. 2009, 13, 1–29. [Google Scholar] [CrossRef]
© 2020 by the authors. Licensee MDPI, Basel, Switzerland. This article is an open access article distributed under the terms and conditions of the Creative Commons Attribution (CC BY) license (http://creativecommons.org/licenses/by/4.0/).