Article

Regional Tropical Aboveground Biomass Mapping with L-Band Repeat-Pass Interferometric Radar, Sparse Lidar, and Multiscale Superpixels

1
Jet Propulsion Laboratory, California Institute of Technology, Pasadena, CA 91101, USA
2
Department of Geographical Sciences, University of Maryland, College Park, MD 20742, USA
3
Biospheric Sciences Lab, NASA Goddard Space Flight Center, Greenbelt, MD 20771, USA
4
School of Forest Resources and Conservation, University of Florida, Gainesville, FL 32611, USA
5
Ministère des Forêts, de la Mer et de l’Environnement, Libreville 3241, Gabon
*
Author to whom correspondence should be addressed.
Remote Sens. 2020, 12(12), 2048; https://doi.org/10.3390/rs12122048
Submission received: 15 May 2020 / Revised: 10 June 2020 / Accepted: 17 June 2020 / Published: 25 June 2020
(This article belongs to the Special Issue Estimation of Forest Biomass from SAR)

Abstract

:
We introduce a multiscale superpixel approach that leverages repeat-pass interferometric coherence and sparse AGB estimates from a simulated spaceborne lidar in order to extend the NISAR mission’s applicable range of aboveground biomass (AGB) in tropical forests. Airborne and spaceborne L-band radar and full-waveform airborne lidar data are used to simulate the NISAR and GEDI mission, respectively. In addition to UAVSAR data, we use spaceborne ALOS-2/PALSAR-2 imagery with 14-day temporal baseline, which is comparable to NISAR’s 12-day baseline. Our reference AGB maps are derived from the airborne LVIS data during the AfriSAR campaign for three sites (Mondah, Ogooue, and Lope). Each tropical site has mean AGB of at least 125 Mg/ha in addition to areas with AGB exceeding 700 Mg/ha. Spatially sampling from these LVIS-derived AGB reference maps, we approximate GEDI AGB estimates. To evaluate our methodology, we perform several different analyses. First, we partition each study site into low (≤100 Mg/ha) and high (>100 Mg/ha) AGB areas, in conformity with the NISAR mission requirement to provide AGB estimates for forests between 0 and 100 Mg/ha with a RMSE below 20 Mg/ha. In the low AGB areas, this RMSE requirement is satisfied in Lope and Mondah and it fell short of the requirement in Ogooue by less 3 Mg/ha with UAVSAR and 6 Mg/ha with PALSAR-2. We note that our maps have finer spatial resolution (50 m) than NISAR requires (1 hectare). In the high AGB areas, the normalized RMSE increases to 51% (i.e., <90 Mg/ha), but with negligible bias for all three sites. Second, we train a single model to estimate AGB across both high and low AGB regimes simultaneously and obtain a normalized RMSE that is <60% (or <100 Mg/ha). Lastly, we show the use of both (a) multiscale superpixels and (b) interferometric coherence significantly improves the accuracy of the AGB estimates. The InSAR coherence improved the RMSE by approximately 8% at Mondah with both sensors, lowering the RMSE from 59 Mg/ha to 47.4 Mg/h with UAVSAR and from 57.1 Mg/ha to 46 Mg/ha. This work illustrates one of the numerous synergistic relationships between the spaceborne lidars, such as GEDI, with L-band SAR, such as PALSAR-2 and NISAR, in order to produce robust regional AGB in high biomass tropical regions.

1. Introduction

The sequestration of atmospheric carbon storage as Above Ground Biomass (AGB) is an important mitigating factor of the warming climate due to anthropogenic CO 2 [1,2]. Accurate, large-scale remote sensing of forests to monitor our global AGB stock is required for climate models and carbon policy [2,3]. L-band SAR is a powerful tool for monitoring Earth’s AGB, particularly in lower biomass ecosystems, such as woodlands [3,4,5]. Techniques that are based on L-band backscatter alone suffer signal saturation at approximately 100–150 Mg/ha [6,7,8] and are impeded by environmental factors affecting vegetation’s dielectric properties [7,9]. While new Polarimetric InSAR techniques, such as Random Volume over Ground [10,11] and Random Motion over Ground [12,13], promise to improve the characterization of forest structure and AGB in the future, there is currently no spaceborne instrument that is capable of providing required non-zero interferometric baseline measurements for these measurements. In anticipation of the upcoming NASA-ISRO SAR Mission (NISAR) mission, which is planned for launch in 2022, we seek to extend the capabilities of L-band products to estimate AGB across a larger AGB range, in particular dense tropical environments [14]. The NISAR science requirement is to estimate AGB within 20 Mg/ha RMSE with a spatial resolution of 1 ha for forest below 100 Mg/ha [6]. Although NISAR is an interferometric mission, albeit with zero-baseline repeat-pass orbit, current NISAR algorithms are based solely on the use of radar backscatter [6]. Here, we propose and evaluate the use of repeat-pass interferometric coherence to improve the estimation of AGB and extend the range of applicability beyond 100 Mg/ha. NISAR will operate in repeat-pass interferometric mode throughout its lifetime, monitoring surface deformation that results from earthquakes, volcanic activity, and other geologic and glacial processes. NISAR will repeat its orbit within 350 m to observe changes in phase that result from surface displacement rather than elevation or volumes. Nonetheless, this so-called zero spatial baseline interferometric measurement is related to forest structure [15,16,17], due to the temporal decorrelation of the repeat-pass interferometric signal [12,13,18]. Generally speaking, as noted in [15], the repeat-pass coherence is dominated by temporal decorrelation for shorter temporal baselines, barring significant weather or phenological events. In such cases, we expect areas with larger, more complex canopy structures to have lower coherence precisely due to the inevitable motion of such canopy structures between image retrievals.
Spaceborne lidar data from Ice, Cloud, and land Elevation Satellite’s (ICESat) Geoscience Laser Altimeter System (GLAS) has been shown to provide invaluable calibration data to estimate global and continental-scale vegetation structure, such as canopy height [19,20] and AGB [21,22]. While GLAS was not originally designed to study forests, the new spaceborne lidar system, NASA’s Global Ecosystem Dynamics Investigation (GEDI) [23] was designed to estimate global AGB stock within ±51.6 degrees latitudes [23,24]. The global high resolution sparse lidar AGB estimates from these satellites represent an extraordinary data set to calibrate high resolution regional vegetation models based on imaging instruments, such as Landsat [25,26], TanDEM-X [27,28,29], or L-/P-band SAR data [5,30].
In this paper, we investigate a methodology that is based on an L-band repeat-pass interferometric radar operating at HH and HV polarizations (similar to NISAR) to map AGB in tropical forests. The proposed approach calibrates a set of radar-to-biomass models with simulated spaceborne lidar samples, and utilizes interferometric coherence and multiscale superpixel-derived features from the L-band imagery to enhance AGB estimates. We represent spaceborne lidar data by sampling from our reference LVIS-derived AGB map, so that our shots and tracks are spaced in a manner similar to GEDI [23]; a simulation of end-of-mission GEDI or ICESat-2 precisely is beyond the scope of this work. We plan to apply this methodology to the available spaceborne lidar data in future work.

2. Materials

2.1. Canopy Cover Map

We only evaluate our methodology on forested areas as determined with the Hansen et al. canopy cover product [31]. This product describes the percent canopy within a 30 m Landsat pixel in the year 2000. We adopt the definition that a forested pixel has at least 30% canopy cover, which is in the generally accepted range of 10% to 30% of canopy cover [32,33]. We select a strict condition of forest to reduce falsely identified forest pixels, as suggested in [33]. Such a forest criterion has also been used by Hansen et al. for tropical forest analyses [31,34]. Our reported AGB ranges and accuracy metrics only consider pixels within this canopy cover mask.

2.2. AGB Reference Map

We validate our biomass estimation framework with an LVIS-derived AGB reference map [35]. Lidar-derived AGB is obtained from models for tropical lidar biomass models on the LVIS data, as described in [35,36,37]. Using these lidar-derived maps, we train our model along the hypothetical spaceborne tracks across our study area, in which along and across track spacing is similar to GEDI. We describe the simplified sampling strategy precisely in Section 3.2. In future work, we plan to apply this approach directly to the GEDI end-of-mission catalog. For the analysis of potential biomass errors from GEDI-backscatter fusion, we refer to [37].
In Table 1, we record the descriptive statistics of the AGB at each of the sites and sensors, including the coefficient of variation. Note that the two different L-band sensors will have different coverage at a particular site. Thus, the intersection of the SAR data with the reference AGB map will differ for each sensor and so too will the observed AGB range. In Figure 1, the intersection of the AGB reference data and the extents of the corresponding SAR image products are shown at each of the three sites. We note that Lope has the highest mean AGB, but Mondah has the highest coefficient of variation, given its lower mean AGB but comparable variance. In the table, we also note the descriptive statistics of the areas with AGB above and below 100 Mg/ha. From the last column of Table 1, Ogooue and Lope are predominantly composed of high AGB, whereas Mondah has more equally distributed low and high AGB areas.

2.3. SAR Products

For each of our three sites, we separately estimate AGB for each L-band sensor: once using UAVSAR data and once using PALSAR-2 data. To do this, we obtain a backscatter image and a coherence image, as described in the next sections. Figure 2 shows a flowchart briefly summarizing our methodology from input SAR products and sparse lidar training data to the final AGB estimates.

2.3.1. Backscatter

We apply radiometric terrain correction (RTC) from [38] on dual-polarization (HH and HV) γ 0 backscatter images from PALSAR-2 and UAVSAR in order to remove the effects of topography on SAR backscatter. For both sensors, we download imagery in radar coordinates, i.e. slant-range products. While UAVSAR collected fully polarimetric data, we restrict ourselves to HH and HV channels as these have the greatest availability across the existing PALSAR-2 catalog and will be globally available with NISAR [39]. For UAVSAR, we use the multilooked slant-range products from the UAVSAR data page [40] and the RTC methodology described in [38]. For PALSAR-2, we used Level 1.1 slant-range products and subsequently geocode the imagery with the Gamma software package [41] to obtain similarly corrected backscatter images from the PALSAR-2 products. The RTC process removes the effects of viewing and target geometry on the observed backscatter imagery.
We despeckle each polarization of the RTC images to reduce erroneous speckle correlations with biomass and obtain superpixel segments that represent landscape features rather than noise-related shapes. We apply total variation (TV) denoising [42] within the homomorphic framework described in [43]. Total variation denoising removes zero mean additive Gaussian noise, preserving edges and discouraging localized oscillations [42,44]. We follow the image transformations, as in [43], so that the multiplicative noise from the L-band imagery is removed with this filter. Before TV denoising, we also perform a floor ( · ) and ceiling ( · ) of the top and bottom percentile of backscatter, respectively, to address the small number of pixels that were not successfully corrected due to layover and shadow in the backscatter imagery. We select the weight for total variation denoising by estimating the noise variance according to [45] and then selecting the regularization parameter according to [44,46]. Because images are frequently too large to hold in memory, we perform this despeckling in a 1000 × 1000 moving window with 980 stride, linearly interpolating between the two windows. We did not visually observe artifacts from this windowed denoising. We report the important backscatter statistics over canopied areas for each sensor in Table 2. We note that Mondah has the lowest mean backscatter, which is expected because of its lower biomass range (Table 1).
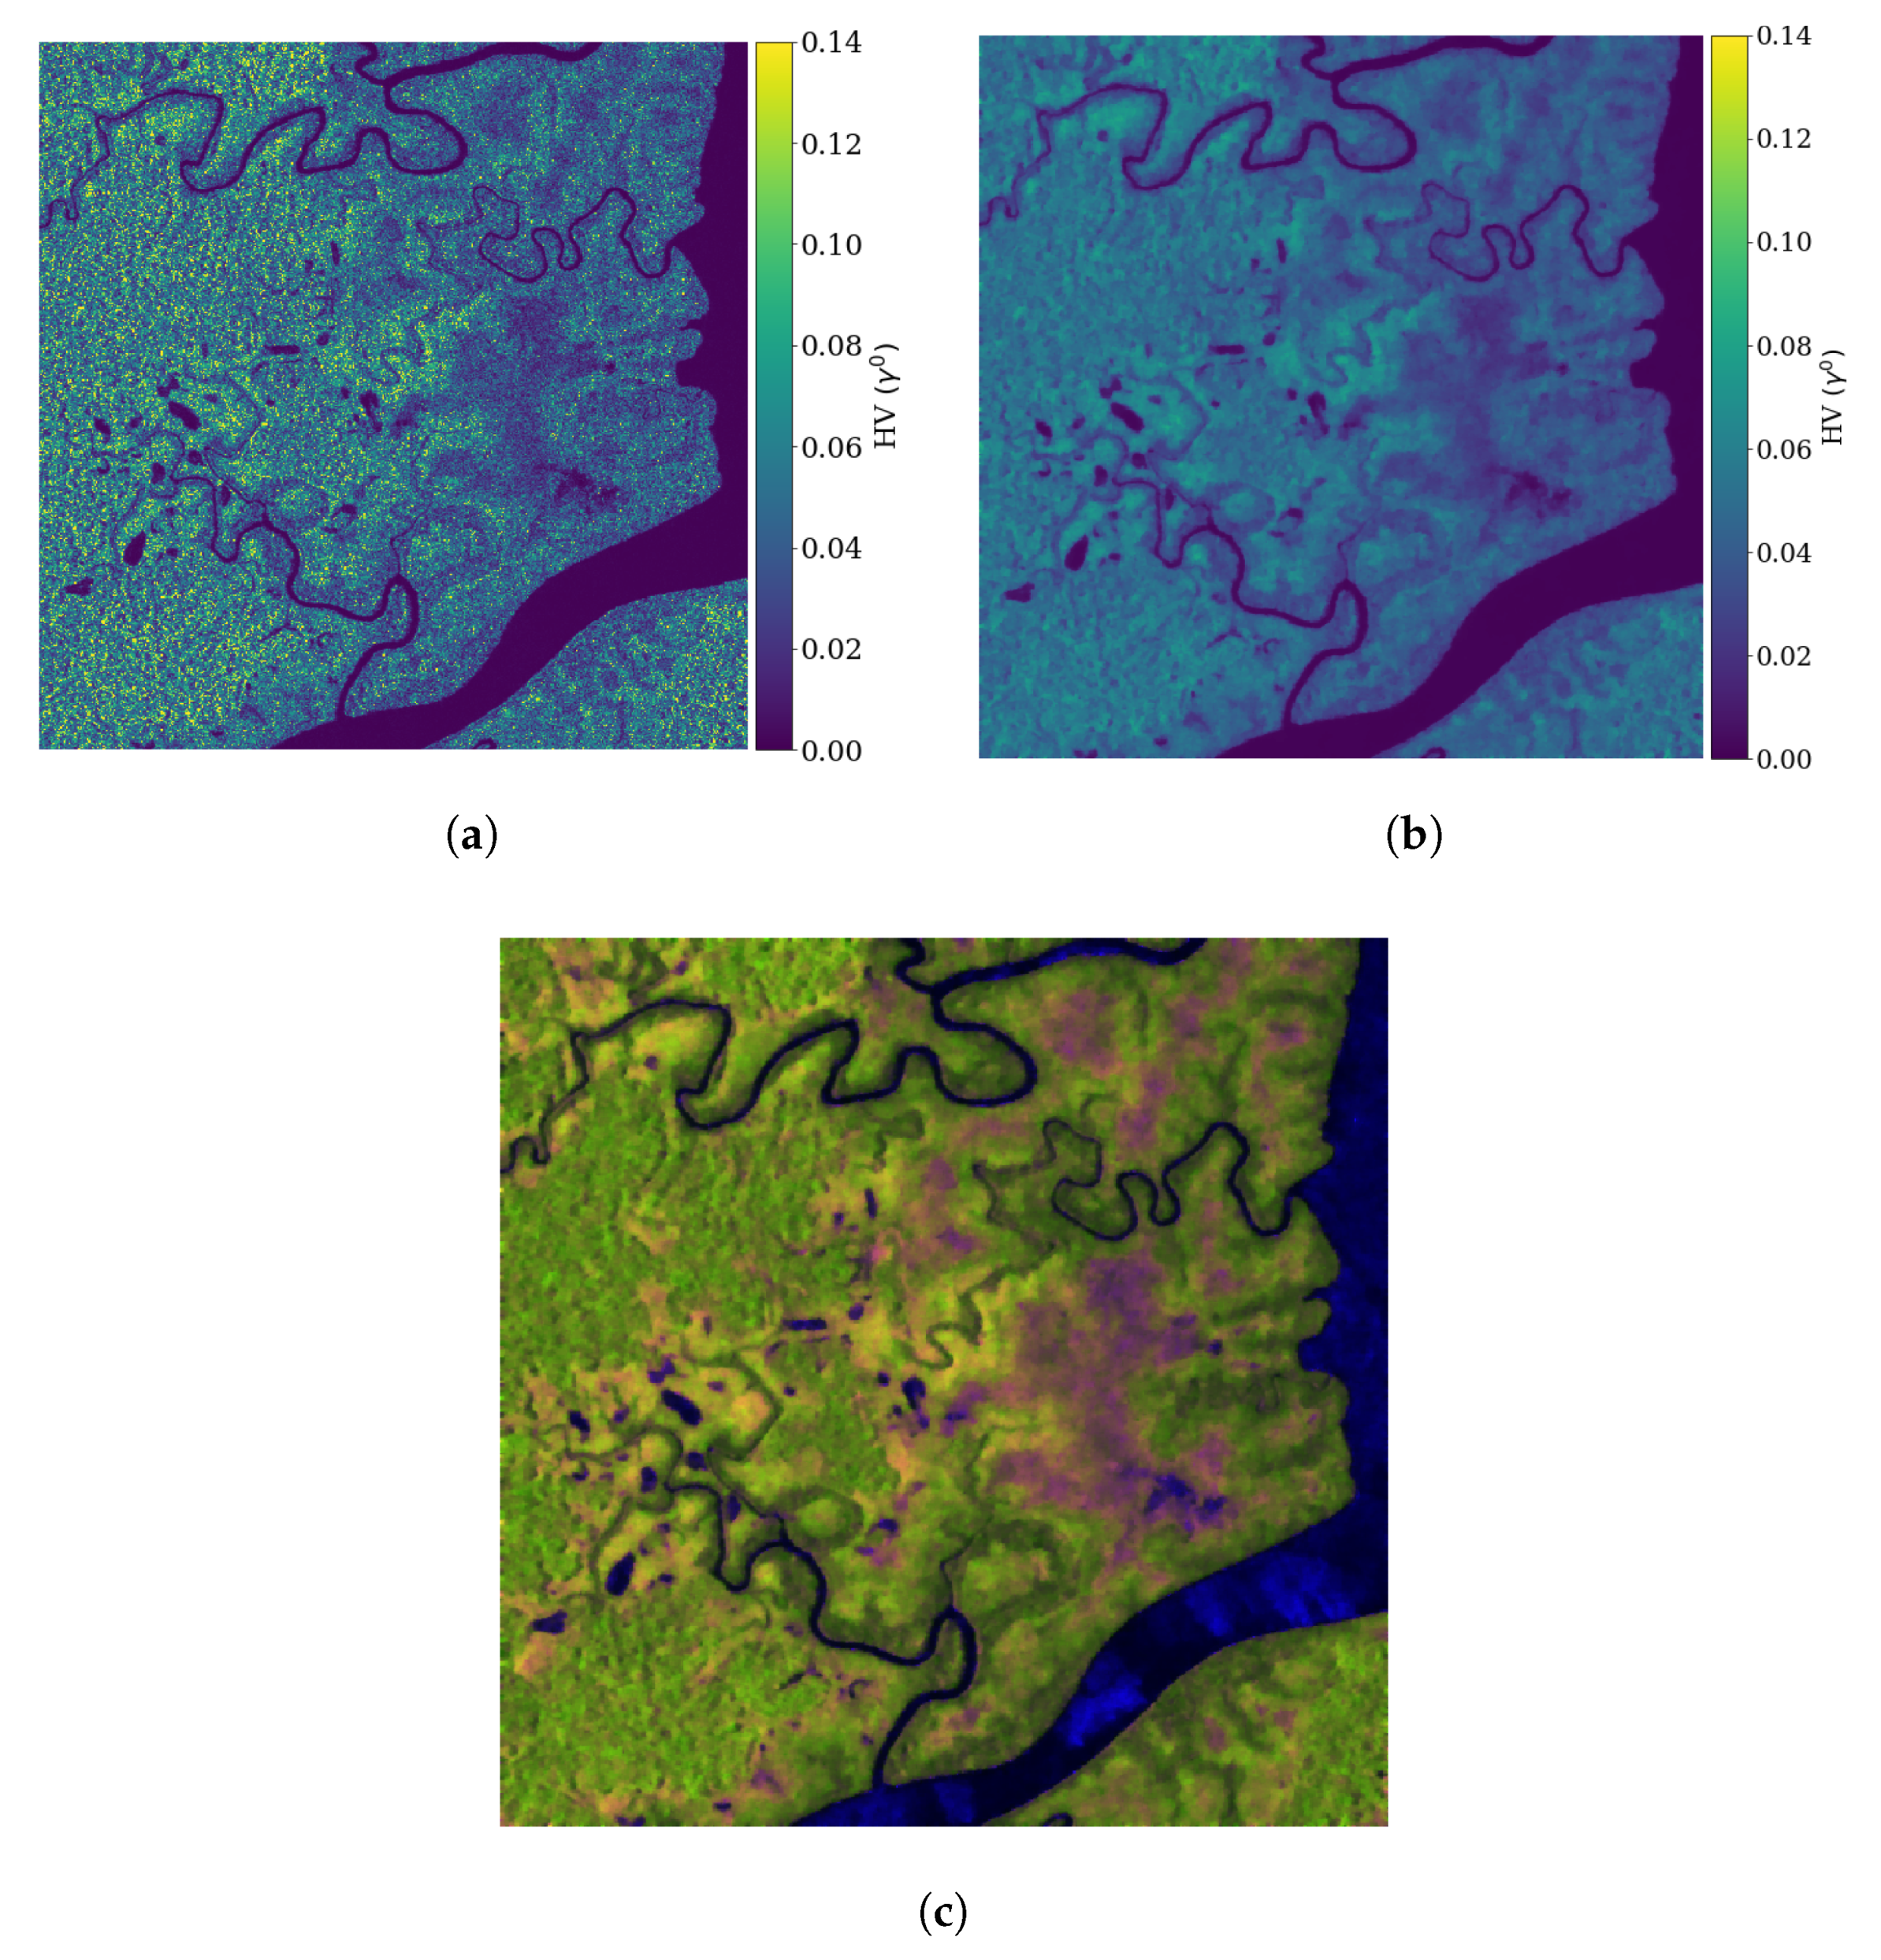
We construct an RGB image while using the despeckled HH and HV backscatter images. We use HH, HV, and HH/HV as the red, green, and blue channels, respectively, as described in [47]. We regularize the polarization ratio HH/(HV + ε ) with ε = 1 × 10 5 to prevent division by 0. We then scale each channel to the interval [ 0 , 1 ] for visualization. We remark that the polarization ratio HH/ HV has the physical interpretation of the ratio between non-volumetric and volumetric scattering [48]. In Figure 3, we compare the RTC image with the final despeckled product that we use for the subsequent estimation. Indeed, the despeckling preserves important boundaries between vegetated areas and river systems while removing the small local oscillations noticeable in the inland forest.
We reproject the backscatter into the reference frame of our lidar-derived AGB map with 50 m resolution. Therefore, the spatial resolution of our SAR products are reduced from 10 m to 50 m.

2.3.2. Coherence

Coherence is the magnitude of the correlation between two retrieved complex SAR images [49]. For UAVSAR, the temporal baselines range from a few hours (Mondah, Lope) to as long as eight days (Ogooue). For PALSAR-2, the temporal baseline is 14 days, which is the shortest available; we found that longer temporal baselines were not as useful for this correlative analysis due to higher levels of temporal decorrelation. We found only one 14-day PALSAR-2 pair for each of the tropical sites in the PALSAR-2 repository [50]. To obtain coherence with PALSAR-2, we used the open-source ISCE2 software package using the default parameters associated with their stripmap application [51] and used the 30 m Digital Elevation Model (DEM) from [52]. The window, in which the coherence is computed, is automatically determined with ICSE2, so that the resolution of the coherence image approximately equals the resolution of the DEM used during processing [51]. For UAVSAR, we utilized the open-source Kapok software [11] and applied Kapok to the coregistered image stacks available at the UAVSAR data page [40]. We use the window size from [53], which provides approximately 10 m resolution coherence images. We remark that the slant-range products used to generate the coherence and the backscatter imagery are different and, therefore, have different availability on [40]. We made sure that all of the products used in our analyses were captured within a window of a few weeks. We also note that both our original SAR products (coherence and backscatter) have finer spatial resolution than our reference AGB map. We perform the aforementioned processing of each SAR product at the finer resolution to ensure that our input SAR products that are projected to the reference AGB frame have high fidelity to the higher spatial resolution SAR products.

3. Methodology for AGB Mapping

3.1. Generating Features from Multiscale Superpixels

Superpixels provide a coarse spatial segmentation of a scene into contiguous areas of homogeneous image intensity, in this case backscatter. Superixel analysis, also called “object-based” analysis in remote sensing [54,55], is applied to object detection [56,57], image classification [58,59], and change detection [60,61].
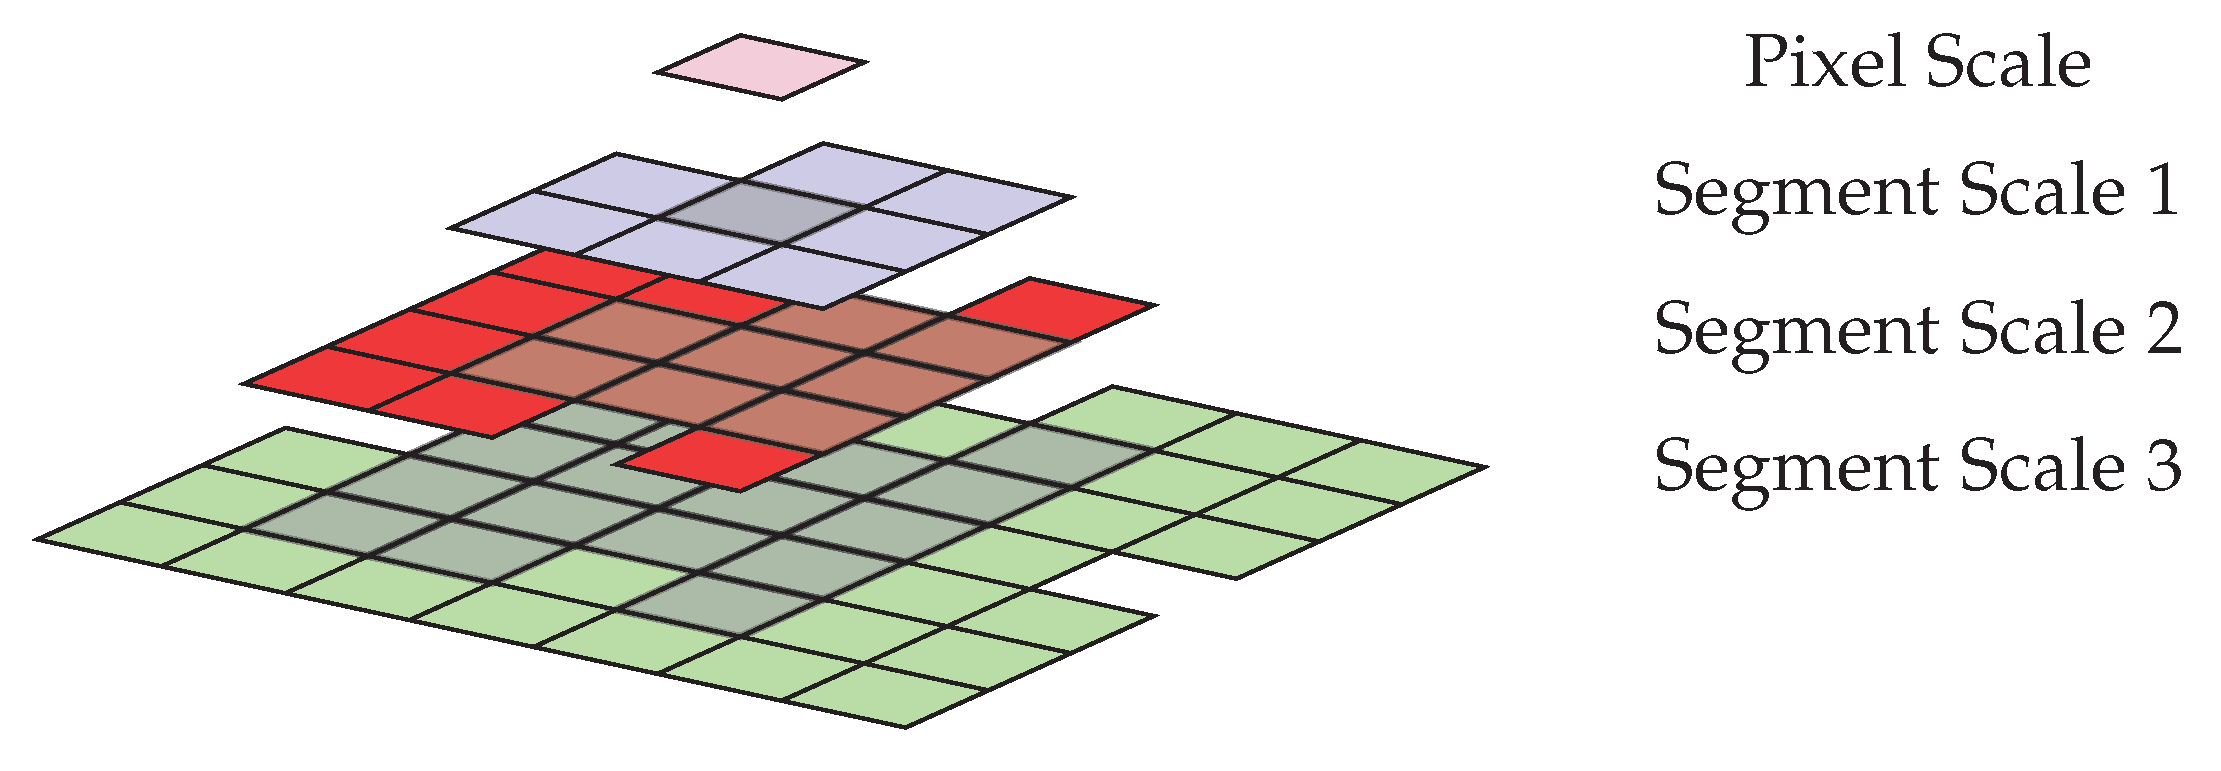
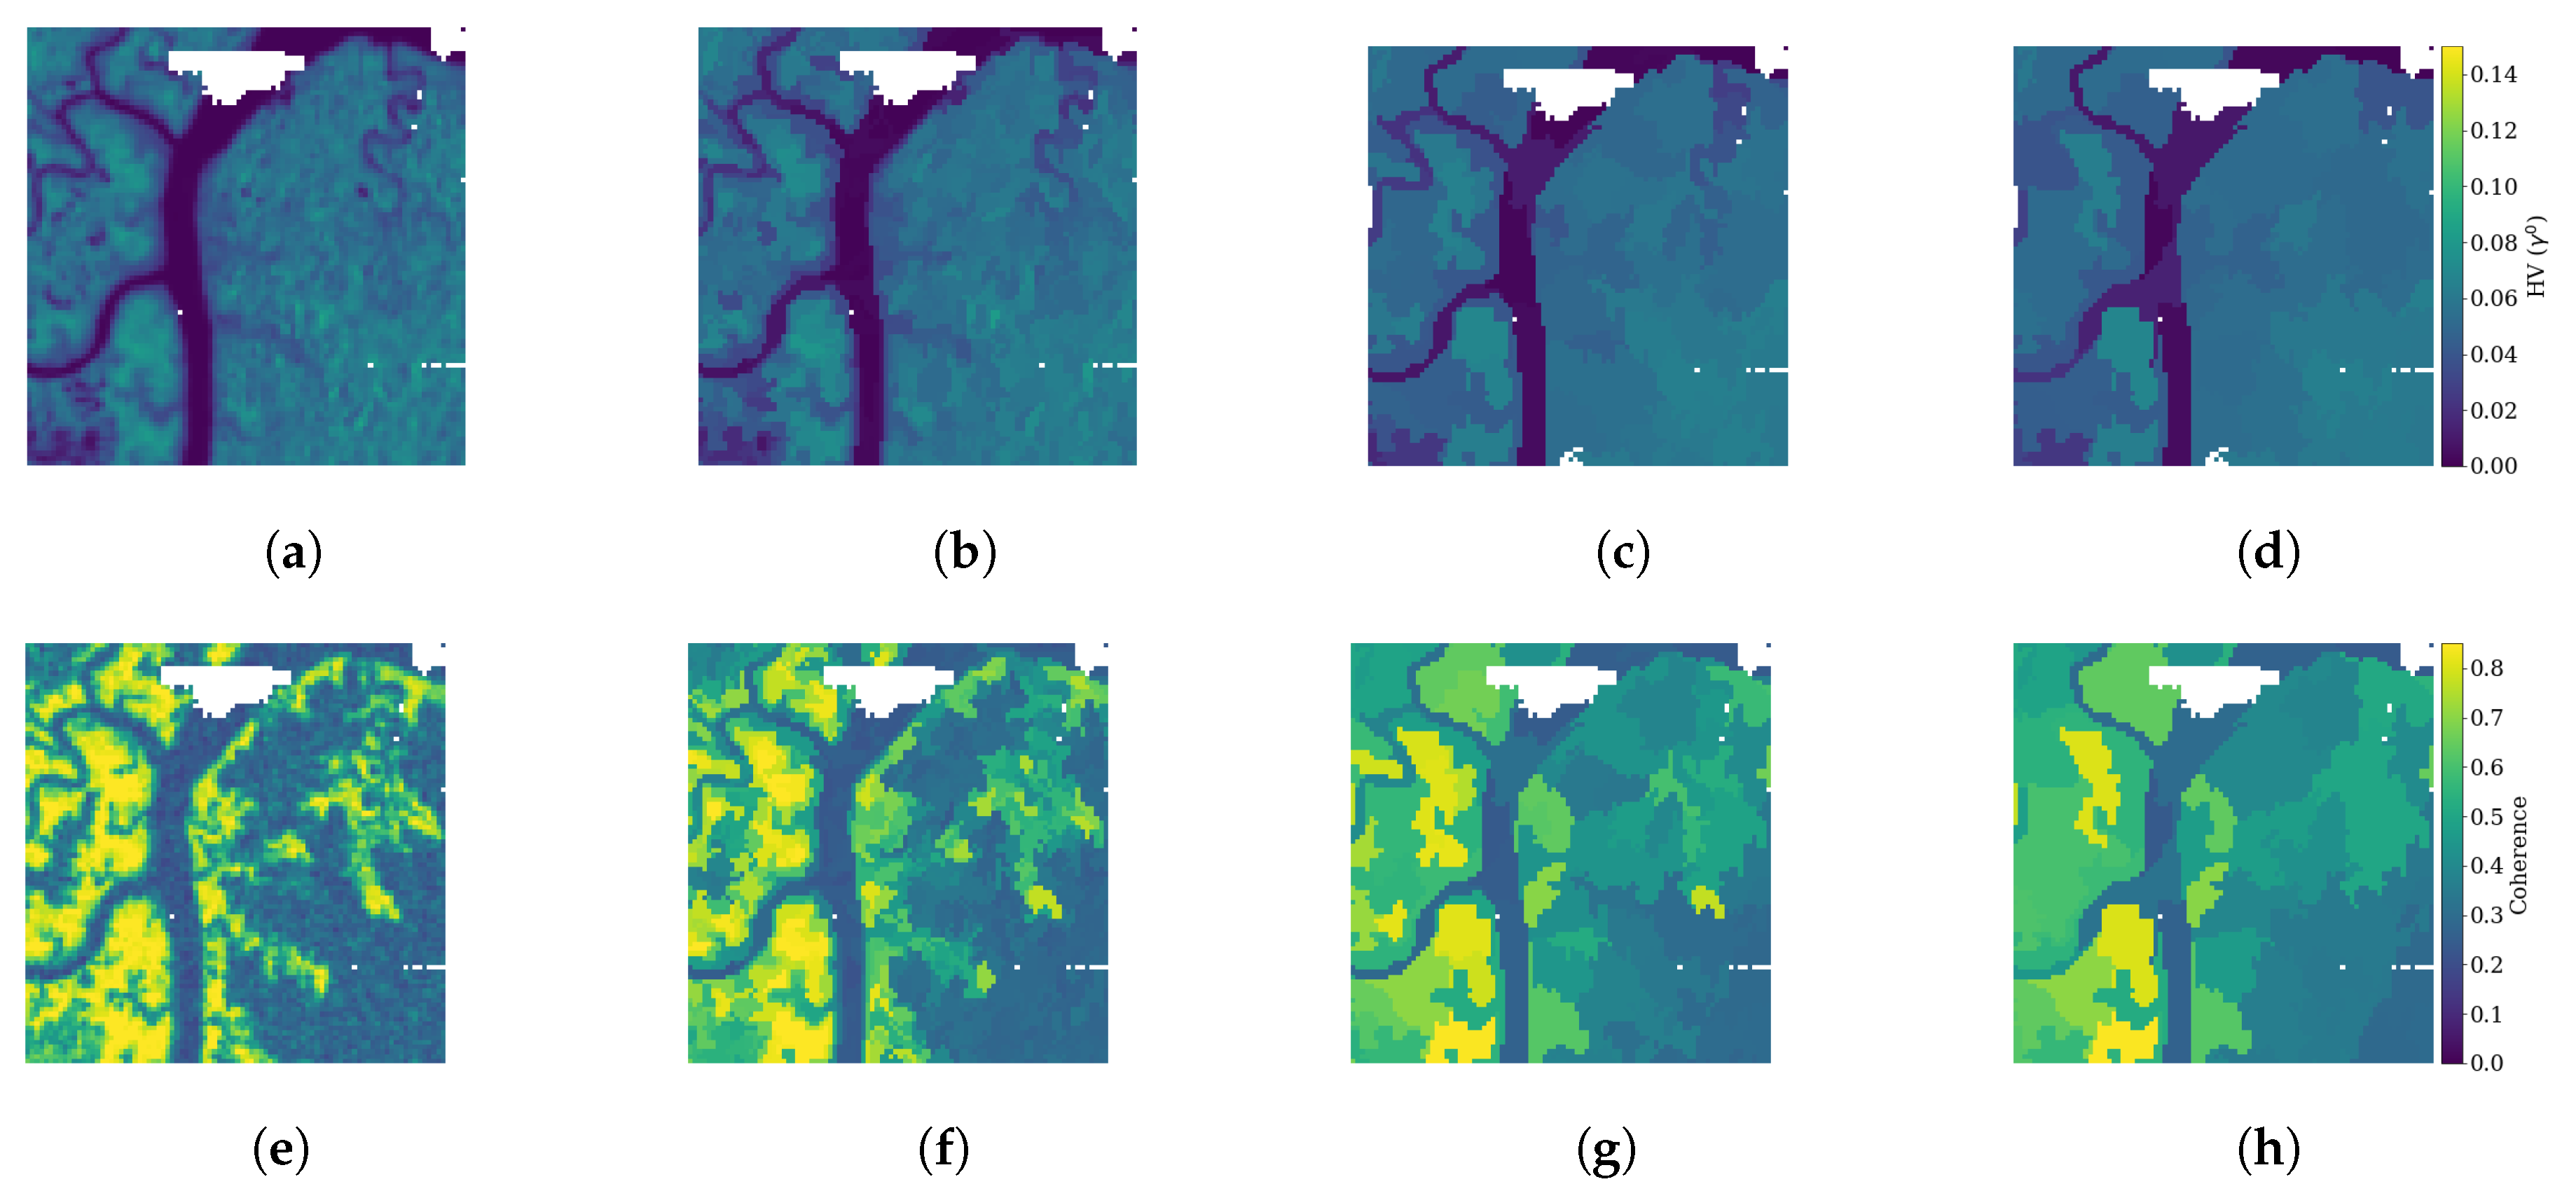
Here, we use superpixel segmentations of increasing size to generate features for our regional estimation model. Our method allows for us to characterize features of the SAR images at multiple scales simultaneously without the need to specify a scale a priori (e.g., [59,60]). We determine our segments using the backscatter RGB image from Section 2.3.1 while using the graph-based approach from [62]. The graph-based approach translates the image pixels into an 8-connected grid with each pixel as its own segment. Subsequently, the algorithm iteratively merges segments with its neighbors if a similarity criterion between segments is met in addition to ensuring that all segments have at least a user-defined minimum size [59,62]. To generate our multiscale features, we experimented with SLIC [63], an alternative superpixel methodology whose resulting segments have more uniform size than those derived from the graph-based approach. However, our AGB accuracy was almost always higher when using the graph-based segments. The superpixel features that are used in our study are the mean and standard deviation of the pixel values of each SAR product (coherence and backscatter) within the segments. The mean coherence features are particularly useful to smooth large spatial variability in observed coherence. A schematic of the multiscale features are shown in Figure 4, indicating how a pixel is related to these segmentations of increasing sizes. This multiscale approach was first proposed for object detection in [64] and it is similar to the image pyramid [65] applied in deep learning frameworks, such as [66]. Here, our generation of superpixel features is similar in spirit to those texture features generated by a 3 × 3 moving window in [14]. In Figure 5, the mean backscatter from the HV backscatter and HH coherence image within these multiscale superpixels are shown on a subset over Mondah. We also use standard deviation within a segment to derive features, though they are not shown. For the three superpixel scales, we selected minimum sizes 5, 25, 50, and fixed the scale parameter at 0.5. The size parameters were selected to ensure that the segments approximately doubled in mean size with each additional segmentation scale. We note the minimum size parameter is correlated with the mean segment size when the superpixel algorithm is applied to a fixed image, but a general relation across all imagery is not possible. The segmentation parameters used above are applied to all SAR backscatter imagery in this study. We did not use additional segmentation scales as the additional features did not markedly improve performance in our numerical investigations. We emphasize that we observed improvements in our AGB estimates with all sensors while using these fixed multiscale segmentation parameters.

3.2. Training and Validation: Simulating Regional Calibration with GEDI

We train our model on a sparse subset of pixels from our reference AGB map to approximate the coverage afforded with end-of-mission GEDI data [26,29,30], albeit our approach is highly simplified and does not represent the precise of spatial sampling of any existing spaceborne lidar. In our approach, we add tracks 120 m eastward modulo the image extents until we return to or pass our first track. We select pixels along lines oriented 51.2 clockwise below the equator starting at the corner of the reference AGB map spacing the sampled shots 60 m apart. We did not include the orthogonal tracks that will be available with GEDI, but note that the more data for training that we used, the better our model performed. We erred on the side of using less training data, as we expect GEDI data to be obscured by clouds in Gabon and, more generally, in tropical forests. We did not notice significant changes when translating the initial track across the site for different training sets; we observed no more than than 0.5 Mg/ha variation in the RMSE for such experimental translations of the training samples.
There are several advantages to the proposed regional training scheme, as noted in [4,9]. First, the training set contains a large range of AGB represented in the scene, which can help our model to overcome the model saturation that is typically associated with such AGB mapping [67]. Second, the calibration scheme is based on remotely sensed data and, therefore, overcomes the burden of collecting an adequate volume of field measurements in an area of interest. Thirdly, this calibration over the area of interest mitigates phenological and environmental conditions that could potentially degrade an L-band biomass model, particularly when the model is calibrated with respect to field measurements over a different area [9]. Although environmental factors can still degrade our AGB estimates, the calibration is done with respect to the relevant SAR imagery and the model adjusts accordingly. To expand on this last point, Ogooue’s UAVSAR coherence proved to be less informative of AGB due to apparently uneven distributed rain over large parts of inland forest that occurred between the two acquisitions, causing temporal decorrelation in addition to its longer temporal baseline. However, the model training proceeded identically.
We note that we train our model on the entire sparse set of our lidar tracks whether or not they sample forest or non-forest areas, as defined in Section 2.1. We provide as many training points as possible over the region of interest because our sites are predominantly vegetated. If multiple land cover types are included in the area of interest, certain non-forest areas may need to be excluded during training to ensure our model can capture accurate correlative relationships between the SAR products and AGB. Our validation set is filtered according to the canopy mask from Section 2.1 in order to ensure that our errors are reported over strictly forested areas and not savanna or sparse low vegetation.
Random forest (RF) models have been successfully used for AGB estimation [14,68,69] and they are used in this work to estimate AGB [70] from the L-band features. The RF models can model non-linear relationships relating AGB to backscatter and handle multiple correlated inputs [70], which is especially important for our multiscale approaches in which features from segments over the same pixel will be correlated. The most relevant features can be determined post-training using impurity-based analysis with the GINI coefficient [70]. Additionally, the parallel implementation of RF models is efficient [71] and permits us to more easily train models with different inputs for comparison.
Our RF models ensemble 1000 trees with out-of-box scoring and an L 2 loss [70,71]. We experimented with binning our training data to simulate uniform sampling across the AGB range, but this did not improve the RMSE for any site or with any sensor. In Figure 6, we show a sample of the training and validation set over a small area in Mondah along with the estimates over the same test area.
We generate multiple realizations of the training data corrupted with additive Gaussian noise in order to assess potential impacts of uncertainty in GEDI’s AGB products:
y noisy = y true + N ( 0 , σ )
where y is a biomass value and N ( 0 , σ ) is normally distributed with mean 0 and standard deviation σ . We ensure that y noisy 0 setting a numeric floor at 0. Increasing σ on the training data amplifies the size of errors introduced. We consider 100 different realizations of the training data according to Equation (1) for some fixed σ and consider the mean and variance of these errors to measure the noise impact on the final RMSE. This particular noise model is a highly simplified version of the errors that will be present in GEDI AGB estimates or other spaceborne lidars, as discussed in [72,73], and such noise simulation is beyond the scope of this work.

4. Results and Discussion

4.1. Results with a Low Biomass Mask

For each site and sensor, we use the corresponding reference biomass map to partition our area into areas that are above and below 100 Mg/ha. We apply our methodology to each area separately, obtaining a high and a low AGB model with a spatial resolution of 50 m (i.e., 0.25 ha). This will help to determine whether the results meet the NISAR AGB mapping requirement of less than 20 Mg/ha RMSE over areas with less than 100 Mg/ha [6], albeit with finer resolution. The partition of our study areas also allows us to more directly compare the results in [9], which only considers low AGB areas.
Table 3 shows the results of this application. When we consider both high and low biomass areas separately over each site, the total nRMSE (here, we normalize according to the mean of the reference AGB) is <51%. Furthermore, our AGB maps have negligible bias, less than 1 percent of the true mean AGB in all cases. For areas below 100 Mg/ha, the AGB map in Lope and Mondah have RMSE below 20 Mg/ha at 50 m resolution, meeting the NISAR requirement. However, in Ogooue, the RMSE for both sensors slightly fell short of the NISAR RMSE requirement by 3 Mg/ha with UAVSAR and by 6 Mg/ha with PALSAR-2. For UAVSAR, the coherence appears to be degraded by rain that occurred between the repeat-pass radar acquisitions, causing significant temporal decorrelation not associated with vegetation structure, which might explain this poor performance. For areas that are above 100 Mg/ha, our RMSE is approximately 10 Mg/ha lower than the standard deviation of AGB for all sites and sensors, indicating that our model outperforms the mean estimator in this AGB regime. In other words, the model partially overcomes the model saturation typically associated with backscatter-AGB models [6,9]. In fact, for UAVSAR, our model’s error is approximately 20 Mg/ha less than the standard deviation in the high AGB areas for all sites.
As expected, the UAVSAR-based estimates were better than those from PALSAR-2, since UAVSAR has a higher signal-to-noise ratio, finer spatial resolution, and it has shorter temporal baseline (Table 2) than PALSAR-2.
The RMSE across all sites is more than double the RMSE in the study by Bouvet [9] that used a similarly derived reference AGB map. However, in [9], their validation area is primarily savanna and sparse woodlands. In contrast, our low AGB areas consist of short and dwarf Mangroves in Mondah and boundaries of dense tropical forest in Lope and Ogooue. Additionally, Lope and Ogooue are quite topographically varied (Table 2). The methodology performs best over Mondah, which has the flattest terrain and the smallest AGB range of the three sites that we considered here.

4.2. Training on the Entire AGB Range

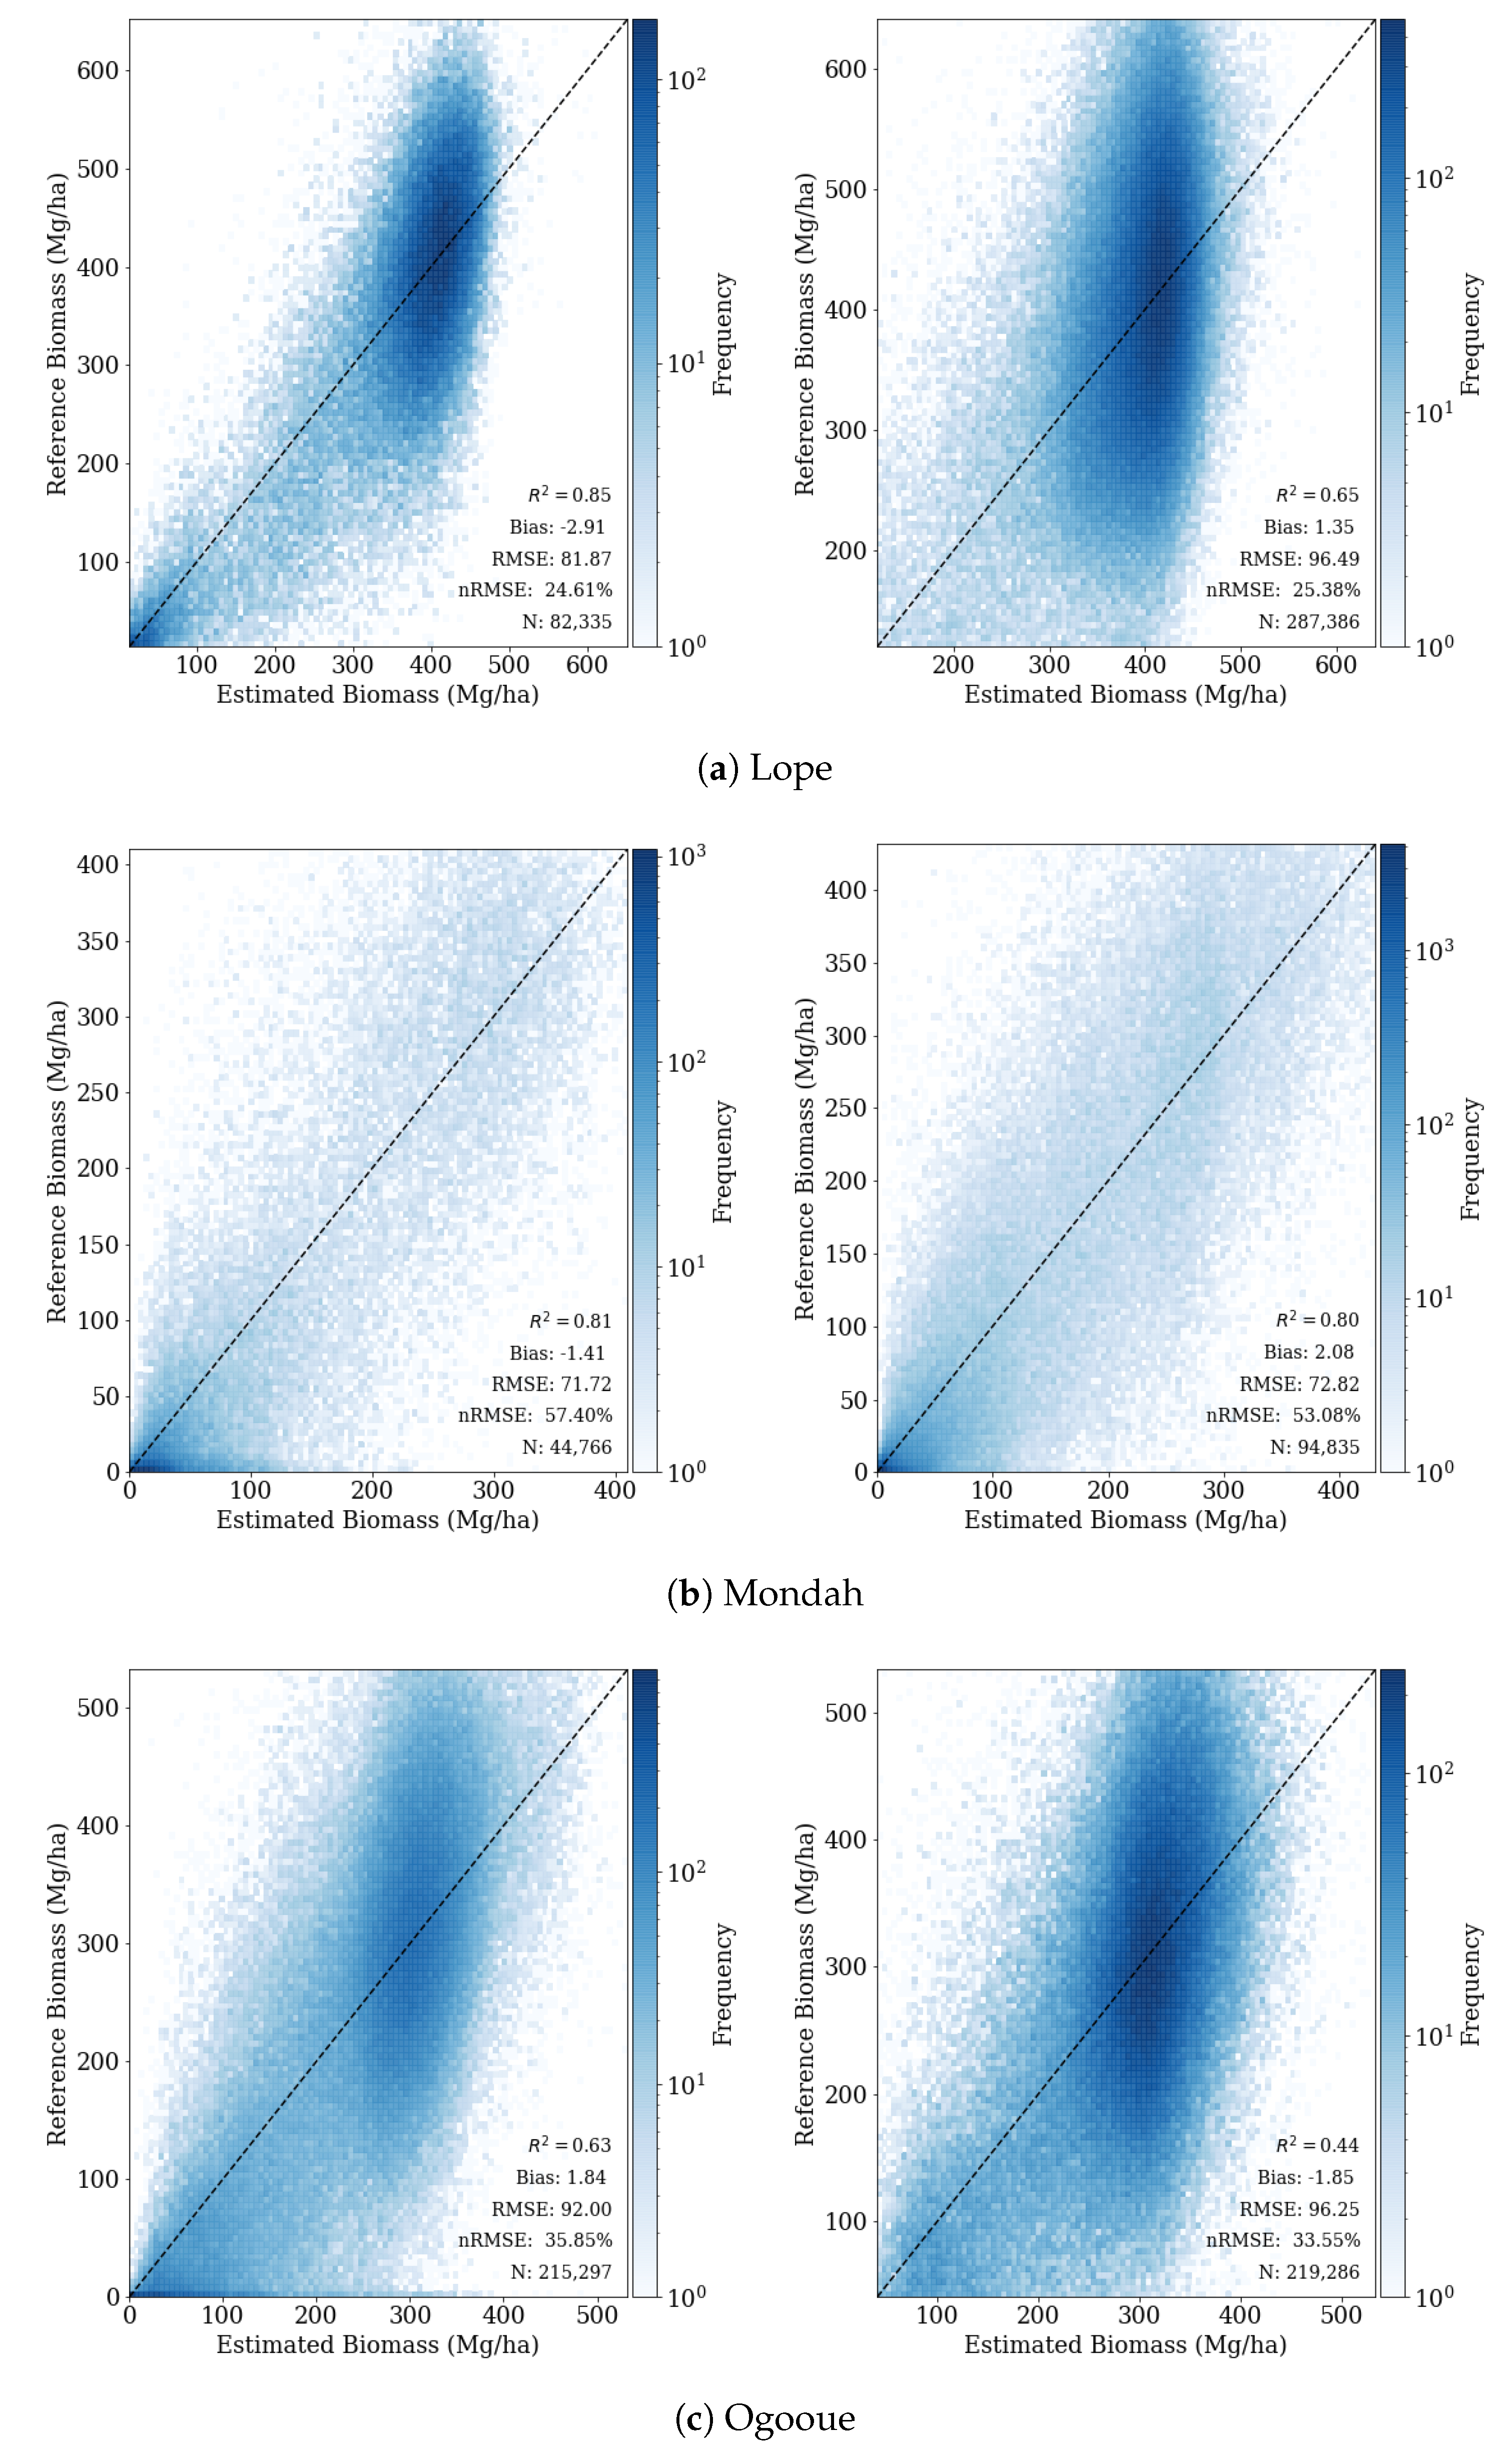
We also apply our estimation methodology to the full area without partitioning high and low AGB areas prior to training. This represents a more realistic application of the proposed methodology, in which a reference map is not available. Unsurprisingly, the accuracy, particularly on the low biomass areas suffers: the nRMSE for all areas is now <60% and the bias <3 Mg/ha for all sites and sensors (Figure 7). The plots over Lope and Ogooue in Figure 7 appear to indicate a saturation of the AGB model between 300 and 400 Mg/ha. Although our AGB estimates frequently overestimate low AGB values and underestimate high AGB values, particularly in Lope and Ogooue, the overall low bias of our results indicates that our method provides an accurate regional estimate of aggregate AGB stock.
Several factors can explain the poorer model performance over low AGB areas. Firstly, our RF is trained using the L 2 loss and attempts to reduce absolute errors across the AGB range. These absolute errors are larger over the high AGB areas than the low AGB areas. In fact, since many of the sites are predominantly high AGB, accuracy in high AGB areas is more important to the RF model than accuracy in low AGB areas. In Table 4, we observe that the RMSE over the low AGB areas might be greater than or equal to the RMSE over the high AGB areas. Secondly, RFs are ensembles of regression trees that typically cluster estimates around the modes of the target distribution; in our case, this leads to underestimating high AGB values and overestimating low AGB values. Such errors have been observed in other AGB studies employing RFs [14,68]. Including more high quality optical imagery, such as Sentinel-2, for example, would allow our RF to better differentiate high and low AGB areas during training.
From the error metrics that are reported in Figure 7, we note, as in the previous section, that the UAVSAR estimates have lower absolute errors and higher model R 2 than those from PALSAR-2. The RMSE at Mondah is lowest when compared to the other sites and we conjecture, due, in part, to Mondah’s flat terrain, lower AGB range and higher coefficient of variation. We also discuss in Section 4.2.1 that the PALSAR-2 coherence at Mondah is highly correlated with AGB.

4.2.1. Coherence and AGB

We show that the use of InSAR coherence can significantly improve the AGB estimates over those models that do not use InSAR coherence as an input. Given that these improvements were observed across all sites and sensors to varying degrees, utilizing the coherence for AGB estimation represents a significant opportunity for improving the range of observable AGB.
In Table 4, we compare our model across each site and sensor. For the comparison, we use all available superpixel features to obtain the lowest possible RMSE for both models. We found the most significant improvement at Mondah, where the addition of coherence reduces RMSE by approximately 9 Mg/ha for both sensors. The reduction in RMSE over high AGB areas was even larger, with PALSAR-2, the RMSE was reduced by nearly 14 Mg/ha over high AGB areas.
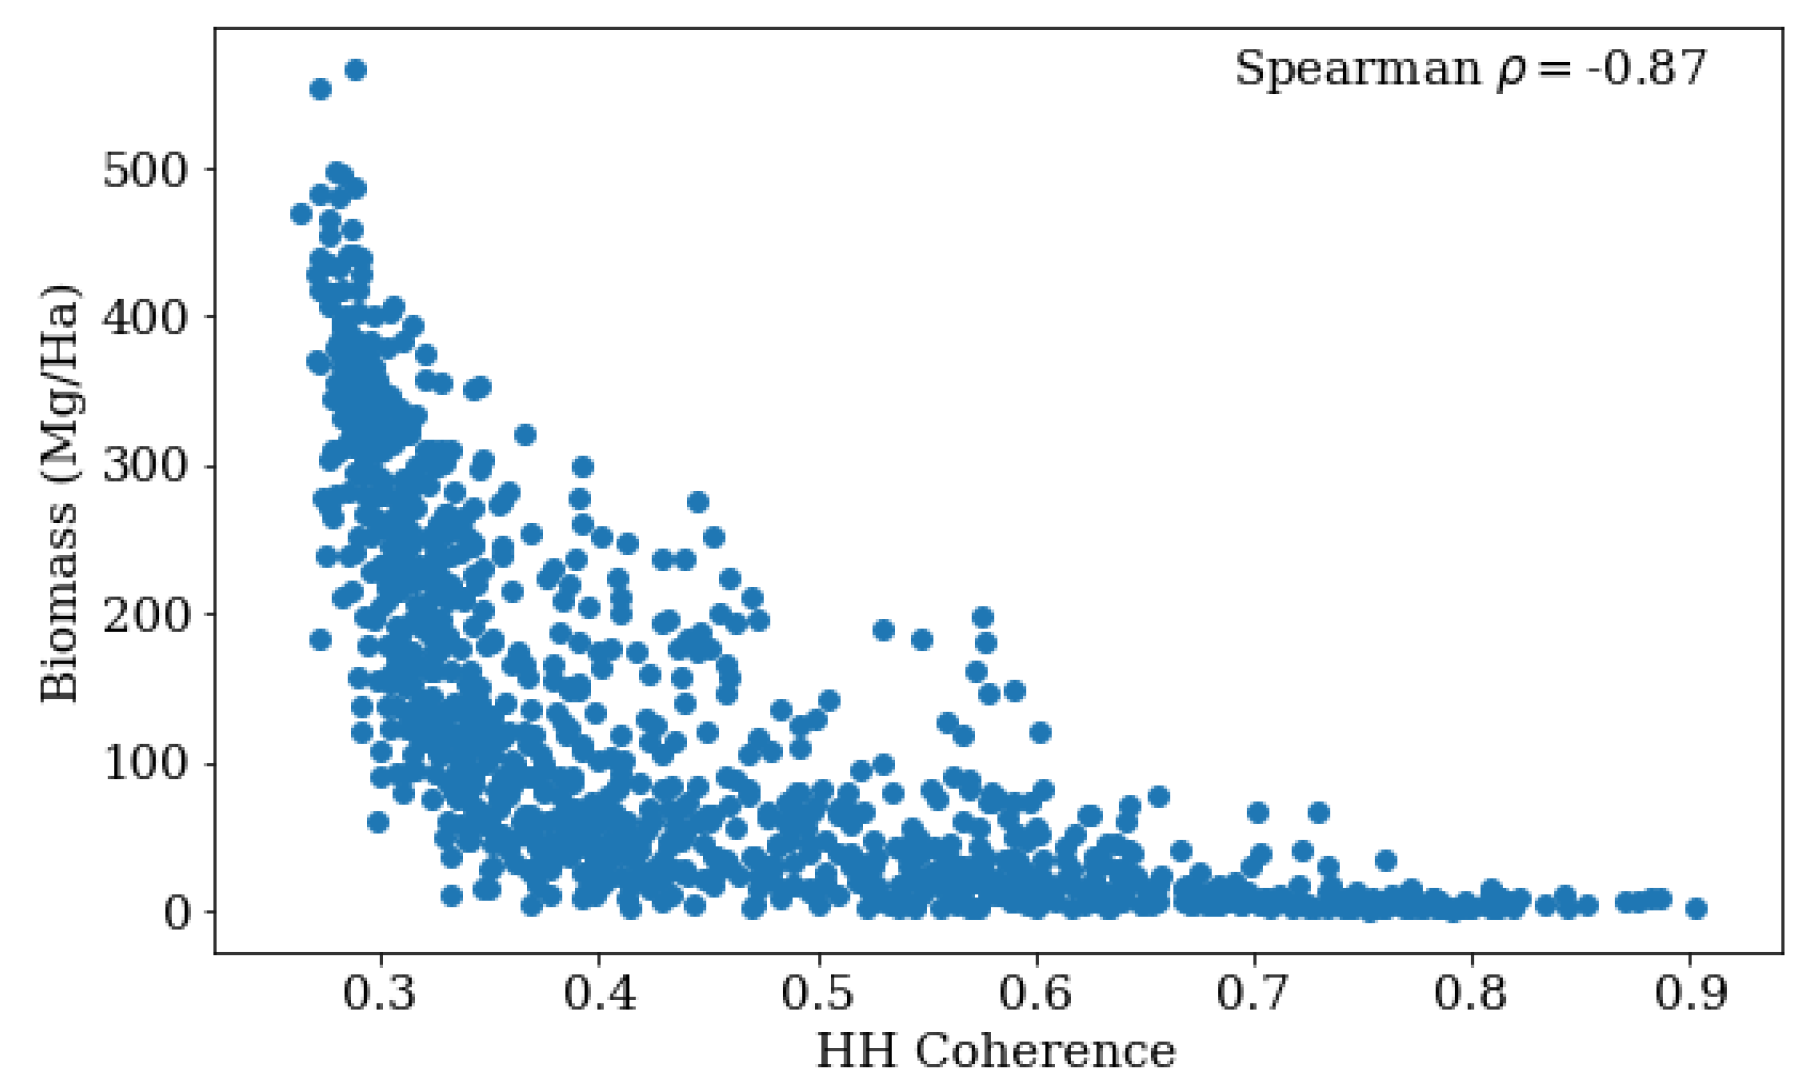
In Figure 8, we plot the PALSAR-2 HH coherence against AGB within superpixel segments of minimum size 25 pixels (6.25 ha) with at least 30 percent of pixels being canopy, as specified by our forest mask from Section 2.1. We report the Spearman ρ there ( 0.87 ), because there is a monotonically decreasing nonlinear correlation. This basic correlative analysis between coherence and AGB echoes those results from [18,28]. Unfortunately, the clear correlative relationship between coherence and AGB observed at Mondah with PALSAR-2 was not present elsewhere (in many cases, the Spearman correlation coefficient is not even defined). The apparent correlation of coherence with AGB at Mondah might be related to its high coefficient of variation of AGB, its lower AGB range, the flat terrain there, or some combination. We reemphasize that, in all of our numerical experiments, the inclusion of coherence reduced the RMSE of our AGB estimates.
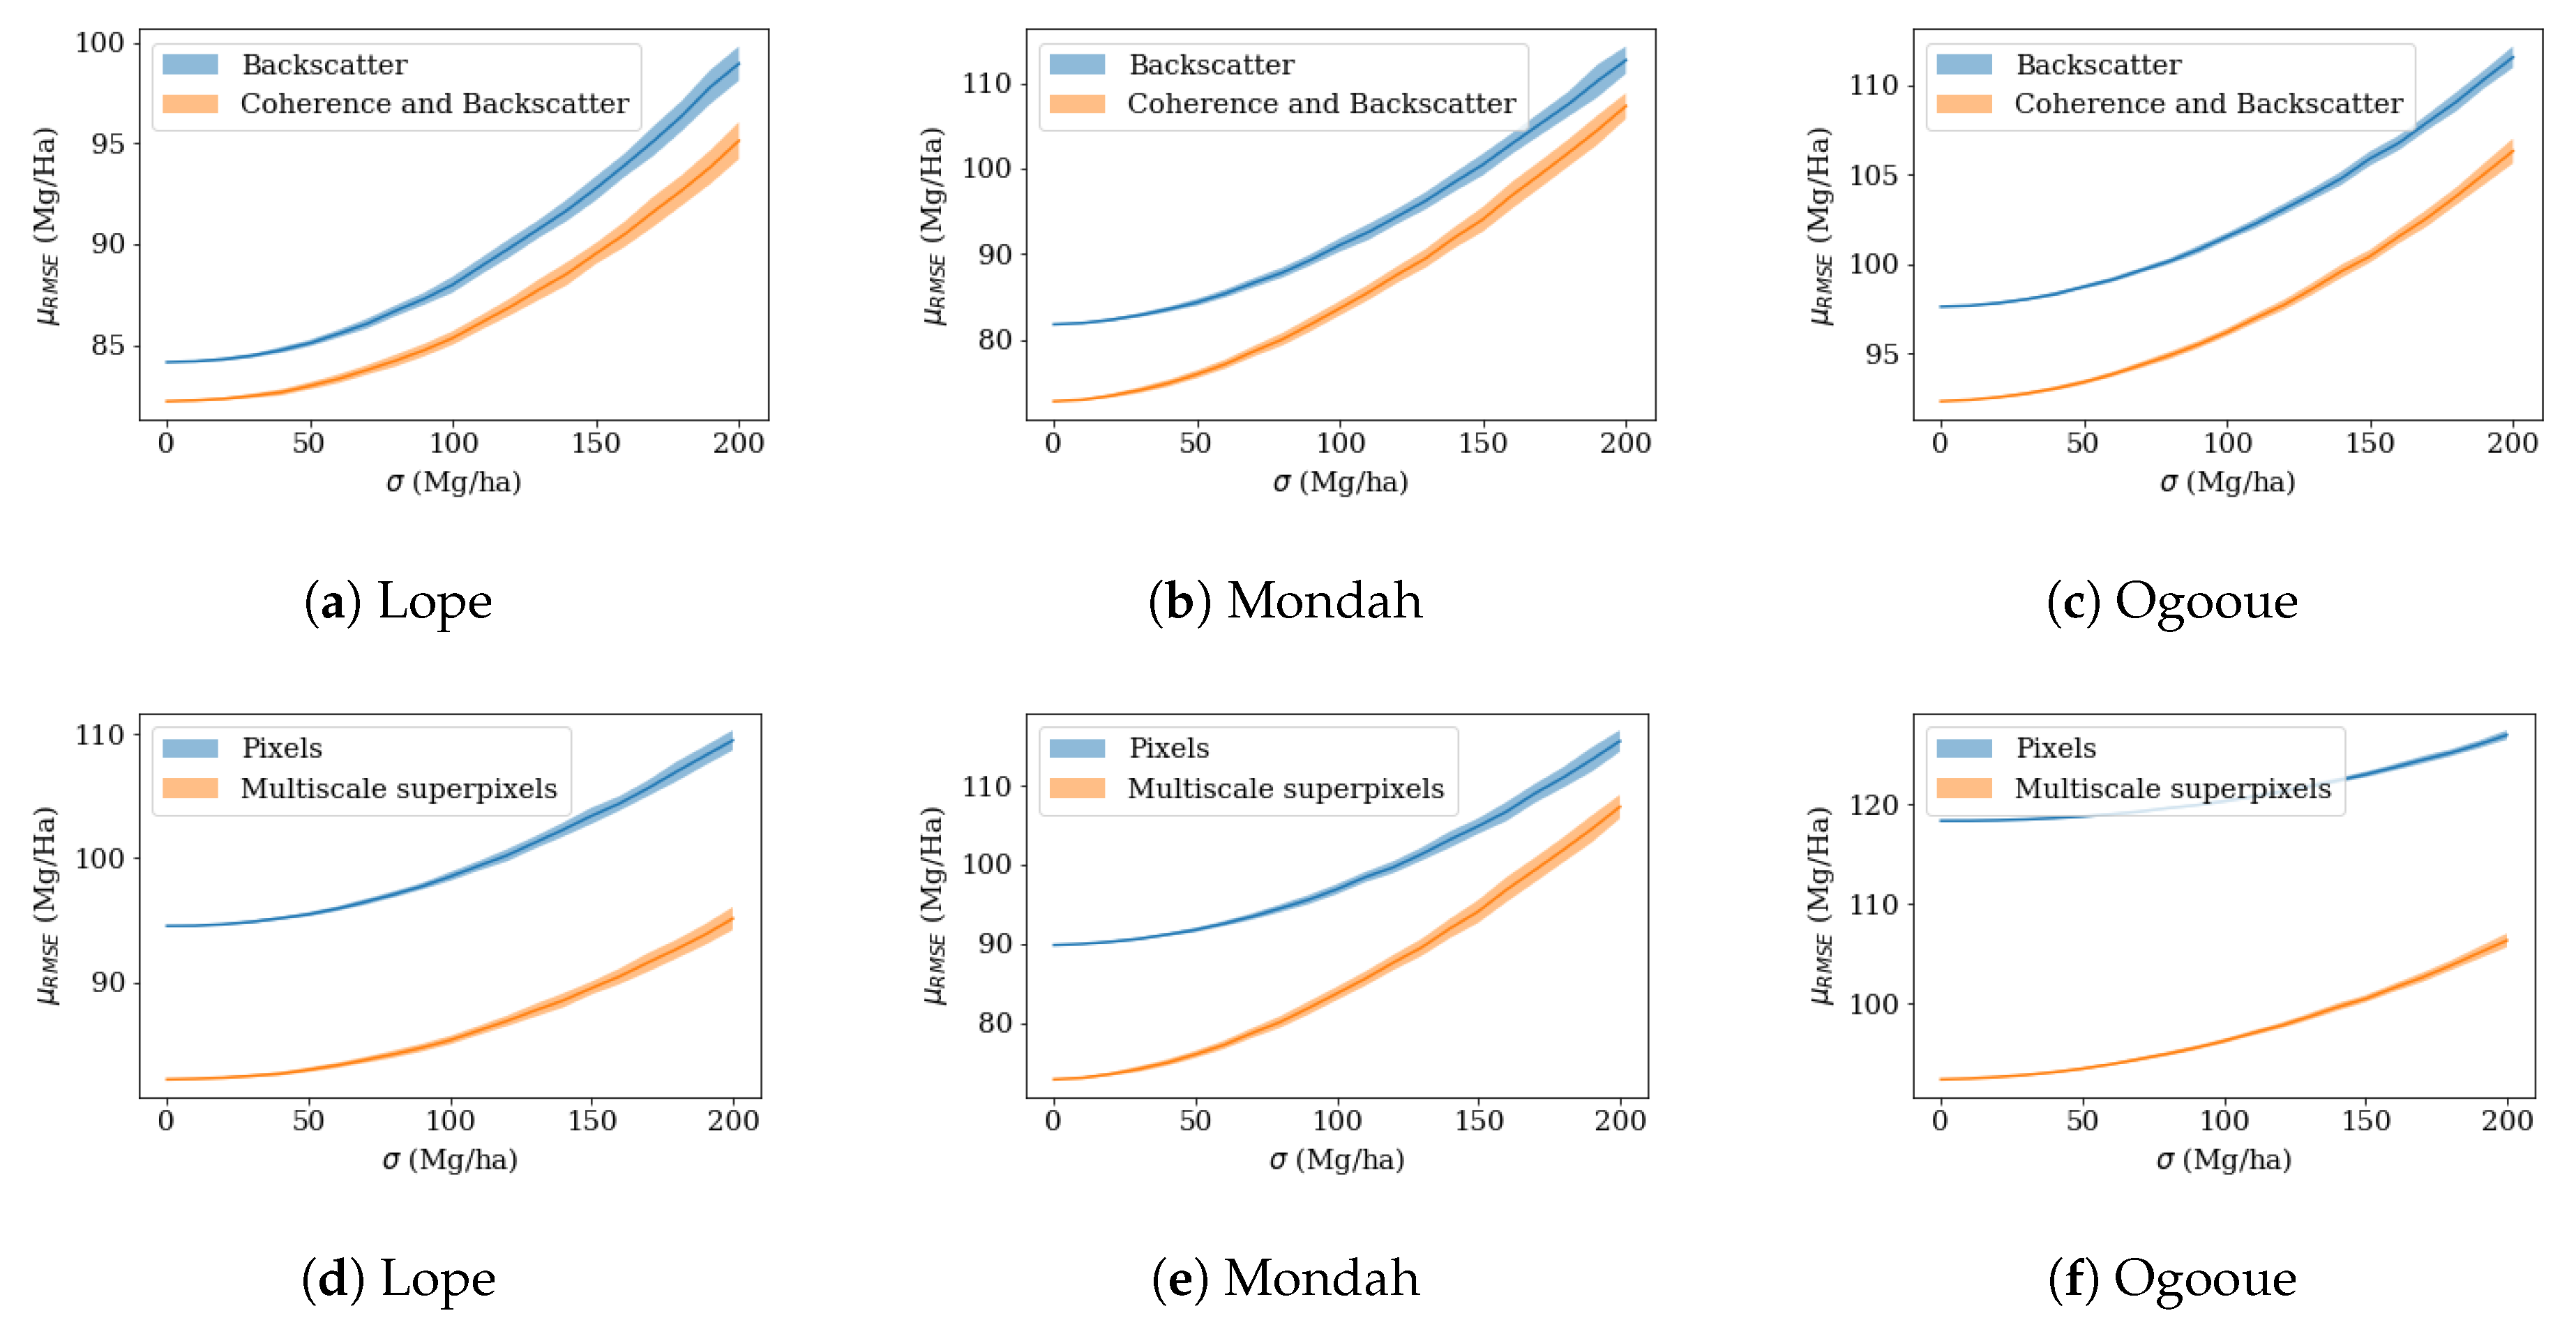
We empirically illustrate that the inclusion of InSAR coherence improves our estimates, even when including noise to the training data using the noise model from Equation (1), because the GEDI mission’s AGB estimates will still contain errors. In the top row of Figure 9, we compare the RF models trained with and without InSAR coherence when corrupted using this noise model. We select 50 equally spaced values of σ in [ 0 , 200 ] . For each fixed σ , we generate training data corrupted by the additive noise of Equation (1) 100 times and apply the same training and validation methodology for each set of noisy training data. The figure shows the mean RMSE and one standard deviation of these errors for these two scenarios. As expected, the RMSE increases when our AGB model is trained on noisier training data. Our assertion that coherence reduces the RMSE of the AGB estimates remains valid for the majority of these models.

4.2.2. Multiscale Superpixels

The multiscale superpixel-derived features improve our regional AGB biomass estimates. Indeed, our results significantly improve across all sites and sensors as we add more superpixel-derived features as inputs; for UAVSAR, the improvement in RMSE is consistently over 12 Mg/ha and in some cases over 20 Mg/ha. Table 5 shows the results for the comparison of segment-derived features.
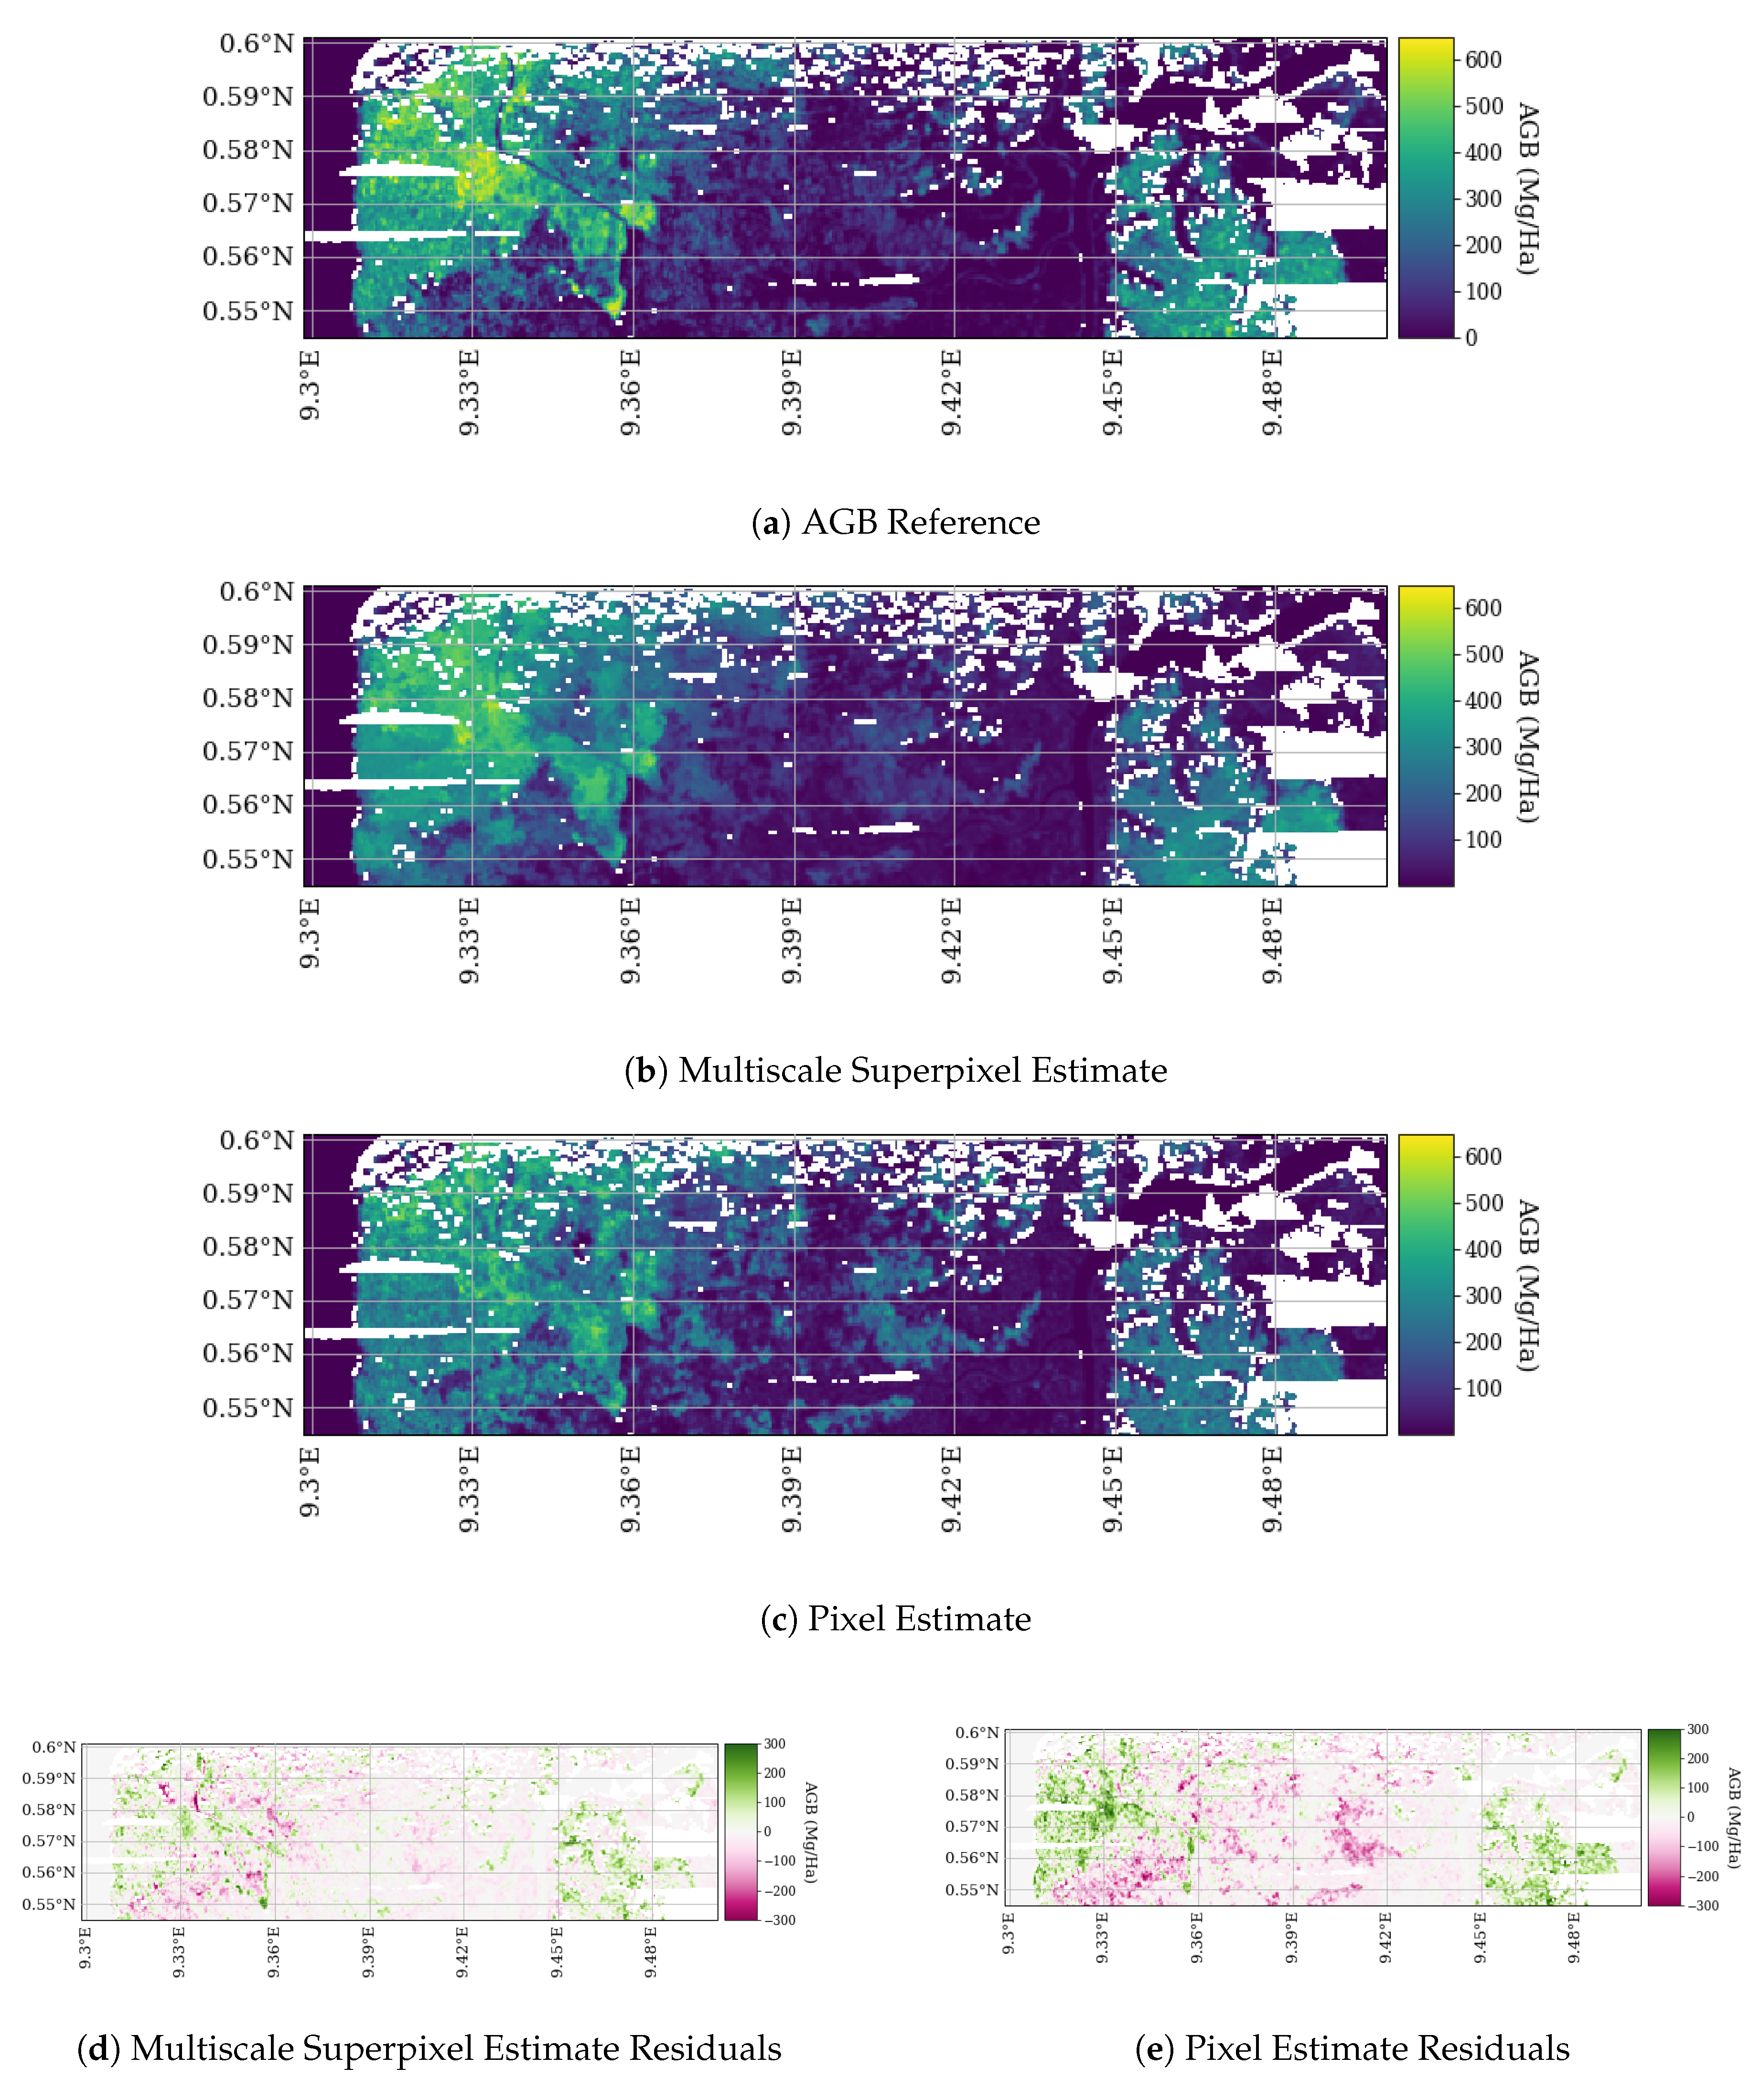
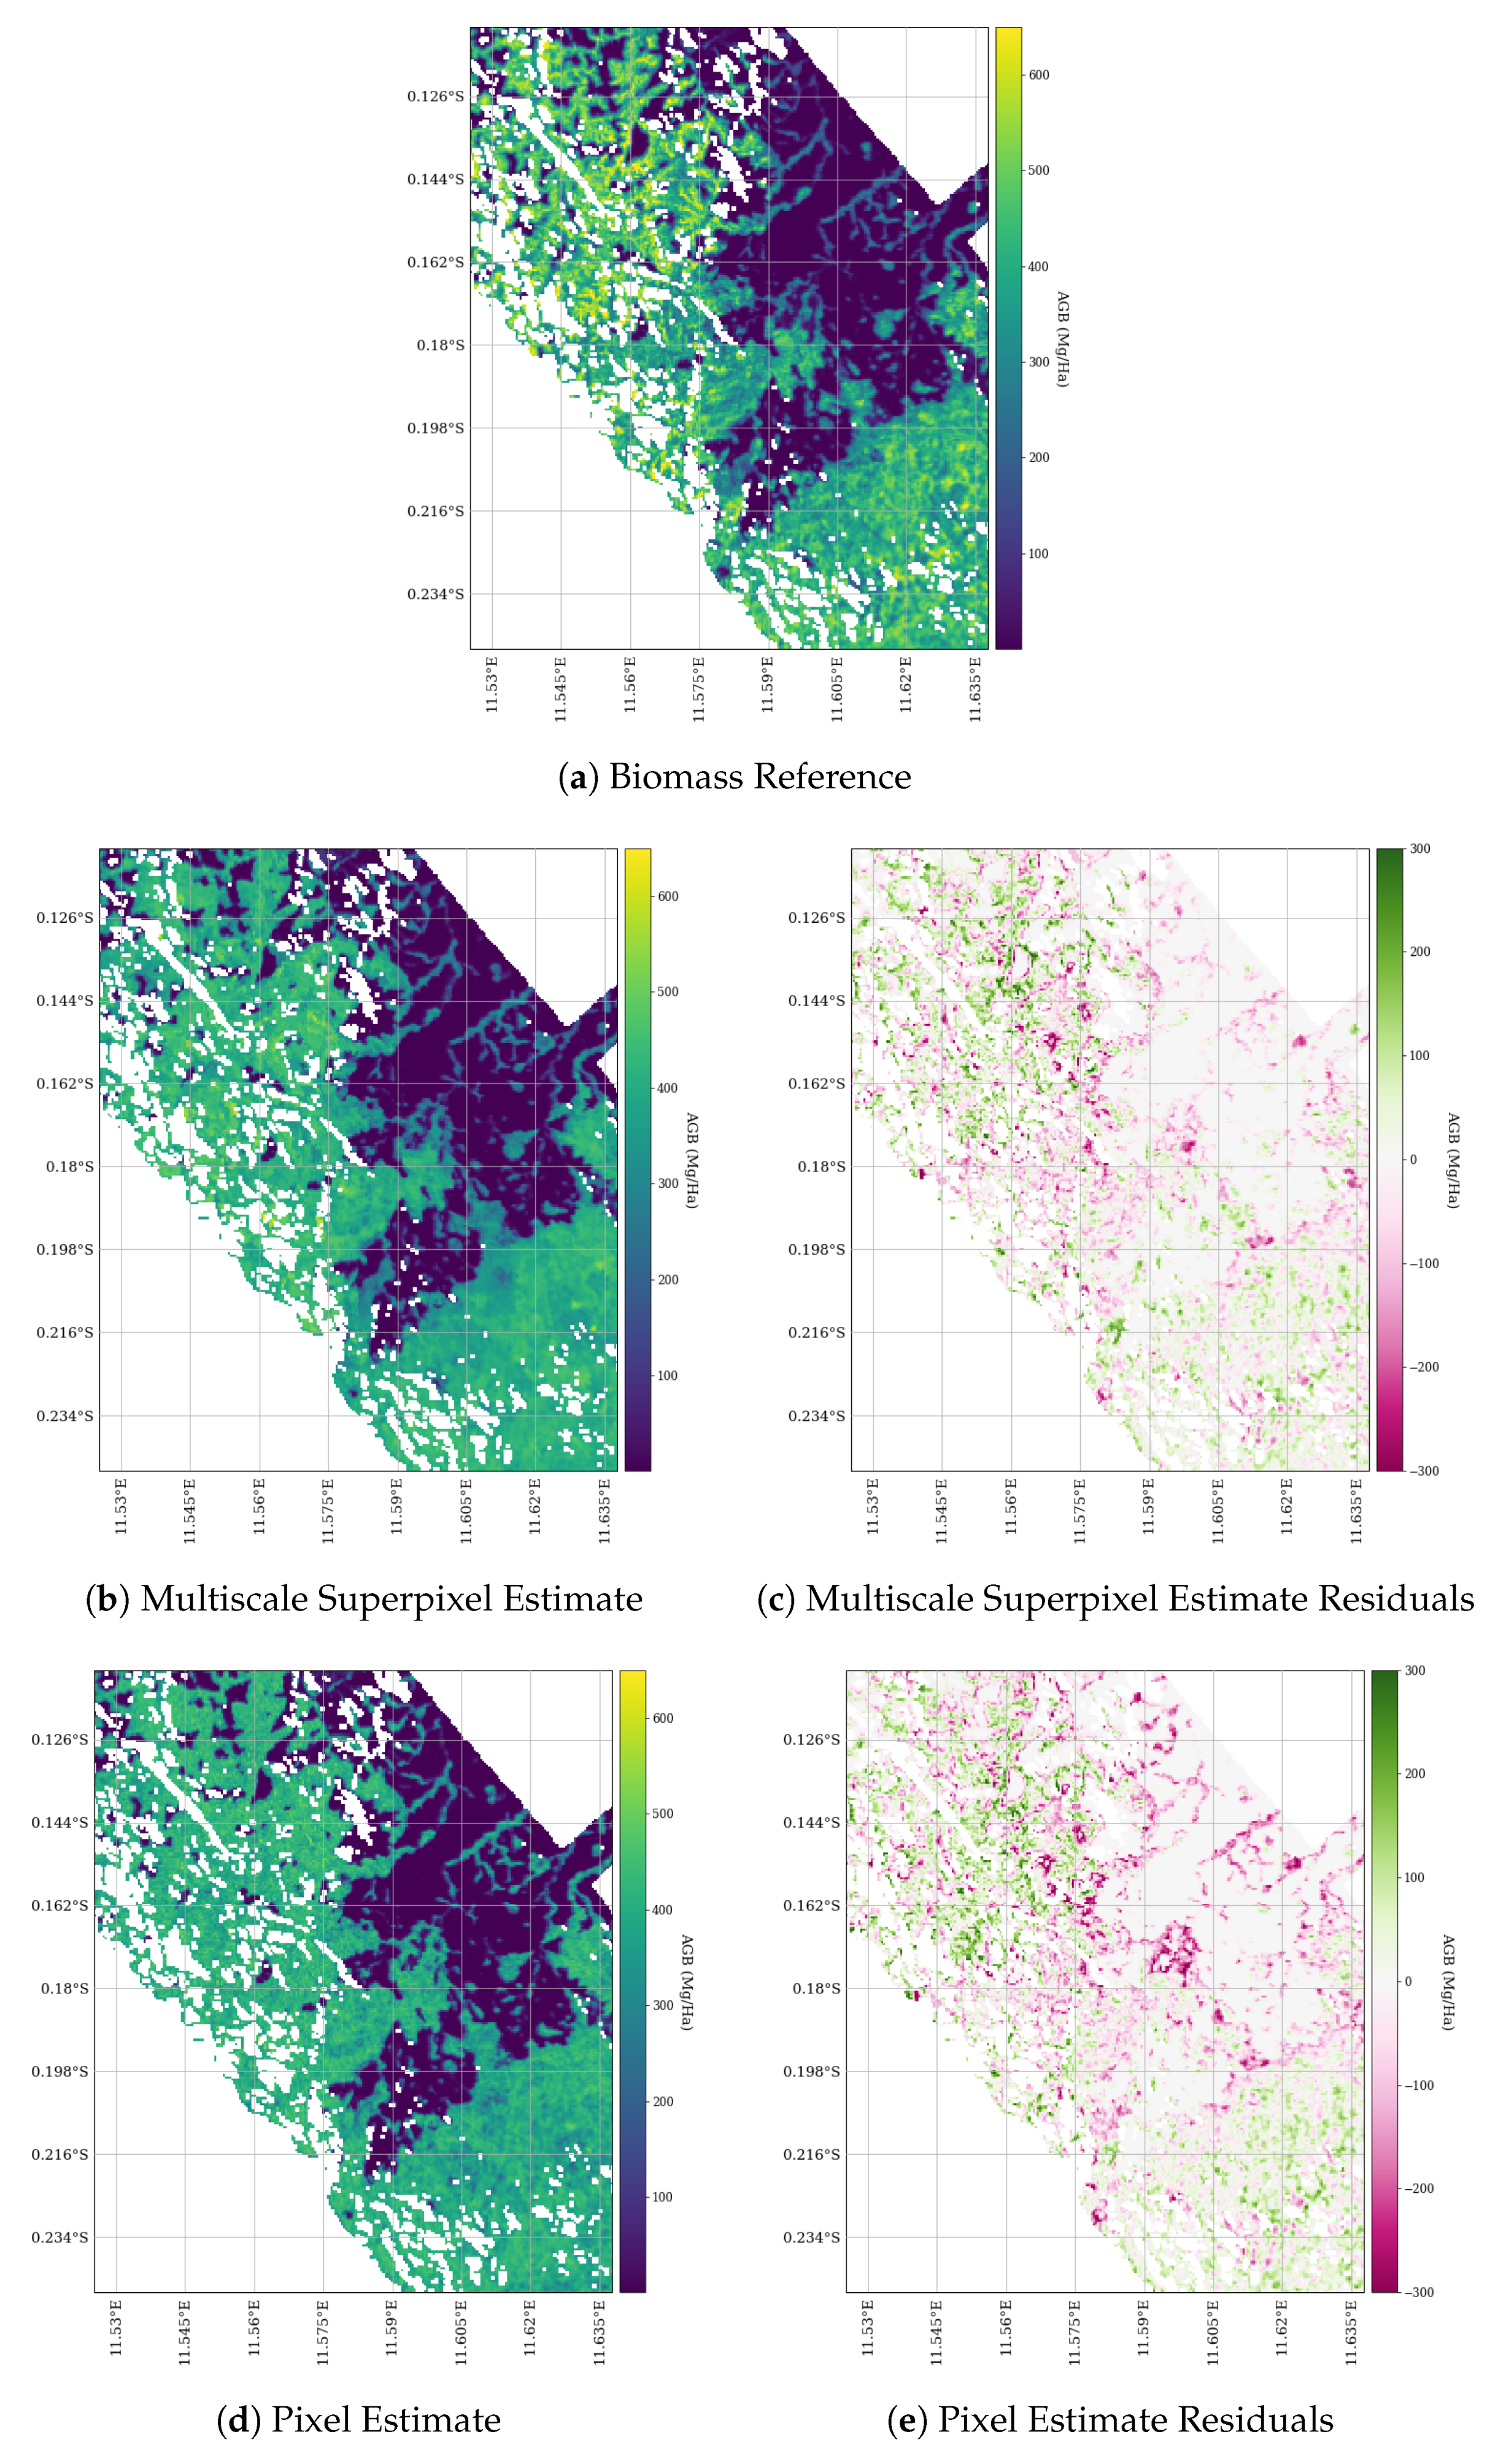
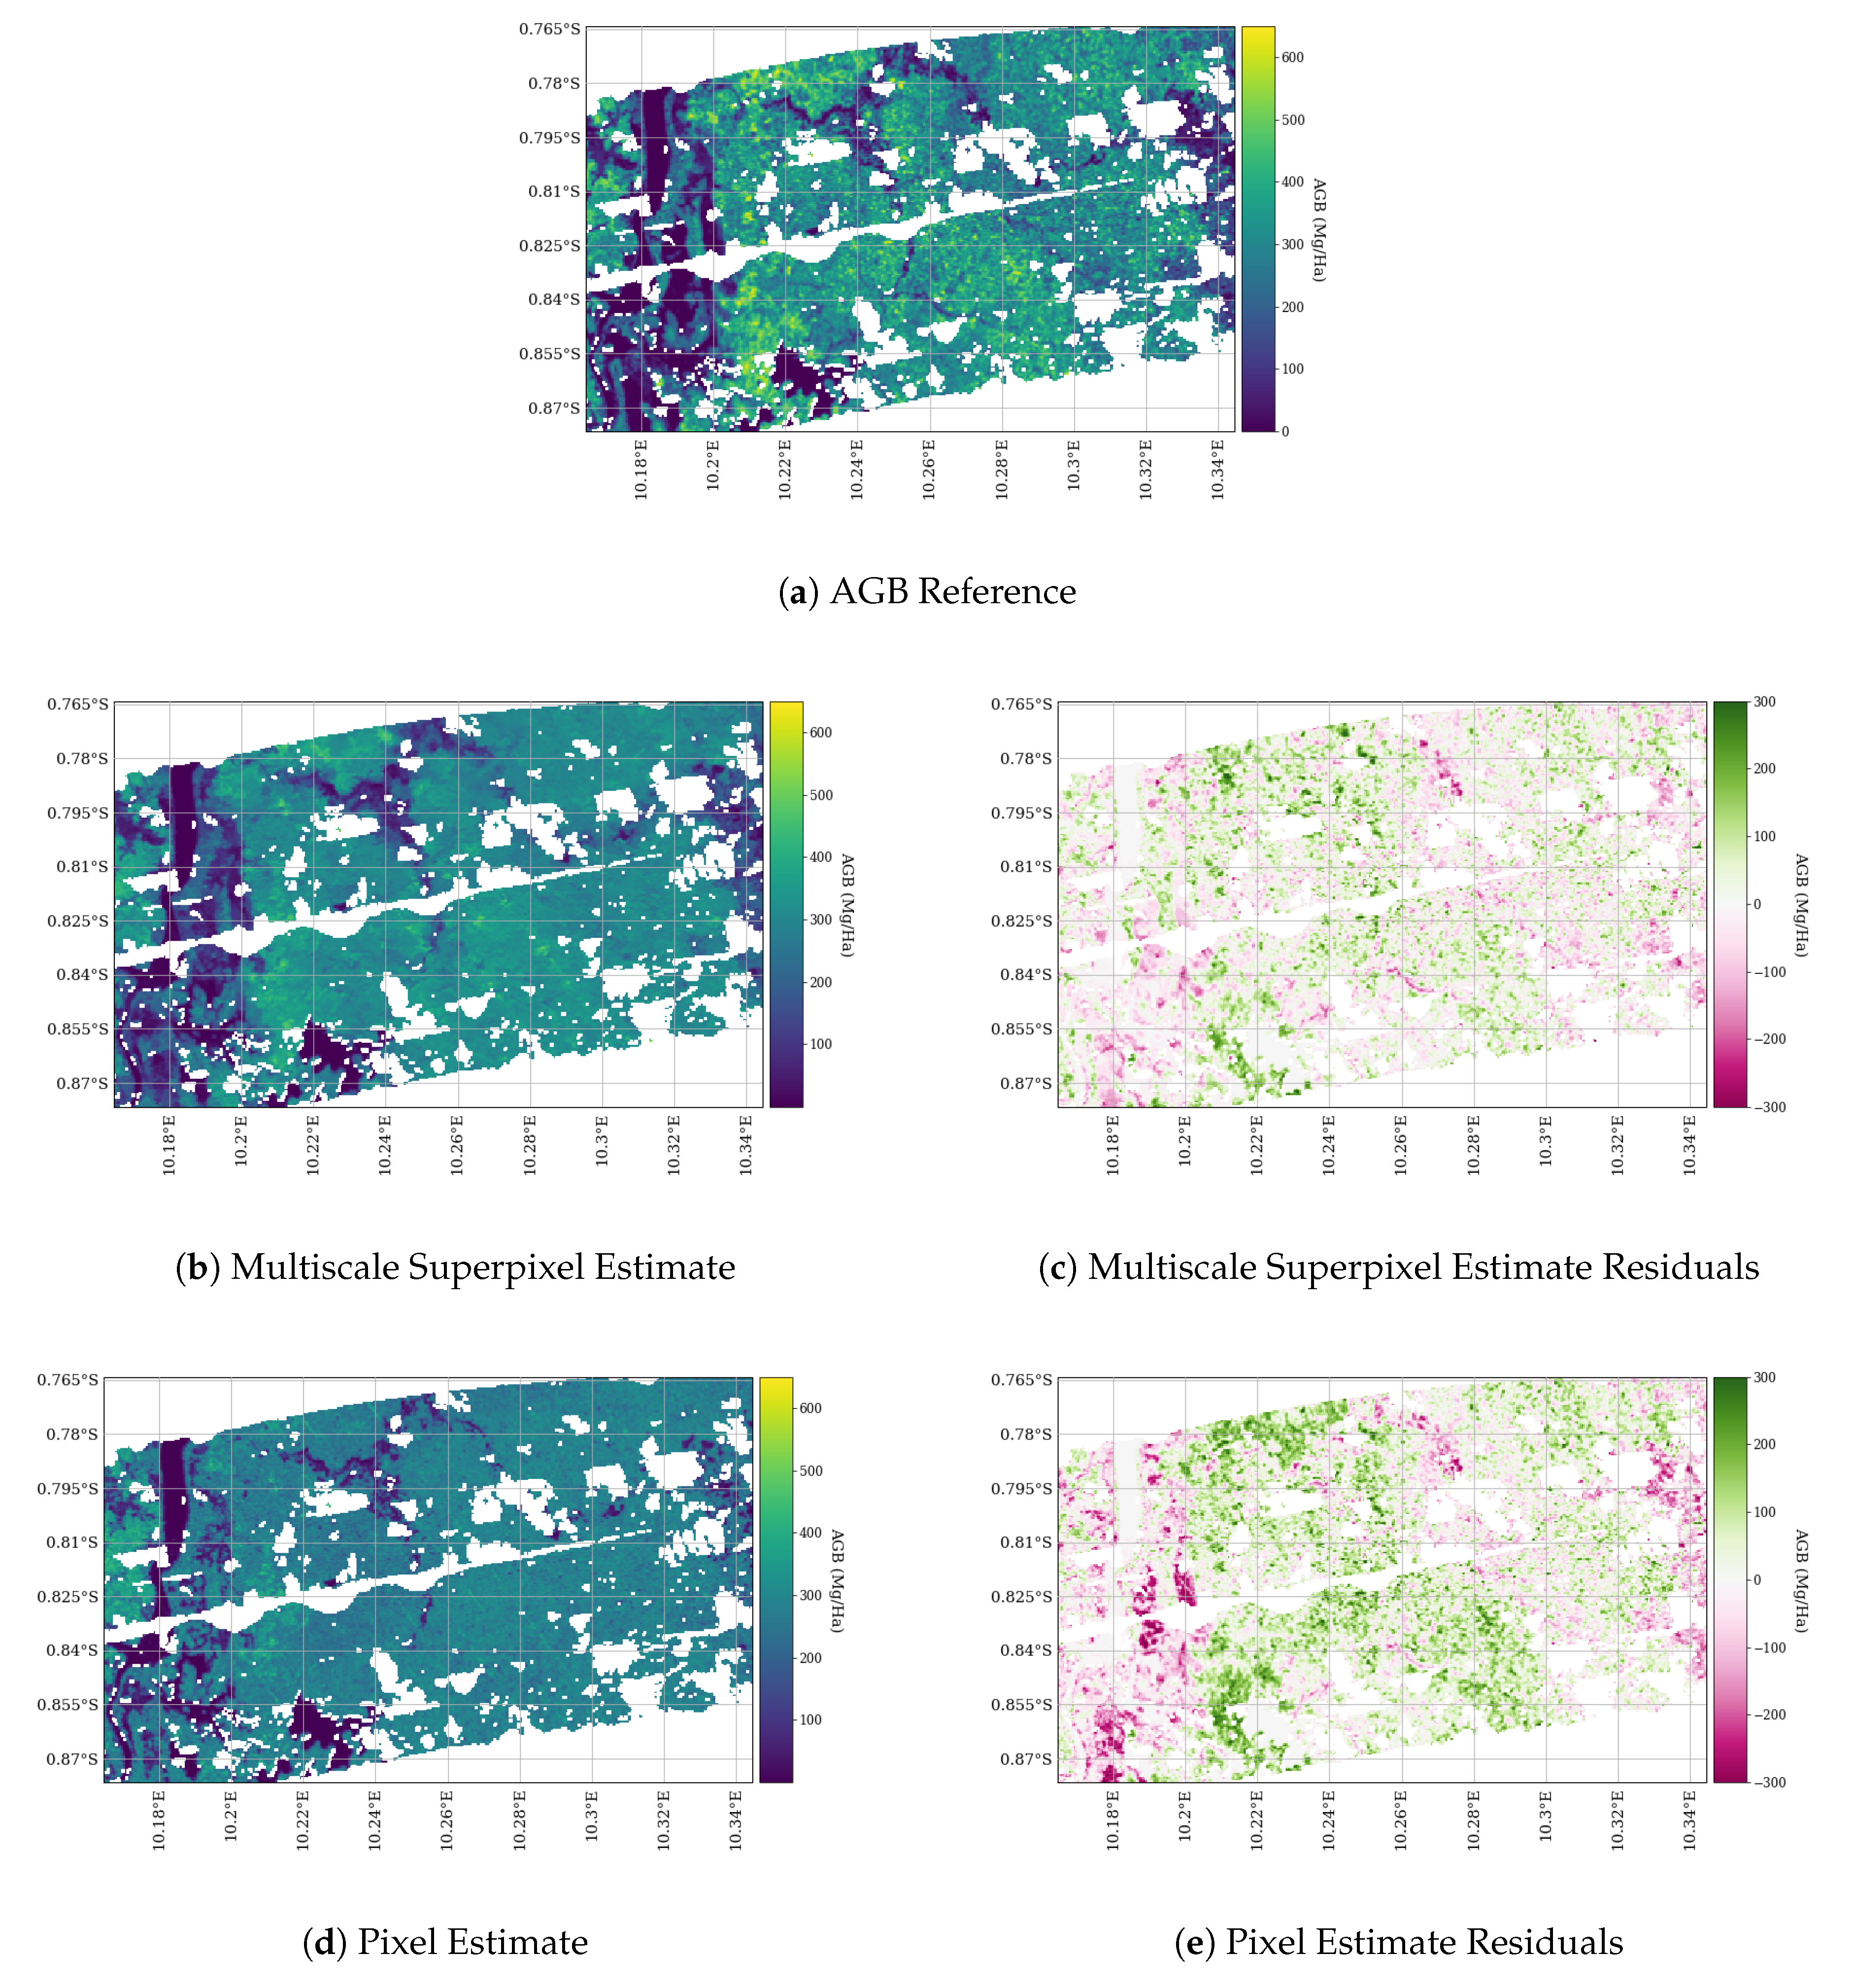
We visually compare the UAVSAR estimates that were made from models using exclusively pixelwise features and models using the additional three superpixel-derived features in subsets over Mondah (Figure 10), Lope (Figure 11), and Ogooue (Figure 12). Visually, the results are more accurate using all of the superpixel features than those using just pixelwise features. However, the final estimates from the models using the superpixel-derived features still appear to be smoother than the reference AGB due to the spatial averaging used to generate such features. As in Section 4.2.1, we inspect the mean RMSE from 100 models trained on data generated using the noise model from Equation (1) for fixed σ in [ 0 , 200 ] to compare models trained with just pixelwise data with those trained with all of the superpixel-derived features. This comparison is found in the second row of Figure 9. As expected, the RMSE increases with σ for both cases, but the models utilizing all the superpixel features consistently outperform those models that use only pixelwise data across the noise scenarios considered.

4.3. Inspecting Model Importances

We can inspect the feature importance of the RF using the method from [70]. Because our approach is non-parametric and not physically derived, looking at feature importances provides insight into this “black-box” machine learning approach. Roughly speaking, the most important features are those that when removed from the model input result in the highest decrease in estimation accuracy evaluated with respect to our training data. The feature importances are encoded in a vector of length that is equal to the number of inputs whose entries sum to 1 and whose relative value represents the corresponding feature’s importance. In Table 6, we show the feature importances of a model trained on areas having AGB above 100 Mg/ha while using all of the possible superpixel-derived features. We label superpixel scales as 1, 2, 3 according to the minimum size 5, 25, 50 pixels used in our segmentation. We highlight that HH coherence is the most important feature at Mondah when using PALSAR-2 data, which is where we noticed the high Spearman correlation between AGB and coherence in Figure 8. Indeed, a coherence product at a particular scale appears in the top three features for all sites and sensors, except Lope imaged with UAVSAR; Lope had the largest fraction of high biomass and the lowest coefficient of variation with respect to biomass of the three sites considered and these could contribute to the fact that coherence was less useful there. We see that the polarization ratio (HH/HV) also appears as an important feature for numerous sites. This feature roughly represents the ratio of non-volumetric to volumetric scattering in canopy areas [48] and it can be used to distinguish dense forest and sparser vegetation structures.

5. Conclusions and Future Work

We introduced a regional above ground biomass (AGB) estimation framework leveraging sparse lidar training data and utilizing InSAR coherence and multiscale superpixels. We evaluated this framework over dense tropical forests in Gabon in order to demonstrate the efficacy of this approach for high AGB mapping while using NISAR-like data.
If we are able to partition our study area into low and high AGB areas, our regional AGB estimation methodology was able to meet NISAR RMSE requirement over low AGB areas in Lope and Mondah and fell slightly short of the requirement in Ogooue. We note that all of our AGB maps are at finer spatial resolutions than NISAR specifies. Although we could have more easily met the NISAR requirements using 1 ha resolution, we did not to pursue this here, because our multiscale superpixel approach would likely be superfluous on lower spatial resolution products, and our training and validation sets would be significantly reduced in size. Our proposed approach was partially able to overcome model saturation in the high AGB areas, particularly at Mondah while using both PALSAR-2 and UAVSAR, even at this higher resolution.
When we did not partition our study area into low and high AGB areas, the nRMSE increased, and in such cases was bounded by 60%. Additionally, the AGB maps no longer met the NISAR requirements in low AGB areas. We highlight that our AGB estimates all had low bias over the tropical sites providing reasonable estimates of the aggregate regional stock. We also note that Ogooue and Lope are predominantly high AGB areas, so our methodology might be suitable for AGB mapping in tropical forests with high AGB. We conjecture that including additional high quality image products, such as Sentinel-2, may allow our proposed estimation framework to better distinguish between high and low AGB areas during model training.
We also showed how the addition of InSAR coherence and multiscale features can significantly improve our AGB estimates. With PALSAR-2 InSAR coherence, the RMSE was reduced by over 8 Mg/ha (over 8% increase in nRMSE) over Mondah with both sensors. We observed improvements for all of our sites and sensors though none as significantly. Because PALSAR-2 InSAR coherence resembles what will be globally available with NISAR, the integration of such products for regional AGB retrieval represents a promising opportunity and will be investigated further. In future work, we hope to apply our framework to larger areas while using the GEDI mission data to calibrate our regional model.

Author Contributions

C.M., M.S., L.D., and C.A.S. helped develop the methodology/software, perform the analysis, and write the initial draft of the paper. M.S. and L.D. conceptualized the entire project and acquired funding. M.D. helped with the writing, analysis, the software related to segmentation, and UAVSAR processing. T.-H.L. helped with the analysis, ALOS-2/PALSAR-2 InSAR processing and radiometric terrain correction for both sensors. L.F. helped guide the project and significantly improved the writing and impact. G.M. curated the data used here and helped guide the project. J.A. made the LVIS-derived reference maps and assisted with the writing. All authors have read and agreed to the published version of the manuscript.

Funding

This study was primarily funded through NASA’s Carbon Monitoring System (CMS, grant 15-CMS15-0055). Marc Simard was also funded by NASA Terrestrial and Ecology Program and a NISAR Science Team grant.

Acknowledgments

The research was carried out at the Jet Propulsion Laboratory, California Institute of Technology, under a contract with the National Aeronautics and Space Administration. ©2020. California Institute of Technology. Government sponsorship acknowledged. We are grateful to the Agence Spatiale Gabonais d’Etudes et d’Observations Spatiales (AGEOS) for coordinating and overseeing the AfriSAR campaign making these Lidar-SAR analyses possible. We are grateful for JAXA’s permission to use of ALOS-2/PALSAR-2 imagery over the tropical sites for this research purpose. We appreciate the helpful conversations with Creck Dassi, Nathan Thomas, and Daniel Jensen.

Conflicts of Interest

The authors declare no conflict of interest.

Abbreviations

The following abbreviations are used in this manuscript:
AGBAbove Ground Biomass
ALOS-2Advanced Land Observing Satellite-2
GEDIGlobal Ecological Dynamics Investigation
GLASGeoscience Laser Altimeter System
ICESat-1/-2Ice, Cloud, and land Elevation Satellite-1/-2
NISARNASA-ISRO Synthetic Aperture Radar
PALSAR-2Phased Array type L-band Synthetic Aperture Radar 2
RMSERoot Mean Squared Error
RTCRadiometric Terrain Correction
SARSynthetic Aperture Radar
TV DenoisingTotal Variation Denoising
UAVSARUninhabited Aerial Vehicle Synthetic Aperture Radar

References

  1. Eggleston, S.; Buendia, L.; Miwa, K.; Ngara, T.; Tanabe, K. 2006 IPCC Guidelines for National Greenhouse Gas Inventories; Institute for Global Environmental Strategies: Hayama, Japan, 2006; Volume 5. [Google Scholar]
  2. Kumar, L.; Mutanga, O. Remote Sensing of Above-Ground Biomass. Remote Sens. 2017, 9, 935. [Google Scholar] [CrossRef] [Green Version]
  3. Le Toan, T.; Quegan, S.; Davidson, M.W.J.; Balzter, H.; Paillou, P.; Papathanassiou, K.; Plummer, S.; Rocca, F.; Saatchi, S.; Shugart, H.; et al. The Biomass Mission: Mapping Global Forest Biomass to Better Understand the Terrestrial Carbon Cycle. Remote Sens. Environ. 2011, 115, 2850–2860. [Google Scholar] [CrossRef] [Green Version]
  4. Zolkos, S.; Goetz, S.; Dubayah, R. A Meta-Analysis of Terrestrial Aboveground Biomass Estimation using Lidar Remote Sensing. Remote Sens. Environ. 2013, 128, 289–298. [Google Scholar] [CrossRef]
  5. Sun, G.; Ranson, K.J.; Guo, Z.; Zhang, Z.; Montesano, P.; Kimes, D. Forest Biomass Mapping from Lidar and Radar Synergies. Remote Sens. Environ. 2011, 115, 2906–2916. [Google Scholar] [CrossRef] [Green Version]
  6. NISAR Science Team. NASA-ISRO SAR Mission Science Users Handbook. 2019. Available online: https://nisar.jpl.nasa.gov/files/nisar/NISAR_Science_Users_Handbook.pdf. (accessed on 1 January 2020).
  7. Sinha, S.; Jeganathan, C.; Sharma, L.K.; Nathawat, M.S. A Review of Radar Remote Sensing for Biomass Estimation. Int. J. Environ. Sci. Technol. 2015, 12, 1779–1792. [Google Scholar] [CrossRef] [Green Version]
  8. Woodhouse, I.H. Introduction to Microwave Remote Sensing; CRC Press: Boca Raton, FL, USA, 2017. [Google Scholar]
  9. Bouvet, A.; Mermoz, S.; Le Toan, T.; Villard, L.; Mathieu, R.; Naidoo, L.; Asner, G.P. An Above-Ground Biomass Map of African Savannahs and Woodlands at 25 m Resolution Derived from ALOS PALSAR. Remote Sens. Environ. 2018, 206, 156–173. [Google Scholar] [CrossRef]
  10. Treuhaft, R.N.; Moghaddam, M.; Van Zyl, J.J. Vegetation Characteristics and Underlying Topography from Interferometric Radar. Radio Sci. 1996, 31, 1449–1485. [Google Scholar] [CrossRef]
  11. Denbina, M.; Simard, M. Kapok: An Open Source Python Library for PolInSAR Forest Height Estimation using UAVSAR Data. In Proceedings of the 2017 IEEE International Geoscience and Remote Sensing Symposium (IGARSS), Fort Worth, TX, USA, 23–28 July 2017; pp. 4314–4317. [Google Scholar]
  12. Lavalle, M.; Simard, M.; Hensley, S. A Temporal Decorrelation Model for Polarimetric Radar Interferometers. IEEE Trans. Geosci. Remote Sens. 2011, 50, 2880–2888. [Google Scholar] [CrossRef]
  13. Lavalle, M.; Hensley, S. Extraction of Structural and Dynamic Properties of Forests from Polarimetric-Interferometric SAR Data Affected by Temporal Decorrelation. IEEE Trans. Geosci. Remote Sens. 2015, 53, 4752–4767. [Google Scholar] [CrossRef]
  14. El Hajj, M.; Baghdadi, N.; Labriére, N.; Bailly, J.S.; Villard, L. Mapping of Aboveground Biomass in Gabon. Comptes Rendus Geosci. 2019, 351, 321–331. [Google Scholar] [CrossRef]
  15. Pinto, N.; Simard, M.; Dubayah, R. Using InSAR Coherence to Map Stand Age in a Boreal Forest. Remote Sens. 2013, 5, 42–56. [Google Scholar] [CrossRef] [Green Version]
  16. Simard, M.; Hensley, S.; Lavalle, M.; Dubayah, R.; Pinto, N.; Hofton, M. An Empirical Assessment of Temporal Decorrelation using the Uninhabited Aerial Vehicle Synthetic Aperture Radar over Forested Landscapes. Remote Sens. 2012, 4, 975–986. [Google Scholar] [CrossRef] [Green Version]
  17. Lei, Y.; Siqueira, P.; Torbick, N.; Ducey, M.; Chowdhury, D.; Salas, W. Generation of Large-Scale Moderate-Resolution Forest Height Mosaic With Spaceborne Repeat-Pass SAR Interferometry and Lidar. IEEE Trans. Geosci. Remote Sens. 2018, 57, 770–787. [Google Scholar] [CrossRef]
  18. Simard, M.; Denbina, M. An Assessment of Temporal Decorrelation Compensation Methods for Forest Canopy Height Estimation using Airborne L-band Same-day Repeat-Pass Polarimetric SAR Interferometry. IEEE J. Sel. Top. Appl. Earth Obs. Remote Sens. 2017, 11, 95–111. [Google Scholar] [CrossRef]
  19. Simard, M.; Pinto, N.; Fisher, J.B.; Baccini, A. Mapping Forest Canopy Height Globally with Spaceborne Lidar. J. Geophys. Res. Biogeosci. 2011, 116. [Google Scholar] [CrossRef]
  20. Lefsky, M.A.; Harding, D.J.; Keller, M.; Cohen, W.B.; Carabajal, C.C.; Del Bom Espirito-Santo, F.; Hunter, M.O.; De Oliveira, R., Jr. Estimates of forest canopy height and aboveground biomass using ICESat. Geophys. Res. Lett. 2005, 32. [Google Scholar] [CrossRef] [Green Version]
  21. Saatchi, S.S.; Houghton, R.A.; Dos Santos Alvala, R.C.; Soares, J.V.; Yu, Y. Distribution of Aboveground Live Biomass in the Amazon Basin. Glob. Chang. Biol. 2007, 13, 816–837. [Google Scholar] [CrossRef]
  22. Baccini, A.; Laporte, N.; Goetz, S.J.; Sun, M.; Dong, H. A First Map of Tropical Africa’s Above-Ground Biomass Derived from Satellite Imagery. Environ. Res. Lett. 2008, 3, 045011. [Google Scholar] [CrossRef] [Green Version]
  23. Dubayah, R.; Blair, J.B.; Goetz, S.; Fatoyinbo, L.; Hansen, M.; Healey, S.; Hofton, M.; Hurtt, G.; Kellner, J.; Luthcke, S.; et al. The Global Ecosystem Dynamics Investigation: High-Resolution Laser Ranging of the Earth’s Forests and Topography. Sci. Remote Sens. 2020, 1, 100002. [Google Scholar] [CrossRef]
  24. Dubayah, R.; Goetz, S.; Blair, J.; Fatoyinbo, T.E.; Hansen, M.; Healey, S.; Hofton, M.; Hurtt, G.; Kellner, J.; Luthcke, S.; et al. The Global Ecosystem Dynamics Investigation. AGUFM 2014, 2014, U14A-07. [Google Scholar]
  25. Saarela, S.; Holm, S.; Healey, S.; Andersen, H.E.; Petersson, H.; Prentius, W.; Patterson, P.; Næsset, E.; Gregoire, T.; Ståhl, G. Generalized Hierarchical Model-Based Estimation for Aboveground Biomass Assessment Using GEDI and Landsat Data. Remote Sens. 2018, 10, 1832. [Google Scholar] [CrossRef] [Green Version]
  26. Wang, M.; Sun, R.; Xiao, Z. Estimation of Forest Canopy Height and Aboveground Biomass from Spaceborne LiDAR and Landsat Imageries in Maryland. Remote Sens. 2018, 10, 344. [Google Scholar] [CrossRef] [Green Version]
  27. Qi, W.; Dubayah, R. Combining Tandem-X InSAR and Simulated GEDI Lidar Observations for Forest Structure Mapping. Remote Sens. Environ. 2016, 187, 253–266. [Google Scholar] [CrossRef]
  28. Qi, W.; Lee, S.K.; Hancock, S.; Luthcke, S.; Tang, H.; Armston, J.; Dubayah, R. Improved Forest Height Estimation by Fusion of Simulated GEDI Lidar Data and TanDEM-X InSAR Data. Remote Sens. Environ. 2019, 221, 621–634. [Google Scholar] [CrossRef] [Green Version]
  29. Askne, J.; Fransson, J.; Santoro, M.; Soja, M.; Ulander, L. Model-based Biomass Estimation of a Hemi-boreal Forest from Multitemporal TanDEM-X Acquisitions. Remote Sens. 2013, 5, 5574–5597. [Google Scholar] [CrossRef] [Green Version]
  30. Silva, C.; Duncanson, L.; Hancock, S.; Neuenschwander, A.; Thomas, N.; Hofton, M.; Fatoyinbo, T.; Simard, M.; Marshak, C.; Armston, J.; et al. Fusing GEDI, ICESat-2 and NISAR data for Aboveground Biomass Mapping in Sonoma County, California, USA. AGUFM 2018, 2018, B44E-05. [Google Scholar]
  31. Hansen, M.C.; Potapov, P.V.; Moore, R.; Hancher, M.; Turubanova, S.A.A.; Tyukavina, A.; Thau, D.; Stehman, S.V.; Goetz, S.J.; Loveland, T.R.; et al. High-Resolution Global Maps of 21st Century Forest Cover Change. Science 2013, 342, 850–853. [Google Scholar] [CrossRef] [Green Version]
  32. MacDicken, K. Forest Resources Assessment Working Paper; FAO: Rome, Italy, 2015. [Google Scholar]
  33. Sasaki, N.; Putz, F.E. Critical Need for New Definitions of “Forest” and “Forest Degradation” in Global Climate Change Agreements. Conserv. Lett. 2009, 2, 226–232. [Google Scholar] [CrossRef]
  34. Margono, B.A.; Potapov, P.V.; Turubanova, S.; Stolle, F.; Hansen, M.C. Primary Forest Cover Loss in Indonesia over 2000–2012. Nat. Clim. Chang. 2014, 4, 730. [Google Scholar] [CrossRef]
  35. Armston, J.; Tang, H.; Hancock, S.; Marselis, S.; Duncanson, L.; Hofton, M.; Blair, J.B.; Fatoyinbo, L.; Dubayah, R. AfriSAR: Gridded Aboveground Biomass, Canopy Height and Vertical Profile Metrics from LVIS, Gabon. 2016. Available online: https://doi.org/10.3334/ORNLDAAC/1775 (accessed on 1 January 2020).
  36. Fatoyinbo, L.; Armston, J.; Simard, M.; Saatchi, S.; Lou, Y.; Dubayah, R.; Hensley, S.; Armston, J.; Duncanson, L.; Lavalle, M. The 2016 NASA AfriSAR Campaign: Airborne SAR and Lidar Measurements of Tropical Forest Structure and Biomass in Support of Future Space Missions. Remote. Sens. Environ. 2017. [CrossRef]
  37. Duncanson, L.; Neuenschwander, A.; Hancock, S.; Thomas, N.; Fatoyinbo, T.; Simard, M.; Luthcke, S.; Silva, C.; Armston, J.; Hofton, M.; et al. Understanding Biomass Errors from Simulated GEDI, ICESat-2 and NISAR Data Across Environmental Gradients in Sonoma County, California. Remote. Sens. Environ. submitted.
  38. Simard, M.; Riel, B.V.; Denbina, M.; Hensley, S. Radiometric Correction of Airborne Radar Images over Forested Terrain with Topography. IEEE Trans. Geosci. Remote Sens. 2016, 54, 4488–4500. [Google Scholar] [CrossRef]
  39. Rosen, P.; Hensley, S.; Shaffer, S.; Edelstein, W.; Kim, Y.; Kumar, R.; Misra, T.; Bhan, R.; Satish, R.; Sagi, R. An Update on the NASA-ISRO Dual-frequency DBF SAR (NISAR) Mission. In Proceedings of the 2016 IEEE International Geoscience and Remote Sensing Symposium (IGARSS), Beijing, China, 10–15 July 2016; pp. 2106–2108. [Google Scholar]
  40. UAVSAR Team. UAVSAR Data Search. 2020. Available online: https://uavsar.jpl.nasa.gov/cgi-bin/data.pl (accessed on 1 February 2020).
  41. Werner, C.; Wegmüller, U.; Strozzi, T.; Wiesmann, A. Gamma SAR and Interferometric Processing Software. In Proceedings of the ERS-ENVISAT Symposium, Gothenburg, Sweden, 16–20 October 2000; Volume 1620, p. 1620. [Google Scholar]
  42. Rudin, L.I.; Osher, S.; Fatemi, E. Nonlinear Total Variation Based Noise Removal Algorithms. Phys. D Nonlinear Phenom. 1992, 60, 259–268. [Google Scholar] [CrossRef]
  43. Deledalle, C.A.; Denis, L.; Tabti, S.; Tupin, F. MuLoG, or How to Apply Gaussian Denoisers to Multi-Channel SAR Speckle Reduction? IEEE Trans. Image Process. 2017, 26, 4389–4403. [Google Scholar] [CrossRef] [Green Version]
  44. Getreuer, P. Rudin-Osher-Fatemi Total Variation Denoising using Split-Bregman. Image Process. OnLine 2012, 2, 74–95. [Google Scholar] [CrossRef]
  45. Donoho, D.L.; Johnstone, J.M. Ideal spatial Adaptation by Wavelet Shrinkage. Biometrika 1994, 81, 425–455. [Google Scholar] [CrossRef]
  46. Chambolle, A. An Algorithm for Total Variation Minimization and Applications. J. Math. Imaging Vis. 2004, 20, 89–97. [Google Scholar]
  47. CEOS. A Layman’s Interpretation Guide to L-band and C-band Synthetic Aperture Radar Data. 2018. Available online: http://ceos.org/document_management/SEO/DataCube/Laymans_SAR_Interpretation_Guide_2.0.pdf (accessed on 1 June 2020).
  48. Freeman, A.; Durden, S.L. A Three-Component Scattering Model for Polarimetric SAR Data. IEEE Trans. Geosci. Remote Sens. 1998, 36, 963–973. [Google Scholar] [CrossRef] [Green Version]
  49. Rosen, P.A.; Hensley, S.; Joughin, I.R.; Li, F.K.; Madsen, S.N.; Rodriguez, E.; Goldstein, R.M. Synthetic Aperture Radar Interferometry. Proc. IEEE 2000, 88, 333–382. [Google Scholar] [CrossRef]
  50. Tsuchiya, M.; Fujisawa, T.; Miura, S. ALOS Mission Operation 2008 in JAXA. In Proceedings of the SpaceOps 2008 Conference, Heidelberg, Germany, 12–16 May 2008; p. 3317. [Google Scholar]
  51. Rosen, P.; Gurrola, E.; Agram, P.S.; Sacco, G.F.; Lavalle, M. The InSAR Scientific Computing Environment (ISCE): A Python Framework for Earth Science. In AGU Fall Meeting Abstracts; AGU: Washington, DC, USA, 2015. [Google Scholar]
  52. Farr, T.G.; Rosen, P.A.; Caro, E.; Crippen, R.; Duren, R.; Hensley, S.; Kobrick, M.; Paller, M.; Rodriguez, E.; Roth, L.; et al. The Shuttle Radar Topography Mission. Rev. Geophys. 2007, 45. [Google Scholar] [CrossRef] [Green Version]
  53. Denbina, M.; Simard, M.; Hawkins, B. Forest Height Estimation Using Multibaseline PolInSAR and Sparse Lidar Data Fusion. IEEE J. Sel. Top. Appl. Earth Obs. Remote Sens. 2018, 11, 3415–3433. [Google Scholar] [CrossRef]
  54. Meinel, G.; Neubert, M. A Comparison of Segmentation Programs for High Resolution Remote Sensing Data. Int. Arch. Photogramm. Remote Sens. 2004, 35, 1097–1105. [Google Scholar]
  55. Clewley, D.; Bunting, P.; Shepherd, J.; Gillingham, S.; Flood, N.; Dymond, J.; Lucas, R.; Armston, J.; Moghaddam, M. A Python-based Open Source System for Geographic Object-based Image Analysis (GEOBIA) Utilizing Raster Attribute Tables. Remote Sens. 2014, 6, 6111–6135. [Google Scholar] [CrossRef] [Green Version]
  56. Ren, X.; Malik, J. Learning a Classification Model for Segmentation. In Proceedings of the Ninth IEEE International Conference on Computer Vision, Nice, France, 13–16 October 2003; pp. 10–17. [Google Scholar]
  57. Szeliski, R. Computer Vision: Algorithms and Applications; Springer Science & Business Media: Berlin/Heidelberg, Germany, 2010. [Google Scholar]
  58. Zhou, L.; Cao, G.; Li, Y.; Shang, Y. Change Detection Based on Conditional Random Field With Region Connection Constraints in High-Resolution Remote Sensing Images. IEEE J. Sel. Top. Appl. Earth Obs. Remote Sens. 2016, 9, 3478–3488. [Google Scholar] [CrossRef]
  59. Thompson, D.R.; Mandrake, L.; Gilmore, M.S.; Castano, R. Superpixel Endmember Detection. IEEE Trans. Geosci. Remote Sens. 2010, 48, 4023–4033. [Google Scholar] [CrossRef]
  60. Marshak, C.; Simard, M.; Denbina, M. Monitoring Forest Loss in ALOS/PALSAR Time-Series with Superpixels. Remote Sens. 2019, 11, 556. [Google Scholar] [CrossRef] [Green Version]
  61. Huang, X.; Yang, W.; Xia, G.; Liao, M. Superpixel-based Change Detection in High Resolution SAR Images using region Covariance Features. In Proceedings of the 8th International Workshop on the Analysis of Multitemporal Remote Sensing Images, Annecy, France, 22–24 July 2015; pp. 1–4. [Google Scholar] [CrossRef]
  62. Felzenszwalb, P.F.; Huttenlocher, D.P. Efficient Graph-based Image Segmentation. Int. J. Comput. Vis. 2004, 59, 167–181. [Google Scholar] [CrossRef]
  63. Achanta, R.; Shaji, A.; Smith, K.; Lucchi, A.; Fua, P.; Süsstrunk, S. SLIC Superpixels Compared to State-of-the-Art Superpixel Methods. IEEE Trans. Pattern Anal. Mach. Intell. 2012, 34, 2274–2282. [Google Scholar] [CrossRef] [Green Version]
  64. Bonev, B.; Yuille, A.L. Bottom-Up Processing in Complex Scenes: A Unifying Perspective on Segmentation, Fixation Saliency, Candidate Regions, Base-Detail Decomposition, and Image Enhancement. In Recent Progress in Brain and Cognitive Engineering; Springer: Berlin/Heidelberg, Germany, 2015; pp. 109–130. [Google Scholar]
  65. Adelson, E.H.; Anderson, C.H.; Bergen, J.R.; Burt, P.J.; Ogden, J.M. Pyramid Methods in Image Processing. RCA Eng. 1984, 29, 33–41. [Google Scholar]
  66. Chen, L.C.; Zhu, Y.; Papandreou, G.; Schroff, F.; Adam, H. Encoder-Decoder with Atrous Separable Convolution for Semantic Image Segmentation. In Proceedings of the European Conference on Computer Vision, Munich, Germany, 4–8 September 2018; pp. 801–818. [Google Scholar]
  67. Saatchi, S.; McDonald, K.C. Coherent Effects in Microwave Backscattering Models for Forest Canopies. IEEE Trans. Geosci. Remote Sens. 1997, 35, 1032–1044. [Google Scholar] [CrossRef]
  68. Huang, W.; Swatantran, A.; Duncanson, L.; Johnson, K.; Watkinson, D.; Dolan, K.; O’Neil-Dunne, J.; Hurtt, G.; Dubayah, R. County-Scale Biomass Map Comparison: A Case Study for Sonoma, California. Carbon Manag. 2017, 8, 417–434. [Google Scholar] [CrossRef]
  69. Neumann, M.; Saatchi, S.S.; Ulander, L.M.H.; Fransson, J.E.S. Assessing Performance of L-and P-band Polarimetric Interferometric SAR Data in Estimating Boreal Forest Above-Ground Biomass. IEEE Trans. Geosci. Remote Sens. 2012, 50, 714–726. [Google Scholar] [CrossRef]
  70. Breiman, L. Random forests. Mach. Learn. 2001, 45, 5–32. [Google Scholar] [CrossRef] [Green Version]
  71. Pedregosa, F.; Varoquaux, G.; Gramfort, A.; Michel, V.; Thirion, B.; Grisel, O.; Blondel, M.; Prettenhofer, P.; Weiss, R.; Dubourg, V.; et al. Scikit-learn: Machine Learning in Python. J. Mach. Learn. Res. 2011, 12, 2825–2830. [Google Scholar]
  72. Hancock, S.; Armston, J.; Hofton, M.; Sun, X.; Tang, H.; Duncanson, L.I.; Kellner, J.R.; Dubayah, R. The GEDI Simulator: A Large-Footprint Waveform Lidar Simulator for Calibration and Validation of Spaceborne Missions. Earth Space Sci. 2019, 6, 294–310. [Google Scholar] [CrossRef]
  73. Silva, C.A.; Saatchi, S.; Garcia, M.; Labriere, N.; Klauberg, C.; Ferraz, A.; Meyer, V.; Jeffery, K.J.; Abernethy, K.; White, L.; et al. Comparison of Small-and Large-footprint Lidar Characterization of Tropical Forest Aboveground Structure and Biomass: A Case Study from Central Gabon. IEEE J. Sel. Top. Appl. Earth Obs. Remote Sens. 2018, 11, 3512–3526. [Google Scholar] [CrossRef] [Green Version]
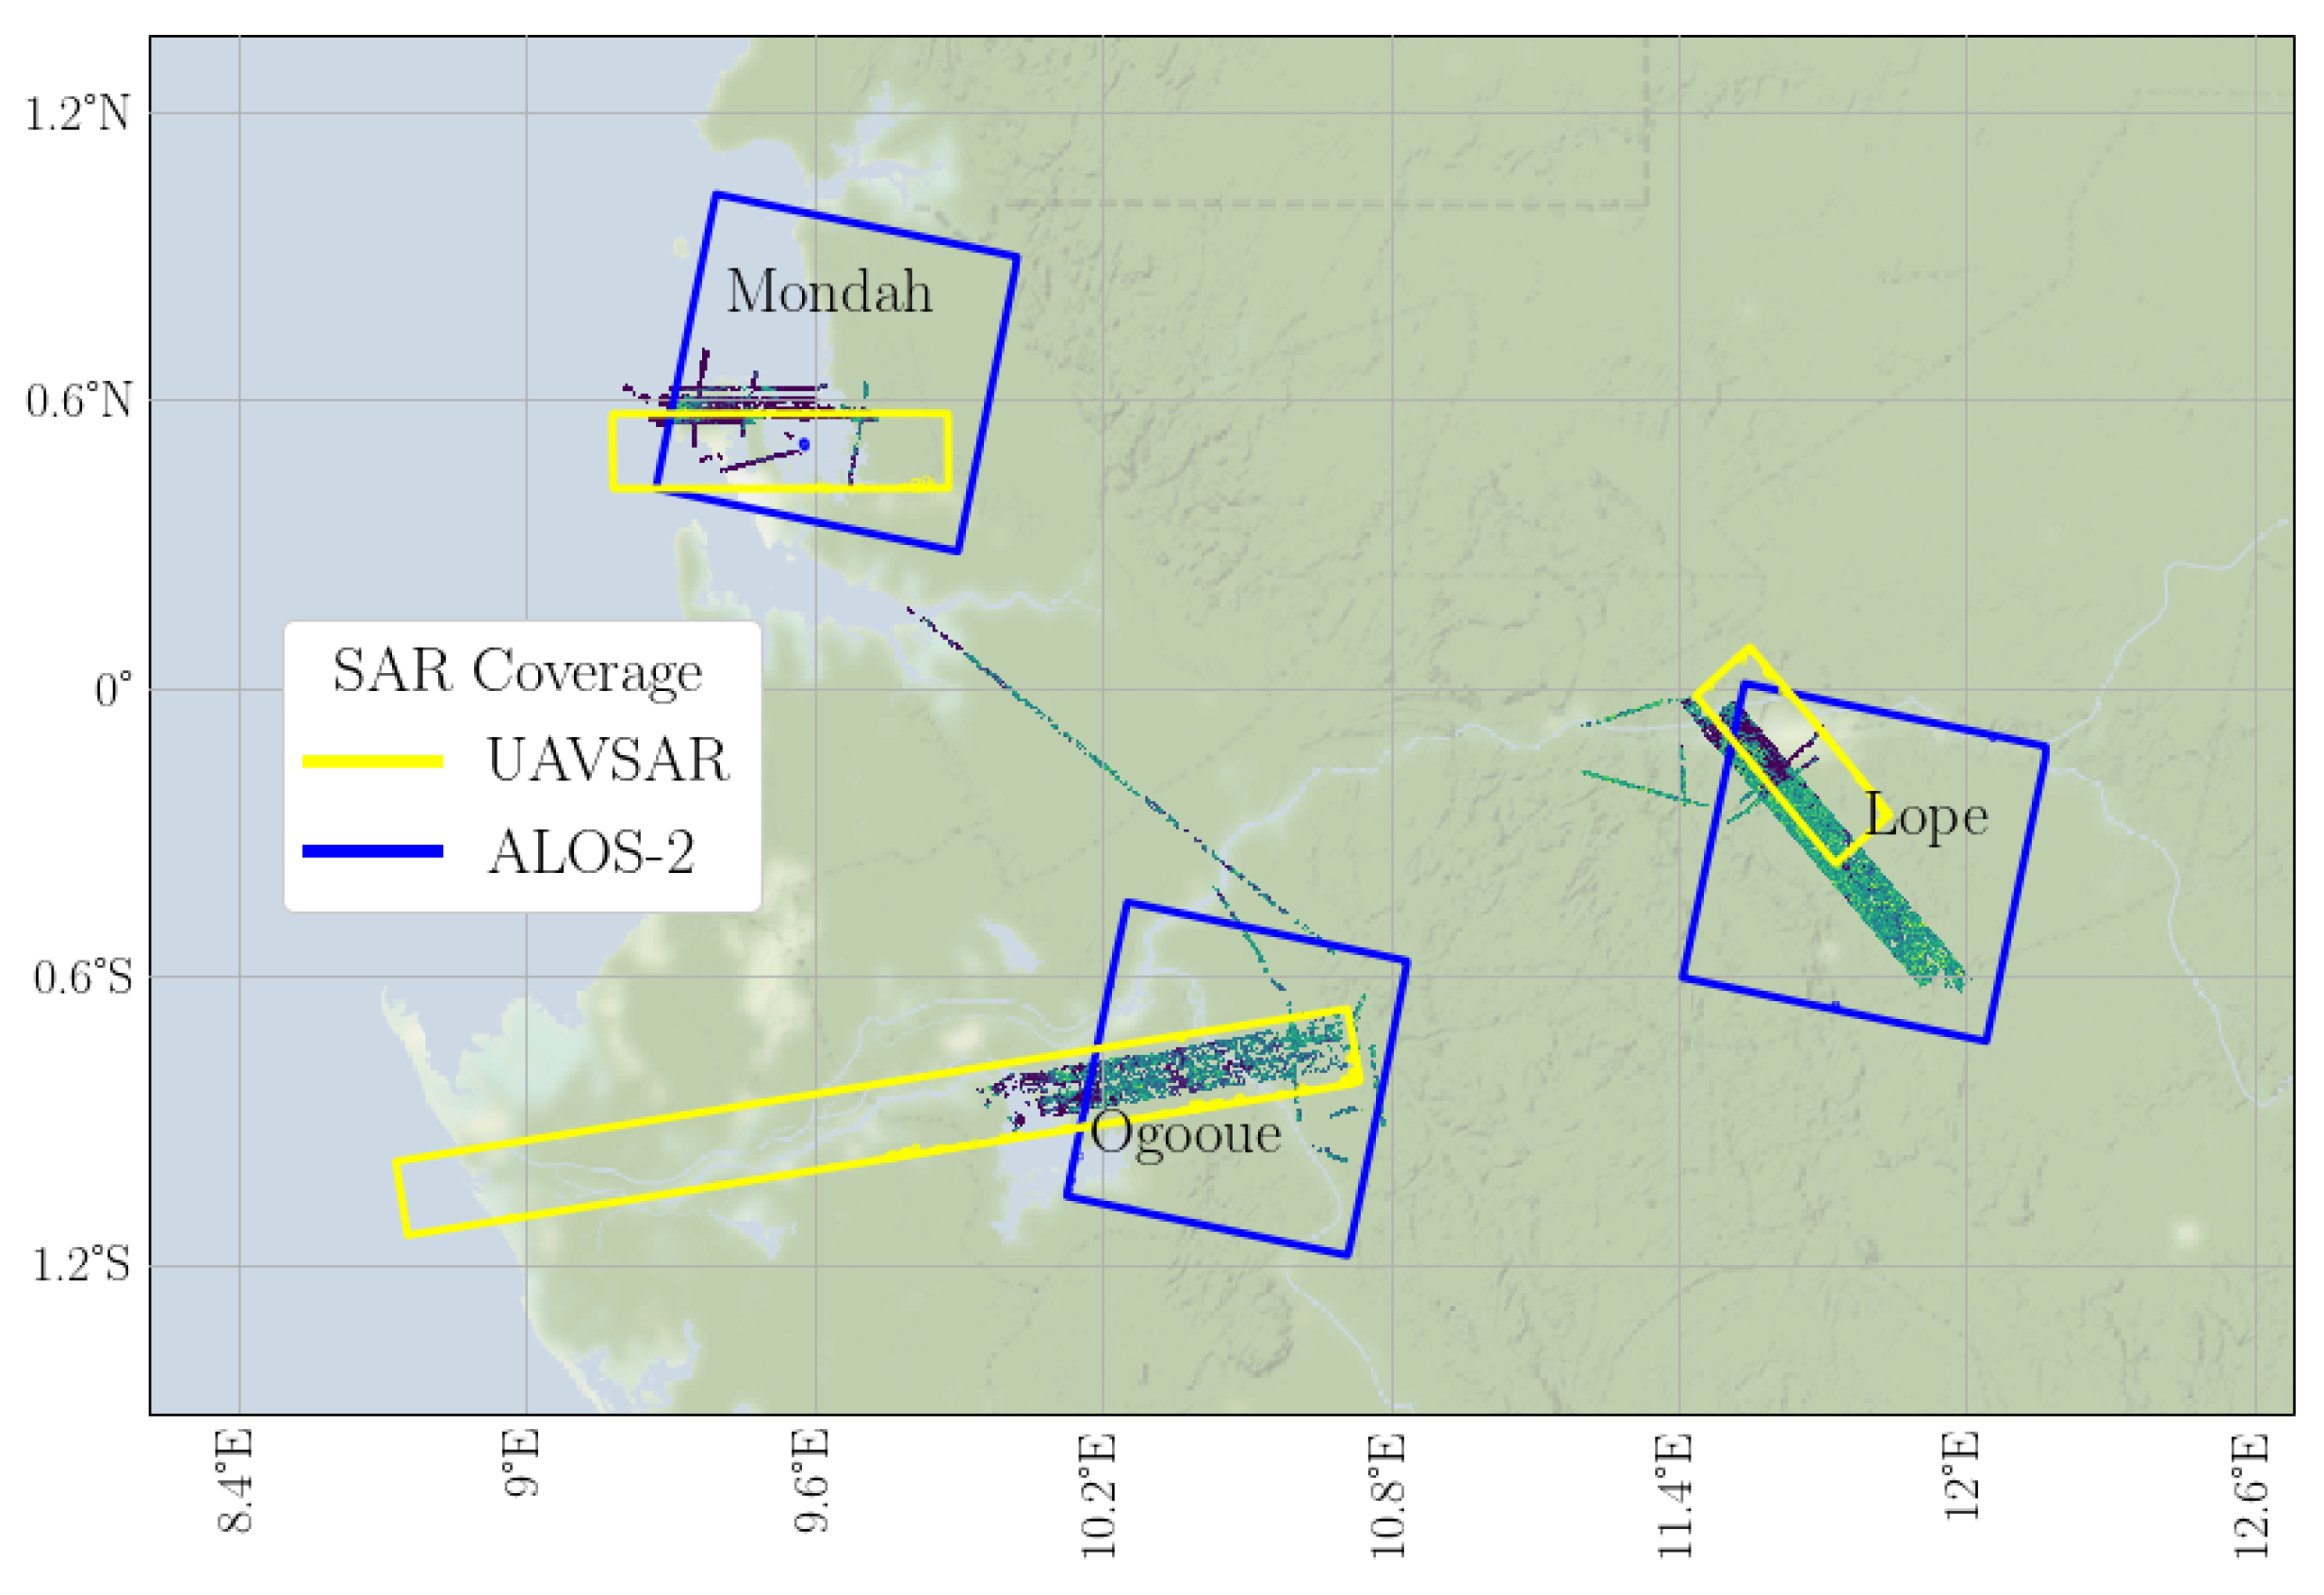
Figure 1. The AfriSAR above ground biomass (AGB) raster data and related SAR coverage at three sites in Gabon. Blue outlines the ALOS-2/PALSAR-2 stripmap tile extents and yellow outlines the UAVSAR backscatter flight lines.
Remotesensing 12 02048 g001
Figure 2. A summary of our methodology for AGB estimation. Blue indicates an input product, red indicates an intermediate product or model, and yellow indicates the final AGB estimates. The dashed line indicates that the sparse lidar data is only used for training the random forest model.
Remotesensing 12 02048 g002
Figure 3. Top row: PALSAR-2 HV backscatter image over a subset of Mondah that (a) has been RTC-ed and (b) additionally despeckled with total variation. Bottom row: (c) the RGB product used for segmentation and estimation. Red is HH, green HV, and blue the polarization ratio HH/HV. All of the polarizations are in linear γ 0 ; each RGB channel is scaled to [ 0 , 1 ] .
Remotesensing 12 02048 g003
Figure 4. A multiscale superpixel pyramid for feature extraction.
Remotesensing 12 02048 g004
Figure 5. PALSAR-2 HV backscatter and HH coherence features (top and bottom row, respectively) derived from Felzenszwalb and Huttenlocher graph-based superpixels with increasing minimum size. From left to right, (a) original pixel data projected to biomass frame (50 m resolution), (b) mean backscatter with minimum segment size 5 pixels (1.25 ha), (c) mean backscatter with minimum segment size 25 pixels (6.25 ha), and (d) mean backscatter with minimum segment size 50 pixels (12.5 ha). Figures (eh), are the analogous images derived using the mean HH coherence within superpixels. The maps are with respect to the reference AGB frame. The white areas in the imagery indicate where no data was collected by the lidar.
Remotesensing 12 02048 g005
Figure 6. The train/validation framework to simulate Global Ecosystem Dynamics Investigation (GEDI) spatial sampling from the lidar-derived AGB reference map.
Remotesensing 12 02048 g006
Figure 7. The results of training and validating our methodology on the full area. Left column is UAVSAR and right column is PALSAR-2 at 50 m resolution.
Remotesensing 12 02048 g007
Figure 8. Coherence (PALSAR-2) and AGB at Mondah using superpixels with size at least 6.25 ha (25 pixels) and at least 30% of of pixels with canopy. Spearman ρ shown.
Remotesensing 12 02048 g008
Figure 9. Mean RMSE of 100 models trained on different realizations of the additive noise model of Equation (1) with fixed σ in [ 0 , 200 ] over the three UAVSAR sites. The top row are the comparisons between AGB estimates using and excluding InSAR coherence; the bottom row is a comparison of models using the multiscale superpixel features with those models using only pixel-derived features.
Remotesensing 12 02048 g009
Figure 10. Comparing the AGB reference map shown in (a) with those derived from multiscale superpixels shown in (b) and with those derived from pixels shown in (c) on a subset of Mondah. Residuals are shown in bottom row. Model is trained on and applied to full AGB range. (d) Multiscale Superpixel Estimate Residuals; (e) Pixel Estimate Residuals.
Remotesensing 12 02048 g010
Figure 11. Comparison of the AGB reference map (top row) with those derived from multiscale superpixels (second row) and with those derived from pixels (bottom row) on a subset of Lope. Model is trained on and applied to full AGB range.
Remotesensing 12 02048 g011
Figure 12. Comparing the AGB reference map (top row) with those derived from multiscale superpixels (second row) and with those derived from pixels (bottom row) on a subset of Ogooue. Model is trained on and applied to full AGB range.
Remotesensing 12 02048 g012
Table 1. Below, descriptive statistics of the LVIS-derived reference AGB in the study areas with respect to sensor coverage area. The μ AGB , μ AGB < 100 , and μ AGB > 100 are the mean AGB, the mean AGB for areas with AGB below 100 Mg/ha, and the mean AGB for areas with AGB above 100 Mg/ha, respectively. Similarly defined are σ AGB , σ AGB < 100 , and σ AGB > 100 for standard deviations over our study areas. The last column records the ratio of high AGB (above 100 Mg/ha) area to the total forest in the study area.
μ AGB σ AGB σ AGB μ AGB μ AGB > 100 σ AGB > 100 μ AGB < 100 σ AGB < 100 Area AGB < 100 Area forest
SensorSite(Mg/ha)(Mg/ha)(%)(Mg/ha)(Mg/ha)(Mg/ha)(Mg/ha)(%)
PALSAR-2Lope380.10130.4234.31399.20104.0629.6929.895.17
Mondah137.06146.97107.23271.63115.5924.7727.5154.51
Ogooue286.95123.5143.04310.50102.0645.8831.738.90
UAVSARLope332.55159.5147.97382.99107.7027.8629.3314.20
Mondah125.03142.58114.04271.55110.1623.2027.1359.00
Ogooue256.37137.9753.82302.04103.5537.5431.3717.27
Table 2. Below, AfriSAR sites with various SAR metadata and image statistics associated over the coverage area.
Coherence First DateBackscatter Image DateTemporal BaselineAreaSRTM Normal AngleHVCoherence
SensorSite (ha) μ deg ( σ deg ) μ dB ( σ dB ) μ ( σ )
PALSAR-2Lope2015-03-122015-03-1214 days7,5219.1 (6.0)−12.4 (3.5)0.34 (0.14)
Mondah2015-04-142015-04-1414 days24793.3 (3.2)−13.8 (7.9)0.32 (0.18)
Ogooue2015-06-042015-06-1814 days57356.2 (5.2)−12.8 (4.1)0.59 (0.11)
UAVSARLope2016-02-252016-03-082 h21507.5 (5.5)−13.6 (5.8)0.86 (0.1)
Mondah2016-03-062016-03-022 h11703.2 (3.2)−15.3 (10.4)0.73 (0.35)
Ogooue2016-02-272016-02-278 days56275.5 (4.5)−13.6 (9.5)0.4 (0.13)
Table 3. Results from our proposed methodology using a high and low AGB mask. Our estimates have 50 m resolution.
Full AGB Range>100 Mg/ha≤100 Mg/ha
RMSEnRMSEBiasRMSEnRMSEBiasRMSEnRMSEBias
Site(Mg/ha)(%)(Mg/ha)(Mg/ha)(%)(Mg/ha)(Mg/ha)(%)(Mg/ha)
PALSAR-2
Lope89.2325.24−0.5394.8423.77−0.6916.40110.840.69
Mondah51.2350.44−0.1785.4531.52−1.8216.03101.710.66
Ogooue86.6530.812.1891.2329.412.4626.0767.06−0.13
UAVSAR
Lope72.4325.41−0.6384.9121.79−0.9411.9090.960.18
Mondah47.6951.000.6283.0330.330.8115.78108.910.53
Ogooue78.8432.69−0.0488.5429.33−0.3322.8780.110.96
Table 4. Below, we use the model with all superpixel features and compare the difference when the model uses backscatter with (“w/”) and without (“w/o”) coherence.
Full AGB Range>100 Mg/ha≤100 Mg/ha
RMSEnRMSEBiasRMSEnRMSEBiasRMSEnRMSEBias
SiteCoherence(Mg/ha)(%)(Mg/ha)(Mg/ha)(%)(Mg/ha)(Mg/ha)(%)(Mg/ha)
PALSAR-2
Lopew/o99.9826.30−1.0198.2824.61−5.12127.14428.2674.16
w/96.4925.38−1.3595.2423.85−4.97117.13394.5665.04
Mondahw/o84.6661.70−2.93108.7940.05−45.9557.11231.0633.05
w/72.8253.08−2.0895.1935.04−30.8446.48188.0521.97
Ogoouew/o99.4434.662.9794.9830.60−7.01137.01298.37105.30
w/96.2533.551.8592.4629.79−7.41128.85280.6196.79
UAVSAR
Lopew/o83.9825.241.5486.4622.57−2.9167.02240.6928.45
w/81.8724.612.9184.0021.93−1.4567.59242.7629.30
Mondahw/o80.7464.611.76104.3438.43−42.1159.03254.7032.21
w/71.7257.401.4196.5135.54−33.1747.42204.6125.43
Ogoouew/o97.3637.94−2.4995.2231.52−18.76107.06284.7575.86
w/92.0035.85−1.8491.1630.17−16.2195.93255.1467.30
Table 5. Below, we add various Felzenswalb superpixel segments as features into the RF model. The # of scales indicates the number of superpixel segments used to generate features. No scales indicates only pixelwise features are used.
Full AGB Range
Site# of ScalesRMSE (Mg/ha)nRMSE (%)Bias (Mg/ha)
PALSAR-2
Lope0104.7027.54−2.40
199.2026.09−1.84
297.0225.52−1.38
396.4925.38−1.35
Mondah096.9170.64−1.15
183.4460.82−2.89
274.6854.43−1.75
372.8253.08−2.08
Ogooue0116.7840.700.82
1106.5737.151.84
298.6234.372.29
396.2533.551.85
UAVSAR
Lope094.1228.297.24
184.8425.504.47
282.2824.733.89
381.8724.612.91
Mondah089.8771.920.85
179.5363.651.99
273.8259.081.43
371.7257.401.41
Ogooue0118.9946.37−4.53
1103.9140.49−1.86
294.0736.66−1.88
392.0035.85−1.84
Table 6. Feature importances from the RF model as defined in [70] trained on areas with AGB above 100 Mg/ha using InSAR coherence and backscatter and all three superpixel-derived features.
Feature NamesFeature Importance
SensorSiteRank (%)
PALSAR-2Lope1HV backscatter μ (scale 1)8.52
2HH coherence (pixel level)5.97
3HV backscatter (pixel level)4.72
Mondah1HH coherence μ (scale 3)25.18
2HH coherence μ (scale 1)6.19
3HV Coherence μ (scale 3)3.93
Ogooue1Polarization ratio σ (scale 3)6.20
2HH coherence (pixel level)4.97
3HV coherence (pixel level)4.96
UAVSARLope1Polarization ratio (pixel level)11.80
2Polarization ratio μ (scale 1)10.41
3Polarization ratio σ (scale 1)7.34
Mondah1Polarization ratio μ (scale 1)15.17
2HV coherence μ (scale 2)6.28
3Polarization ratio σ (scale 1)5.00
Ogooue1HH coherence (pixel level)5.39
2Polarization ratio (pixel level)5.24
3HV coherence (pixel level)4.93