Effects of Different Urbanization Levels on Land Surface Temperature Change: Taking Tokyo and Shanghai for Example


Abstract
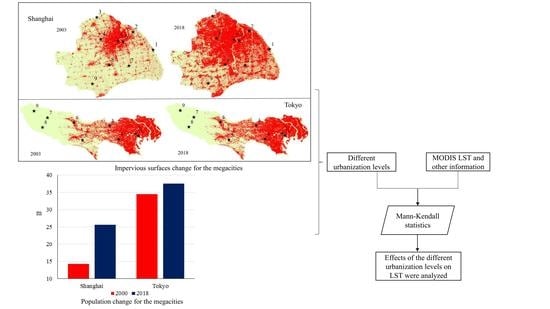
1. Introduction
2. Data and Methods
2.1. Study Areas
2.2. Data
2.2.1. MODIS Land Surface Temperature (LST) Data
2.2.2. Land Cover Data
2.3. Methods
2.3.1. The Procedure for Selecting Typical Sites
2.3.2. Trend Analysis Methods
- (a)
- Mann-Kendall Trend Test
- (b)
- Sen’s Slope Estimator
3. Results
3.1. The LST Change in Shanghai City
3.2. The LST Change in Tokyo City
3.3. Analysis of Urban Heat Island (UHI) for the Megacities
4. Discussion
4.1. Factors about LST Change for Two Megacities
4.2. Issues about the MODIS LST Product
5. Conclusions
Author Contributions
Funding
Acknowledgments
Conflicts of Interest
References
- Duan, S.-B.; Li, Z.-L.; Li, H.; Göttsche, F.-M.; Wu, H.; Zhao, W.; Leng, P.; Zhang, X.; Coll, C. Validation of Collection 6 MODIS land surface temperature product using in situ measurements. Remote Sens. Environ. 2019, 225, 16–29. [Google Scholar] [CrossRef]
- UN DESA. Population Division. In World Urbanization Prospects: The 2018 Revision; UN DESA: New York, NY, USA, 2019. [Google Scholar]
- Wan, Z. New refinements and validation of the collection-6 MODIS land-surface temperature/emissivity product. Remote Sens. Environ. 2014, 140, 36–45. [Google Scholar] [CrossRef]
- Weng, Q. Thermal infrared remote sensing for urban climate and environmental studies: Methods, applications, and trends. ISPRS J. Photogramm. Remote Sens. 2009, 64, 335–344. [Google Scholar] [CrossRef]
- Li, Z.; Tang, B.; Wu, H.; Ren, H.; Yan, G.; Wan, Z.; Trigo, I.F.; Sobrino, J.A. Satellite-derived land surface temperature: Current status and perspectives. Remote Sens. Environ. 2013, 131, 14–37. [Google Scholar] [CrossRef]
- Wang, J.; Zhou, W.; Jiao, M.; Zheng, Z.; Ren, T.; Zhang, Q. Significant effects of ecological context on urban trees’ cooling efficiency. ISPRS J. Photogramm. Remote Sens. 2020, 159, 78–89. [Google Scholar] [CrossRef]
- Jamei, Y.; Rajagopalan, P.; Sun, Q.C. Spatial structure of surface urban heat island and its relationship with vegetation and built-up areas in Melbourne, Australia. Sci. Total Environ. 2019, 659, 1335–1351. [Google Scholar] [CrossRef] [PubMed]
- Bounoua, L.; Zhang, P.; Mostovoy, G.; Thome, K.; Masek, J.; Imhoff, M.; Shepherd, M.; Quattrochi, D.; Santanello, J.; Silva, J.; et al. Impact of urbanization on US surface climate. Environ. Res. Lett. 2015, 10, 084010. [Google Scholar] [CrossRef]
- Voogt, J.A.; Oke, T.R. Thermal reomte sensing of urban climates. Remote Sens. Environ. 2003, 86, 370–384. [Google Scholar] [CrossRef]
- Choi, Y.; Suh, M.; Park, K. Assessment of surface urban heat islands over three megacities in East Asia using land surface temperature data retrieved from COMS. Remote Sens. 2014, 6, 5852–5867. [Google Scholar] [CrossRef]
- Rajasekar, U.; Weng, Q. Urban heat island monitoring and analysis using a non-parametric model: A case study of Indianapolis. ISPRS J. Photogramm. Remote Sens. 2009, 64, 86–96. [Google Scholar] [CrossRef]
- Krehbiel, C.; Henebry, G. A comparison of multiple datasets for monitoring thermal time in urban areas over the U.S. Upper Midwest. Remote Sens. 2016, 8, 297. [Google Scholar] [CrossRef]
- Eleftheriou, D.; Kiachidis, K.; Kalmintzis, G.; Kalea, A.; Bantasis, C.; Koumadoraki, P.; Spathara, M.E.; Tsolaki, A.; Tzampazidou, M.I.; Gemitzi, A. Determination of annual and seasonal daytime and nighttime trends of MODIS LST over Greece-climate change implications. Sci. Total Environ. 2018, 616–617, 937–947. [Google Scholar] [CrossRef]
- Clinton, N.; Gong, P. MODIS detected surface urban heat islands and sinks: Global locations and controls. Remote Sens. Environ. 2013, 134, 294–304. [Google Scholar] [CrossRef]
- Ma, W.; Zhou, L.; Zhang, H.; Zhang, Y.; Dai, X. Air temperature field distribution estimations over a Chinese mega-city using MODIS land surface temperature data: The case of Shanghai. Front. Earth Sci. 2015, 10, 38–48. [Google Scholar] [CrossRef]
- Ren, G.; Zhou, Y.; Chu, Z.; Zhou, J.; Zhang, A.; Guo, J.; Liu, X. Urbanization effects on observed surface air temperature trends in north China. J. Clim. 2008, 21, 1333–1348. [Google Scholar] [CrossRef]
- Sun, Y.; Zhang, X.; Ren, G.; Zwiers, F.W.; Hu, T. Contribution of urbanization to warming in China. Nat. Clim. Chang. 2016, 6, 706–709. [Google Scholar] [CrossRef]
- Wang, Y.; Feng, J.; Gao, H. Numerical simulation of the impact of land cover change on regional climate in China. Theor. Appl. Climatol. 2013, 115, 141–152. [Google Scholar] [CrossRef]
- Yao, X.; Wang, Z.; Wang, H. Impact of urbanization and land-use change on surface climate in middle and lower reaches of the Yangtze River, 1988–2008. Adv. Meteorol. 2015, 2015, 1–10. [Google Scholar] [CrossRef]
- Yue, W.; Xu, J.; Tan, W.; Xu, L. The relationship between land surface temperature and NDVI with remote sensing: Application to Shanghai Landsat 7 ETM+ data. Int. J. Remote Sens. 2007, 28, 3205–3226. [Google Scholar] [CrossRef]
- Zhang, N.; Gao, Z.; Wang, X.; Chen, Y. Modeling the impact of urbanization on the local and regional climate in Yangtze River Delta, China. Theor. Appl. Climatol. 2010, 102, 331–342. [Google Scholar] [CrossRef]
- Zhou, D.; Zhao, S.; Zhang, L.; Liu, S. Remotely sensed assessment of urbanization effects on vegetation phenology in China’s 32 major cities. Remote Sens. Environ. 2016, 176, 272–281. [Google Scholar] [CrossRef]
- Zhou, D.; Zhao, S.; Zhang, L.; Sun, G.; Liu, Y. The footprint of urban heat island effect in China. Sci. Rep. 2015, 5, 11160. [Google Scholar] [CrossRef] [PubMed]
- Zhou, L.; Dickinson, R.E.; Tian, Y.; Fang, J.; Li, Q.; Kaufmann, R.K.; Tucker, C.J.; Myneni, R.B. Evidence for a significant urbanization effect on climate in China. Proc. Natl. Acad. Sci. USA 2004, 101, 9540–9544. [Google Scholar] [CrossRef] [PubMed]
- Jin, M.L.; Dickinson, R.E.; Zhang, D.L. The footprint of urban areas on global climate as characterized by MODIS. J. Clim. 2005, 18, 1551–1565. [Google Scholar] [CrossRef]
- Jones, P.D.; Lister, D.H.; Li, Q. Urbanization effects in large-scale temperature records, with an emphasis on China. J. Geophys. Res. 2008, 113. [Google Scholar] [CrossRef]
- Gu, C.; Hu, L.; Zhang, X.; Wang, X.; Guo, J. Climate change and urbanization in the Yangtze River Delta. Habitat Int. 2011, 35, 544–552. [Google Scholar] [CrossRef]
- Peng, S.; Piao, S.; Ciais, P.; Friedlingstein, P.; Ottle, C.; Breon, F.M.; Nan, H.; Zhou, L.; Myneni, R.B. Surface urban heat island across 419 global big cities. Environ. Sci. Technol. 2012, 46, 696–703. [Google Scholar] [CrossRef]
- Li, Y.; Zhu, L.; Zhao, X.; Li, S.; Yan, Y. Urbanization impact on temperature change in China with emphasis on land cover change and human activity. J. Clim. 2013, 26, 8765–8780. [Google Scholar] [CrossRef]
- Stewart, I.D.; Oke, T.R. Local climate zones for urban temperature studies. Bull. Am. Meteorol. Soc. 2012, 93, 1879–1900. [Google Scholar] [CrossRef]
- Tran, H.; Uchihama, D.; Ochi, S.; Yasuoka, Y. Assessment with satellite data of the urban heat island effects in Asian mega cities. Int. J. Appl. Earth Obs. Geoinf. 2006, 8, 34–48. [Google Scholar] [CrossRef]
- Gong, P.; Liu, H.; Zhang, M.; Li, C.; Wang, J.; Huang, H.; Clinton, N.; Ji, L.; Li, W.; Bai, Y.; et al. Stable classification with limited sample: Transferring a 30-m resolution sample set collected in 2015 to mapping 10-m resolution global land cover in 2017. Sci. Bull. 2019, 64, 370–373. [Google Scholar] [CrossRef]
- Gong, P.; Li, X.; Wang, J.; Bai, Y.; Chen, B.; Hu, T.; Liu, X.; Xu, B.; Yang, J.; Zhang, W.; et al. Annual maps of global artificial impervious area (GAIA) between 1985 and 2018. Remote Sens. Environ. 2020, 236, 111510. [Google Scholar] [CrossRef]
- Zhao, N.; Jiao, Y.; Ma, T.; Zhao, M.; Fan, Z.; Yin, X.; Liu, Y.; Yue, T. Estimating the effect of urbanization on extreme climate events in the Beijing-Tianjin-Hebei region, China. Sci. Total Environ. 2019, 688, 1005–1015. [Google Scholar] [CrossRef] [PubMed]
- Gocic, M.; Trajkovic, S. Analysis of changes in meteorological variables using Mann-Kendall and Sen’s slope estimator statistical tests in Serbia. Glob. Plan. Chang. 2013, 100, 172–182. [Google Scholar] [CrossRef]
- Gong, P.; Li, X.; Zhang, W. 40-Year (1978–2017) human settlement changes in China reflected by impervious surfaces from satellite remote sensing. Sci. Bull. 2019, 64, 756–763. [Google Scholar] [CrossRef]
- Li, J.; Song, C.; Cao, L.; Zhu, F.; Meng, X.; Wu, J. Impacts of landscape structure on surface urban heat islands: A case study of Shanghai, China. Remote Sens. Environ. 2011, 115, 3249–3263. [Google Scholar] [CrossRef]
- Zhang, Y.; Sun, L. Spatial-temporal impacts of urban land use land cover on land surface temperature: Case studies of two Canadian urban areas. Int. J. Appl. Earth Obs. Geoinf. 2019, 75, 171–181. [Google Scholar] [CrossRef]
- Jin, M.S.; Kessomkiat, W.; Pereira, G. Satellite-Observed Urbanization Characters in Shanghai, China: Aerosols, Urban Heat Island Effect, and Land–Atmosphere Interactions. Remote Sens. 2011, 3, 83–99. [Google Scholar] [CrossRef]
- Yu, Z.; Xu, S.; Zhang, Y.; Jorgensen, G.; Vejre, H. Strong contributions of local background climate to the cooling effect of urban green vegetation. Sci. Rep. 2018, 8, 6798. [Google Scholar] [CrossRef]
- Yu, Z.; Yang, G.; Zuo, S.; Jørgensen, G.; Koga, M.; Vejre, H. Critical review on the cooling effect of urban blue-green space: A threshold-size perspective. Urban For. Urban Gree. 2020, 49, 126630. [Google Scholar] [CrossRef]
- Feng, L.; Zhao, M.; Zhou, Y.; Zhu, L.; Tian, H. The seasonal and annual impacts of landscape patterns on the urban thermal comfort using Landsat. Ecol. Indic. 2020, 110, 105798. [Google Scholar] [CrossRef]
- Deng, Y.; Poon, S.W.; Chan, E.H.W. Planning mega-event built legacies–A case of Expo 2010. Habitat Int. 2016, 53, 163–177. [Google Scholar] [CrossRef]
- Xu, L.; Cui, S.; Tang, J.; Nguyen, M.; Liu, J.; Zhao, Y. Assessing the adaptive capacity of urban form to climate stress: A case study on an urban heat island. Environ. Res. Lett. 2019, 14, 044013. [Google Scholar] [CrossRef]
- Wang, S.; Huang, G.; Lin, J.; Hu, K.; Wang, L.; Gong, H. Chinese blue days: A novel index and spatio-temporal variations. Environ. Res. Lett. 2019, 14, 074026. [Google Scholar] [CrossRef]
- Hu, L.; Brunsell, N.A.; Monaghan, A.J.; Barlage, M.; Wilhelmi, O.V. How can we use MODIS land surface temperature to validate long-term urban model simulations? J. Geophys. Res. Atmos. 2014, 119, 3185–3201. [Google Scholar] [CrossRef]
- Tomlinson, C.J.; Chapman, L.; Thornes, J.E.; Baker, C. Remote sensing land surface temperature for meteorology and climatology: A review. Meteorol. Appl. 2011, 18, 296–306. [Google Scholar] [CrossRef]


| Site | Longitude (E) | Latitude (N) | Most Covered by | Elevation (m a.s.l.) |
|---|---|---|---|---|
| 1 | 121.803 | 31.146 | Impervious | 5 |
| 2 | 121.615 | 31.312 | Impervious | 5 |
| 3 | 121.277 | 31.450 | Cropland | 5 |
| 4 | 121.313 | 31.246 | Impervious | 5 |
| 5 | 121.473 | 31.232 | Mixture | 9 |
| 6 | 121.523 | 31.221 | Impervious | 12 |
| 7 | 121.577 | 30.997 | Cropland | 5 |
| 8 | 121.393 | 31.003 | Rural settlement | 7 |
| 9 | 121.236 | 30.828 | Rural settlement | 5 |
| Site | Longitude (E) | Latitude (N) | Most Covered by | Elevation (m a.s.l.) |
|---|---|---|---|---|
| 1 | 139.772 | 35.669 | Impervious | 25 |
| 2 | 139.753 | 35.685 | Vegetation | 40 |
| 3 | 139.571 | 35.739 | Impervious | 55 |
| 4 | 139.633 | 35.645 | Impervious | 45 |
| 5 | 139.383 | 35.639 | Mixture | 155 |
| 6 | 139.323 | 35.763 | Impervious | 153 |
| 7 | 139.139 | 35.796 | Mountain forest | 750 |
| 8 | 139.104 | 35.728 | Mountain forest | 550 |
| 9 | 139.045 | 35.843 | Mountain forest & Sparse Built-up | 730 |
| Season | Months Included | MYD LST Julian Day |
|---|---|---|
| Spring | 3–5 | 57–145 |
| Summer | 6–8 | 153–233 |
| Autumn | 9–11 | 241–329 |
| Winter | 12–2 | 337–49 |
| Site | LONG (E) | LAT (N) | Test | Trends | ||||
|---|---|---|---|---|---|---|---|---|
| Spring | Summer | Autumn | Winter | Annual | ||||
| 1 | 121.803 | 31.146 | ZS | 3.5568 * | 2.1161 * | 0.7654 | 1.4857 | 2.7464 * |
| βmed | 0.4021 | 0.2587 | 0.1861 | 0.1412 | 0.2322 | |||
| 2 | 121.615 | 31.312 | ZS | 2.5663 * | 2.5663 * | 1.2156 | 2.2061 * | 3.1966 * |
| βmed | 0.2665 | 0.3017 | 0.1288 | 0.1811 | 0.1981 | |||
| 3 | 121.277 | 31.450 | ZS | 1.9360 | 1.6658 | 0.6753 | 1.3057 | 2.4762 * |
| βmed | 0.1814 | 0.1456 | 0.1181 | 0.1001 | 0.1195 | |||
| 4 | 121.313 | 31.246 | ZS | 0.9455 | 1.7109 | 0.3152 | 1.3057 | 1.1256 |
| βmed | 0.0606 | 0.1059 | 0.0462 | 0.1397 | 0.081 | |||
| 5 | 121.473 | 31.232 | ZS | 0.7654 | 1.3057 | 0.3152 | 1.8459 | 1.8459 |
| βmed | 0.0715 | 0.129 | 0.0941 | 0.1491 | 0.1376 | |||
| 6 | 121.523 | 31.221 | ZS | −0.3152 | −0.8554 | −0.8554 | 0.6753 | −1.1256 |
| βmed | −0.0391 | −0.0957 | −0.1168 | 0.0546 | −0.0581 | |||
| 7 | 121.577 | 30.997 | ZS | 1.0355 | 1.4407 | 0.4052 | 1.5758 | 1.3957 |
| βmed | 0.091 | 0.0934 | 0.0347 | 0.0832 | 0.0863 | |||
| 8 | 121.393 | 31.003 | ZS | 0.1351 | 1.4857 | 0.7654 | 1.4857 | 1.0355 |
| βmed | 0.0265 | 0.0865 | 0.1106 | 0.1304 | 0.0716 | |||
| 9 | 121.236 | 30.828 | ZS | 1.7559 | 0.9455 | 0.9455 | 1.6208 | 2.0260 * |
| βmed | 0.1486 | 0.0951 | 0.1846 | 0.1061 | 0.0993 | |||
| Site | LONG (E) | LAT (N) | Test | Trends | ||||
|---|---|---|---|---|---|---|---|---|
| Spring | Summer | Autumn | Winter | Annual | ||||
| 1 | 121.803 | 31.146 | ZS | 0.2251 | 1.0355 | 0.9455 | −0.5853 | 0.6753 |
| βmed | 0.0244 | 0.1077 | 0.1166 | −0.0566 | 0.0406 | |||
| 2 | 121.615 | 31.312 | ZS | 0.7654 | 0.4952 | 0.9455 | −0.045 | 1.3957 |
| βmed | 0.0593 | 0.0633 | 0.0969 | −0.004 | 0.0671 | |||
| 3 | 121.277 | 31.450 | ZS | −1.0355 | 0 | −0.2251 | −1.3957 | −0.5853 |
| βmed | −0.0627 | 0.0025 | −0.016 | −0.0877 | −0.0115 | |||
| 4 | 121.313 | 31.246 | ZS | 0.7654 | 0.6753 | 0.9455 | −0.045 | 1.4857 |
| βmed | 0.0567 | 0.0862 | 0.0852 | −0.0026 | 0.0647 | |||
| 5 | 121.473 | 31.232 | ZS | 0.4052 | −0.045 | 0.4952 | 0.4952 | 0.4952 |
| βmed | 0.0204 | −0.0069 | 0.0361 | 0.0371 | 0.014 | |||
| 6 | 121.523 | 31.221 | ZS | 0.4502 | 0.4952 | 0.2251 | 0.3152 | 0.2251 |
| βmed | 0.0253 | 0.0267 | 0.0293 | 0.0155 | 0.0036 | |||
| 7 | 121.577 | 30.997 | ZS | −0.1351 | 0.2251 | 0.045 | −0.3152 | −0.045 |
| βmed | −0.0136 | 0.055 | 0.014 | −0.0205 | −0.0036 | |||
| 8 | 121.393 | 31.003 | ZS | −0.3152 | −0.045 | 0.2251 | −0.4052 | −0.045 |
| βmed | −0.03 | −0.005 | 0.0273 | −0.0243 | −0.0018 | |||
| 9 | 121.236 | 30.828 | ZS | 0.2251 | −0.2251 | 0.045 | −0.9455 | −0.6753 |
| βmed | 0.0225 | −0.0864 | 0.0062 | −0.0472 | −0.0301 | |||
| Site | LONG (E) | LAT (N) | Test | Trends | ||||
|---|---|---|---|---|---|---|---|---|
| Spring | Summer | Autumn | Winter | Annual | ||||
| 1 | 121.803 | 31.146 | ZS | −0.1801 | 0.2251 | 1.0355 | 1.3957 | 3.6468 * |
| βmed | −0.0024 | 0.0493 | 0.096 | 0.2286 | 0.1915 * | |||
| 2 | 121.615 | 31.312 | ZS | 2.4762 * | 1.4857 | 0.9455 | 2.8364 * | 3.0165 * |
| βmed | 0.1838 * | 0.1501 | 0.042 | 0.1802 * | 0.1431 * | |||
| 3 | 121.277 | 31.450 | ZS | 3.1066 * | 0.3152 | 2.4762 * | 2.6563 * | 3.4667 * |
| βmed | 0.2629 | 0.0442 | 0.1225 * | 0.2248 * | 0.1528 * | |||
| 4 | 121.313 | 31.246 | ZS | −0.3152 | 0.4952 | −1.4857 | 1.8459 | 0.045 |
| βmed | −0.0342 | 0.0561 | −0.0972 | 0.1151 | 0.001 | |||
| 5 | 121.473 | 31.232 | ZS | 1.5758 | 1.1256 | 0.4952 | 2.1161 | 1.4857 |
| βmed | 0.1171 | 0.1137 | 0.0269 | 0.1179 | 0.0967 | |||
| 6 | 121.523 | 31.221 | ZS | −0.5853 | −1.5758 | −2.026 | 0.7654 | −1.6658 |
| βmed | −0.0523 | −0.1592 | −0.1327 | 0.0336 | −0.0524 | |||
| 7 | 121.577 | 30.997 | ZS | 1.1256 | 2.026 * | 0.8554 | 2.5663 * | 2.2961 * |
| βmed | 0.0935 | 0.0979 * | 0.0435 | 0.1633 * | 0.0885 * | |||
| 8 | 121.393 | 31.003 | ZS | 0.5853 | 0.3152 | 1.0355 | 1.936 | 1.3957 |
| βmed | 0.0613 | 0.0363 | 0.1151 | 0.1064 | 0.0805 | |||
| 9 | 121.236 | 30.828 | ZS | 1.936 | 1.8459 | 1.0355 | 2.2061 * | 2.9265 * |
| βmed | 0.1426 | 0.1725 | 0.0958 | 0.1197 * | 0.1537 * | |||
| Site | LONG (E) | LAT (N) | Test | Trends | ||||
|---|---|---|---|---|---|---|---|---|
| Spring | Summer | Autumn | Winter | Annual | ||||
| 1 | 139.772 | 35.669 | ZS | 2.7464 * | 0.9455 | −1.2156 | −0.4952 | 1.3057 |
| βmed | 0.2165 * | 0.0967 | −0.1225 | −0.0167 | 0.0567 | |||
| 2 | 139.753 | 35.685 | ZS | 2.2961 * | 1.4857 | −1.5758 | −0.9455 | 0.7654 |
| βmed | 0.1579 * | 0.1428 | −0.1469 | −0.0604 | 0.0371 | |||
| 3 | 139.571 | 35.739 | ZS | 3.5568 * | 2.4762 * | −0.7654 | 0.2251 | 2.2061 * |
| βmed | 0.2766 * | 0.2201 * | −0.0873 | 0.0158 | 0.1298 * | |||
| 4 | 139.633 | 35.645 | ZS | 3.4667 * | 3.0165 * | −1.0355 | −0.6753 | 1.8459 |
| βmed | 0.1903 * | 0.1959 * | −0.0888 | −0.033 | 0.0737 | |||
| 5 | 139.383 | 35.639 | ZS | 2.8364 * | 1.5758 | −0.6753 | 0.045 | 1.7559 |
| βmed | 0.2394 * | 0.1558 | −0.0788 | 0.0014 | 0.092 | |||
| 6 | 139.323 | 35.763 | ZS | 3.5568 * | 2.6563 * | −0.6753 | 0.6753 | 2.1161 * |
| βmed | 0.3044 * | 0.1927 * | −0.0957 | 0.0693 | 0.1204 * | |||
| 7 | 139.139 | 35.796 | ZS | 2.3862 * | 0.4052 | −1.3057 | −0.2251 | 0.3152 |
| βmed | 0.1827 * | 0.0325 | −0.1141 | −0.0118 | 0.0194 | |||
| 8 | 139.104 | 35.728 | ZS | 1.936 | 0.3602 | −1.6658 | 0.045 | 0.8554 |
| βmed | 0.1528 | 0.0256 | −0.1236 | 0.0079 | 0.0315 | |||
| 9 | 139.045 | 35.843 | ZS | 2.2061 * | −0.9005 | −1.7559 | 0 | −0.3152 |
| βmed | 0.1524 * | −0.1492 | −0.1267 | 0.001 | −0.0125 | |||
| Site | LONG (E) | LAT (N) | Test | Trends | ||||
|---|---|---|---|---|---|---|---|---|
| Spring | Summer | Autumn | Winter | Annual | ||||
| 1 | 139.772 | 35.669 | ZS | 2.9265 * | 0.1351 | −0.8554 | −0.3152 | 1.1256 |
| βmed | 0.2266 * | 0.0531 | −0.0683 | −0.0281 | 0.0544 | |||
| 2 | 139.753 | 35.685 | ZS | 3.3767 * | 0.6303 | −1.4857 | −0.9455 | 1.0355 |
| βmed | 0.2117 * | 0.0484 | −0.1515 | −0.0387 | 0.0475 | |||
| 3 | 139.571 | 35.739 | ZS | 3.3767 * | 0.3152 | −1.3957 | −0.8554 | 1.0355 |
| βmed | 0.2445 * | 0.0233 | −0.1065 | −0.0142 | 0.055 | |||
| 4 | 139.633 | 35.645 | ZS | 3.0165 * | 0.1351 | −1.6658 | −0.5853 | 0.6753 |
| βmed | 0.1987 * | 0.01 | −0.1582 | −0.0341 | 0.0294 | |||
| 5 | 139.383 | 35.639 | ZS | 3.1066 * | 0.4502 | −0.8554 | −0.4952 | 0.9455 |
| βmed | 0.186 * | 0.074 | −0.0752 | −0.0225 | 0.05 | |||
| 6 | 139.323 | 35.763 | ZS | 2.9265 * | −0.7654 | −1.6658 | −1.3057 | −0.045 |
| βmed | 0.1969 * | −0.0431 | −0.1726 | −0.0776 | −0.003 | |||
| 7 | 139.139 | 35.796 | ZS | 1.936 | 1.0355 | −1.2156 | 0.045 | 0.7654 |
| βmed | 0.1298 | 0.0616 | −0.0743 | 0.0036 | 0.0357 | |||
| 8 | 139.104 | 35.728 | ZS | 2.4762 * | 0.3152 | −1.0355 | −0.1351 | 0.5853 |
| βmed | 0.163 * | 0.0255 | −0.0815 | −0.0056 | 0.0283 | |||
| 9 | 139.045 | 35.843 | ZS | 2.2961 * | 1.0355 | −1.5758 | 0.2251 | 0.2251 |
| βmed | 0.1422 * | 0.0492 | −0.0944 | 0.0245 | 0.0091 | |||
| Site | LONG (E) | LAT (N) | Test | Trends | ||||
|---|---|---|---|---|---|---|---|---|
| Spring | Summer | Autumn | Winter | Annual | ||||
| 1 | 139.772 | 35.669 | ZS | 0.3152 | 0.1351 | 0.045 | −0.1801 | 0.4052 |
| βmed | 0.0159 | 0.004 | 0.0045 | −0.0024 | 0.0189 | |||
| 2 | 139.753 | 35.685 | ZS | −0.4952 | 1.4857 | 0.7654 | −0.8554 | 0.7654 |
| βmed | −0.0223 | 0.0466 | 0.0165 | −0.0271 | 0.0201 | |||
| 3 | 139.571 | 35.739 | ZS | 2.1161 * | 2.4762 * | −0.2251 | 1.4857 | 3.2866 * |
| βmed | 0.0763 * | 0.2418 * | −0.0055 | 0.0764 | 0.109 * | |||
| 4 | 139.633 | 35.645 | ZS | 0.6753 | 1.4857 | −0.2251 | −0.1351 | 1.1256 |
| βmed | 0.0567 | 0.1505 | −0.0134 | −0.0066 | 0.0261 | |||
| 5 | 139.383 | 35.639 | ZS | 1.3957 | 0.5853 | 0.045 | 0.3152 | 0.8554 |
| βmed | 0.0789 | 0.0852 | 0.0025 | 0.0106 | 0.0473 | |||
| 6 | 139.323 | 35.763 | ZS | 2.6563 * | 2.1161 * | −0.3152 | 2.5663 * | 3.1966 * |
| βmed | 0.1470 * | 0.2884 * | −0.0327 | 0.1209 * | 0.1449 * | |||
| 7 | 139.139 | 35.796 | ZS | 1.4857 | −0.3602 | −1.4857 | −0.4952 | −0.6753 |
| βmed | 0.071 | −0.0271 | −0.0513 | −0.017 | −0.0073 | |||
| 8 | 139.104 | 35.728 | ZS | 0.045 | 0.4052 | −1.6658 | 0.6753 | 0.5853 |
| βmed | 0.0054 | 0.0269 | −0.0596 | 0.0208 | 0.017 | |||
| 9 | 139.045 | 35.843 | ZS | 0.4952 | −0.9455 | −0.4052 | 0.5853 | −1.2156 |
| βmed | 0.0591 | −0.0906 | −0.0501 | 0.0319 | −0.0345 | |||
© 2020 by the authors. Licensee MDPI, Basel, Switzerland. This article is an open access article distributed under the terms and conditions of the Creative Commons Attribution (CC BY) license (http://creativecommons.org/licenses/by/4.0/).
Share and Cite
Chao, Z.; Wang, L.; Che, M.; Hou, S. Effects of Different Urbanization Levels on Land Surface Temperature Change: Taking Tokyo and Shanghai for Example. Remote Sens. 2020, 12, 2022. https://doi.org/10.3390/rs12122022
Chao Z, Wang L, Che M, Hou S. Effects of Different Urbanization Levels on Land Surface Temperature Change: Taking Tokyo and Shanghai for Example. Remote Sensing. 2020; 12(12):2022. https://doi.org/10.3390/rs12122022
Chicago/Turabian StyleChao, Zhenhua, Liangxu Wang, Mingliang Che, and Shengfang Hou. 2020. "Effects of Different Urbanization Levels on Land Surface Temperature Change: Taking Tokyo and Shanghai for Example" Remote Sensing 12, no. 12: 2022. https://doi.org/10.3390/rs12122022
APA StyleChao, Z., Wang, L., Che, M., & Hou, S. (2020). Effects of Different Urbanization Levels on Land Surface Temperature Change: Taking Tokyo and Shanghai for Example. Remote Sensing, 12(12), 2022. https://doi.org/10.3390/rs12122022