Abstract
Accurate monitoring of plant dust retention can provide a basis for dust pollution control and environmental protection. The aims of this study were to analyze the spectral response features of grassland plants to mining dust and to predict the spatial distribution of dust retention using hyperspectral data. The dust retention content was determined by an electronic analytical balance and a leaf area meter. The leaf reflectance spectrum was measured by a handheld hyperspectral camera, and the airborne hyperspectral data were obtained using an imaging spectrometer. We analyzed the difference between the leaf spectral before and after dust removal. The sensitive spectra of dust retention on the leaf- and the canopy-scale were determined through two-dimensional correlation spectroscopy (2DCOS). The competitive adaptive reweighted sampling (CARS) algorithm was applied to select the feature bands of canopy dust retention. The estimation model of canopy dust retention was built through random forest regression (RFR), and the dust distribution map was obtained based on the airborne hyperspectral image. The results showed that dust retention enhanced the spectral reflectance of leaves in the visible wavelength but weakened the reflectance in the near-infrared wavelength. Caused by the canopy structure and multiple scattering, a slight difference in the sensitive spectra on dust retention existed between the canopy and leaves. Similarly, the sensitive spectra of leaves and the canopy were closely related to dust and plant physiological parameters. The estimation model constructed through 2DCOS-CARS-RFR showed higher precision, compared with genetic algorithm-random forest regression (GA-RFR) and simulated annealing algorithm-random forest regression (SAA-RFR). Spatially, the amount of canopy dust increased and then decreased with increasing distance from the mining area, reaching a maximum within 300–500 m. This study not only demonstrated the importance of extracting feature bands based on the response of plant physical and chemical parameters to dust, but also laid a foundation for the rapid and non-destructive monitoring of grassland plant dust retention.
1. Introduction
Mineral coal is the second most widely used fossil fuel in the world and the first in terms of reserves for future use [1]. In the last five years, the annual global production was about 7702 Mt [2]. Coal mining enhances the development of the world economy. However, the mining, loading, unloading, and transportation of open-pit coal mines cause large amounts of fugitive dust. Dust not only causes respiratory diseases in humans [3,4], but also adversely affects the photosynthetic efficiency and growth of plants [5,6,7], as well as the physical and chemical properties of soil [1,4]. Compared with general atmospheric dust pollution, mining dust has the following characteristics [4,8]: (1) dust pollution is centered on mining pits, coal yards, and transportation trunk lines; (2) the dust diffusion distance is relatively short, and its aggregation feature is obvious; (3) the size of most mining dust particles is greater than 10 μm; and (4) mining dust contains a certain amount of heavy metals.
With the implementation of the “strategic westward” coal development, grassland has become one of the primary energy bases in China [9]. Large amounts of pollutants are released into the environment due to the spread of mining dust [10,11], which may threaten land productivity and ecological integrity [12], and make the inherently fragile grassland areas more vulnerable. Ecosystem functions are strictly related to species composition and can be partially described with plant characteristics [13,14]. Therefore, it is important to study the response features of grassland plants to mining dust and the spatial distribution of plant dust retention for the formulation of effective dust control measures. Most of the traditional monitoring methods [7,15,16,17] were to collect samples in the field and then measure the physicochemical parameters of plants by destructive chemical means. Although with high accuracy, the costs of those traditional methods in experimental equipment and the tests are expensive. Moreover, traditional methods are time-consuming and labor-intensive, and cannot be used for large-scale full coverage analysis.
Compared with the field sampling analysis, the fully validated remote sensing data have higher time and cost efficiency [18]. Hyperspectral sensors can obtain continuous narrow-band and high-resolution data in the full spectral range. They have sensitive spectral response ability and can identify diagnostic absorption spectral features that cannot be detected by wide-band remote sensing [19,20]. The advantages of hyperspectral technology are not only limited to near-end sensing, but also can be used to obtain large-area image data through airborne or satellite sensors. Furthermore, it is increasingly playing an important role in soil heavy metal inversion [21,22], plant diversity research [23,24], and plant biochemical parameter exploration [25,26]. Applying multiple techniques and analysis methods to hyperspectral data makes it possible to monitor the spatial distribution of dust.
In the last decade, substantial efforts have been made to investigate the influence of dust retention on leaf spectral reflectance, trilateral parameters, and vegetation index [27,28,29,30], constructing a series of dust-sensitive spectral indices [31,32]. For example, the correlation relationship between the spectral features of the polluted leaf of Ficus microcarpa and air dustfall in Guangzhou (China) was studied [33]. In order to monitor the dust retention of pear leaves in South Xinjiang (China), the correlation between dust retention and reflectance was analyzed, and the estimation model had high accuracy (Rc2 = 0.88, RMSEc = 2.69 g/m2) [34]. More recent research focused on the monitoring of the spatial distribution of dust by establishing an estimation model of plant dust retention [35,36]. For example, dust distribution in the urban area of Beijing (China) was assessed using remote sensing and ground-based spectral data, and the dust source was identified based on the results [37]. Results of the research for an open cast mining area in India indicated that it is possible to use the normalized difference vegetation index (NDVI) for foliar dust estimation; Hyperion data gave better accuracy than Landsat (RMSE = 0.06 g/m2 for Hyperion and RMSE = 0.11 g/m2 for Landsat) [38]. The methods mentioned above have been proven to be accurate in dust estimation. Nevertheless, most researches only focused on the response features of one kind of leaf to dust. They ignored the fact that the differences in structure and physiological parameters among different plant species usually affect the leaf spectrum [26,39]. It is a challenge to design a method suitable for monitoring the dust retention of various plants.
The remote sensing images capture a canopy or larger-scale spectrum of plants. Compared with the leaf spectrum, the canopy spectrum is not only affected by the biochemical features, but also depends on the canopy structure and the understory reflectance. Therefore, it would introduce new errors when directly applying the estimation model of leaf dust retention established in previous research to the remote sensing image, or even lead the estimation model to failure in extreme cases [26,40]. Additionally, leaf dust retention reflects the degree of dust pollution of individual plants, while canopy dust retention reflects the response features of vegetation composition to dust. Applying the estimation model of canopy dust retention to spectral imaging data can obtain a regional dust distribution map. The dust retention of leaves and the canopy have different application fields, but little attention has been paid to the scale difference in the spectral responses of plant dust retention.
The disparity between the number of hyperspectral data bands (usually more than 100) and the number of sampling points is enormous, which may lead to overfitting in the modeling process. Some spectral studies [22,41] have shown that regression models built using the optimal bands deliver better results than obtained when using the full band or vegetation index. Therefore, how to use limited samples to find the exact feature bands of plant dust retention and then build a stable estimation model have become the key to obtain accurate spatial distribution maps of plant dust retention. Two-dimensional correlation spectroscopy (2DCOS) is a spectral analysis method developed by Noda [42] in the 1980s. This method extends the dynamic spectrum generated by perturbations (time, temperature, concentration, etc.) to two dimensions (synchronous and asynchronous spectra), so that the overlapping part of the spectrum can be decomposed [43]. Through the synchronous and asynchronous spectra, we can analyze the sensitivity of different spectral peaks to perturbations and the relative order of their changes. At present, two-dimensional correlation analysis plays an increasingly important role in the fields of discrimination of medicinal materials [44] and analysis of the binding process of metallic elements to dissolved organic matter (DOM) [43]. The competitive adaptive reweighted sampling (CARS) algorithm [45] is a variable selection method, which has been successfully applied to identify the feature bands of soil heavy metal and plant physicochemical parameters [22,46]. This paper is the first to evaluate the feasibility of combining two-dimensional correlation spectroscopy and the CARS algorithm (2DCOS-CARS) to determine the feature bands of plant dust retention and improve its inversion accuracy.
The objectives of this study were (1) to investigate the spectral response features of dust retention on the leaf- and the canopy-scale; (2) to demonstrate the effectiveness of 2DCOS-CARS on selecting wavebands for canopy dust retention modeling; and (3) to monitor dust retention spatially based on the airborne hyperspectral image. Figure 1 shows the workflow of the analysis.
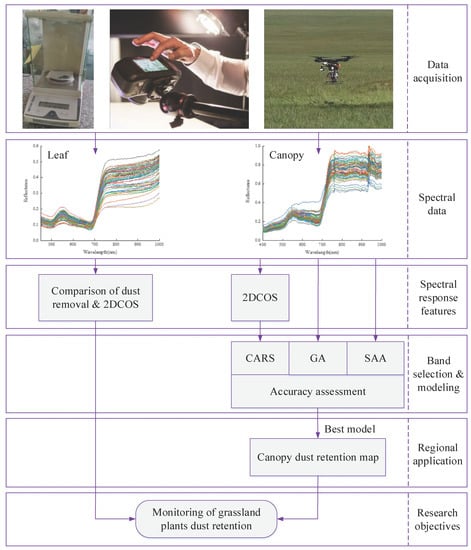
Figure 1.
Workflow of spectral response and estimation study of grassland plant dust retention.
2. Materials and Methods
2.1. Study Areas
Considering the validity and universality of the establishment method, we selected four plant species from two typical grassland areas in the Inner Mongolia Autonomous Region, China (Figure 2). The Xilinhot grassland area is located in the Shengli Coalfield and its surrounding area in the northern suburb of Xilinhot City. The geographical coordinates of this region are 43°54′15″–44°13′52″ north latitude, 115°24′26″–116°26′30″ east longitude, at an elevation of 960–1270 m. The area is located in the mid-latitude westerly air zone and belongs to the semi-arid continental climate in the middle temperate zone. The minimum average monthly temperature is −21.64 °C, the maximum average monthly temperature is 19.0 °C, and the average annual rainfall is 294.74 mm. Strong winds occur in spring, with a predominant northwestern wind direction and a wind speed of 2.1–8.4 m/s, having an average speed of 3.5 m/s; the instantaneous maximum wind speed is 36.6 m/s.
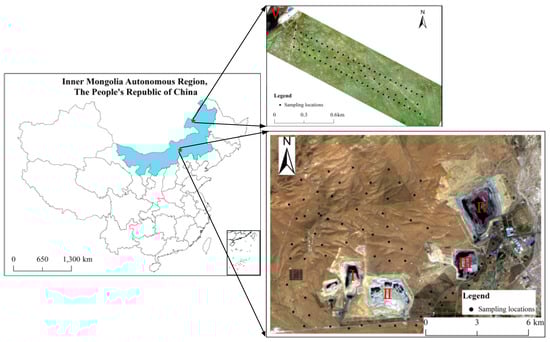
Figure 2.
Locations of the study areas. I: Wulantuga Germanium Mine; II: West Open-pit Mine-2; III: West Open-pit Mine-3; IV: Shengli Open-pit Mine-1; V: Hulunbuir Dongming Mine.
The HulunBuir grassland area is located in the Hulunbuir City, Inner Mongolia Autonomous Region, southeast of the Hulunbuir Dongming mine. The geographical coordinates are latitude 49°24′22″–49°25′37″ and east longitude 119°38′27″–119°40′32″, at an elevation of 583–651 m. This area has a vulnerable and unstable ecological environment that is characterized by a typical arid or semi-arid climate. The average annual temperature is between −2.4 and 2.2 °C, while the highest and lowest temperatures recorded are 17 and −48.5 °C, respectively. The predominant wind direction is northwest, the instantaneous maximum wind speed is 20 m/s, and the annual average wind speed is more than 3 m/s.
2.2. Dust Retention Content and Leaf Spectrum Measurement
In the Xilinhot grassland, the two dominant plant species, Leymus chinensis and Cleistogenes squarrosa, were selected, and 66 samples were collected. In the HulunBuir grassland, Potentilla acaulis and Scutellaria scordifolia were selected, and 70 samples were collected; each sample contained two leaf types. The above four plant species are important forage plants on natural grasslands in eastern Inner Mongolia. They are characterized by high productivity, cold resistance, salt, and alkali tolerance. Their leaves unfold, making it easy to obtain a reflectance spectrum and dust retention content. Although Stipa krylovii is also one of the main species in grasslands, its leaves are curly and needle-like, and the area is too small to measure; therefore, it was excluded from this experiment.
The healthy, disease-free, and insect-free leaves were selected during the collection. Three leaves were collected from each plant for each sample. The real-time kinematic (RTK) technology was used to record the coordinates of the sampling points. The leaves of the same plant in each sample were sealed in a centrifuge tube and transported to the laboratory. Subsequently, spectral measurement, mass weighing, dust removal, and leaf area measurement were performed. All these measurements were performed on the same day of sample collection to avoid the influence of leaf water loss and physiological parameter changes on the results.
In the darkroom, a halogen lamp was used as the light source, and the leaf spectral reflectance was measured by the SPECIM IQ (Handheld Hyperspectral Camera, SPECIM, Finland). SPECIM IQ provides surface radiance measurements in 204 spectral bands between 397 and 1004 nm with a full width at a half maxima (FWHM) of 7 nm. Only the bands in the range of 450–1000 nm were selected for analysis, as the beginning and ending parts of the spectrum presented high amounts of noise caused by the optical instrument and experimental environment. The local correction maximization denoising method [47] was used to smooth the spectrum. The leaf weight was determined with an electronic analytic balance (1/10,000 g scale) and recorded as . After weighing, the dust on the front side was cleaned off with a soft brush, and the leaf was weighed a second time (. Leaf area () was measured using a leaf area meter (CI-202, CID, USA) and recorded as S. The dust retention content (DRC) of a leaf was determined using Equation (1); the average value of all collected leaves in the sample was used as the dust retention content of the canopy.
2.3. Airborne Hyperspectral Data Acquisition and Preprocessing
Since the Xilinhot grassland area is near Xilinhot Airport, which is a no-fly zone, it is impossible to collect airborne hyperspectral data via an unmanned aerial vehicle (UAV). Therefore, only in the HulunBuir grassland, Wind4 (UAV, DJI, China), equipped with SPECIM FX10 (Imaging Spectrometer, SPECIM, Finland), was used to collect canopy hyperspectral data. The SPECIM FX10 was configured with a spectral range of 397–1003 nm and a field of view (FOV) of 38°. The sensor was used in 4 × 2 binning mode, and the acquisition time was approximately 11:00 a.m. on 13 August 2019 (windless, cloudless, and appropriate sunshine). The flight altitude of the UAV was set at 117 m above the ground, and the spectral resolution and spatial resolution of the hyperspectral image were 5.5 nm and 0.16 m, respectively.
Radiometric calibration and geolocating were performed by the CaliGeoPro tool (Data Processing Tool, SPECIM, Finland). That is, the digital number (DN value) of the original hyperspectral data was converted into radiance by using the dark signal and calibration file. The position and attitude data recorded by the inertial navigation system (INS), and the digital elevation model (DEM) were used to calculate the geodetic coordinates of the pixels by a collinearity equation. Then, the hyperspectral data were registered with the high-resolution orthophoto as the reference. The radiance of the hyperspectral image was converted into reflectance data by using the average spectrum of the whiteboard obtained synchronously. Finally, the flight lines were mosaicked together using the “georeferenced mosaicking” method [23]. The DEM and orthophotos used in this research were acquired by Phantom 4 RTK (UAV, DJI, China).
2.4. Two-dimensional Correlation Spectroscopy
We used 2DCOS to analyze the sensitive spectral range of plant dust retention. In this study, the dust retention content of plants was taken as the perturbation, and the spectral variation was a function of the spectral variable v (wavelength) and the perturbation t (dust content). The dynamic spectrum can be defined as follows:
where is the reference spectrum, typically expressed by the average spectrum at the variable v.
The two-dimensional correlation intensity is obtained from the correlation analysis of two independent spectral variations at and , as shown in Equation (3):
where is the synchronous intensity, which indicates the similarity of the spectral intensity changes under the influence of perturbation t; and is the asynchronous intensity, which means the difference in spectral intensity changes.
The spectral coordinates, intensities, and signs of correlation peaks appearing on the two-dimensional correlation spectrum can be interpreted by a series of principles [43]. The synchronous spectrum is symmetrical about the main diagonal, and consists of auto-peaks located along the main diagonal and cross-peaks located at the off-diagonal positions. The intensity of the auto-peak indicates the degree of spectral change caused by the perturbation. The cross-peak represents the collaborative change degree of spectral intensity at two different spectral variables . A positive cross-peak indicates the same direction of the intensity change at the corresponding spectral coordinates, while a negative value suggests the opposite direction. The asynchronous spectrum is antisymmetric concerning the main diagonal, indicating the sequence in which the two spectral signals change. The same signs of the spectral coordinate in both the synchronous and asynchronous spectra indicate that the spectral intensity changes at before that of . This order is reversed when the signs are opposite. The spectral changes coincide if only the cross-peaks show in the synchronous spectrum. When the cross-peaks only show in the asynchronous spectrum, the spectral changes in opposite directions, but the sequence of the changes cannot be determined [48,49].
The reflectance spectrum was transformed into a two-dimensional correlation spectrum using the 2D Shige software (Kwansei-Gakuin University, Japan). Then, the synchronous and asynchronous spectra were drawn with MATLAB R2018b.
2.5. Feature Bands Selection and Estimation Model
The CARS algorithm was used to extract the feature bands within the sensitive spectral ranges obtained by 2DCOS. It is a variable selection method that imitates Darwin’s “survival of the fittest” principle of evolution. In CARS, several wavelength subsets are selected utilizing the exponential decreasing function and the adaptive reweighted sampling in an iterative and competitive way. Subsequently, each subgroup is modeled through the cross-validation method, and the subset with the smallest root mean square error is the optimal subset.
To verify the effectiveness of 2DCOS-CARS to extract feature bands, the genetic algorithm (GA) and the simulated annealing algorithm (SAA) [50] were used to select wavebands in the whole spectral range. Subsequently, the bands selected by the three methods were used as the variable to build the estimation model of dust retention, and the modeling results were compared.
The random forest regression (RFR) [51,52] was used to construct the estimation model of dust retention content. RFR uses the bootstrap resampling method to generate multiple samples from the original training set, and each new sample is modeled with a decision tree. Then, the prediction results of all decision trees are combined, and their average value or the highest frequency value are used as the optimal prediction results.
The accuracy of the model will be significantly affected by the high dust retention data, so it is necessary to enhance the samples. In this paper, two pixels in the image adjacent to the original sample were selected as the co-selected samples. According to Tobler’s First Law of Geography [53], geographical things or attributes are mutually related in spatial distribution, so the original sample’s dust data were taken as the value of the co-selected samples. The spectral approximation of the two newly selected samples was higher, and the error was less. Two thirds of the samples were randomly selected as the calibration set, and the remaining one third as the validation set. The coefficient of determination (R2), the root mean square error (RMSE), and the residual predictive deviation (RPD) were selected as the evaluation standards. When RPD ≥ 2.0, the model has excellent prediction ability; when 1.4 ≤ RPD < 2, the difference between a high and low estimated value can be roughly distinguished; when RPD < 1.4, the model cannot predict the sample [22]. All calculations were performed in MATLAB R2018b.
3. Results
3.1. Dust Retention Content Variability
Table 1 summarizes the measurement results of the four plant species and canopy dust retention content. The dust retention content varies from 0.353–51.425 g/m2 of Leymus chinensis, 1.813–52.810 g/m2 of Cleistogenes squarrosa, 2.441–62.064 g/m2 of Potentilla acaulis, 0.532–47.312 g/m2 of Scutellaria scordifolia, and 1.486–54.688 g/m2 of the canopy. Cleistogenes squarrosa has the highest mean value of dust retention content of 18.656 g/m2 than the others. According to the Nielsen rule [54], the coefficient of variation (C.V) of the four plant species and the canopy is between 51.665% and 91.930%, all of which show moderate-intensity variation.

Table 1.
Dust retention content range in g/m2 shown for each plant species and the canopy.
3.2. Comparison of Leaf Spectra before and after Dust Removal
The average spectral reflectance of dusty and non-dusty (dust removed) leaves of each plant species was calculated (Figure 3). Since the objects of this comparison were spectral reflectance of the same leaf before and after dust removal, influences of chlorophyll content, leaf health, relative water content, and other factors were excluded. The reflectance spectra of dusty and non-dusty leaves were similar, with both having typical plant spectral characteristics, albeit with differences for specific bands. Dusty leaves had higher reflectance than non-dusty leaves at the range of 450–700 nm; at 700–1000 nm, dusty leaves’ reflectance was obviously lower than non-dusty leaves’ reflectance, and the intersection of the two spectra was located at 697–730 nm. The above results show that dust can enhance the leaves’ reflectance in the visible wavelength and inhibit the near-infrared wavelength.
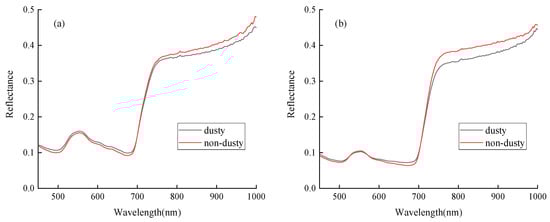
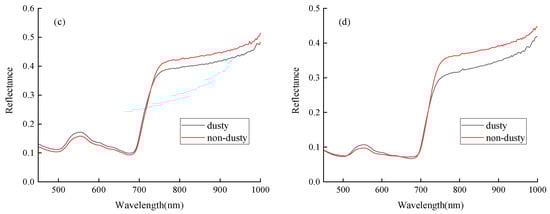
Figure 3.
Reflectance of dusty and non-dusty leaves. (a) Leymus chinensis, (b) Cleistogenes squarrosa, (c) Potentilla acaulis, (d) Scutellaria scordifolia.
To more clearly analyze the difference between the spectra of dusty and non-dusty leaves, principal component analysis (PCA) [55] was used to transform the original spectrum into new effective principal components (PCs) containing as much as possible of the total variation. Figure 4 shows the PCA bi-plot that was depicted based on the first two main PCs (more than 90% of the variance) reflecting the relationship between the dusty and non-dusty leaves. The results show that the dusty and non-dusty spectra of the same leaf are close to each other, and the effect of dust removal on the spectrum is not significant.
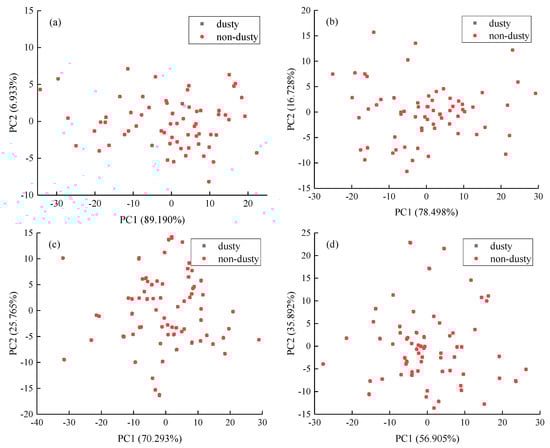
Figure 4.
Bi-plot for the spectra of dusty and non-dusty leaves based on the studied characters. (a) Leymus chinensis, (b) Cleistogenes squarrosa, (c) Potentilla acaulis, (d) Scutellaria scordifolia.
3.3. Two-Dimensional Correlation Spectra of Plants Dust Retention
3.3.1. Two-Dimensional Correlation Analysis of Dust Retention in Leaves
The two-dimensional correlation spectra of Leymus chinensis, Cleistogenes squarrosa, Potentilla acaulis, and Scutellaria scordifolia are shown in Figure 5. According to the synchronous spectra, the four plant species showed auto-peaks at 531–566 and 736–787 nm, respectively, with a positive cross-peak at (531–566, 736–787 nm), indicating that the spectrum in these two ranges was most sensitive to the dust retention on leaves, and their reflectance changed in the same direction with the variation in the dust retention content.
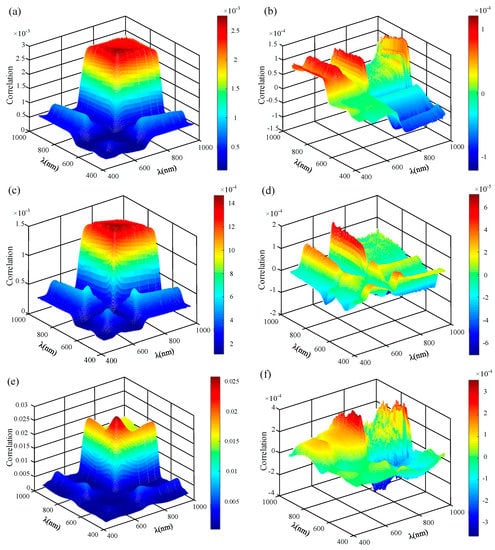
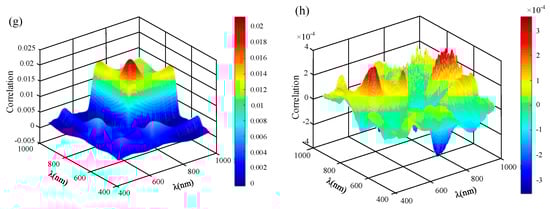
Figure 5.
Two-dimensional correlation spectra of leaves. (a) Synchronous spectrum of Leymus chinensis, (b) asynchronous spectrum of Leymus chinensis, (c) synchronous spectrum of Cleistogenes squarrosa, (d) asynchronous spectrum of Cleistogenes squarrosa, (e) synchronous spectrum of Potentilla acaulis, (f) asynchronous spectrum of Potentilla acaulis, (g) synchronous spectrum of Scutellaria scordifolia, (h) asynchronous spectrum of Scutellaria scordifolia.
In the asynchronism spectra, the samples of the four plant species formed a positive cross-peak at (531–566, 736–787 nm). According to the Noda rule [56], under the influence of dust retention, the spectral intensity change at 531–566 nm occurs before that of 736–787 nm. In addition, Leymus chinensis showed negative cross-peaks at the following ranges: (763–790, 700–727 nm), (914–945, 543–569 nm), and (793–820, 951–979 nm). There were negative cross-peaks at (473–502, 703–727 nm), (658–685, 703–736 nm), (658–685, 537–566 nm), and (826–847, 703–736 nm) of Cleistogenes squarrosa. Potentilla acaulis had negative cross-peaks at (718–757, 859–884 nm) and (963–988, 859–884 nm). Scutellaria scordifolia exhibited negative cross-peaks at (490–513, 700–730 nm), (700–730, 905–936 nm), (694–721, 881–905 nm), and (730–757, 700–724 nm). Since the above cross-peaks only appeared in the asynchronous spectra, we can only judge that their corresponding reflectivity changed in the opposite direction. Still, the change order cannot be determined.
3.3.2. Two-Dimensional Correlation Analysis of Dust Retention in the Canopy
Based on the coordinates measured by the RTK method, the canopy spectral of each sample was extracted from the airborne hyperspectral image. Then, the two-dimensional correlation spectrum of canopy dust retention was constructed (Figure 6). There was a deviation between the sensitive spectral ranges of the canopy and the leaves, that is, the auto-peaks of the canopy in the synchronous spectrum located at 488–526, 649–687, and 747–802 nm, indicating that the spectral reflectance of these three ranges was the most sensitive to canopy dust retention. Simultaneously, there were positive cross-peaks between the three regions, which indicates that the spectral reflectance of these ranges changed in the same direction under the influence of dust retention.
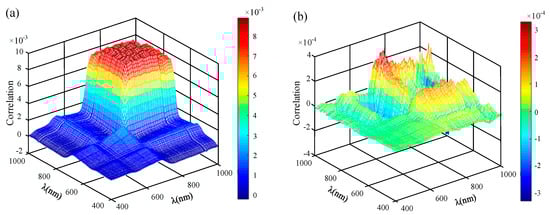
Figure 6.
Two-dimensional correlation spectrum of the canopy. (a) Synchronous spectrum, (b) asynchronous spectrum.
In the asynchronous spectrum, there were three positive cross-peaks at (747–802, 488–526 nm), (747–802, 649–687 nm), and (649–687, 488–526 nm). Combining the results of the synchronous spectrum and asynchronous spectrum, the change order of the spectral intensity was 747–802, 649–687, and 488–526 nm. In addition, there were negative cross-peaks at (494–526, 863–896 nm), (649–687, 918–952 nm), and (918–952, 520–552 nm), and it can only be judged that the reflectance of these bands changed along the opposite direction, but the order of their change was uncertain.
3.4. Estimate of Canopy Dust Retention Based on Feature Analysis
Effectively extracting feature bands of canopy dust retention and constructing a high-precision estimation model are the critical steps in large-scale canopy dust retention monitoring. Based on the results of Section 3.3.2, the sensitive spectra of canopy dust retention were 488–526, 649–687, and 747–802 nm. Ten wavebands centered at 488, 499, 520, 654, 671, 687, 752, 763, 780, and 796 nm were extracted from the above regions by the CARS algorithm. These selected wavebands were then used for RFR modeling, with the results being compared to those of RFR models developed with the bands optimized through GA and SAA (Table 2). From the prediction accuracy, the RFR model’s accuracy was affected by the waveband selection method. Compared with GA-RFR and SAA-RER, the accuracies of the calibration set and validation set using 2DCOS-CARS-RFR were generally better, as indicated by the higher R2 and lower RMSE values. Besides, the RPD value of 2DCOS-CARS-RFR was 2.357, while GA-RFR and SAA-RER were 1.772 and 1.962, respectively. These results show that 2DCOS-CARS can be used to extract the feature bands of dust retention, and the estimation model had great significance for improving the prediction ability of few-shot learning. In contrast, the other two estimation models can only roughly distinguish the level of dust retention.
Table 2.
Comparison of the prediction results of the three models.
3.5. Spatial Distribution Features of Canopy Dust
The task of this study was to retrieve the dust content in a vegetated area, but to avoid the interference from the invalid estimates for bare soil, the NDVI value can be used to distinguish the vegetated area (NDVI > 0.4) from the non-vegetated area (NDVI ≤ 0.4). The estimation model constructed by 2DCOS-CARS-RFR was applied to the airborne hyperspectral image to obtain the spatial distribution map of canopy dust retention (Figure 7). The estimated value of dust content ranged from 7.207 to 52.135 g/m2. The high-value area was mainly distributed within 900 m from the mining area, of which the area with a value higher than 24.121 g/m2 accounted for 82.218%. However, in the range greater than 900 m, the area with an amount exceeding 24.121 g/m2 only accounted for 41.401%.
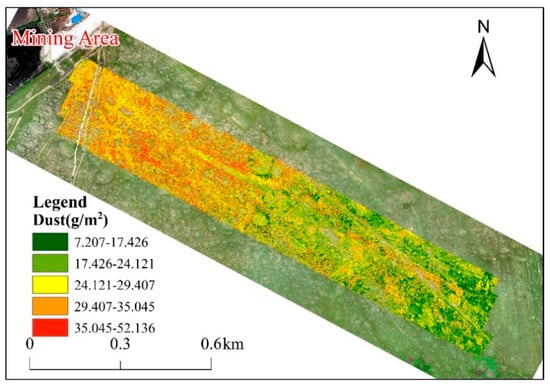
Figure 7.
Spatial distribution map of canopy dust retention.
In order to further analyze the relationship between the canopy dust and the distance to the mining area, the mining area was taken as the buffer zone center, and a 200 m step was used to produce the average values of the dust content buffer zones (Figure 8). The average dust content in each buffer zone ranged from 21.116 to 30.424 g/m2. With increasing distance from the mining area, the dust retention content increased and then decreased, reaching the maximum value of 30.424 g/m2 within the range of 300–500 m, corroborating Niu et al. [57] regarding the dust distribution trend. Dust is subjected to gravity during the propagation process, and larger particles settle first; therefore, the maximum dust content appears at a certain distance from the mining area. Smaller particles continue to spread and gradually fall, resulting in decreasing dust content with increasing distance from the mine.
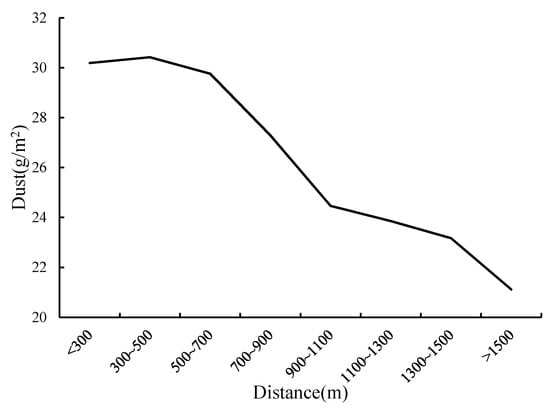
Figure 8.
Variation in canopy dust retention content with distance to the mining area.
4. Discussion
4.1. Effects of Dust on Leaf Spectra
Figure 3 shows that although the reflectance spectra of the dusty and non-dusty leaves were similar, the reflectance of dusty leaves at 450–700 nm was higher than that of non-dusty leaves, while at 700–1000 nm, it was lower than that of the non-dusty leaves. These features mentioned above are consistent with previous findings by Peng et al. [31] and Yan et al. [37]. Due to the influence of chlorophyll, the plant reflectance spectrum forms absorption valleys in the blue and red bands, with a reflection peak near the green band. The near-infrared band is repeatedly scattered by the complex cell structure inside the leaf to form a highly reflective platform [58]. Most dust is in the form of solid particles such as soil and coal powder. Due to their shielding effect [59], part of the light cannot enter the leaves, reducing the influences of chlorophyll and cell structure on spectral reflectance. Besides, the dust has a scattering effect in the visible wavelength. Therefore, the reflectivity of dusty leaves is higher than that of non-dusty leaves in the visible range and lower in the near-infrared range. According to Wang et al. [36], the spectral reflectance of non-dusty leaves at 450–700 nm was higher than that of dusty leaves, which is different from the results in this paper. This discrepancy might result from the differences in dust chemical composition and particle size features in various study areas [60,61], as well as the dust retention and adsorption capacities of different leaves.
4.2. Sensitive Spectral Analysis of Leaf and Canopy Dust Retention
The sensitive spectral range of dust retention in leaves and the canopy was determined by two-dimensional correlation analysis. In order to prove the rationality of the selected sensitive spectra of leaf dust retention, we set up several dust collecting tanks near the mining area and numbered them successively (D1-D18). Since the amount of collected dust at some samples was too small to measure the reflectance spectrum, only five samples (D1-D5) were measured in the darkroom (Figure 9). The spectral curve of each sample was smooth, with the reflectance gradually increasing, and the slope changed around 580 and 780 nm. The sensitive spectra of dust were determined by 2DCOS (Figure 10). There were auto-peaks within the regions of 583–617 and 746–777 nm in the synchronous spectrum, deviating from the position of leaf dust retention. This is because dust shielding and its influence on plant physicochemical parameters affect the dusty leaves spectrum. Naidoo et al. [7] and Neves et al. [62] found that dust can block leaf surface pores, inhibiting photosynthesis and transpiration rates, which further leads to a decrease in chlorophyll, carotenoids, and relative water content [5,6]. The dust retention sensitive spectral range of 531–566 nm contains the characteristic bands of carotenoids and equivalent water thickness (EWT) [63,64]. Some sensitive bands of chlorophyll and carotenoids range from 736–787 nm [39,63,64,65]. The above results show that the sensitive spectra of leaf dust retention are closely related to dust and the physicochemical parameters of leaves.
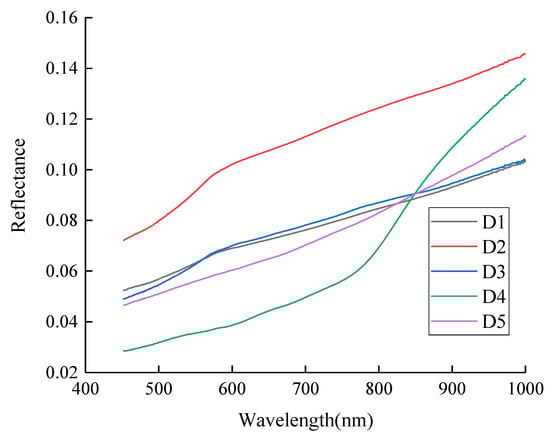
Figure 9.
Spectral reflectance of dust samples.
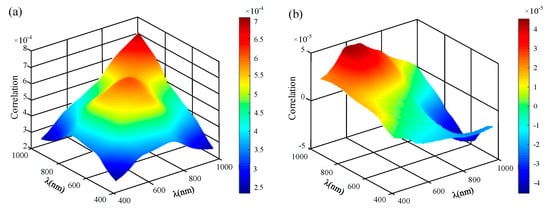
Figure 10.
Two-dimensional correlation spectrum of dust. (a) Synchronous spectrum, (b) asynchronous spectrum.
The sensitive spectral ranges of leaf dust retention extracted in this experiment are similar to those reported in previous studies, but there are also differences. For example, Jing et al. [28] recommended using the spectral of 450–500, 550–600, 750–1000, and 1100–1300 nm to estimate three types of leaf dust retention content in southern China, which are consistent with some of the sensitive spectra in this paper. Peng et al. [28] studied the correlation between reflectance and dust retention content on elm leaves in Alaer, China, and the results were similar to those in this paper. Namely, there was a highly significant correlation between 400–708 and 754–1050 nm. Li et al. [32] studied the relationship between dust retention content and reflectance of poplar leaves in Beijing, China. They found that the correlation between 450 and 527 nm was statistically significant, while 528–567 nm was not significant, which was different from the results of this study. These discrepancies might have been caused by the fact that in our paper, we focused on herbaceous species, while previous studies mainly investigated tree species. There are significant differences in the chemical and physiological characteristics as well as in the dust retention ability between leaves of herbaceous and tree species [66,67], leading to differences in leaf spectra characteristics.
Due to the different reflection mechanisms of the canopy and leaves, the sensitive spectra of canopy dust retention are different from those of leaves. The spatial resolution of the airborne hyperspectral data was 0.16 m, and most of the pixels were mixed pixels. The sensor receives multiple scattering spectra of various plant leaves in the canopy [68]. In addition to the effect of dust on the photosynthetic pigments and water content, the influence of dust retention on the canopy structure (mainly leaf area index (LAI) ) will also change the spectral features [40,69]. Based on the monitoring results of the canopy’s physical and chemical parameters, the wavelength range of 488–526 nm includes sensitive bands of chlorophyll and carotenoids [26,64]. The range of 649–687 nm contains some sensitive bands of chlorophyll, carotenoids, and LAI [26]; some characteristic bands of phosphorus involved in photosynthesis are also located in this spectral range [70]. Some sensitive bands of chlorophyll, carotenoids, gravimetric water content (GWC), and LAI are within the range of 747–802 nm [26,41,64,71]. In summary, the sensitive spectra of canopy dust retention reflect the response features of plant physicochemical parameters to dust.
4.3. Accuracy Evaluation of the Estimation Model
Using the bands selected by 2DCOS-CARS, GA, and SAA as independent variables, the estimation models of canopy dust retention were constructed. The results showed that compared with the other two methods, the 2DCOS-CARS-RFR model had better accuracy (the R2, RMSE, and RPD values of the validation set were 0.820, 3.910 g/m2, and 2.357, respectively). To compare the positions of the selected bands and their importance in the estimation models more intuitively, we normalized the importance and marked it out in the full spectrum (Figure 11). The feature bands selected by 2DCOS-CARS were concentrated near the sensitive spectra of dust and plant physicochemical parameters. They had a clear physical significance, and the quantitative model established with greater precision. Band selection based on GA and SAA similarly contained the bands adjacent to dust and plant physicochemical parameters, but generally showed a broad and ambiguous selection from the full spectrum. The importance of each band varied greatly, and the number of bands with relative importance less than 0.4 reached more than half, indicating that the model training was unbalanced. Only a few bands were mainly involved in the modeling, while the remaining bands played a small role. We suggest that GA and SAA are susceptible to the interference of other factors (e.g., water absorption bands or elements in leaves), causing the introduction of irrelevant bands or the missed selection of bands that have physical significance with dust retention, which makes the estimation model less accurate.
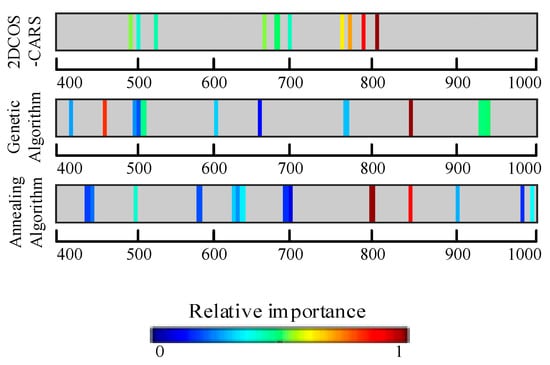
Figure 11.
Wavebands extracted by the three methods.
The comparison between the measured dust content and the value estimated by the 2DCOS-CARS-RFR model is shown in Figure 12. The majority data of the calibration set and the validation set were distributed closely around the 1:1 line, which shows that the estimation model can perform well in plants with different leaf parameters and structures. However, the calibration set was closer to the 1:1 line than the validation set, and their slope values (0.781 for the calibration set and 0.721 for the validation set) confirm this. Compared with the measured dust content, the results of high dust content (>23 g/m2) were overestimated, while those of low dust content (≤23 g/m2) being underestimated. This is a typical problem when using regression analysis. The use of spectral differences to distinguish the amount of canopy dust is based on the premise that spectral reflectance has a stable relationship with the plant characteristics and environmental factors. It ignores the phenomena of “different things with the same spectrum” and “the same thing with different spectrums” caused by the complex combination of phytochemical composition and structural parameters. The spatial heterogeneity of ecological relationships also affects the results of spatial analysis [72]. Therefore, using a unified relationship will inevitably lead to high variance and an unbalanced estimation.
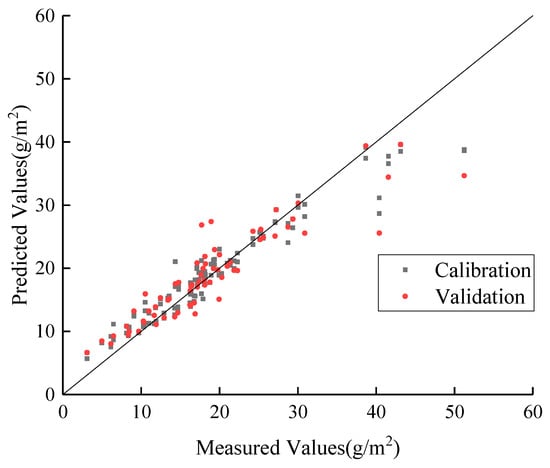
Figure 12.
Comparison between measured and estimated values of dust retention content.
Compared with the results of other studies using hyperspectral data to predict dust retention in leaves (e.g., R2 > 0.90 of the validation set) [28,31], there is still room for improvement in the prediction accuracy. This may be attributed to the fact that, although 2DCOS-CARS selected more effective feature bands, it still ignored some information on dust retention inversion. In addition, taking the canopy spectrum as variable data, the complexity of spectrum mixing of various plants, and the uncontrolled external conditions in the field will also reduce the prediction accuracy. Therefore, choosing the best feature extraction algorithm and minimizing data errors through preprocessing will be the focus of future work.
4.4. Future Work
In this study, the change characteristics of leaf and canopy spectra were analyzed through 2DCOS, under the influence of dust retention. However, the mechanism of their change direction and order difference is not clear. In the future, we will continue research to determine the cause of these differences. Moreover, this method will be applied to a broader area to test its applicability on grasslands with different environmental conditions and different plant compositions.
We have pointed out that there is an unbalanced estimation problem in using optical remote sensing to retrieve the dust retention content of a canopy. According to previous research results [73,74,75], the combination of structural features (LiDAR) can effectively improve the accuracy and rationality of canopy chemicals’ estimation results. In addition, the spatial distribution of dust depends on wind speed, wind direction, terrain, and other factors [76,77]. Therefore, the application of multi-source data such as the canopy structure, meteorological factors, and terrain factors to invert canopy dust retention will become one of our research focuses.
Although UAVs play an increasingly important role in space element monitoring, the area of spectral imaging data obtained each time is small due to the limitation of their endurance capacity, which cannot be used for the whole grassland or larger-scale researches. In recent years, with the progress of sensor technology, the Sentinel-2 multispectral sensor launched by ESA and the GF-5 hyperspectral sensor launched by China provide an opportunity for large-scale vegetation dust monitoring. Combining the results of this study with satellite remote sensing to build a “satellite-aerial-terrestrial” dust monitoring system has become an important direction of our future research.
5. Conclusions
To explore the response features of grassland plants to mining dust and monitor the spatial distribution of plant dust retention are of great significance for the protection of grassland ecology and environment. The spectral response features of dust retention were analyzed from leaf and canopy scales through hyperspectral measurements. Then, we constructed the estimation model of canopy dust retention and obtained its spatial distribution map based on airborne hyperspectral data. The research conclusions are as follows:
(1) Dust retention increases the reflectance of grassland plant leaves in the visible wavelength and decreases in the near-infrared wavelength. The two-dimensional correlation spectra of leaves and the canopy are different because of their different reflection mechanisms. The leaves of four plant species had auto-peaks at 531–566 and 736–787 nm in the synchronous spectra. In the synchronous spectrum of the canopy, auto-peaks appeared at 488–526, 649–687, and 747–802 nm, indicating that the above spectral ranges are most sensitive to plant dust retention;
(2) Choosing the appropriate modeling bands is the key to estimate dust retention content accurately. The feature bands selected by the 2DCOS-CARS method were strictly related to dust and plant physiological parameters. The estimation model constructed through 2DCOS-CARS-RFR showed higher robustness and accuracy, compared with GA-RFR and SAA-RFR;
(3) The high-value areas of canopy dust were mainly distributed within 900 m from the mining area. With increasing distance from the mining area, the dust retention content of the canopy increased and then decreased, reaching a maximum of 30.424 g/m2 within 300–500 m.
Author Contributions
Conceptualization, Y.Z.; formal analysis, Y.Z.; funding acquisition, S.L.; investigation, Y.Z., X.Y., C.G., C.W., W.C., H.L. and C.S.; methodology, Y.Z.; project administration, S.L.; supervision, S.L.; validation, S.L.; writing—original draft, Y.Z.; writing—review and editing, S.L. All authors have read and agreed to the published version of the manuscript.
Funding
This research was funded by National Key Research and Development Program of China (2016YFC0501107).
Acknowledgments
We would like to thank Biao Deng and Xiang Gao for their help in the process of data collection. The authors greatly appreciate the anonymous reviewer’s excellent comments in improving the manuscript quality.
Conflicts of Interest
The authors declare no conflict of interest.
References
- Ahrens, M.J.; Morrisey, D.J. Biological effects of unburnt coal in the marine environment. Oceanogr. Mar. Biol. 2005, 43, 69–122. [Google Scholar]
- Benitez-Polo, Z.; Velasco, L.A. Effects of suspended mineral coal dust on the energetic physiology of the Caribbean scallop Argopecten nucleus (Born, 1778). Environ. Pollut. 2020, 260, 114000. [Google Scholar] [CrossRef] [PubMed]
- Leghari, S.K.; Zaidi, M.A.; Siddiqui, M.F.; Sarangzai, A.M.; Sheikh, S.; Arsalan. Dust exposure risk from stone crushing to workers and locally grown plant species in Quetta, Pakistan. Environ. Monit. Assess. 2019, 191, 1–13. [Google Scholar] [CrossRef]
- Lu, J.; Lei, S.G. Research Overview of Effect of Dust on Environment and Its Diffusion Laws in Open-pit Coal Mine. Saf. Coal Mines 2017, 48, 231–234. [Google Scholar]
- Rai, P.K.; Panda, L.L.S. Dust capturing potential and air pollution tolerance index (APTI) of some road side tree vegetation in Aizawl, Mizoram, India: An Indo-Burma hot spot region. Air Qual. Atmos. Health 2014, 7, 93–101. [Google Scholar] [CrossRef]
- Hirano, T.; Kiyota, M.; Aiga, I. Physical effects of dust on leaf physiology of cucumber and kidney bean plants. Environ. Pollut. 1995, 89, 255–261. [Google Scholar] [CrossRef]
- Naidoo, G.; Chirkoot, D. The effects of coal dust on photosynthetic performance of the mangrove, Avicennia marina in Richards Bay, South Africa. Environ. Pollut. 2004, 127, 359–366. [Google Scholar] [CrossRef]
- Yang, H.L.; Wei, L.L.; Ye, X.H.; Liu, G.F.; Yang, X.J.; Huang, Z.Y. Effects of coal dust deposition on seedling growth of Hedysarum laeve Maxim., a dominant plant species on Ordos Plateau. Acta Ecol. Sin. 2016, 36, 2858–2865. [Google Scholar]
- Guo, J.Y.; He, J.L.; Li, J.R.; Xing, E.D.; Wen, A.S.; Liu, Y.P.; Yang, G.Y. Effects of different measures on water erosion control of dump slope at opencast coal mine in typical steppe. Trans. Chin. Soc. Agric. Eng. 2015, 31, 296–303. [Google Scholar]
- Chen, Y.W.; Liu, G.J.; Gong, Y.M.; Yang, J.L.; Qi, C.C.; Gao, L.F. Release and enrichment of 44 elements during coal pyrolysis of Yima coal, China. J. Anal. Appl. Pyrol. 2007, 80, 283–288. [Google Scholar]
- Kronbauer, M.A.; Izquierdo, M.; Dai, S.; Waanders, F.B.; Wagner, N.J.; Mastalerz, M.; Hower, J.C.; Oliveira, M.L.S.; Taffarel, S.R.; Bizani, D.; et al. Geochemistry of ultra-fine and nano-compounds in coal gasification ashes: A synoptic view. Sci. Total Environ. 2013, 456–457, 95–103. [Google Scholar] [CrossRef] [PubMed]
- Liu, X.Y.; Shi, H.D.; Bai, Z.K.; Zhou, W.; Liu, K.; Wang, M.H.; He, Y.J. Heavy metal concentrations of soils near the large opencast coal mine pits in China. Chemosphere 2020, 244, 125360. [Google Scholar] [CrossRef] [PubMed]
- Eviner, V.T.; Chapin III, F.S. Functional Matrix: A Conceptual Framework for Predicting Multiple Plant Effects on Ecosystem Processes. Annu. Rev. Ecol. Evol. Syst. 2003, 34, 455–485. [Google Scholar] [CrossRef]
- Díaz, S.; Cabido, M. Vive la différence: Plant functional diversity matters to, ecosystem processes. Trends Ecol. Evol. 2001, 16, 646–655. [Google Scholar] [CrossRef]
- Li, Y.J.; Zhao, N.; Cao, Y.E.; Yang, J.J. Effects of coal dust deposition on the physiological properties of plants in an open-pit coal mine. Acta Ecol. Sin. 2018, 38, 8129–8138. [Google Scholar]
- Chaston, K.; Doley, D. Mineral particulates and vegetation: Effects of coal dust, overburden and flyash on light interception and leaf temperature. Clean Air Environ. Qual. 2006, 40, 40–44. [Google Scholar]
- Spencer, S. Effects of coal dust on species composition of mosses and lichens in an arid environment. J. Arid Environ. 2001, 49, 843–853. [Google Scholar] [CrossRef]
- Weng, Q.H. Land use change analysis in the Zhujiang Delta of China using satellite remote sensing, GIS and stochastic modelling. J. Environ. Manag. 2002, 64, 273–284. [Google Scholar] [CrossRef]
- Zhao, S.H.; Wang, Q.; Li, Y.; Liu, S.H.; Wang, Z.T.; Zhu, L.; Wang, Z.F. An overview of satellite remote sensing technology used in China’s environmental protection. Earth Sci. Inform. 2017, 10, 137–148. [Google Scholar] [CrossRef]
- Li, D.R. Towards the Development of Remote Sensing and GIS in the 21st Century. Geomat. Inf. Sci. Wuhan Univ. 2003, 28, 127–131. [Google Scholar]
- Shi, T.Z.; Chen, Y.Y.; Liu, Y.L.; Wu, G.F. Visible and near-infrared reflectance spectroscopy—An alternative for monitoring soil contamination by heavy metals. J. Hazard. Mater. 2014, 265, 166–176. [Google Scholar] [CrossRef] [PubMed]
- Tan, K.; Wang, H.M.; Zhang, Q.Q.; Jia, X.P. An improved estimation model for soil heavy metal(loid) concentration retrieval in mining areas using reflectance spectroscopy. J. Soil Sediment 2018, 18, 2008–2022. [Google Scholar] [CrossRef]
- Landmann, T.; Piiroinen, R.; Makori, D.M.; Abdel-Rahman, E.M.; Makau, S.; Pellikka, P.; Raina, S.K. Application of hyperspectral remote sensing for flower mapping in African savannas. Remote Sens. Environ. 2015, 166, 50–60. [Google Scholar] [CrossRef]
- Roth, K.L.; Roberts, D.A.; Dennison, P.E.; Alonzo, M.; Peterson, S.H.; Beland, M. Differentiating plant species within and across diverse ecosystems with imaging spectroscopy. Remote Sens. Environ. 2015, 167, 135–151. [Google Scholar] [CrossRef]
- Haboudane, D. Hyperspectral vegetation indices and novel algorithms for predicting green LAI of crop canopies: Modeling and validation in the context of precision agriculture. Remote Sens. Environ. 2004, 90, 337–352. [Google Scholar] [CrossRef]
- Stagakis, S.; Markos, N.; Sykioti, O.; Kyparissis, A. Monitoring canopy biophysical and biochemical parameters in ecosystem scale using satellite hyperspectral imagery: An application on a Phlomis fruticosa Mediterranean ecosystem using multiangular CHRIS/PROBA observations. Remote Sens. Environ. 2010, 114, 977–994. [Google Scholar] [CrossRef]
- Wang, J.; Xu, R.S.; Ma, Y.L.; Miao, L.; Cai, R.; Chen, Y. The research of air pollution based on spectral features in leaf surface of Ficus microcarpa in Guangzhou, China. Environ. Monit. Assess. 2008, 142, 73–83. [Google Scholar] [CrossRef]
- Jing, W.L.; Zhou, X.; Zhang, C.; Wang, C.Y.; Jiang, H. Machine Learning for Estimating Leaf Dust Retention Based on Hyperspectral Measurements. J. Sens. 2018, 2018, 1–12. [Google Scholar] [CrossRef]
- Chudnovsky, A.; Ben-Dor, E. Application of visible, near-infrared, and short-wave infrared (400–2500 nm) reflectance spectroscopy in quantitatively assessing settled dust in the indoor environment. Case study in dwellings and office environments. Sci. Total Environ. 2008, 393, 198–213. [Google Scholar] [CrossRef]
- Zhang, P.F.; GULI, J.; Yin, J.Q.; Bao, A.M.; Yao, F.; Liu, J.P. Using Hyperspectral Indices to Measure the effect of Mine Dust on the Growth of Three Typical Desert Plants. Spectrosc. Spect. Anal. 2014, 34, 2162–2168. [Google Scholar]
- Peng, J.; Xiang, H.Y.; Wang, J.Q.; Ji, W.J.; Liu, W.Y.; Chi, C.M.; Zuo, T.G. Quantitative model of foliar dustfall content using hyperspectral remote sensing. J. Infrared Millim. Waves 2013, 32, 343. [Google Scholar] [CrossRef]
- Li, W.T.; Wu, J.; Chen, T.S.; Peng, D.L. Hyperspectral estimation model of dust deposition content on plant leaves. Trans. Chin. Soc. Agric. Eng. 2016, 32, 180–185. [Google Scholar]
- Xu, J.H.; Yu, J.T. Air Dustfall Impact on Spectrum of Ficus microcarpa’s Leaf. Adv. Mater. Res. 2013, 655–657, 813–815. [Google Scholar] [CrossRef]
- Peng, J.; Wang, J.Q.; Xiang, H.Y.; Niu, J.L.; Chi, C.M.; Liu, W.Y. Effect of Foliar Dustfall Content (FDC) on High Spectral Characteristics of Pear Leaves and Remote Sensing Quantitative Inversion of FDC. Spectrosc. Spect. Anal. 2015, 35, 1365–1369. [Google Scholar]
- Ong, C.; Cudahy, T.; Caccetta, M.; Hick, P.; Piggott, M. Quantifying dust loading on mangroves using hyperspectral techniques. In Proceedings of the IEEE International Geoscience & Remote Sensing Symposium, Sydney, Australia, 9–13 July 2001; Volume 1, pp. 296–298. [Google Scholar]
- Wang, H.; Fang, N.; Yan, X.; Chen, F.; Xiong, Q.; Zhao, W. Retrieving Dustfall Distribution in Beijing City Based on Ground Spectral Data and Remote Sensing. Spectrosc. Spect. Anal. 2016, 36, 2911–2918. [Google Scholar]
- Yan, X.; Shi, W.Z.; Zhao, W.J.; Luo, N.N. Mapping dustfall distribution in urban areas using remote sensing and ground spectral data. Sci. Total Environ. 2015, 506–507, 604–612. [Google Scholar] [CrossRef]
- Kayet, N.; Pathak, K.; Chakrabarty, A.; Kumar, S.; Chowdary, V.M.; Singh, C.P.; Sahoo, S.; Basumatary, S. Assessment of foliar dust using Hyperion and Landsat satellite imagery for mine environmental monitoring in an open cast iron ore mining areas. J. Clean. Prod. 2019, 218, 993–1006. [Google Scholar] [CrossRef]
- Sims, D.A.; Gamon, J.A. Relationships between leaf pigment content and spectral reflectance across a wide range of species, leaf structures and developmental stages. Remote Sens. Environ. 2002, 81, 337–354. [Google Scholar] [CrossRef]
- Yu, Y.; Song, Z.L.; Fan, W.Y.; Yang, X.G. Scale Conversion from Canopy Spectra and Leaf Spectra. Geomat. Inf. Sci. Wuhan Univ. 2018, 43, 1560–1565. [Google Scholar]
- Darvishzadeh, R.; Skidmore, A.; Schlerf, M.; Atzberger, C.; Corsi, F.; Cho, M. LAI and chlorophyll estimation for a heterogeneous grassland using hyperspectral measurements. ISPRS J. Photogramm. 2008, 63, 409–426. [Google Scholar] [CrossRef]
- Lee, C.; Yang, W.; Parr, R.G. Development of the Colle-Salvetti correlation-energy formula into a functional of the electron density. Phys. Rev. B Condens. Matter. 1988, 37, 785–789. [Google Scholar] [CrossRef]
- Chen, W.; Habibul, N.; Liu, X.Y.; Yu, H.Q. FTIR and Synchronous Fluorescence Heterospectral Two-Dimensional Correlation Analyses on the Binding Characteristics of Copper onto Dissolved Organic Matter. Environ. Sci. Technol. 2015, 49, 2052–2058. [Google Scholar] [CrossRef] [PubMed]
- Li, J.R.; Sun, S.Q.; Wang, X.X.; Xu, C.H.; Chen, J.B.; Zhou, Q.; Lu, G.H. Differentiation of five species of Danggui raw materials by FTIR combined with 2D-COS IR. J. Mol. Struct. 2014, 1069, 229–235. [Google Scholar] [CrossRef]
- Li, H.D.; Liang, Y.Z.; Xu, Q.S.; Cao, D.S. Key wavelengths screening using competitive adaptive reweighted sampling method for multivariate calibration. Anal. Chim. Acta. 2009, 648, 77–84. [Google Scholar] [CrossRef] [PubMed]
- Zhang, J.; Tian, H.Q.; Wang, D.; Li, H.J.; Mouazen, A.M. A Novel Approach for Estimation of Above-Ground Biomass of Sugar Beet Based on Wavelength Selection and Optimized Support Vector Machine. Remote Sens. 2020, 12, 620. [Google Scholar] [CrossRef]
- Lin, L.X.; Wang, Y.J.; Teng, J.Y.; Xi, X.X. Hyperspectral Analysis of Soil Total Nitrogen in Subsided Land Using the Local Correlation Maximization-Complementary Superiority (LCMCS) Method. Sensors 2015, 15, 17990–18011. [Google Scholar] [CrossRef] [PubMed]
- Chen, W.; Qian, C.; Liu, X.Y.; Yu, H.Q. Two-Dimensional Correlation Spectroscopic Analysis on the Interaction between Humic Acids and TiO2 Nanoparticles. Environ. Sci. Technol. 2014, 48, 11119–11126. [Google Scholar] [CrossRef]
- Noda, I. Close-up view on the inner workings of two-dimensional correlation spectroscopy. Vib. Spectrosc. 2012, 60, 146–153. [Google Scholar] [CrossRef]
- Sexton, R.S.; Dorsey, R.E.; Johnson, J.D. Optimization of neural networks: A comparative analysis of the genetic algorithm and simulated annealing. Eur. J. Oper. Res. 1999, 114, 589–601. [Google Scholar] [CrossRef]
- Breiman, L.; Breiman, L.; Cutler, R.A. Random Forests Machine Learning. J. Clin. Microbiol. 2001, 2, 199–228. [Google Scholar]
- Liang, L.; Di, L.P.; Zhang, L.P.; Deng, M.X.; Qin, Z.H.; Zhao, S.H.; Lin, H. Estimation of crop LAI using hyperspectral vegetation indices and a hybrid inversion method. Remote Sens. Environ. 2015, 165, 123–134. [Google Scholar] [CrossRef]
- Tobler, W.R. A computer movie simulating urban growth in the Detroit region. Econ. Geogr. 1970, 46, 234–240. [Google Scholar] [CrossRef]
- Yu, Y.F.; He, T.G.; Song, T.Q.; Li, L.J.; Wei, C.H.; Meng, Y.C.; Tang, H.Q.; Li, Z.Y.; Li, T.T.; Hu, F. Spatial variability of limestone soil nutrients in a Karst area of Northwestern Guangxi. Acta Ecol. Sin. 2018, 38, 2906–2914. [Google Scholar]
- Liu, B.H.; Zhao, D.C.; Zhang, P.Y.; Liu, F.C.; Jia, M.; Liang, J. Seedling evaluation of six walnut rootstock species originated in China based on principal component analysis and cluster analysis. Sci. Hortic. 2020, 265, 109212. [Google Scholar] [CrossRef]
- Noda, I. Generalized Two-Dimensional Correlation Method Applicable to Infrared, Raman, and Other Types of Spectroscopy. Appl. Spectrosc. 1993, 47, 1329–1336. [Google Scholar] [CrossRef]
- Niu, W.; Jiang, Z.A.; Tian, D.M. Numerical simulation of the factors influencing dust in drilling tunnels: Its application. Min. Sci. Technol. 2011, 21, 11–15. [Google Scholar]
- Liu, L.Y. Principle and Application of Quantitative Remote Sensing of Vegetation; Science Press: Beijing, China, 2014. [Google Scholar]
- Thompson, J.R.; Mueller, P.W.; Flückiger, W.; Rutter, A.J. The effect of dust on Photosynthesis and its significance for roadside Plants. Environ. Pollut. Ser. A Ecol. Biol. 1984, 34, 171–190. [Google Scholar] [CrossRef]
- Gupta, A.; Kumar, R.; Maharaj Kumari, K.; Srivastava, S.S. Atmospheric dry deposition to leaf surfaces at a rural site of India. Chemosphere 2004, 55, 1097–1107. [Google Scholar] [CrossRef] [PubMed]
- Pang, B.; Zhang, Y.L.; Wang, D. The characteristic of particulate size and heavy metal in foliar dust and surface dust from different urban areas. Ecol. Environ. Sci. 2009, 18, 1312–1317. [Google Scholar]
- Neves, N.R.; Oliva, M.A.; Da Cruz Centeno, D.; Costa, A.C.; Ribas, R.F.; Pereira, E.G. Photosynthesis and oxidative stress in the restinga plant species Eugenia uniflora L. exposed to simulated acid rain and iron ore dust deposition: Potential use in environmental risk assessment. Sci. Total Environ. 2009, 407, 3740–3745. [Google Scholar] [CrossRef]
- Wang, Q.; Li, P.H. Hyperspectral indices for estimating leaf biochemical properties in temperate deciduous forests: Comparison of simulated and measured reflectance data sets. Ecol. Indic. 2012, 14, 56–65. [Google Scholar] [CrossRef]
- Zhou, X.F.; Huang, W.J.; Kong, W.P.; Ye, H.C.; Dong, Y.Y.; Casa, R. Assessment of leaf carotenoids content with a new carotenoid index: Development and validation on experimental and model data. Int. J. Appl. Earth Obs. 2017, 57, 24–35. [Google Scholar] [CrossRef]
- Feilhauer, H.; Asner, G.P.; Martin, R.E. Multi-method ensemble selection of spectral bands related to leaf biochemistry. Remote Sens. Environ. 2015, 164, 57–65. [Google Scholar] [CrossRef]
- Chen, F.; Zhou, Z.X.; Xiao, R.B.; Wang, P.C.; Li, H.F.; Guo, E.X. Estimation of ecosystem services of urban green-land in industrial areas:A case study on green-land in the workshop area of the Wuhan Iron and Steel Company. Acta Ecol. Sin. 2006, 26, 2229–2236. [Google Scholar]
- Hallik, L.; Niinemets, Ü.; Kull, O. Photosynthetic acclimation to light in woody and herbaceous species: A comparison of leaf structure, pigment content and chlorophyll fluorescence characteristics measured in the field. Plant Biol. 2012, 14, 88–99. [Google Scholar] [CrossRef]
- Zarco-Tejada, P.J.; Miller, J.R.; Noland, T.L.; Mohammed, G.H.; Sampson, P.H. Scaling-up and model inversion methods with narrowband optical indices for chlorophyll content estimation in closed forest canopies with hyperspectral data. IEEE Trans. Geosci. Remote Sens. 2001, 39, 1491–1507. [Google Scholar] [CrossRef]
- Tiwari, R.K.; Gupta, A.K. Effect of dust and vehicular emissions on leaf area and biochemical constituents of road side herbs in Varanasi. Plant Arch. 2010, 10, 767–771. [Google Scholar]
- Lin, F.F.; Ding, X.D.; Fu, Z.P.; Deng, J.S.; Shen, Z.Q. Application of Mutual Information to Variable Selection in Diagnosis of Phosphorus Nutrition in Rice. Spectrosc. Spect. Anal. 2009, 29, 2467–2470. [Google Scholar]
- Liu, L.Y.; Zhang, S.; Zhang, B. Evaluation of hyperspectral indices for retrieval of canopy equivalent water thickness and gravimetric water content. Int. J. Remote Sens. 2016, 37, 3384–3399. [Google Scholar] [CrossRef]
- Escobedo, F.J.; Nowak, D.J. Spatial heterogeneity and air pollution removal by an urban forest. Landsc. Urban Plan. 2009, 90, 102–110. [Google Scholar] [CrossRef]
- Li, W.; Jiang, C.H.; Chen, Y.W.; Hyyppa, J.; Tang, L.L.; Li, C.R.; Wang, S.W. A Liquid Crystal Tunable Filter-Based Hyperspectral LiDAR System and Its Application on Vegetation Red Edge Detection. IEEE Geosci. Remote Sens. Lett. 2019, 16, 291–295. [Google Scholar] [CrossRef]
- Jiang, C.H.; Chen, Y.W.; Wu, H.H.; Li, W.; Zhou, H.; Bo, Y.M.; Shao, H.; Song, S.J.; Puttonen, E.; Hyyppä, J. Study of a High Spectral Resolution Hyperspectral LiDAR in Vegetation Red Edge Parameters Extraction. Remote Sens. 2019, 11, 2007. [Google Scholar] [CrossRef]
- Asner, G.P.; Martin, R.E.; Anderson, C.B.; Knapp, D.E. Quantifying forest canopy traits: Imaging spectroscopy versus field survey. Remote Sens. Environ. 2015, 158, 15–27. [Google Scholar] [CrossRef]
- Xuan, J. The effects of turbulence and complex terrain on dust emissions and depositions from coal stockpiles. Atmos. Environ. 1994, 28, 1951–1960. [Google Scholar] [CrossRef]
- Mahapatra, P.S.; Ray, S.; Das, N.; Mohanty, A. Urban air-quality assessment and source apportionment studies for Bhubaneshwar, Odisha. Theor. Appl. Climatol. 2013, 112, 243–251. [Google Scholar] [CrossRef]
© 2020 by the authors. Licensee MDPI, Basel, Switzerland. This article is an open access article distributed under the terms and conditions of the Creative Commons Attribution (CC BY) license (http://creativecommons.org/licenses/by/4.0/).