Article

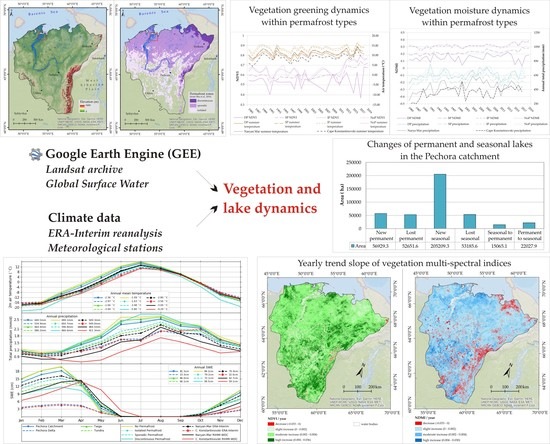
35 Years of Vegetation and Lake Dynamics in the Pechora Catchment, Russian European Arctic

by
Marinela-Adriana Cheţan
1,
Andrei Dornik
1,*,
Florina Ardelean
1,
Goran Georgievski
2,3,
Stefan Hagemann
3,
Vladimir E. Romanovsky
4,5,
Alexandru Onaca
1 and
Dmitry S. Drozdov
5,6
1
Department of Geography, West University of Timişoara, Blvd. V. Parvan 4, 300223 Timişoara, Romania
2
Alfred Wegener Institute, Helmholtz Centre for Polar & Marine Research, 27570 Bremerhaven, Germany
3
Helmholtz-Zentrum Geesthacht, Institute of Coastal Research, 21502 Geesthacht, Germany
4
Geophysical Institute, University of Alaska Fairbanks, Fairbanks, AK 99775, USA
5
International Centre of Cryology and Cryosophy, Tyumen State University, 625003 Tyumen, Russia
6
Institute of the Earth’s Cryosphere of Tyumen Scientific Center of Siberian Branch of Russian Academy of Sciences, 625000 Tyumen, Russia
*
Author to whom correspondence should be addressed.
Remote Sens. 2020, 12(11), 1863; https://doi.org/10.3390/rs12111863
Submission received: 7 May 2020 / Revised: 28 May 2020 / Accepted: 7 June 2020 / Published: 9 June 2020
(This article belongs to the Section Environmental Remote Sensing)

Abstract

:
High-latitude regions are a hot spot of global warming, but the scarce availability of observations often limits the investigation of climate change impacts over these regions. However, the utilization of satellite-based remote sensing data offers new possibilities for such investigations. In the present study, vegetation greening, vegetation moisture and lake distribution derived from medium-resolution satellite imagery were analyzed over the Pechora catchment for the last 35 years. Here, we considered the entire Pechora catchment and the Pechora Delta region, located in the northern part of European Russia, and we investigated the vegetation and lake dynamics over different permafrost zones and across the two major biomes, taiga, and tundra. We also evaluated climate data records from meteorological stations and re-analysis data to find relations between these dynamics and climatic behavior. Considering the Normalized Difference Vegetation Index (NDVI) and the Normalized Difference Moisture Index (NDMI) in the summer, we found a general greening and moistening of the vegetation. While vegetation greenness follows the evolution of summer air temperature with a delay of one year, the vegetation moisture dynamics seems to better concur with annual total precipitation rather than summer precipitation, and also with annual snow water equivalent without lag. Both NDVI and NDMI show a much higher variability across discontinuous permafrost terrain compared to other types. Moreover, the analyses yielded an overall decrease in the area of permanent lakes and a noticeable increase in the area of seasonal lakes. While the first might be related to permafrost thawing, the latter seems to be connected to an increase of annual snow water equivalent. The general consistency between the indices of vegetation greenness and moisture based on satellite imagery and the climate data highlights the efficacy and reliability of combining Landsat satellite data, ERA-Interim reanalysis and meteorological data to monitor temporal dynamics of the land surface in Arctic areas.

Graphical Abstract

1. Introduction

High-latitude regions have been subject to a rapidly increasing air temperature during the last three decades. This warming is twice as fast as the global average [1] and acts as a driver of Arctic changes [2]. The elements of the terrestrial cryosphere are highly affected by climate change and experience faster changes than any other regions around the globe [2]. These areas are particularly important as they represent a ‘bellwether of change’ and the arctic terrestrial ecosystems exhibit strong feedbacks related to the energy budget and the concentration of greenhouse gases [3].
In this context, the arctic permafrost (ground with the temperature remaining at or below 0 °C for at least two consecutive years), which is the most critical component of the terrestrial cryosphere and an essential climate variable, is extremely sensitive to climatic changes, mainly to the increasing trend of temperature [4]. The air temperature increase may significantly affect permafrost in large areas, even if the growth is only 2 °C by the end of the century [5]. In the last three decades, an increase of the permafrost temperature has been documented in all high latitude regions of Russia, Alaska and Canada [6,7]. A recent assessment of a global data set of permafrost temperature time series from the Global Terrestrial Network for Permafrost indicates that the ground temperature near the depth of zero annual amplitude increased up to ~0.39 °C during the referenced decade 2007–2016 [8].
Consequently, permafrost degradation generates irreversible changes in the plant species composition and distribution [9,10], hydrological system [11], soil processes [12] and it affects the infrastructure and local communities [13,14]. Numerous studies have documented that permafrost degradation processes are becoming more frequent and intensive in the Arctic in the last decades [15,16] and the geocryological risks are the highest in regions such as northern West Siberia or northern European Russia [17].
Changes in surface and ground-water distribution have been documented to be related to changes in active layer thickness or temperature of permafrost at different depths [18]. For example, changes in the number of lakes, lakes area and spatial distribution, expanding or shrinking features, have been documented across the Arctic region [19,20]. These changes were associated with changes in temperature, precipitation and snow cover with different patterns as a function of the underlying terrain [21]. According to the estimates of Zhiliba et al. [22], Western Siberia contains about a quarter of the world’s volume of methane in landscapes with numerous thermokarst lakes that are sensitive to the increase of air temperature, being an indicator of global warming in remote sensing studies.
Moreover, vegetation changes, especially in tundra biomes, have been related to the increase in summer temperatures [20,23]. The response of high-latitude vegetation to the rising air temperatures indicates a greening (spectral greening) trend in most of the previously investigated regions [24,25,26,27,28,29]. Furthermore, the Intergovernmental Panel on Climate Change (IPCC) agrees that Arctic greening is an undeniable example of climate change impact on Arctic landscapes [30].
Field studies in large river basins that also cover Arctic regions are limited due to their large extent and difficult accessibility. Thus, the availability of free remote sensing data and the new emerging computation techniques can overcome this shortcoming and might help to improve knowledge in these areas, both in temporal extent and at different spatial scales. This is also the case for the Pechora river catchment, located in the European part of Russia. The catchment is a naturally preserved ecosystem, and it covers both permafrost and non-permafrost terrain. In the present study, we used remote sensing data to assess vegetation and surface water (lakes) changes across different biomes and permafrost zones as well as the possible underlying factors that influence the spatio-temporal changes in the last 35 years. Here, we use data from the Landsat archive that relatively recently has become an essential resource for the analysis of landscape changes at multiple scales [31]. Using the Landsat satellite images archive, we aim to analyze the spatio-temporal changes in vegetation greenness and moisture, and in the distribution of lakes, relating them to trends of climatic parameters, estimated from ERA-Interim meteorological reanalysis and meteorological observations within the Pechora catchment.

2. Materials and Methods
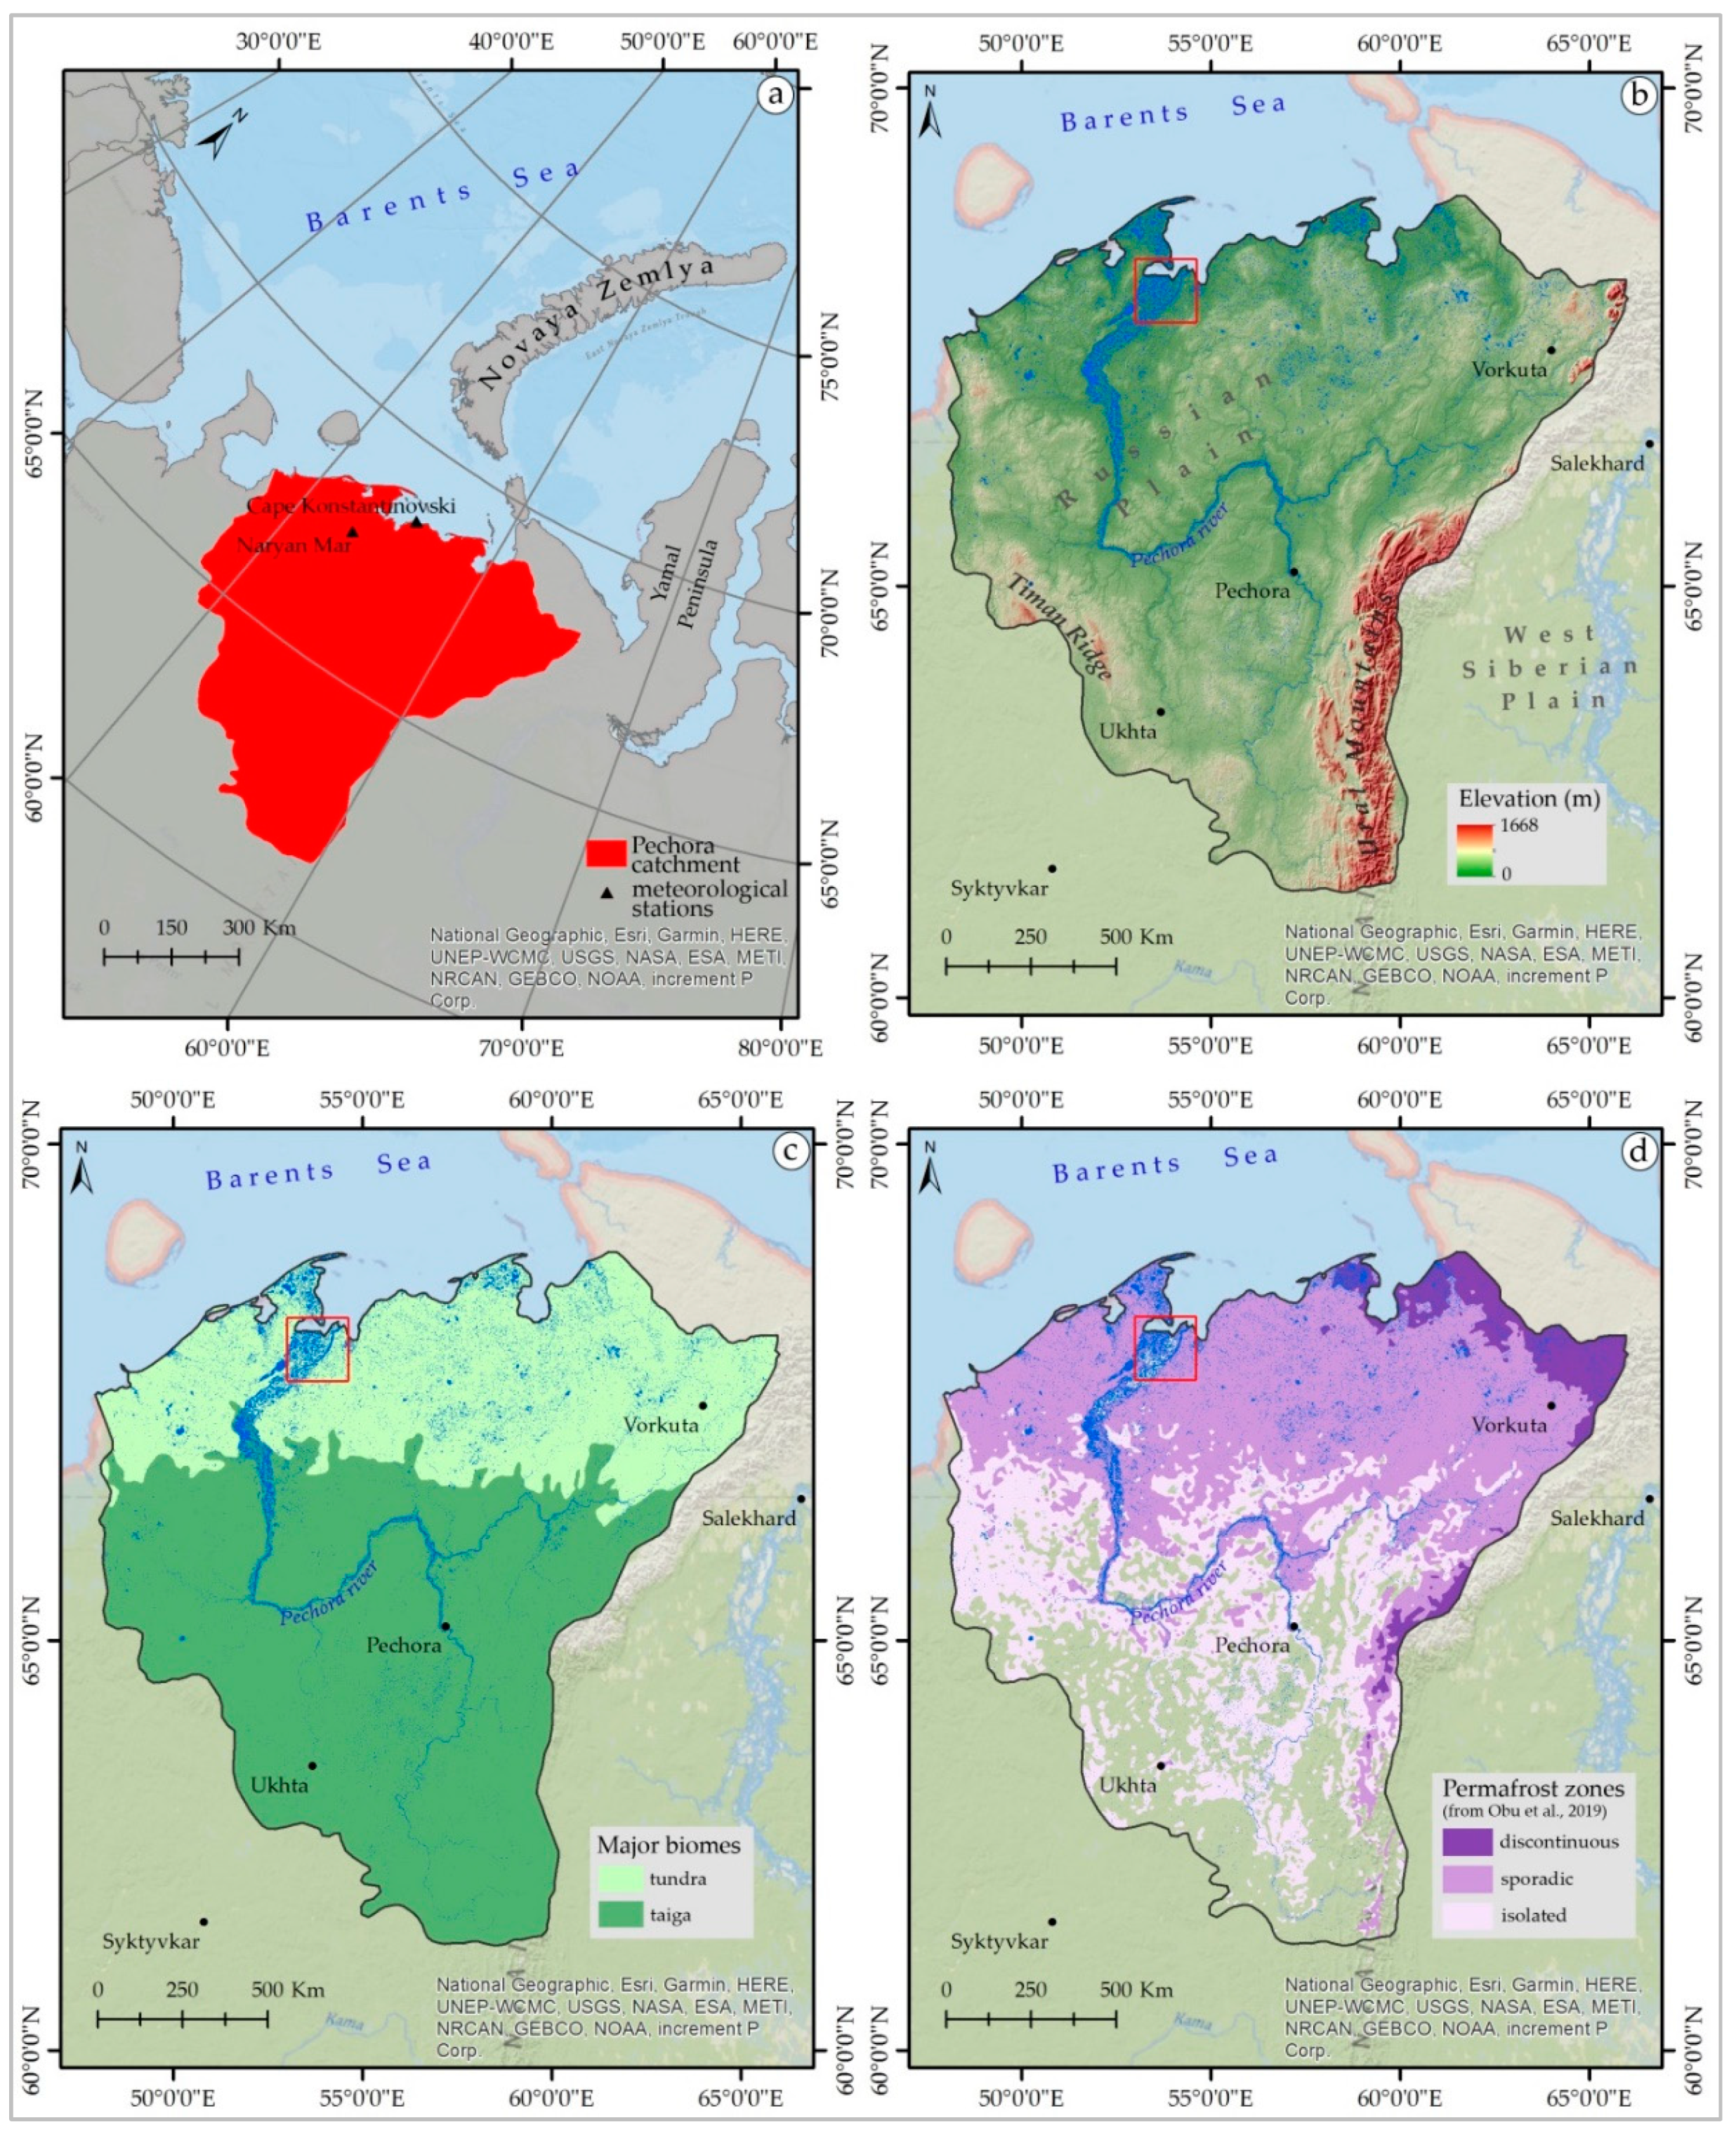
Changes of vegetation and lake distribution in correlation with climatic changes have been analyzed over the entire Pechora catchment and the Pechora Delta for the period 1985 to 2019. Climatologies for the various regions estimated from ERA-Interim data [32] are calculated for the period 1979–2018, while data from the meteorological station Naryan-Mar and Cape Konstantinovski operated by Russian hydrometeorological observation network were available for period 1970–2017 (downloaded from http://meteo.ru/ site). The possible variations in landscape feature behavior over time, was analyzed within each zone of permafrost according to the permafrost zonation model of Obu et al. [33] (discontinuous, sporadic, isolated and permafrost free areas), and within essential biomes (tundra and taiga). The biomes were extracted from Circumpolar Arctic Coastline and Treeline Boundary, part of the Circumpolar Arctic Vegetation Map (CAVM), published at 1:7,500,000 scale as the first vegetation map of an entire global biome [34].

2.1. Study Area

The Pechora catchment is located in the north-eastern extremity of the East European Plain (Russian Plain) and European Russia, limited by the Ural Mountains to the east and the Timan range to the west, and covering 404,338 km2 (Figure 1a,b). The catchment is characterized by shrub-dominated tundra in the north, and taiga in the south, containing still large areas of pristine forests, which is considered as one of the essential boreal forests that still exist (Figure 1c) [35]. The catchment contains 6 million ha of protected areas with several large protected areas like the Komi Virgin Forest Reserve, which is a UNESCO World’s heritage site and forms with 3.47 million ha the largest protected taiga forest in the world [35]. The climate is continental subarctic. Analysis of climatic parameters (Figure 2) calculated from ERA-Interim reanalysis [32] shows good agreement with hydrometeorological observations operated by the Roshydromet observation network (Russian Institute of Hydrometeorological Information—World Data Center, RIHMI-WDC). According to ERA-Interim spatially averaged for the Pechora catchment, the coldest and the warmest long-term (1979–2018) average months are January (−18.4 °C) and July (14.7 °C), while at the Naryan-Mar (67°38′N 53°02′E) station long term averaged January and July temperature amounted −17.8 °C, and 13.5 °C, respectively. At the Cape Konstantinovski (68°33′N 55°30′E) station the coldest long term averaged month is February (−17.6 °C), and the warmest is July (10.8 °C). Pechora catchment averaged annual mean temperature is −2.4 °C, at Naryan-Mar and Cape Konstantinovski stations are −3 °C and −4.3 °C, respectively (Figure 2).
The southern part of the catchment show average annual air temperature above −2 °C [36]. The amount of annual precipitation sums to 484.5 mm at Naryan-Mar and 411.3 mm at Cape Konstantinovski (Figure 2). However, the annual precipitation varies with location (e.g., annual precipitation amounted 640.5 mm spatially averaged for the Pechora catchment area, in the taiga area 664.4 mm while in tundra 586.2 mm, according to ERA-Interim) (Figure 2). These results are in good agreement with previously estimated by Van der Sluis et al. [37], who estimate a range of 650–750 mm/year in the taiga, and more than 1200 mm/year in the highest parts of the Ural Mountains. The Pechora catchment is a neotectonic structural lowering area characterized by peatlands favored by biogenic soils and thermokarst lakes. At the same time, bogs occur only in the sub-zone of discontinuous permafrost [36], with various shares of underground runoff in the total runoff, ranging between 10 and 60 %, the lowest underground runoff being found in the tundra forced by the presence of permafrost [37]. The landscapes of this area experienced relatively low anthropogenic-induced ecological impacts and disturbances, however, the potential for extensive environmental degradation is now greater than ever before, due to the plans for this region to become one of the primary oil and gas and other natural resources center for Russia [38,39]. Three-quarters of this area is covered by different types of permafrost (according to the permafrost zonation model of Obu et al. [33]) with approximately 4.5% of discontinuous permafrost mostly in the north-eastern part of the area, 39.5% of sporadic and 29% of isolated permafrost (Figure 1d).
The second study area focuses on the Pechora Delta with an additional buffer zone and covers 18,133 km2, being a sub-region of the Pechora catchment. The delta has a length of 120 km, a total area of around 2900 km2 and with an elevation range less than 6 m. A floodplain dominates the entire area characterized by numerous channels and lakes [40] as well as depressions occupied by polygonal peatlands and fens with peat thickness ranging from 0.5 to 5 m [41]. As permafrost develops more under convex and flat surfaces, the permafrost table is deeper in valleys that are usually dry and drained by streams, so that the area is geocryologically unstable [41]. Besides, the Pechora delta is an important breeding area and stopover site for migratory birds.

2.2. Vegetation Dynamics Analysis

The Landsat archive was utilized to select satellite images from missions 5, 7, and 8. Surface reflectance images with 30 m spatial resolution were chosen between 1985 and 2019. The peak of vegetation phenology was analyzed using only images from the summer season (July–August) [20,42,43] since the first snowfalls start from September in the Pechora catchment. 906 satellite images from Landsat 5, 172 from Landsat 7 and 126 from Landsat 8 mission were used in this study. The image collection in each year, comprising a various number of satellite images, was subjected to median temporal reduction to obtain one image per year. Every pixel in the final image holds the median value from the stack of pixels (one from each image). This process led to a satellite image covering the entire study area for 30 out of 35 analyzed years, containing the following spectral bands: blue, green, red, near-infrared, short-wave infrared 1 and short-wave infrared 2.
From Landsat spectral bands, two normalized indices were derived that illustrate the consistency of green vegetation and vegetation moisture [44].
Normalized Difference Vegetation Index (NDVI), developed by Rouse et al. (1974) [45], illustrates the greenness of vegetation, or more precisely, the magnitude of photosynthetic activity. The negative values, close to −1, correspond to water. Values close to zero generally correspond to areas without vegetation (rocks, sand). Positive low values (between 0.2 and 0.4), represent shrubs and meadows, and high values indicate the presence of forests. The formula uses the red (RED) and near-infrared (NIR) bands:
NDVI   = NIR RED NIR + RED
Normalized Difference Moisture Index (NDMI) shows the moisture differences of the land surface, being highly correlated with the water content of the vegetation and is a good indicator of vegetation change, especially in forest applications [46]. NDMI is calculated using the near-infrared (NIR) and the short-wave infrared 1 (SWIR 1) bands, according to the following formula:
NDMI   =   NIR SWIR1 NIR + SWIR1
The analysis was conducted using the cloud computing capabilities of the Google Earth Engine (GEE) with two aims. First, the vegetation indices were aggregated to annual averages of the summer season, resulting in charts illustrating their temporal evolution and trends between 1985 and 2019, within different geographical areas. Second, the slope coefficient of the linear regression was mapped within each pixel using the 30 image stack of vegetation indices. The maps reveal spatial general trends and dynamics of the vegetation, detecting the direction and magnitude of change over time, expressed as change of vegetation indices value per year. The linear regression method was used in many remote sensing studies, using time as the independent variable and vegetation indices as the dependent variable [47].

2.3. Lake Dynamics Analysis
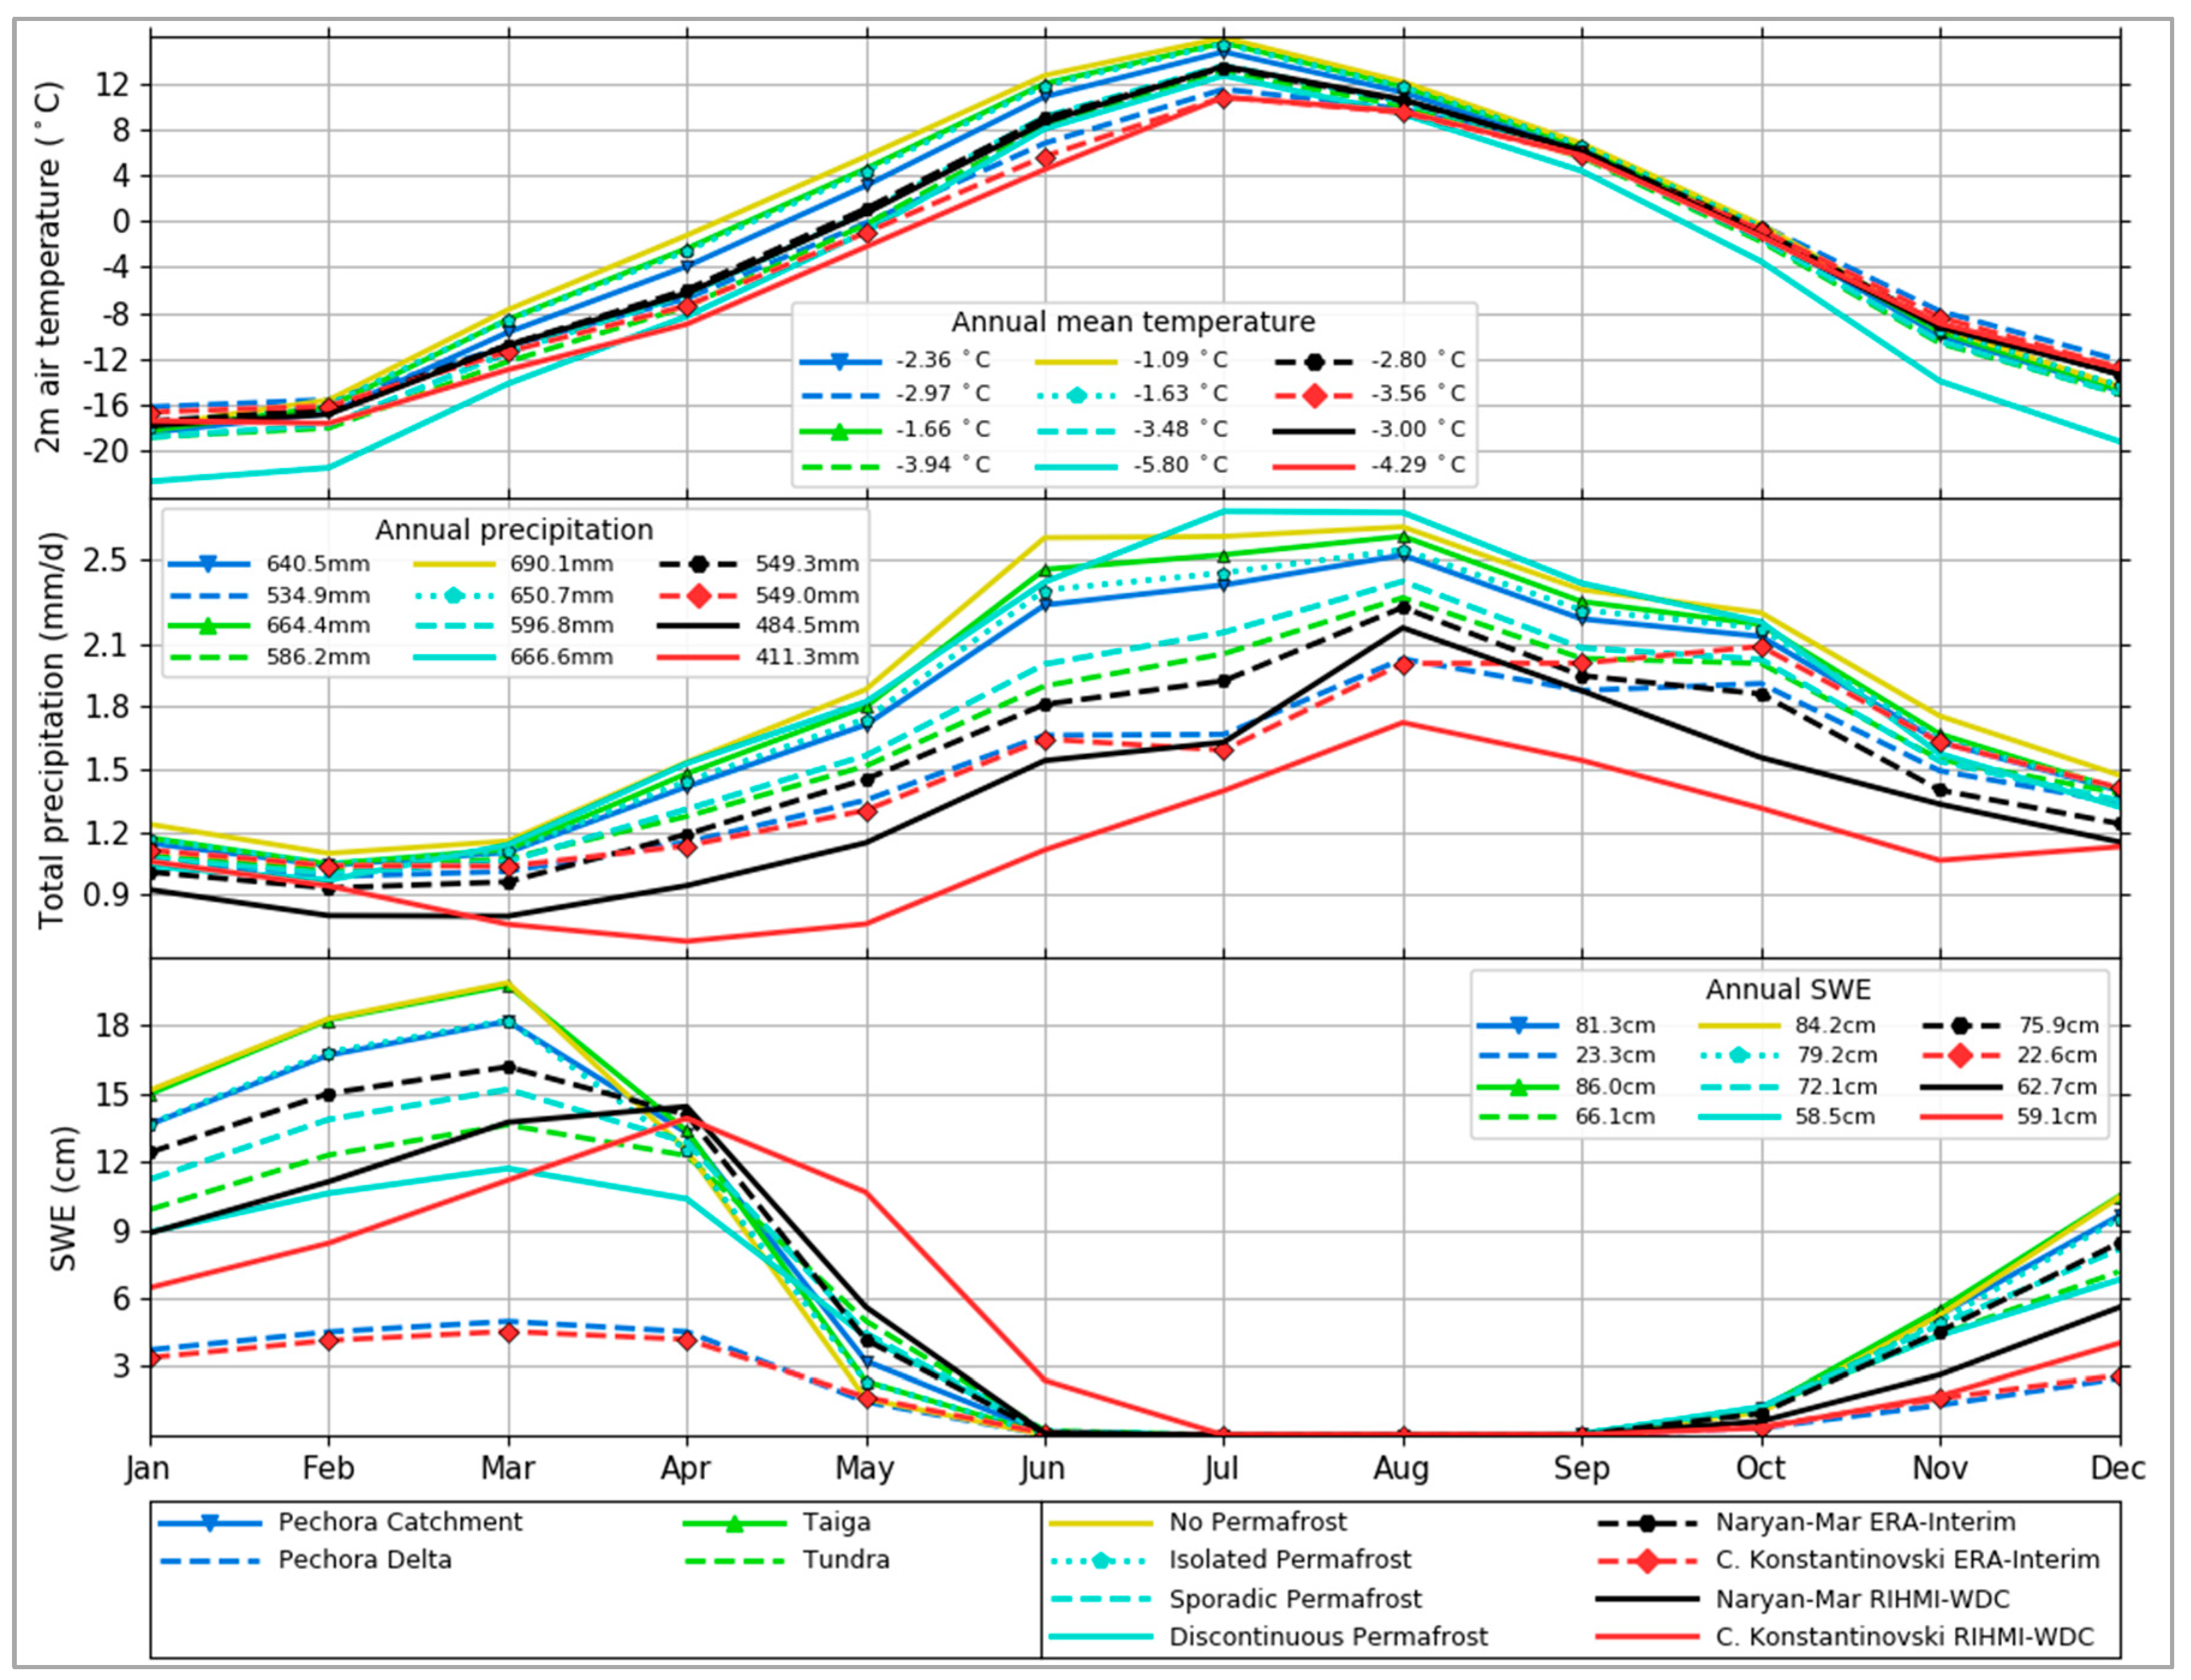
The Global Surface Water dataset contains maps with the spatial and temporal distribution of surface water from 1984 to 2018 at 30 m resolution [48]. It was developed within the Copernicus program by the Joint Research Centre (JRC) and was generated by using 3,865,618 Landsat 5, 7 and 8 scenes acquired between 16 March 1984 and 31 December 2018. Each pixel was individually classified into water or land using an expert classification, and the results were compressed into a monthly archive for the entire time period [48].
From this dataset, we used transitions which provide information on the change in seasonality between the first and last year of the analyzed period and capture changes between the three classes of seasonal water, permanent water and others/no water [49]. The dataset contains raster data with mapped transitions: unchanging (stable) permanent water surfaces; new permanent water surfaces (conversion of land into permanent water); lost permanent water surfaces (conversion of permanent water into land); unchanging seasonal water surfaces; new seasonal water surfaces (conversion of land into seasonal water); lost seasonal water surfaces (conversion of seasonal water into land); conversion of permanent water into seasonal water; and the conversion of seasonal water into permanent water. These conversions refer to changes in state from the beginning and end of the time series and, therefore, do not describe the changes in the intervening years [49].
The raster dataset was resampled to a spatial resolution of 43 m, due to GEE user computation limits. The resolution was decreased stepwise from 30 m to minimize the information loss. In order to analyze only the changes related to lakes, the transitions dataset was processed by buffer analysis to remove all watercourses and changes adjacent to them. The freely accessible watercourses dataset was provided by OpenStreetMap [50]. In the absence of a lake area at the beginning of the time interval, the percentage was calculated from the total area of the region of interest. This analysis is a relevant indicator, particularly for areas with ice-rich permafrost, knowing that one important element specific to permafrost degradation is the dynamics of thermokarst lakes [19,21].

2.4. Climatic Data

The identified dynamics of vegetation greening and moisture, as well as the dynamics of lakes, were analyzed concerning climatic data from ERA-Interim atmospheric reanalysis [32] and meteorological observations at the Naryan-Mar (67.63°N, 53.03°E) and Cape Konstantinovski (68.55°N, 55.42°E) stations, located within Pechora catchment. Atmospheric reanalysis is a technique of assimilation of historical climatic data by means of numerical circulation models with the aim to remove eventual physical inconsistencies due to deficiency of meteorological observations (e.g., sparse distribution of meteorological stations or shortcomings of observational techniques). In this study ERA-Interim is used following recommendations by Lindsay et al. (2014) [51], suggesting that ERA-Interim in comparison to other reanalysis products stands out as being consistent with independent observations for applications in high northern latitudes. The spatial resolution of ERA-Interim is approximately 80 km (~0.75° or T255 spectral grid), and various climatic parameters describing atmospheric as well as land-surface conditions are available at 3 and 6-hourly temporal resolutions. Dee et al. (2011) [32] provide a detailed description of the numerical model, data assimilation method, and input datasets used to produce the ERA-Interim reanalysis. ERA-Interim data are available at https://www.ecmwf.int/en/forecasts/datasets/reanalysis-datasets/era-interim. In this study, we were using monthly means of 2 m air temperature, total precipitation, and snow water equivalent (SWE). These climatic parameters are spatially averaged for the discontinuous, sporadic, isolated, and permafrost free areas, as well as for essential biomes (tundra and taiga). Seasonal cycle for each region is shown on Figure 2, complemented with annual climate provided in tables for each variable. In addition to these spatially averaged regions, we have considered ERA-Interim grid points for geolocations of Naryan-Mar and Cape Konstantinovski meteorological station and compared the respective gridded data with hydrometeorological observations conducted at these two stations operated by RIHMI-WDC. Snow depth measurements are available from the RIHMI-WDC stations, while ERA-Interim contains information about SWE. To compare these two parameters, snow depths are converted into SWE by using snow density climatological values for the Russian tundra estimated by Zhong et al. [52]. Our analysis shows a good agreement of the seasonal cycle between ERA-Interim and observations (Figure 2). In particular, the 2 m air temperature of ERA-Interim reanalysis agrees well with the measured values from the meteorological stations available in the Pechora catchment area, while precipitation and SWE show more considerable uncertainties. Small bias and high correlation between observed 2 m air temperature and corresponding ERA-Interim gridded values is a consequence of the ERA-Interim assimilation method i.e., its optimal interpolation scheme [32] that uses the observed 2 m temperature and background temperatures from the previous analysis time step to calculate current time step temperature.
On the other hand, discrepancies between ERA-Interim and observed precipitation and SWE indicate challenges related to the representation of the hydrological cycle in atmospheric reanalysis as well as limitations of observational techniques. A possible explanation for this might be that the ratio between snowfall and rainfall in reanalysis precipitation components depends on the model physics. In contrast, precipitation measurements may be affected by wind resulting in reduced precipitation catch accuracy (e.g., raindrops and especially snow blown away from gauges typically lead to an underestimation of the actual precipitation values). There are, however, other possible explanations related to uncertainty of SWE and snow density estimated by the snow model in the process of data assimilation of atmospheric reanalysis [53], as well as random and systematic errors occurring during routine snow surveys [52]. Nevertheless, it is widely accepted that atmospheric reanalyses contain the most consistent information on historic climate. However, comparison with observation is necessary to estimate the range of possible errors. Our analysis confirms previous findings [51] that ERA-Interim data are suitable for high-northern latitudes applications.
The monthly air temperature at 2 m estimated ERA-Interim, between 1979 and 2018, was aggregated to annual summer temperature (June, July, and August) and annual average temperature. The monthly precipitation and snow water equivalent were aggregated to the summer total and annual total. These monthly, summer and annual climatic data was estimated across the analyzed areas (Pechora catchment and the Pechora delta within different permafrost types and major biomes) and compared with the satellite data observations on vegetation characteristics and lakes.
Cross-correlation function (CCF) implemented in R software was used to identify time series correlations and lags between climate parameters and vegetation greenness and moisture. The correlation coefficient (R-coefficient) and statistical significance were used to reveal relationships of time series data. Within Pechora catchment and delta, the time series data tables containing average NDVI and NDMI values each year and the corresponding annual summer temperature, annual average temperature, annual summer precipitation, annual total precipitation, and annual total snow water equivalent were used to conduct CCF analysis.

3. Results

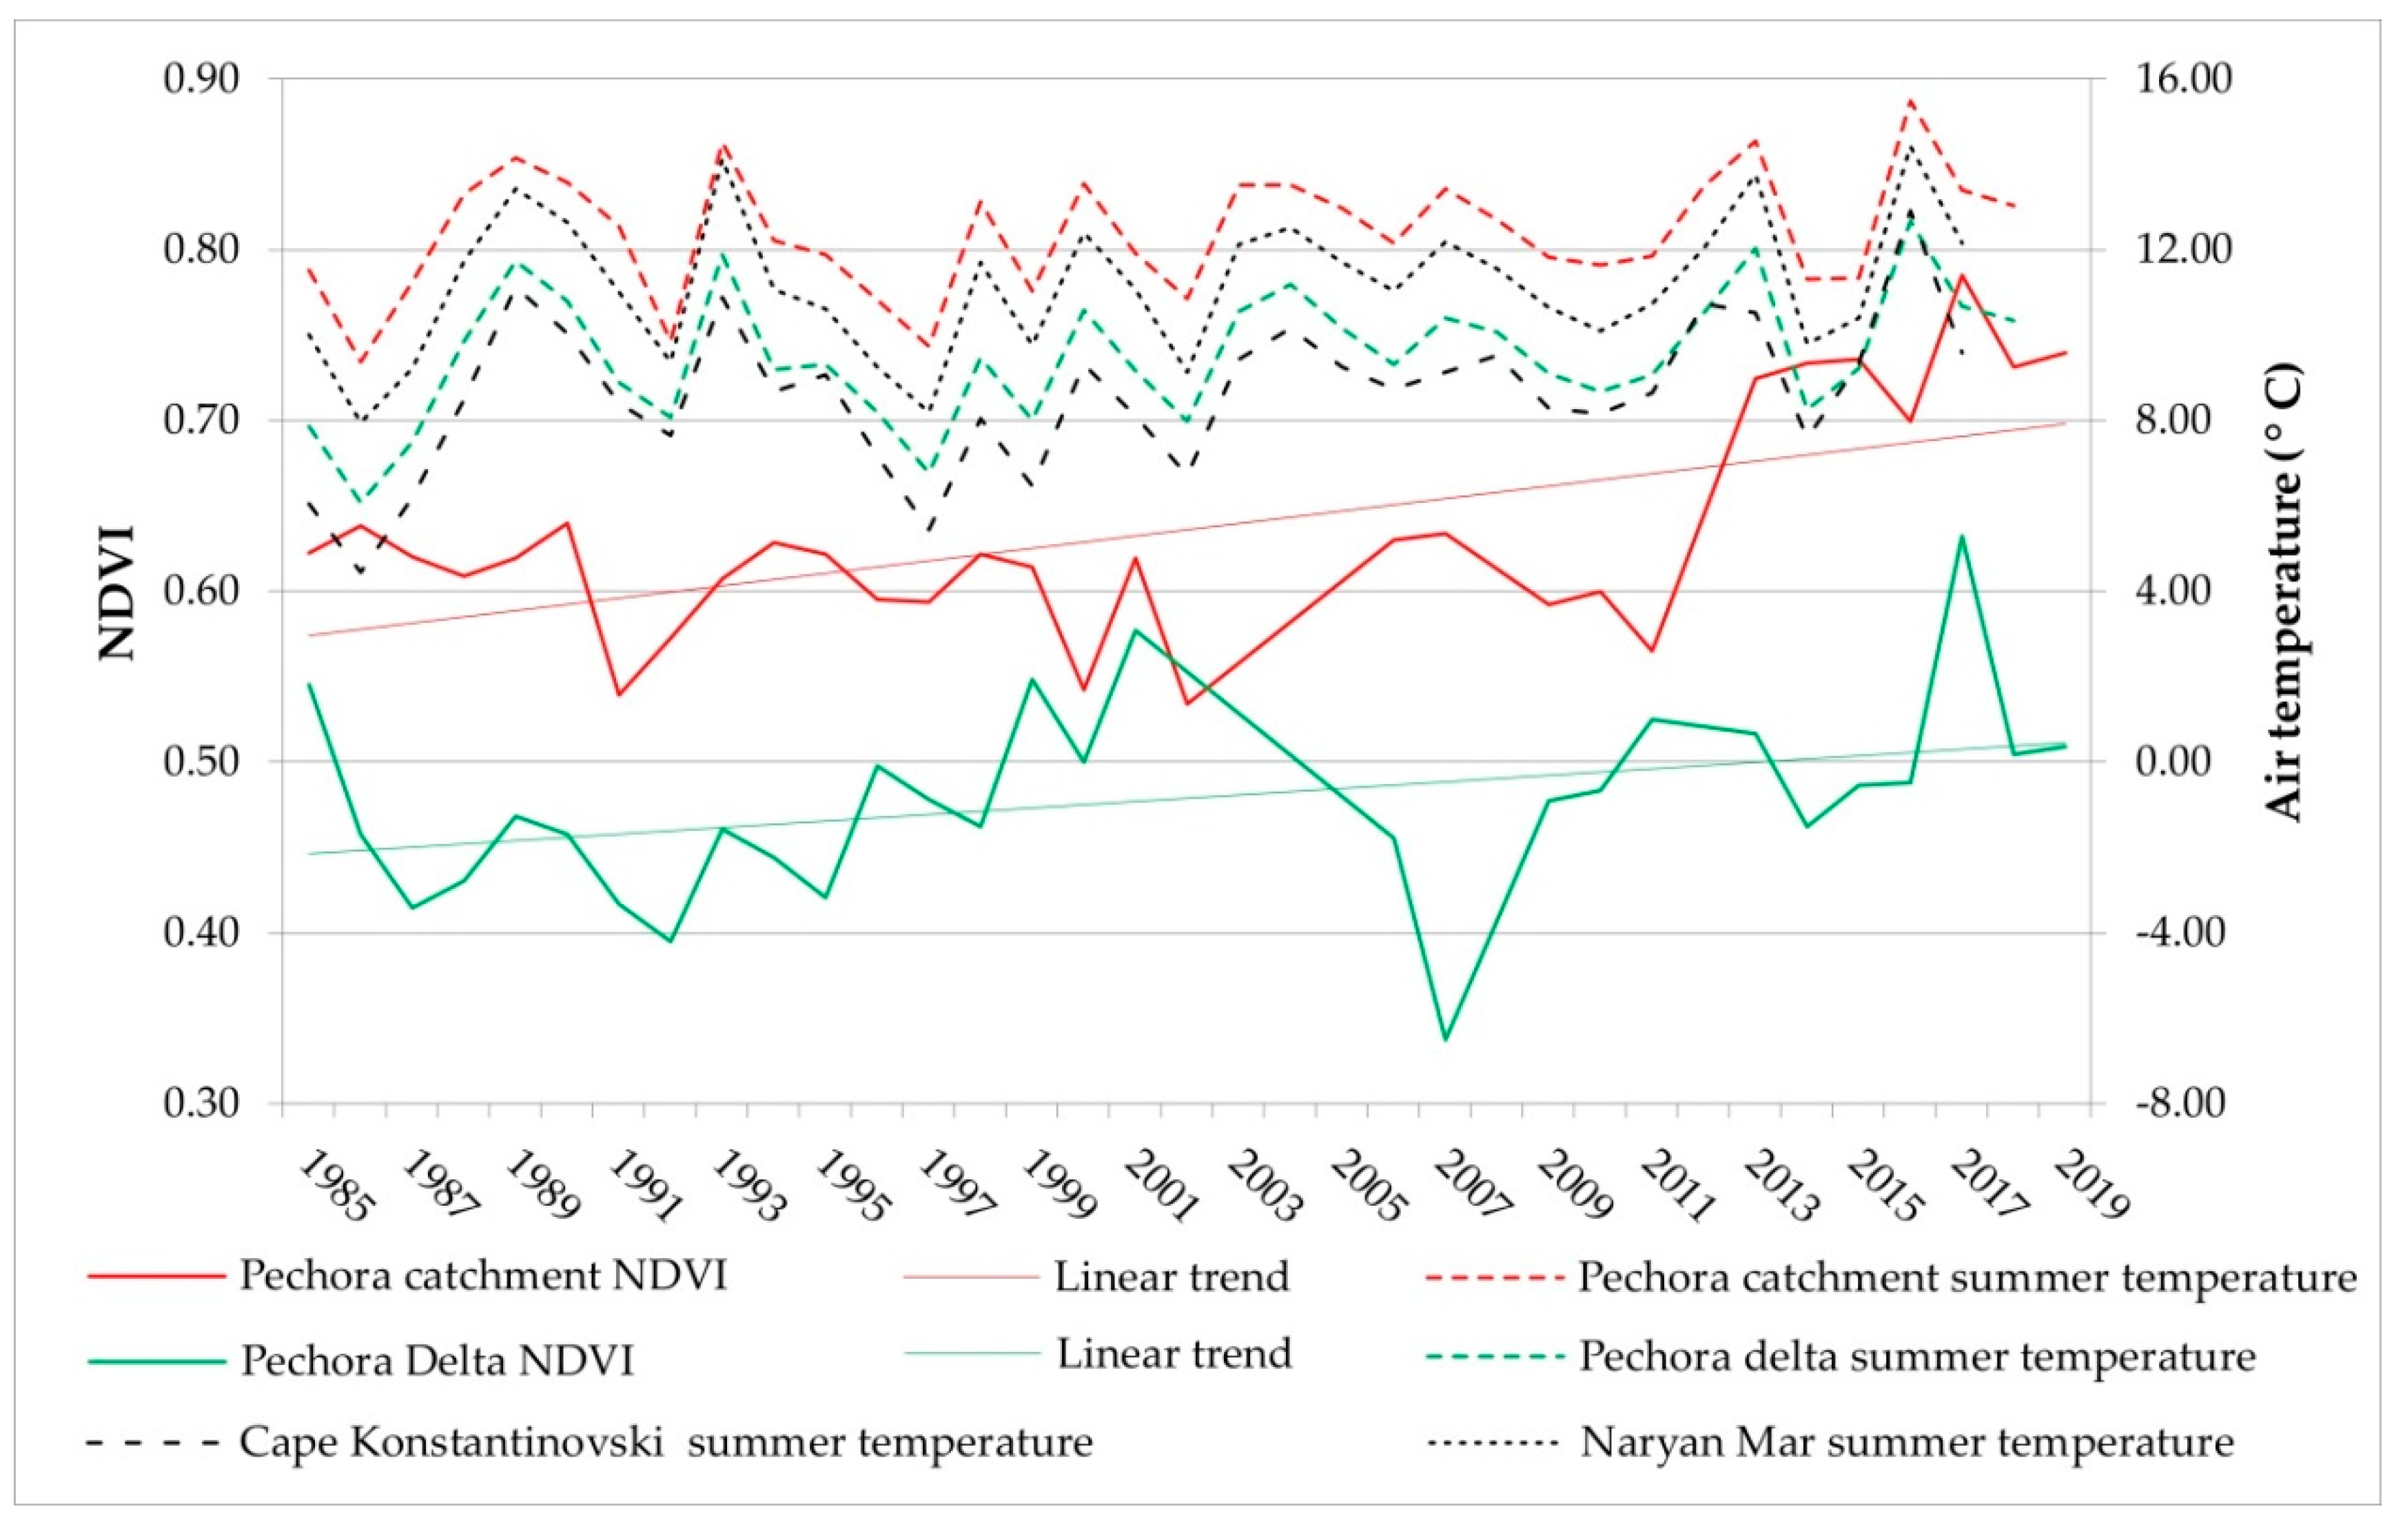
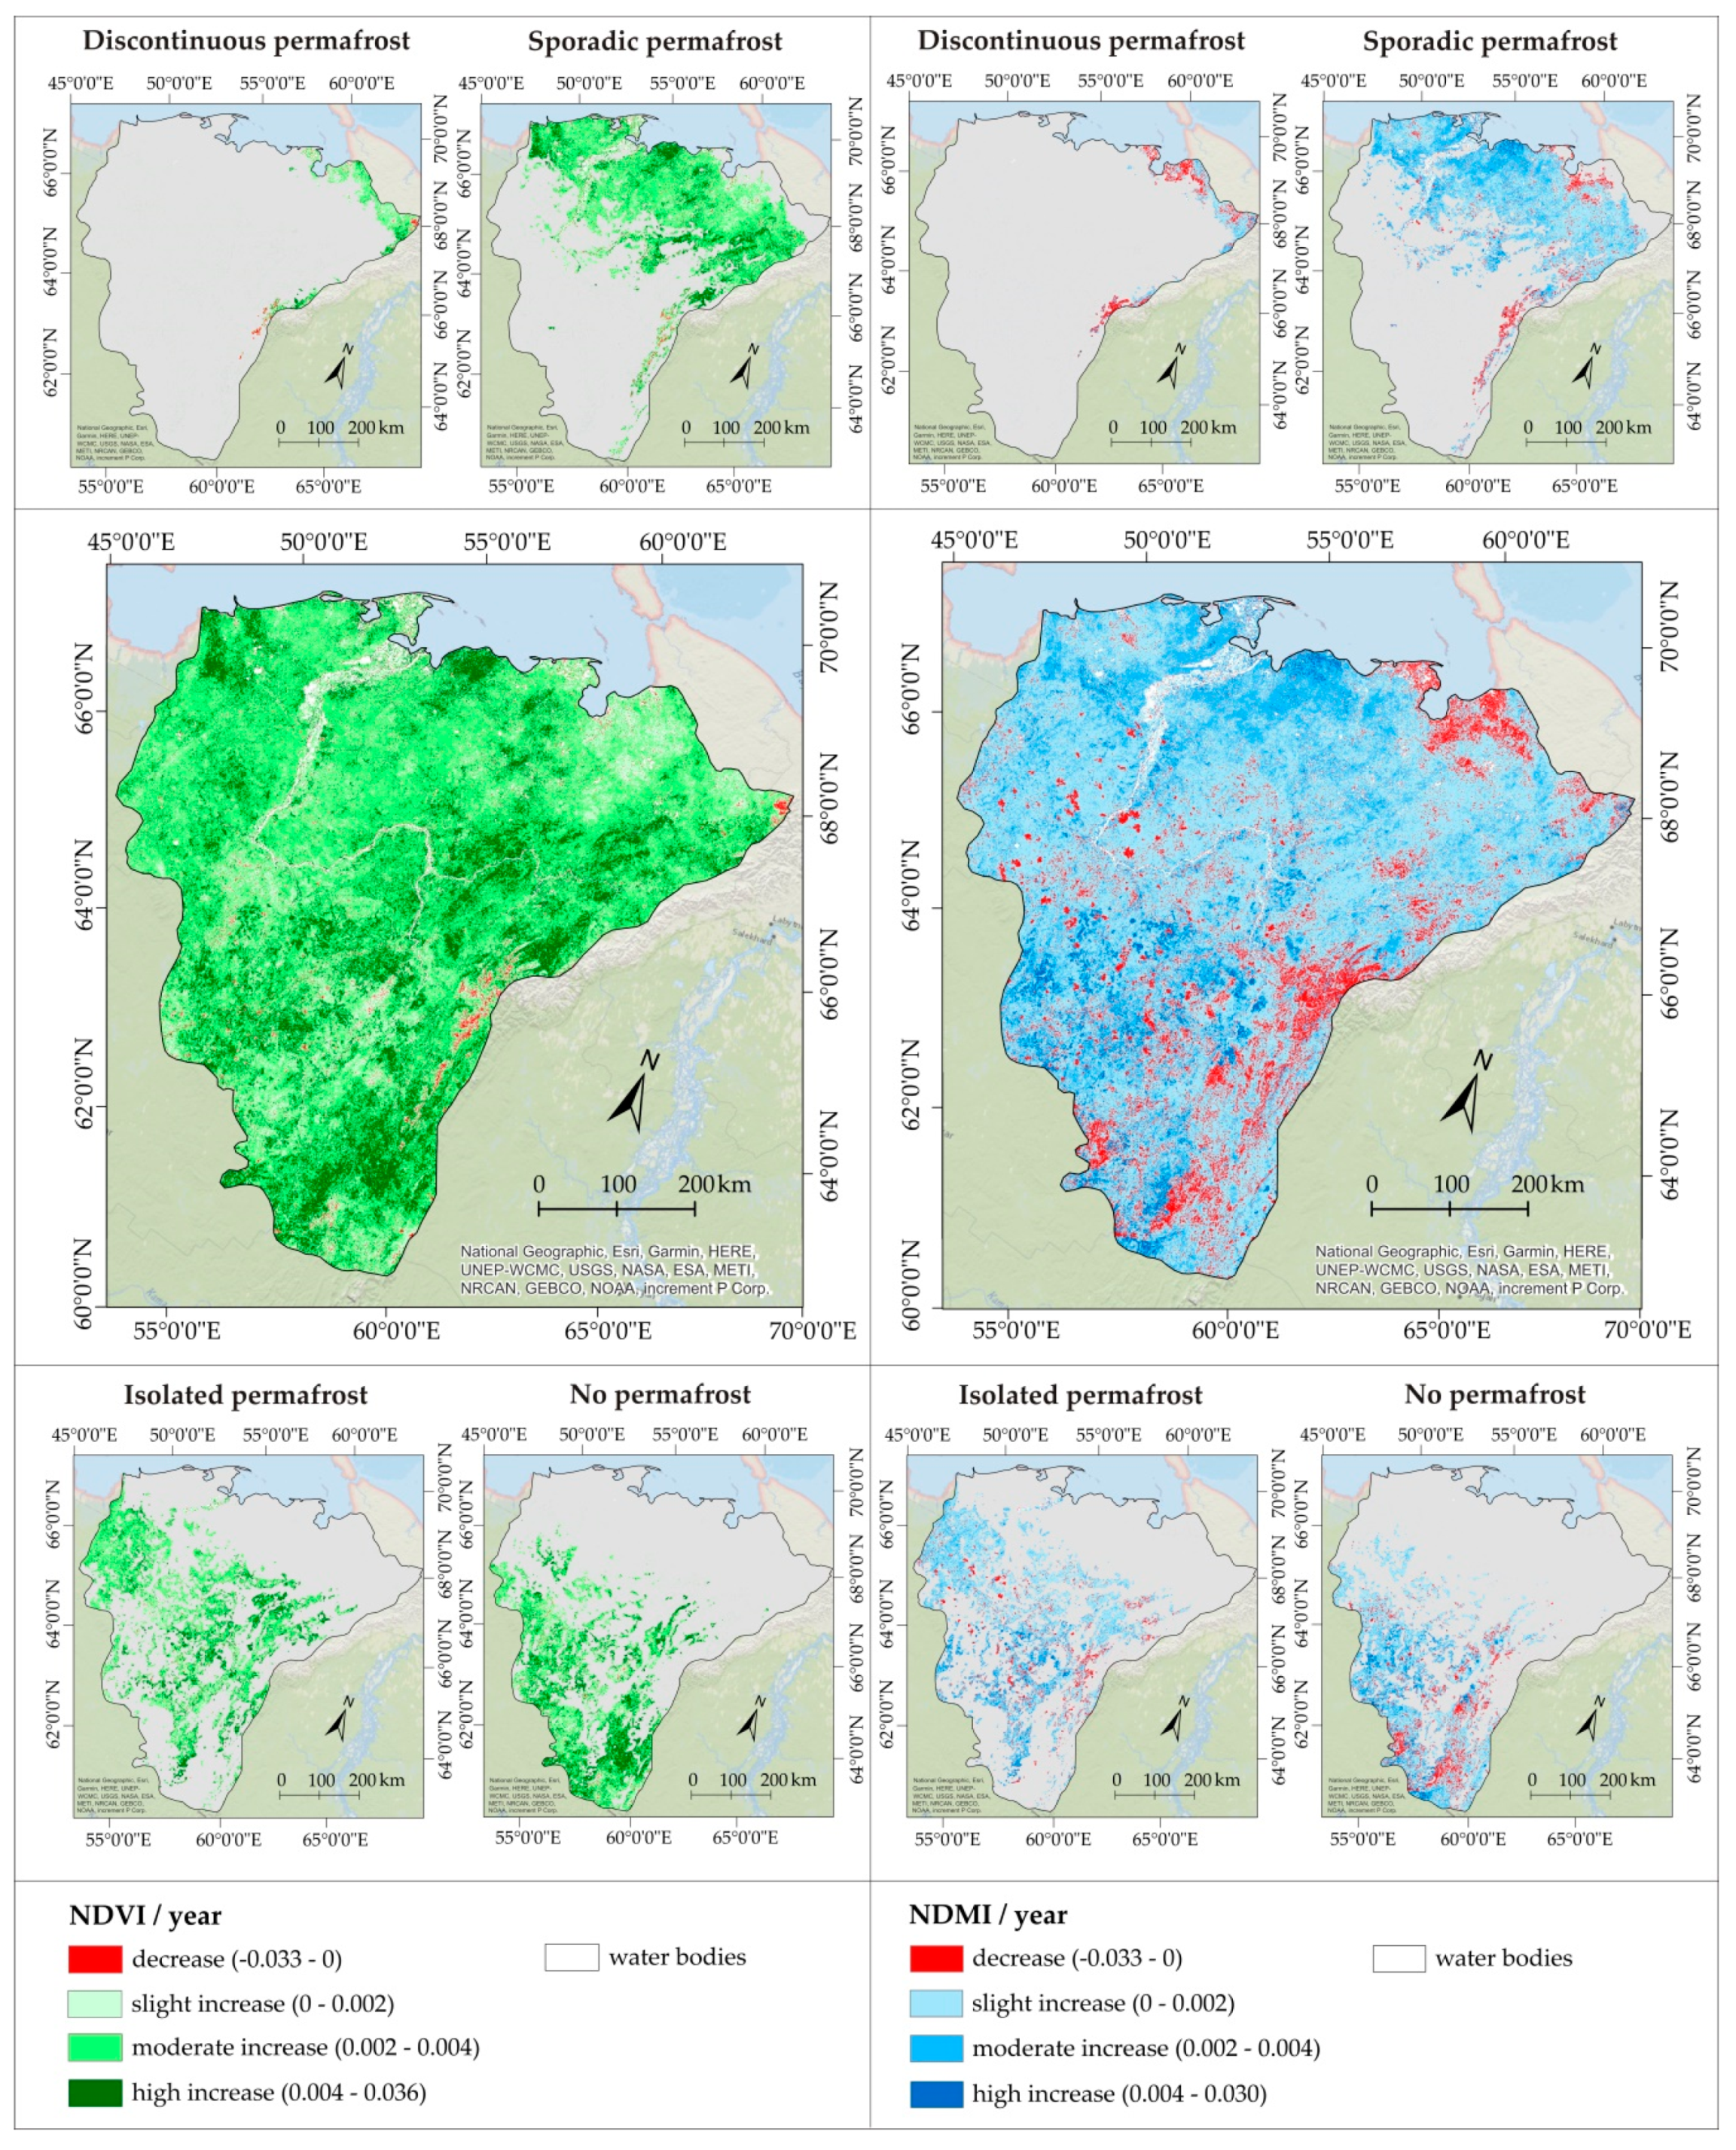
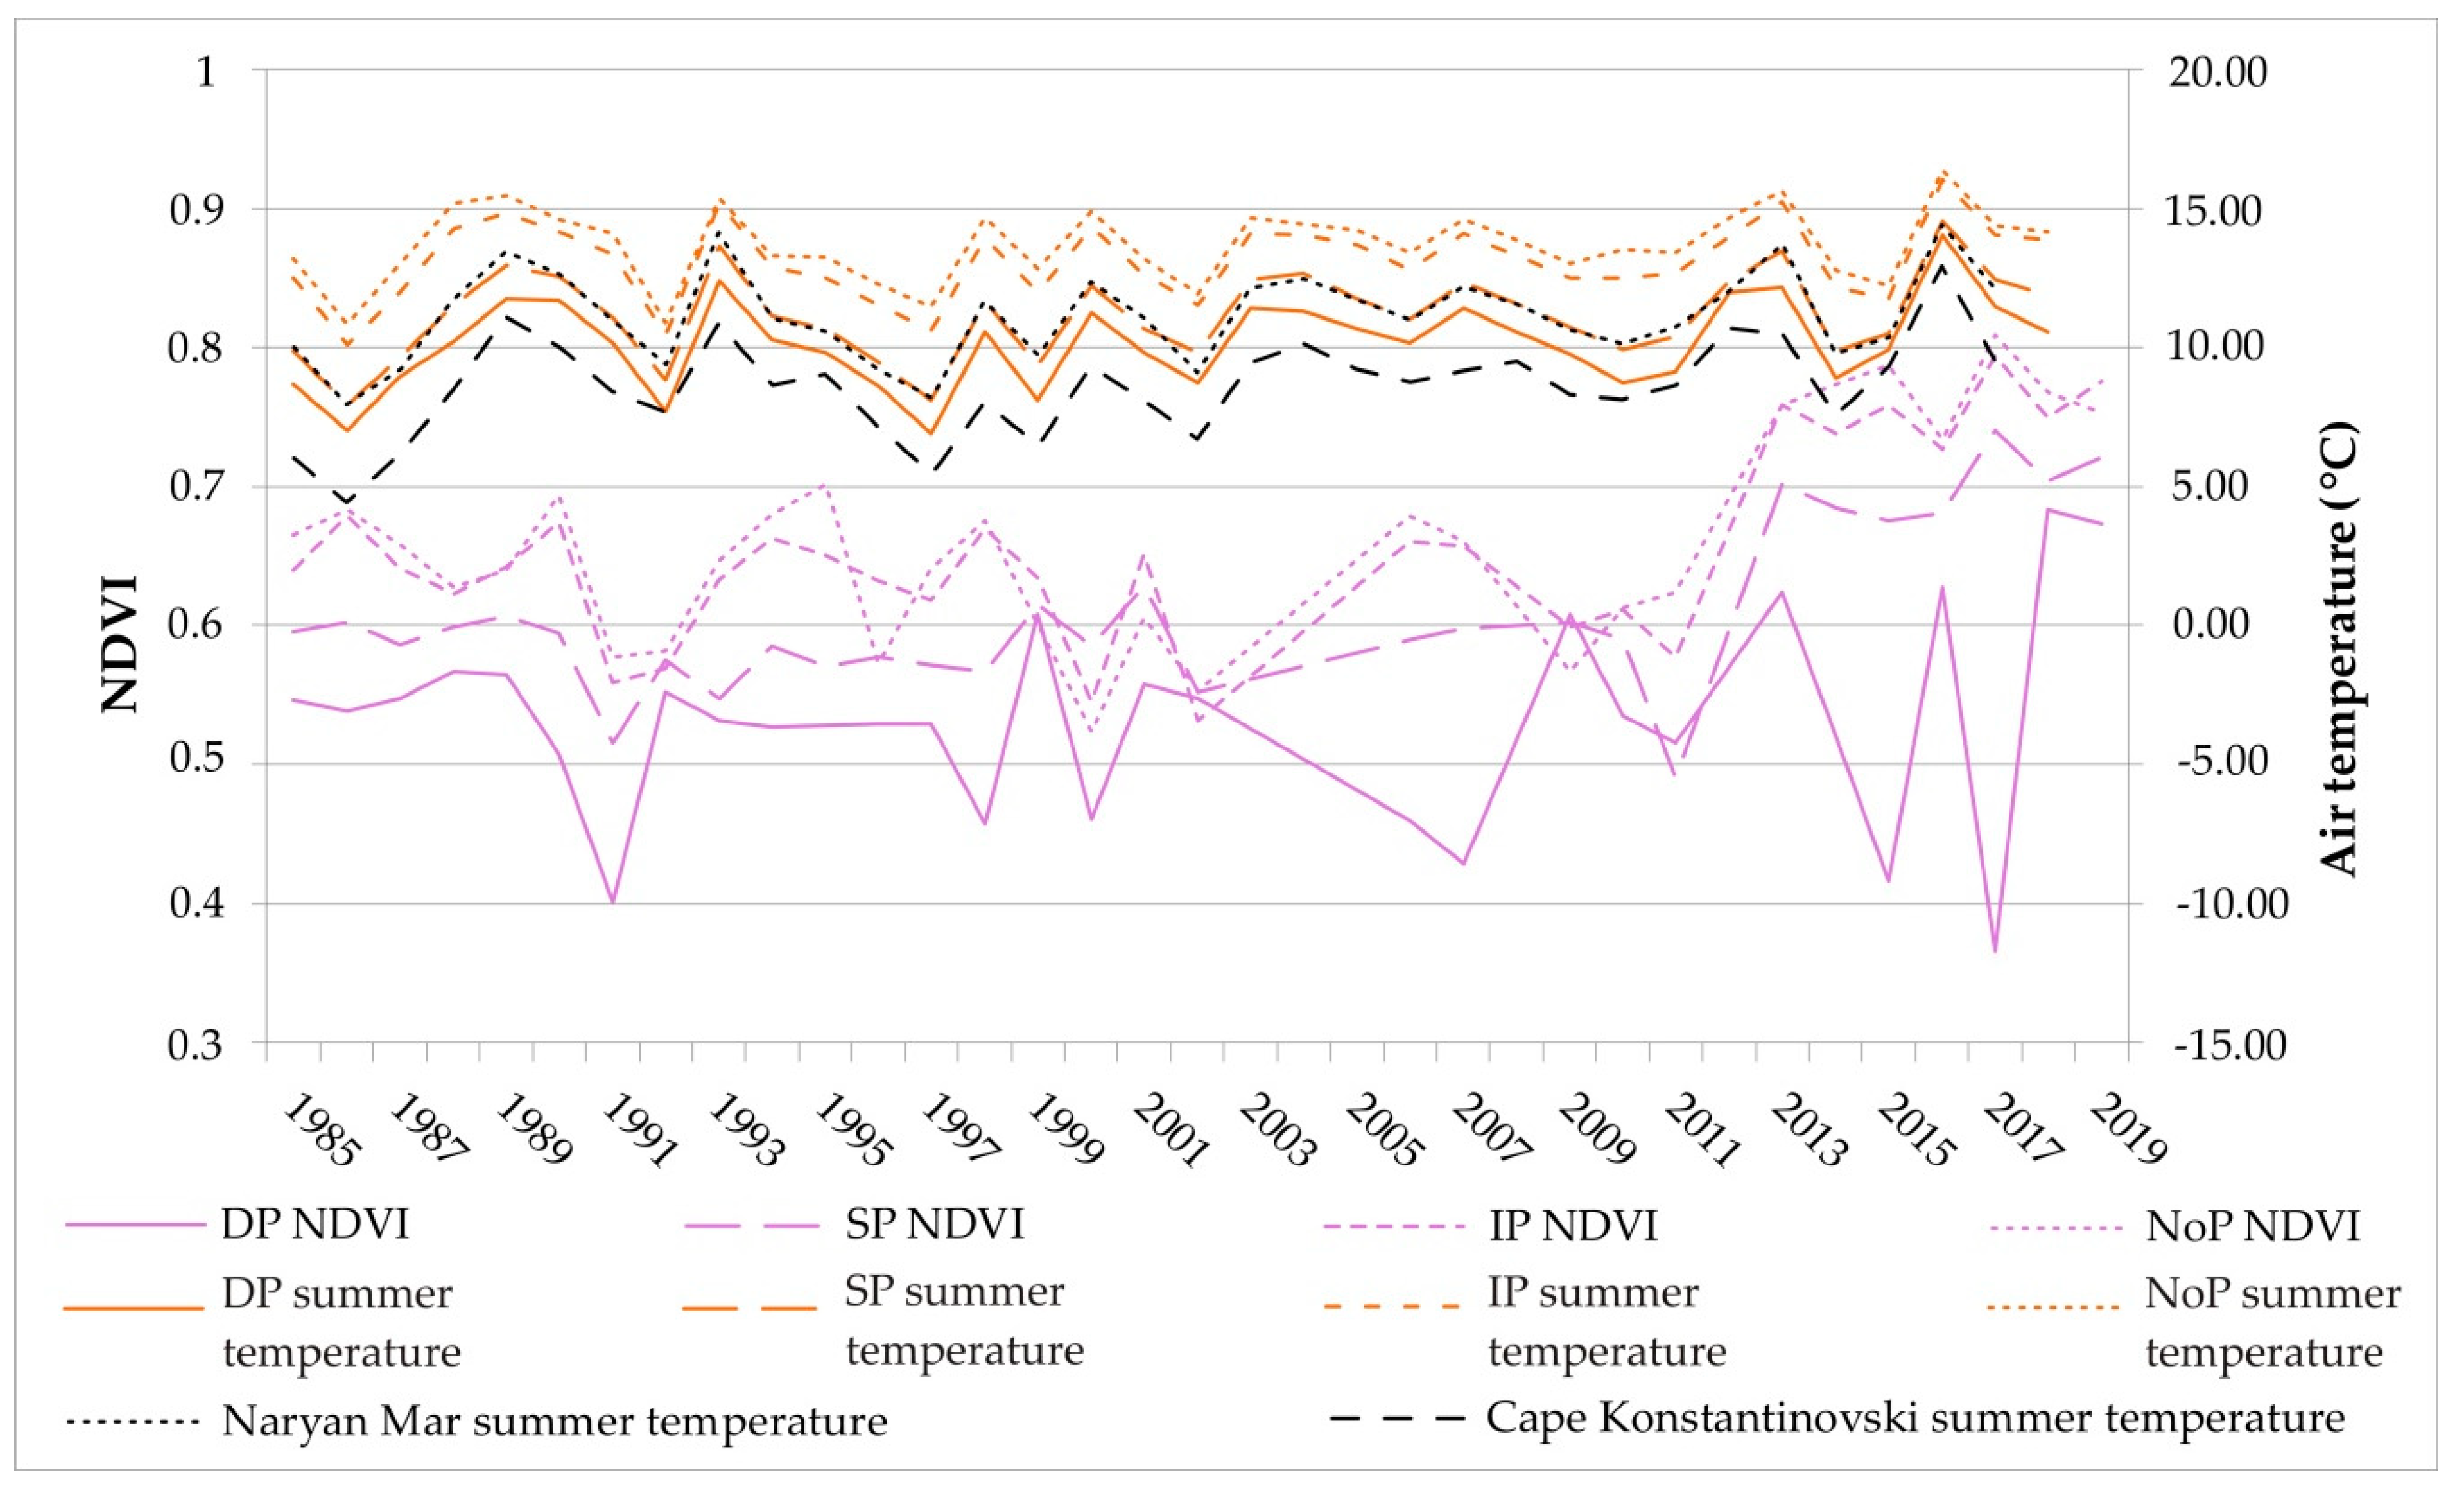
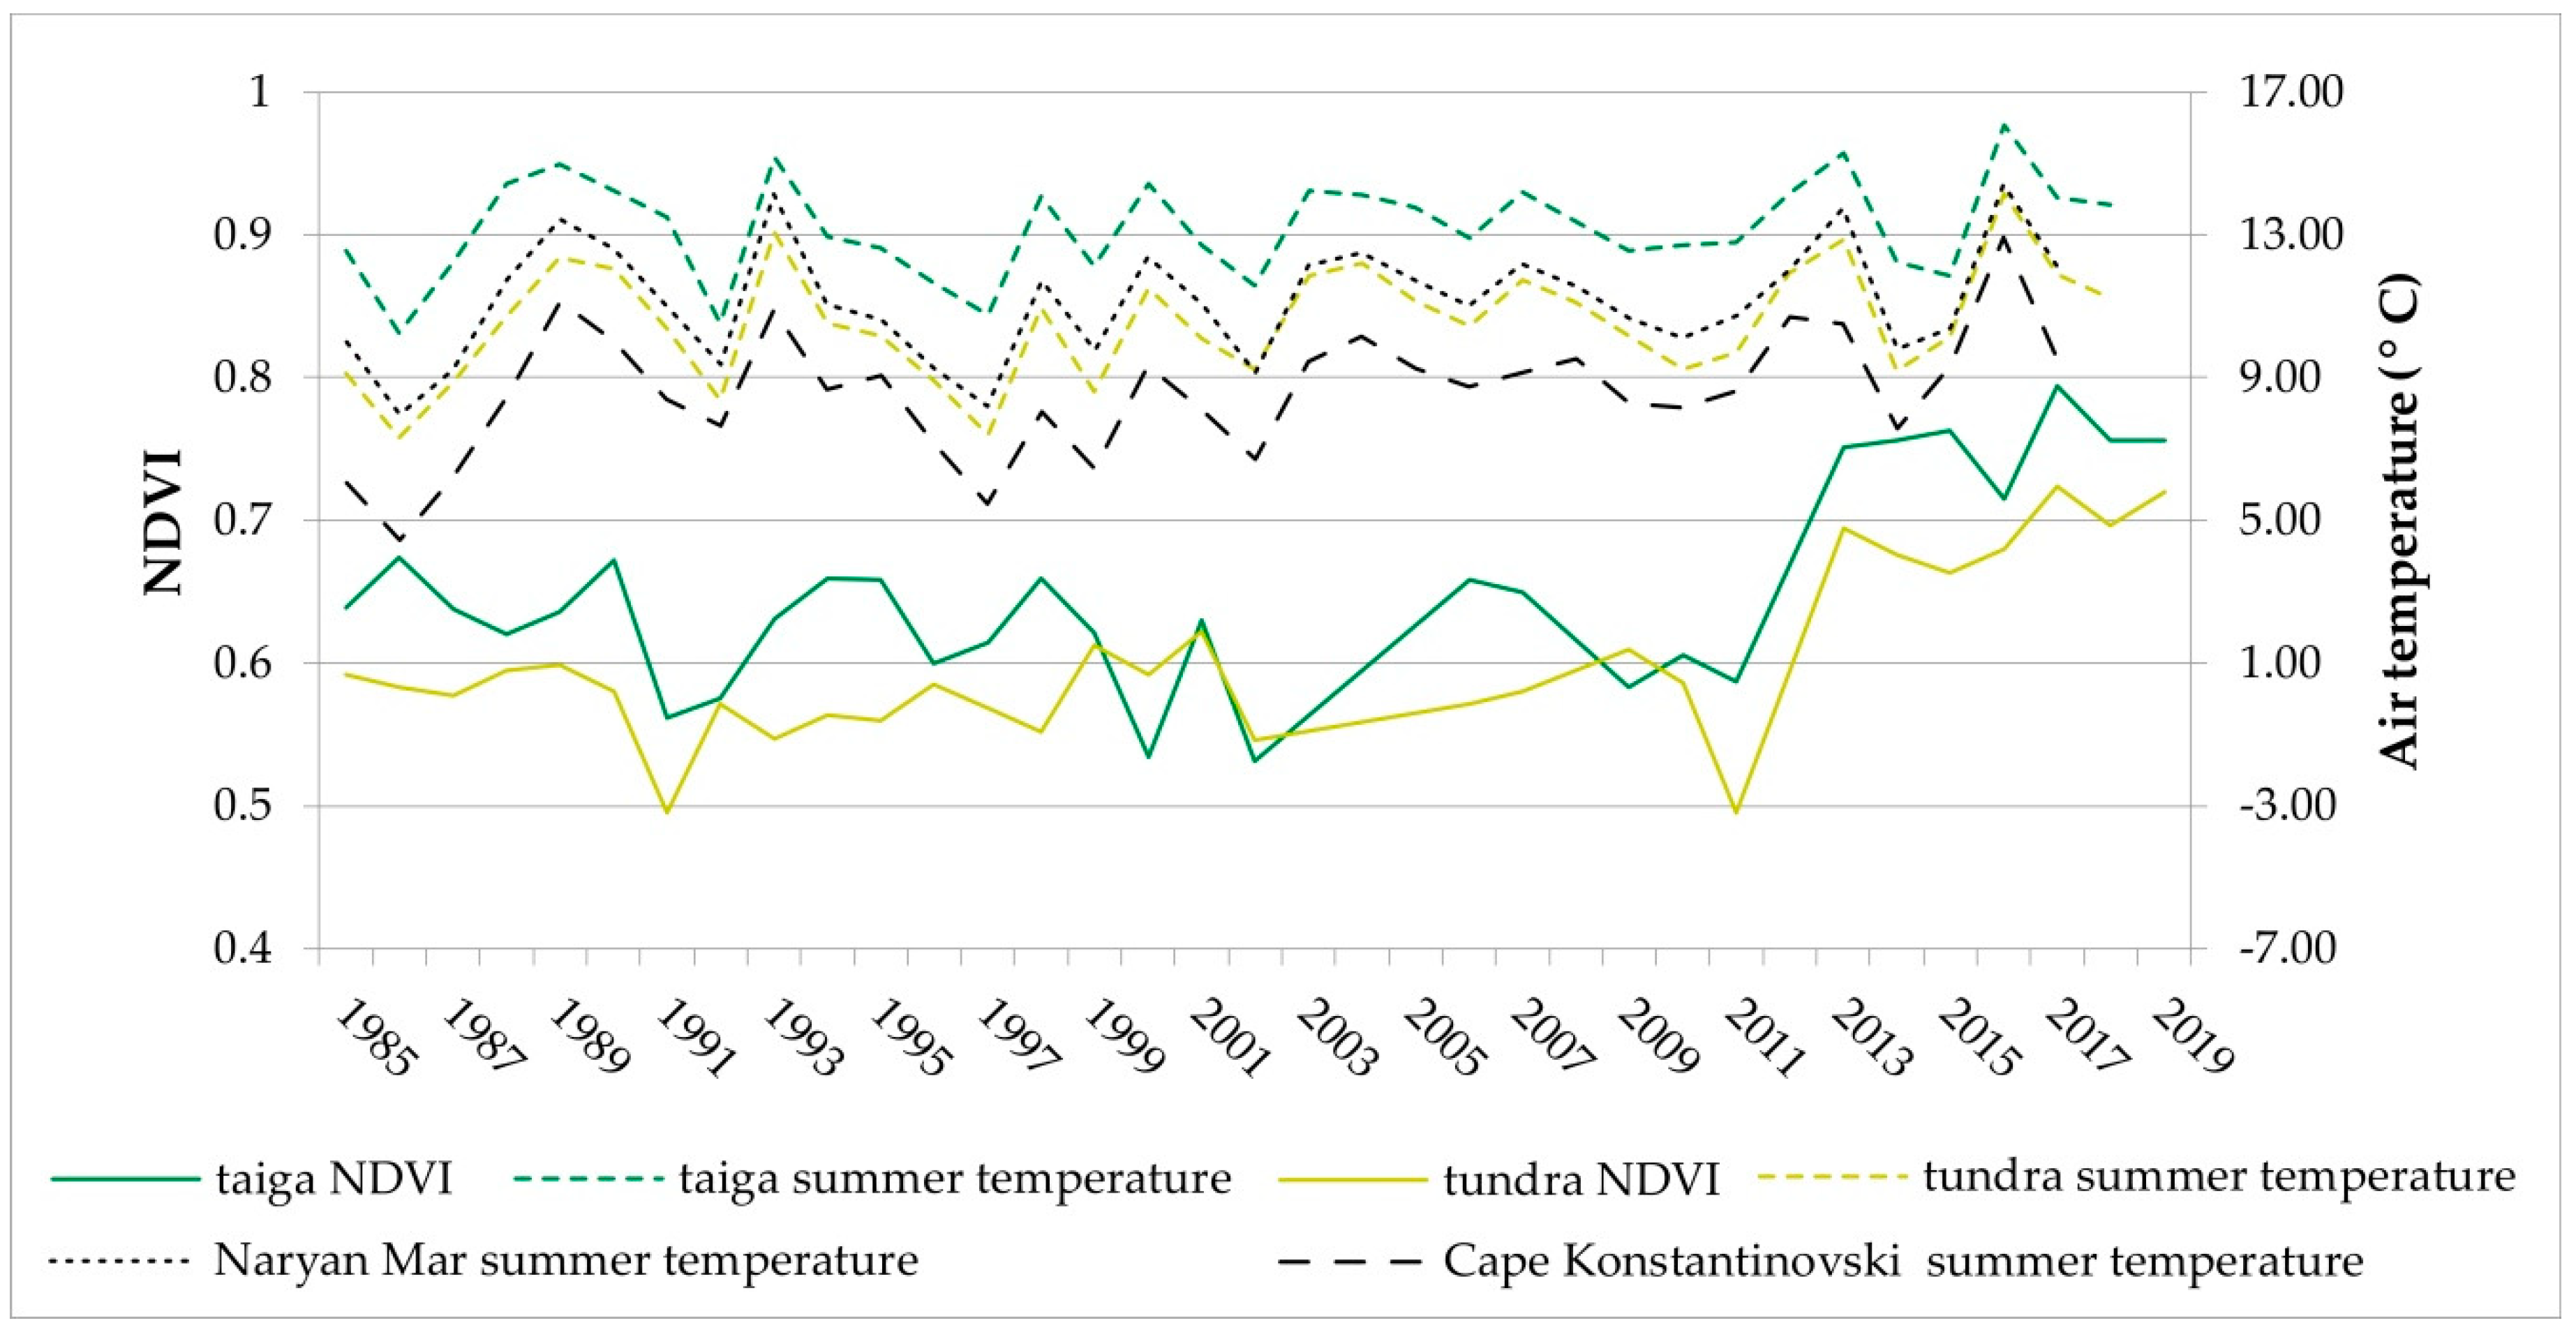
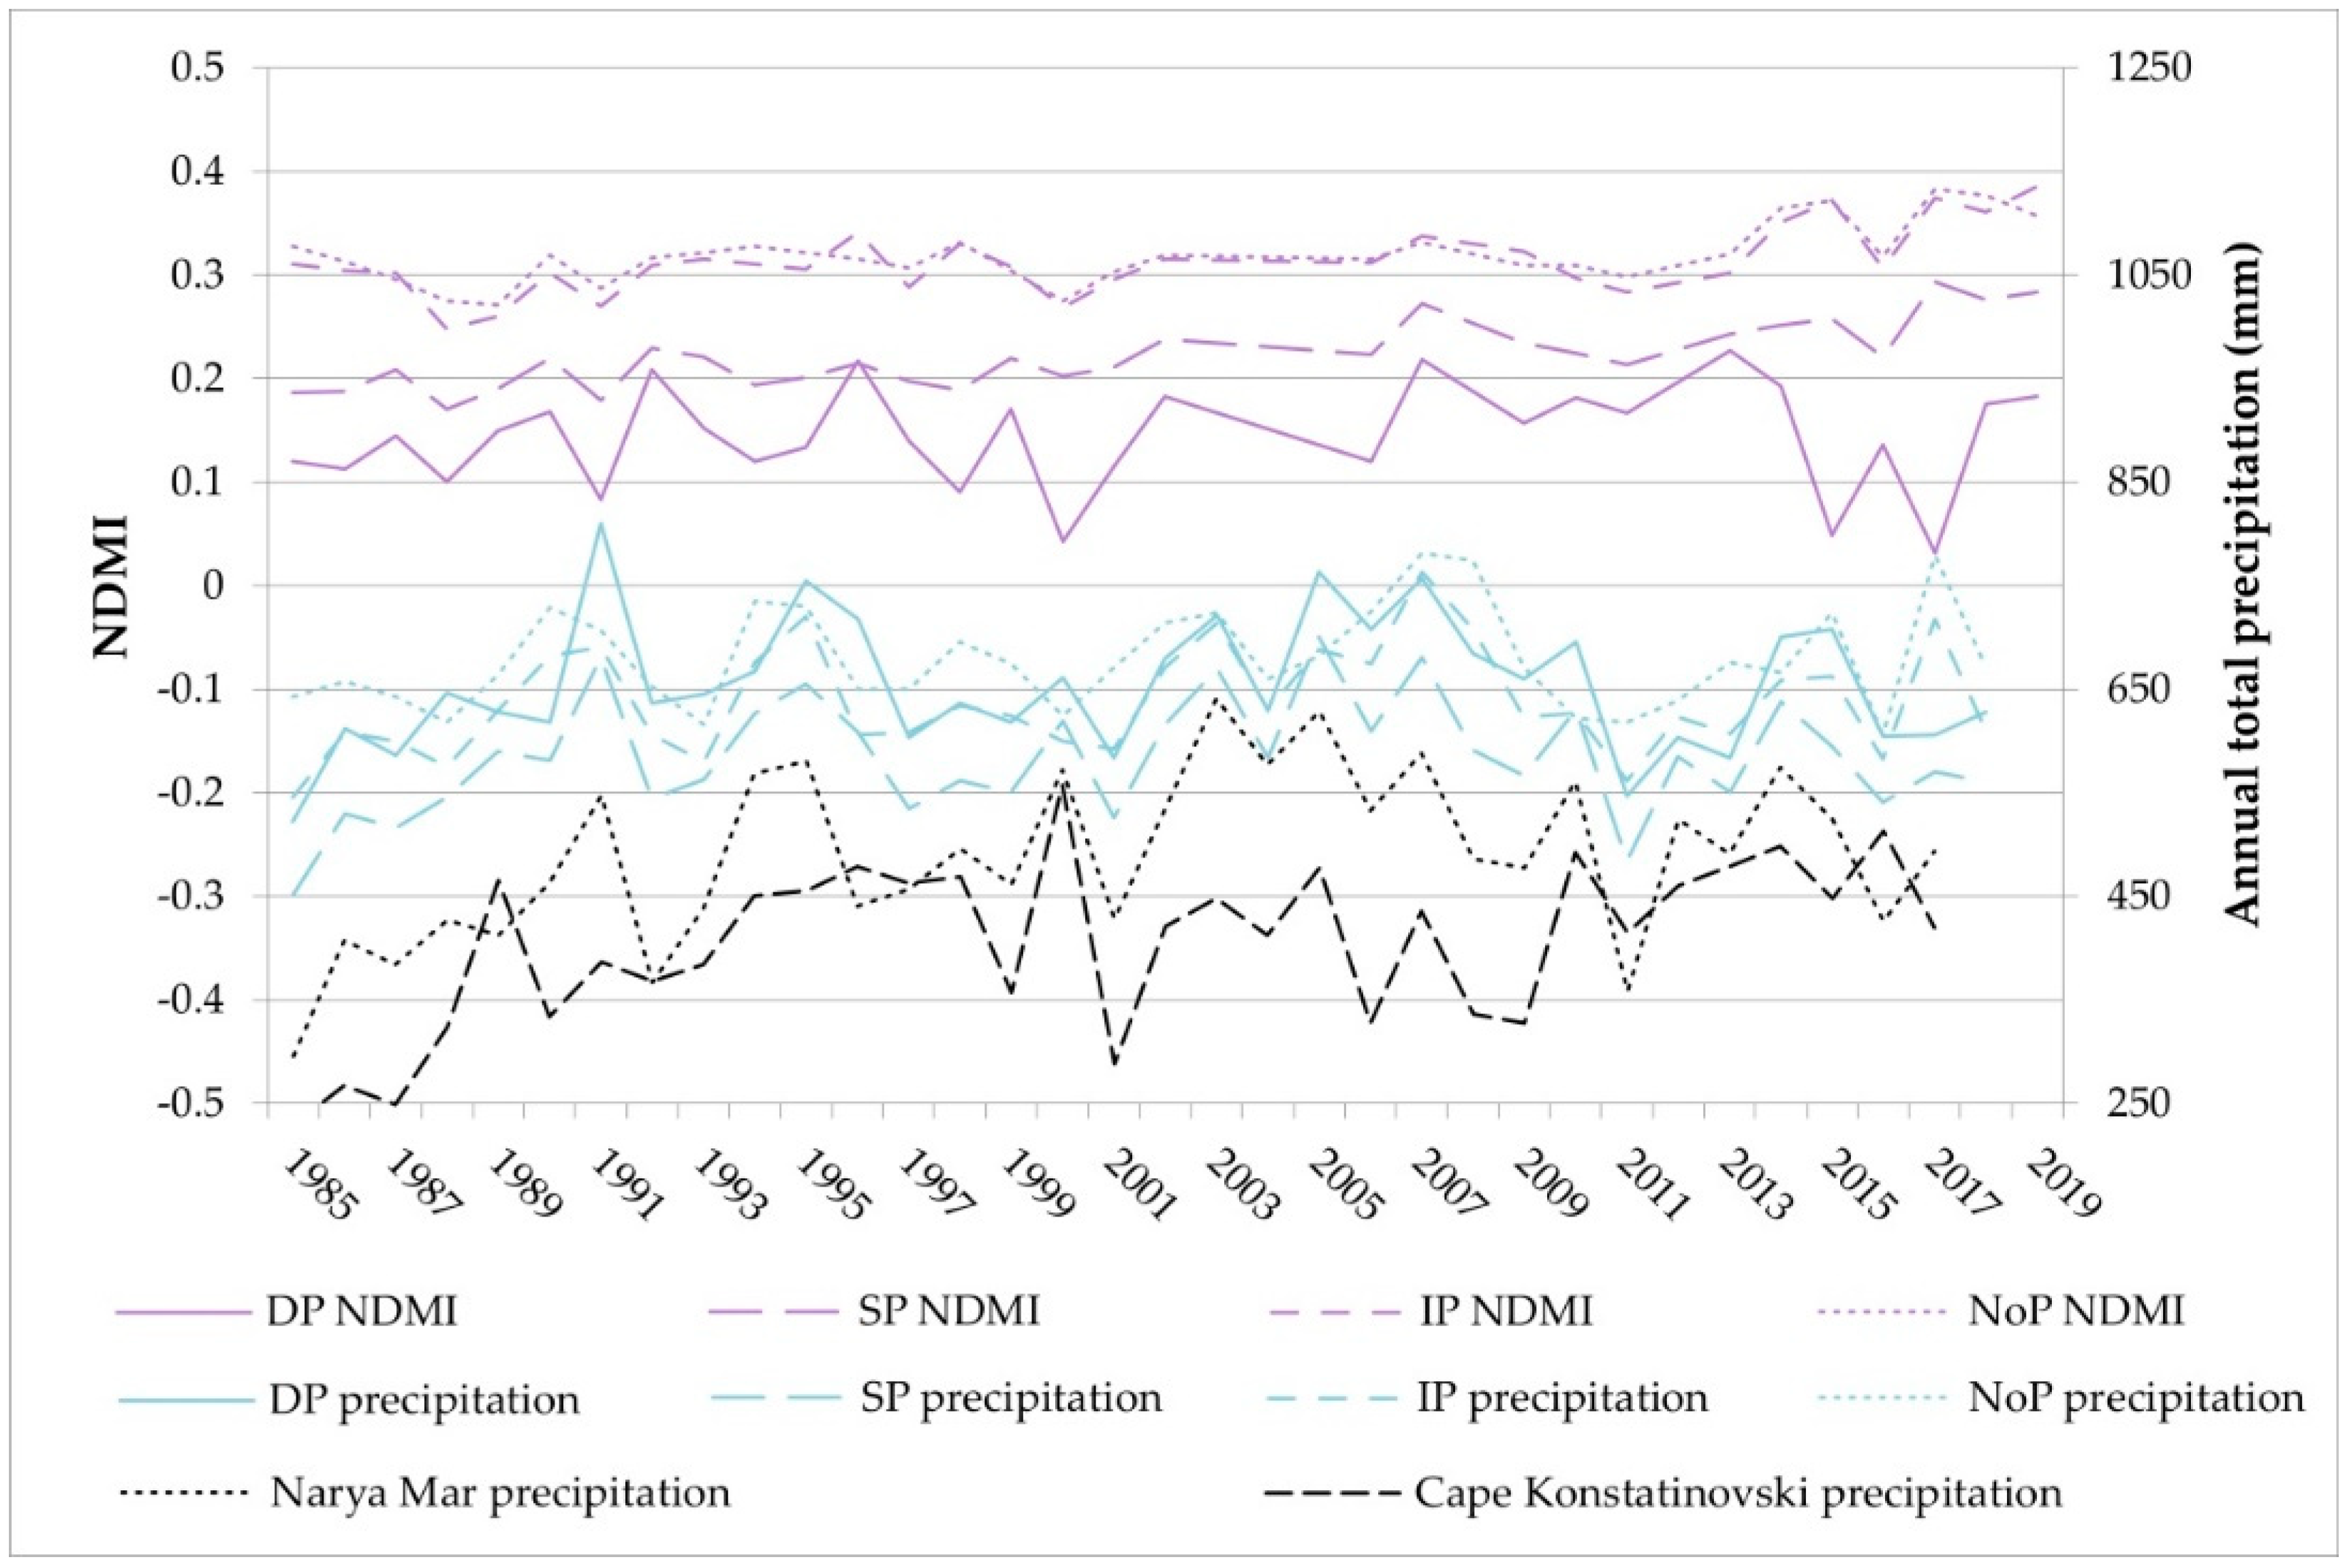
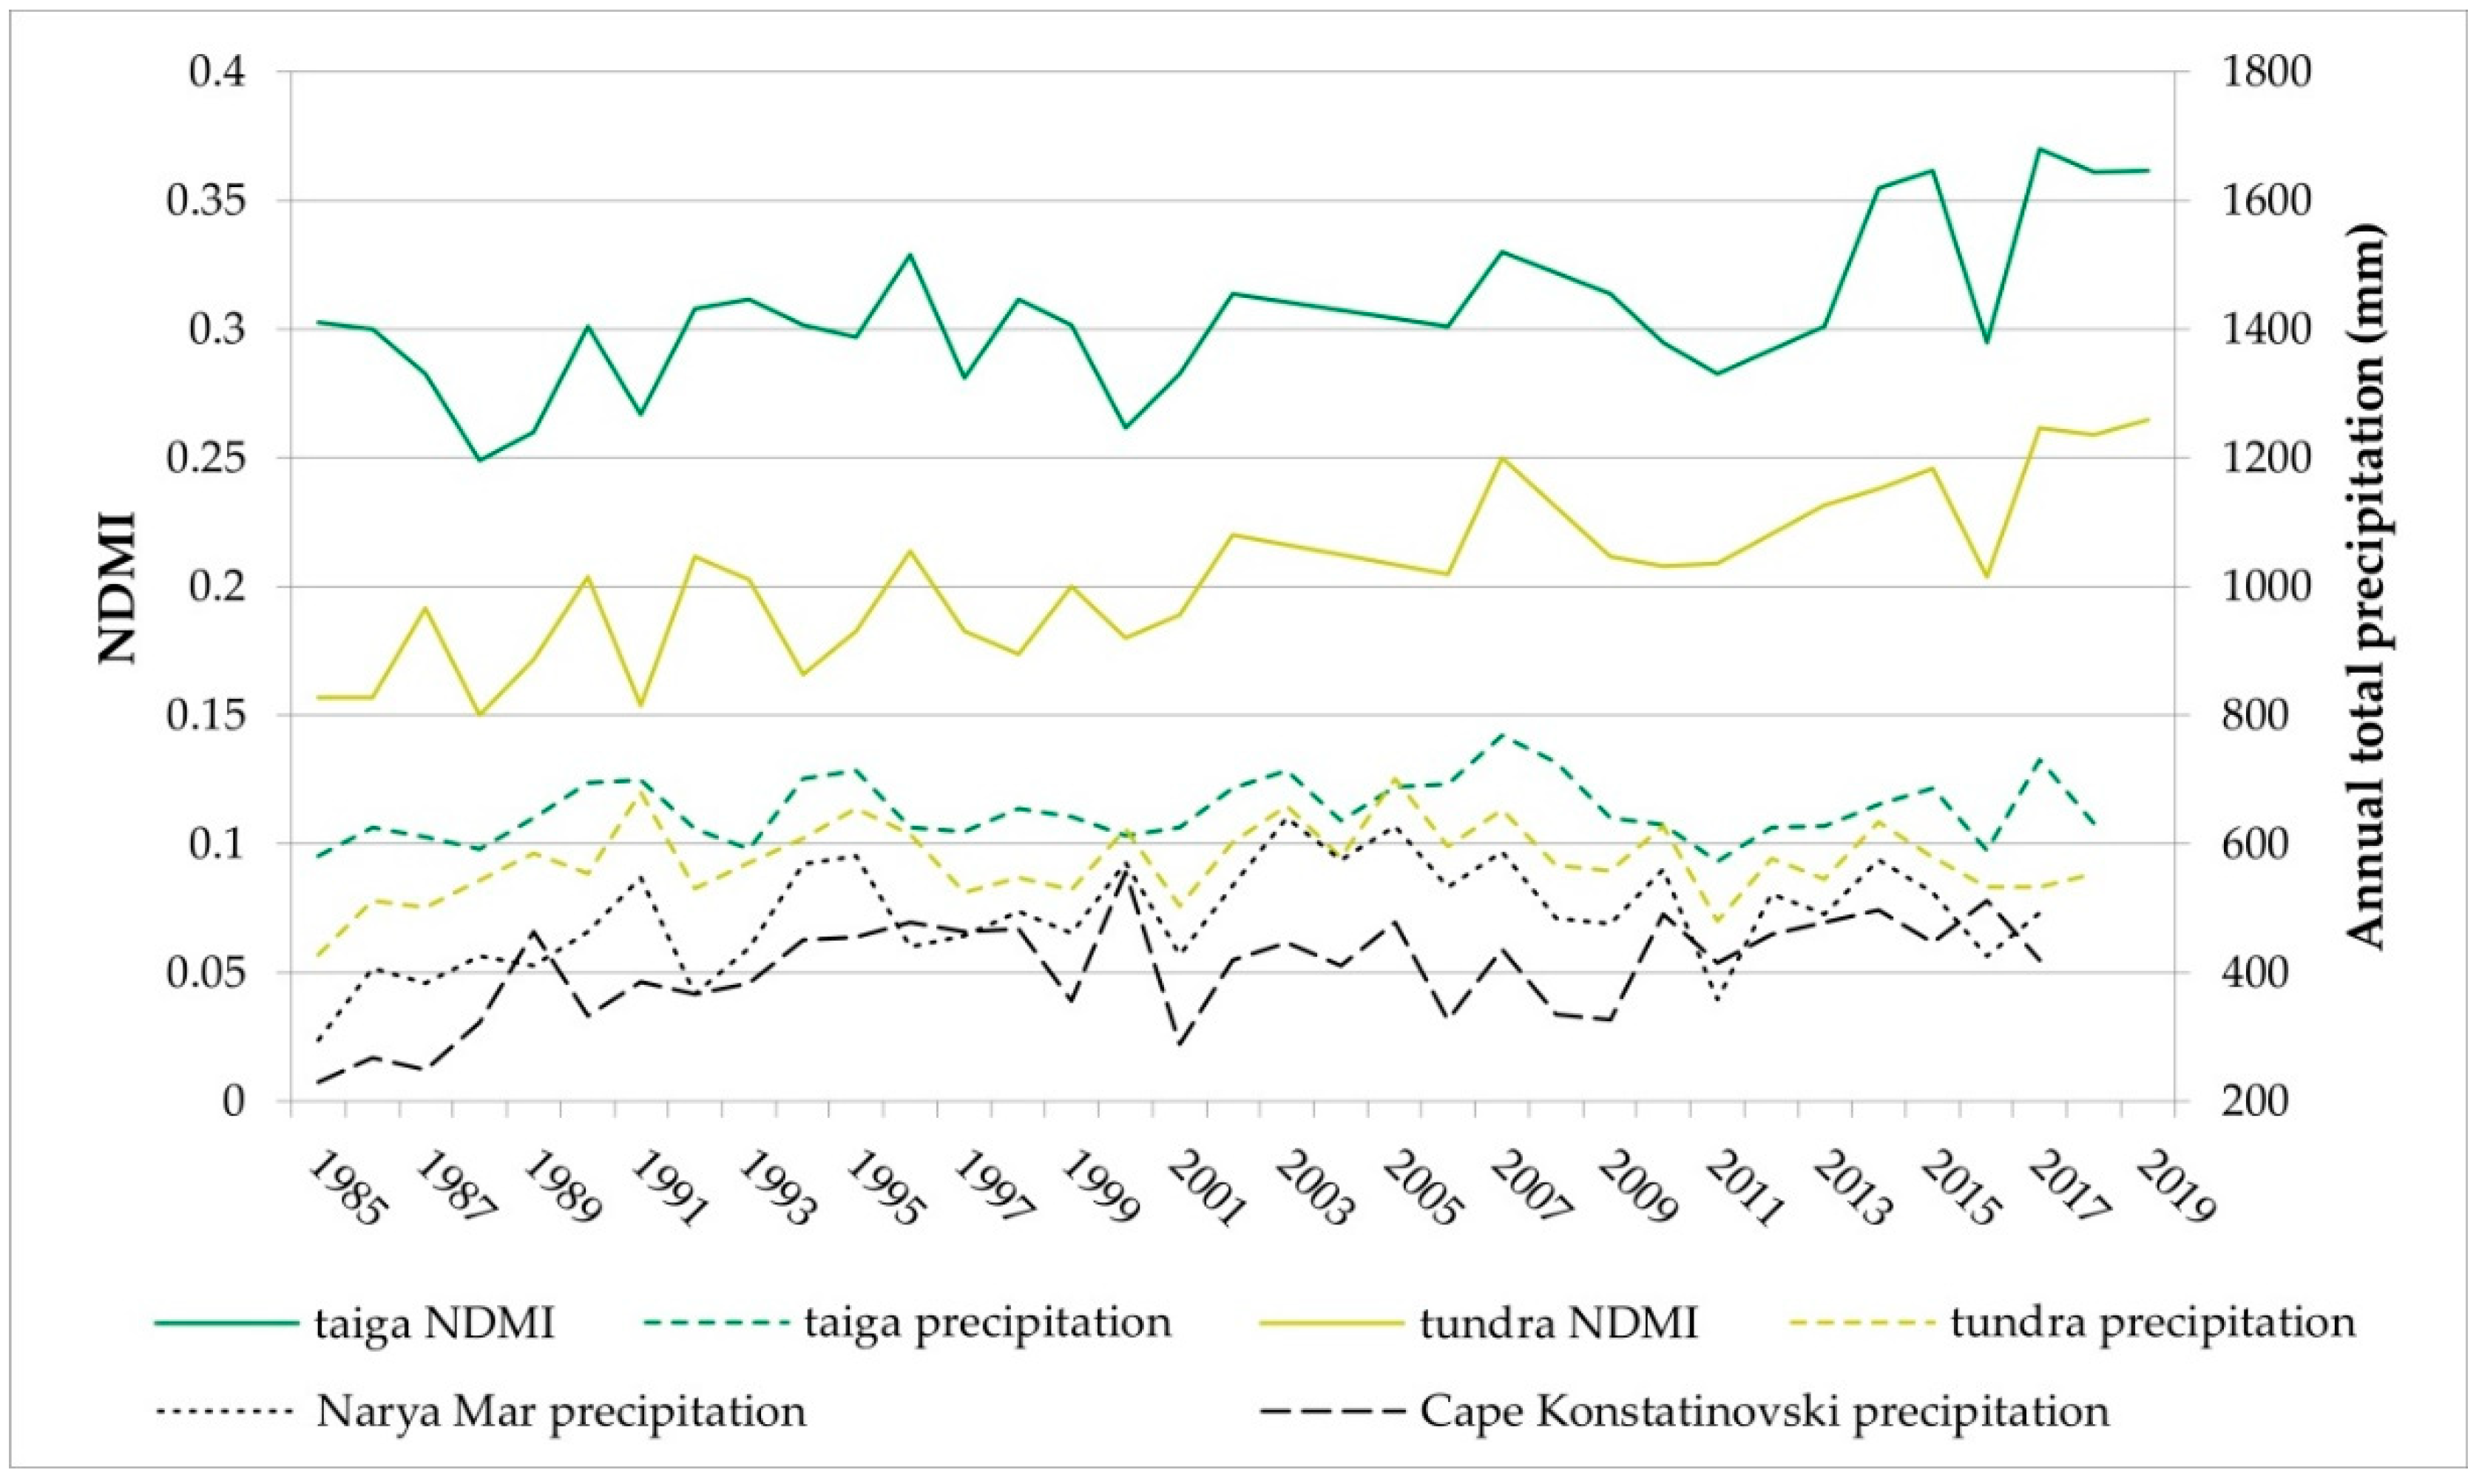
3.1. Vegetation Dynamics
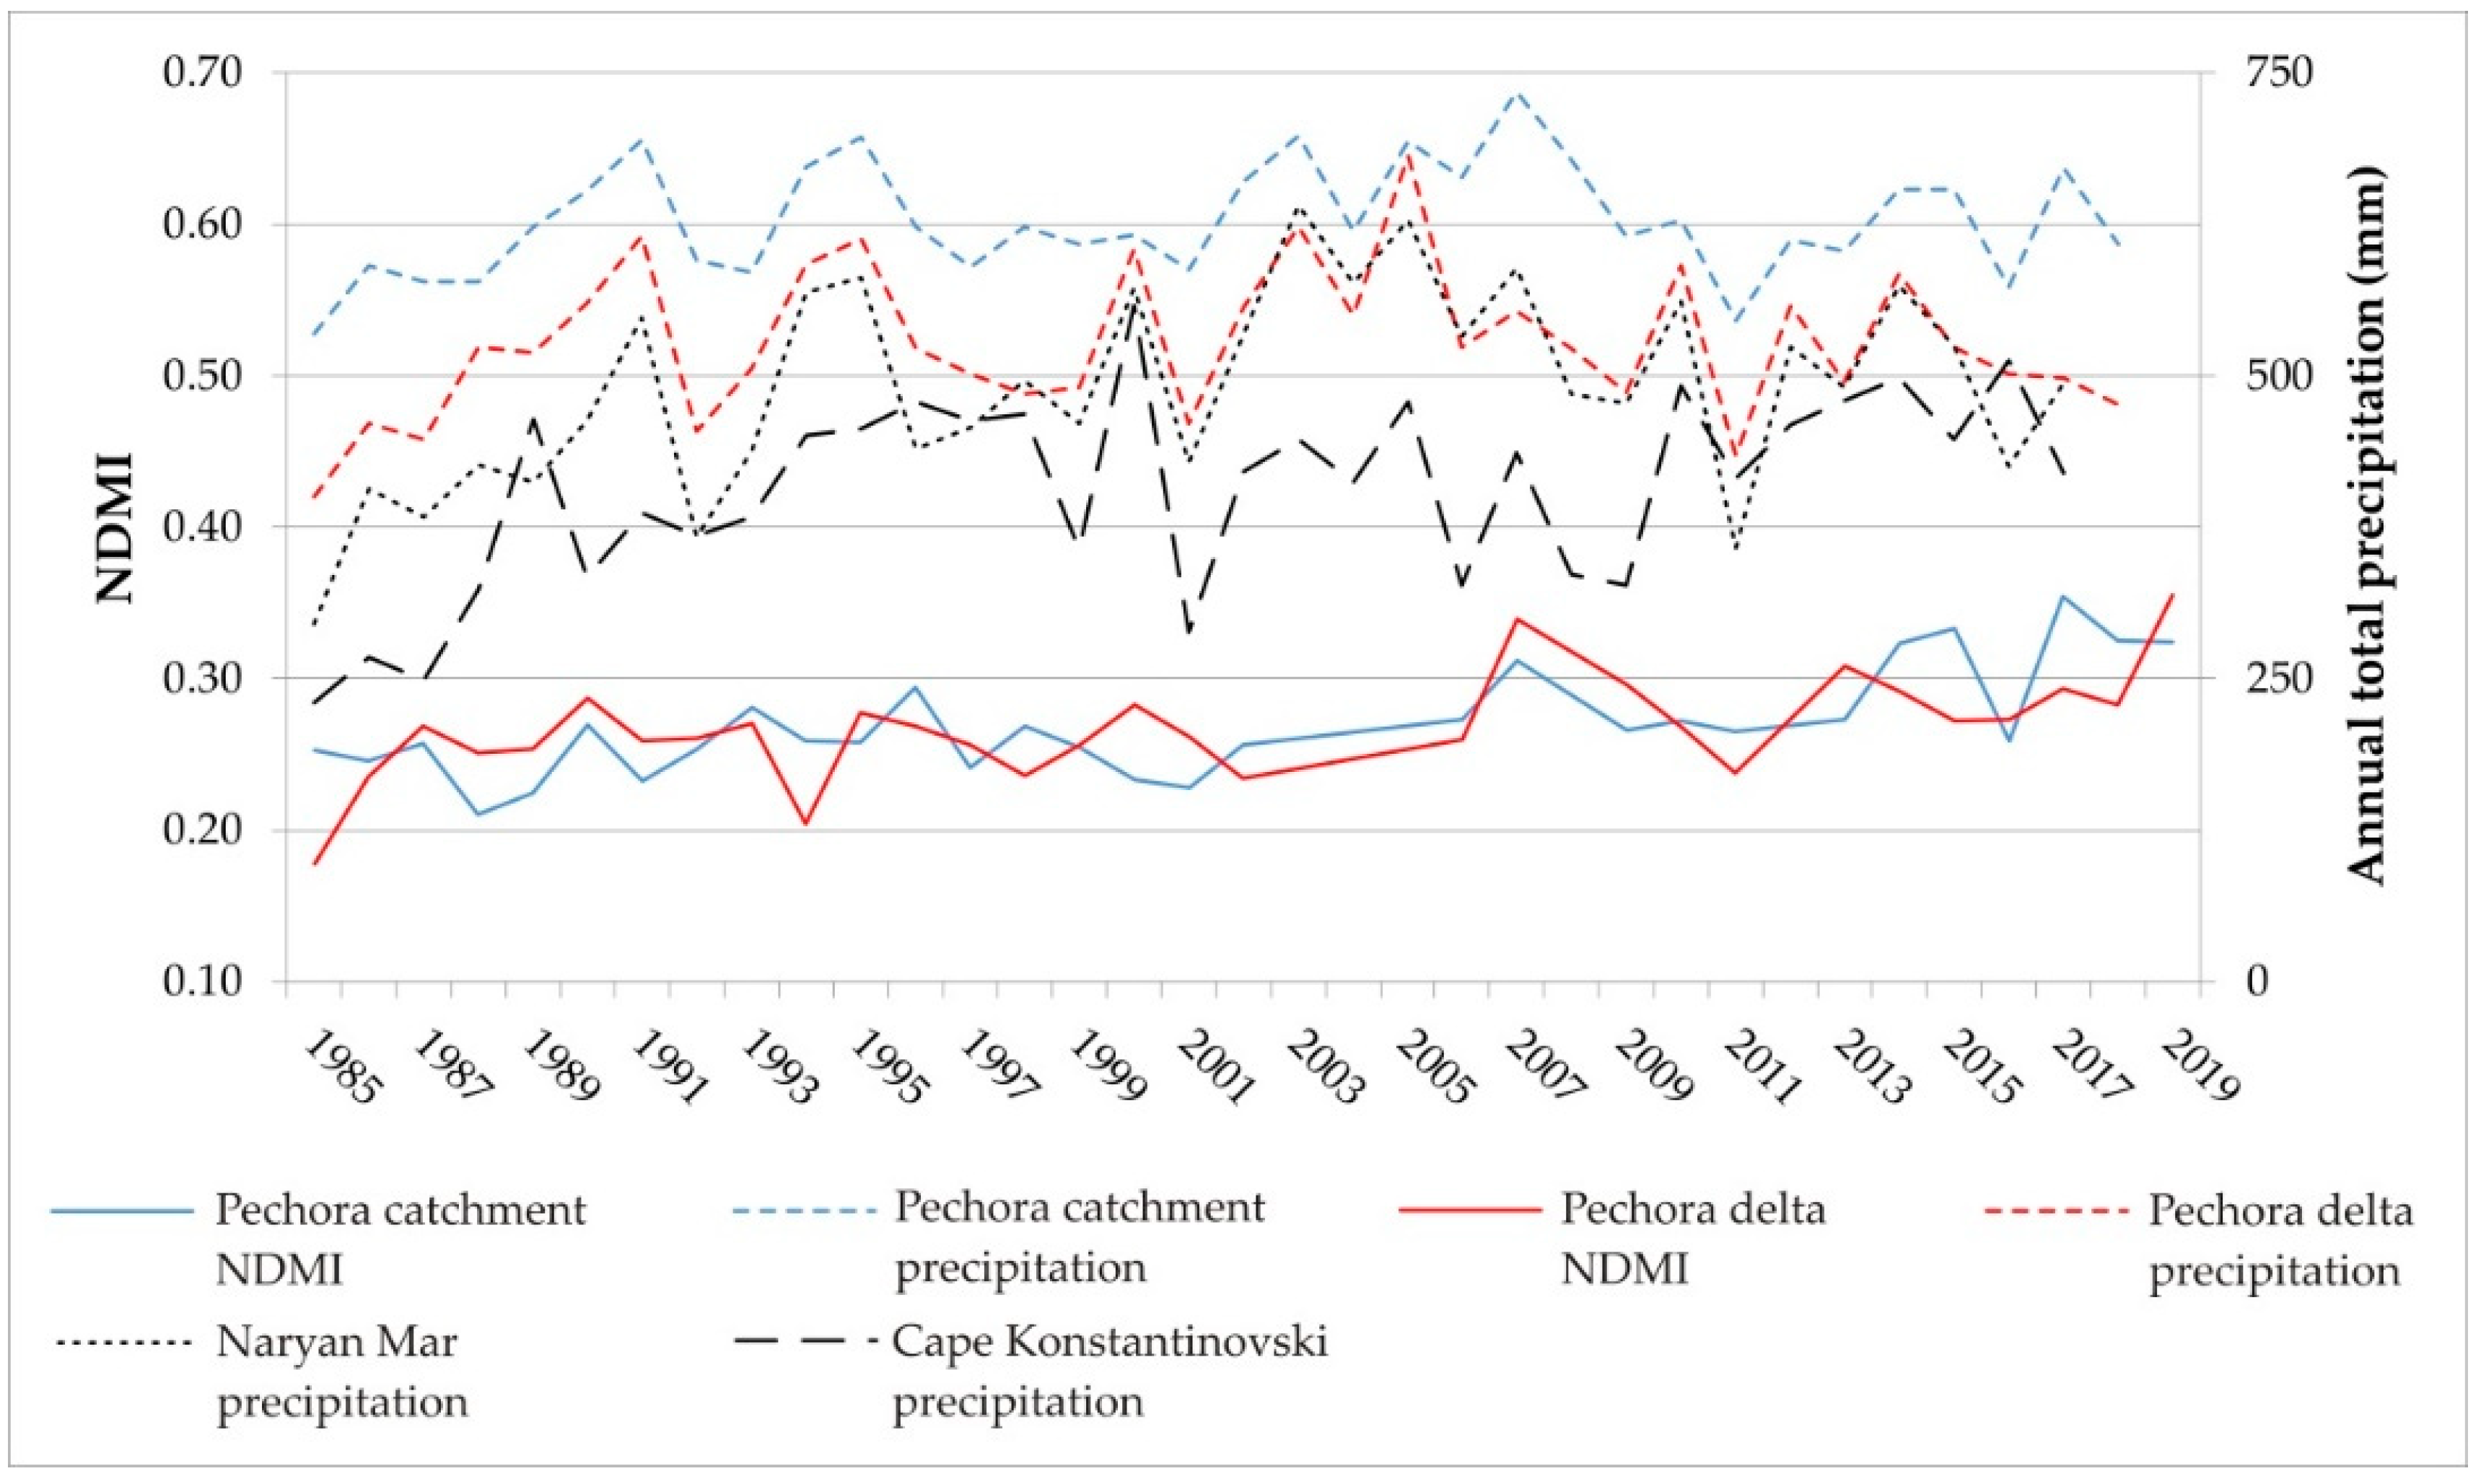
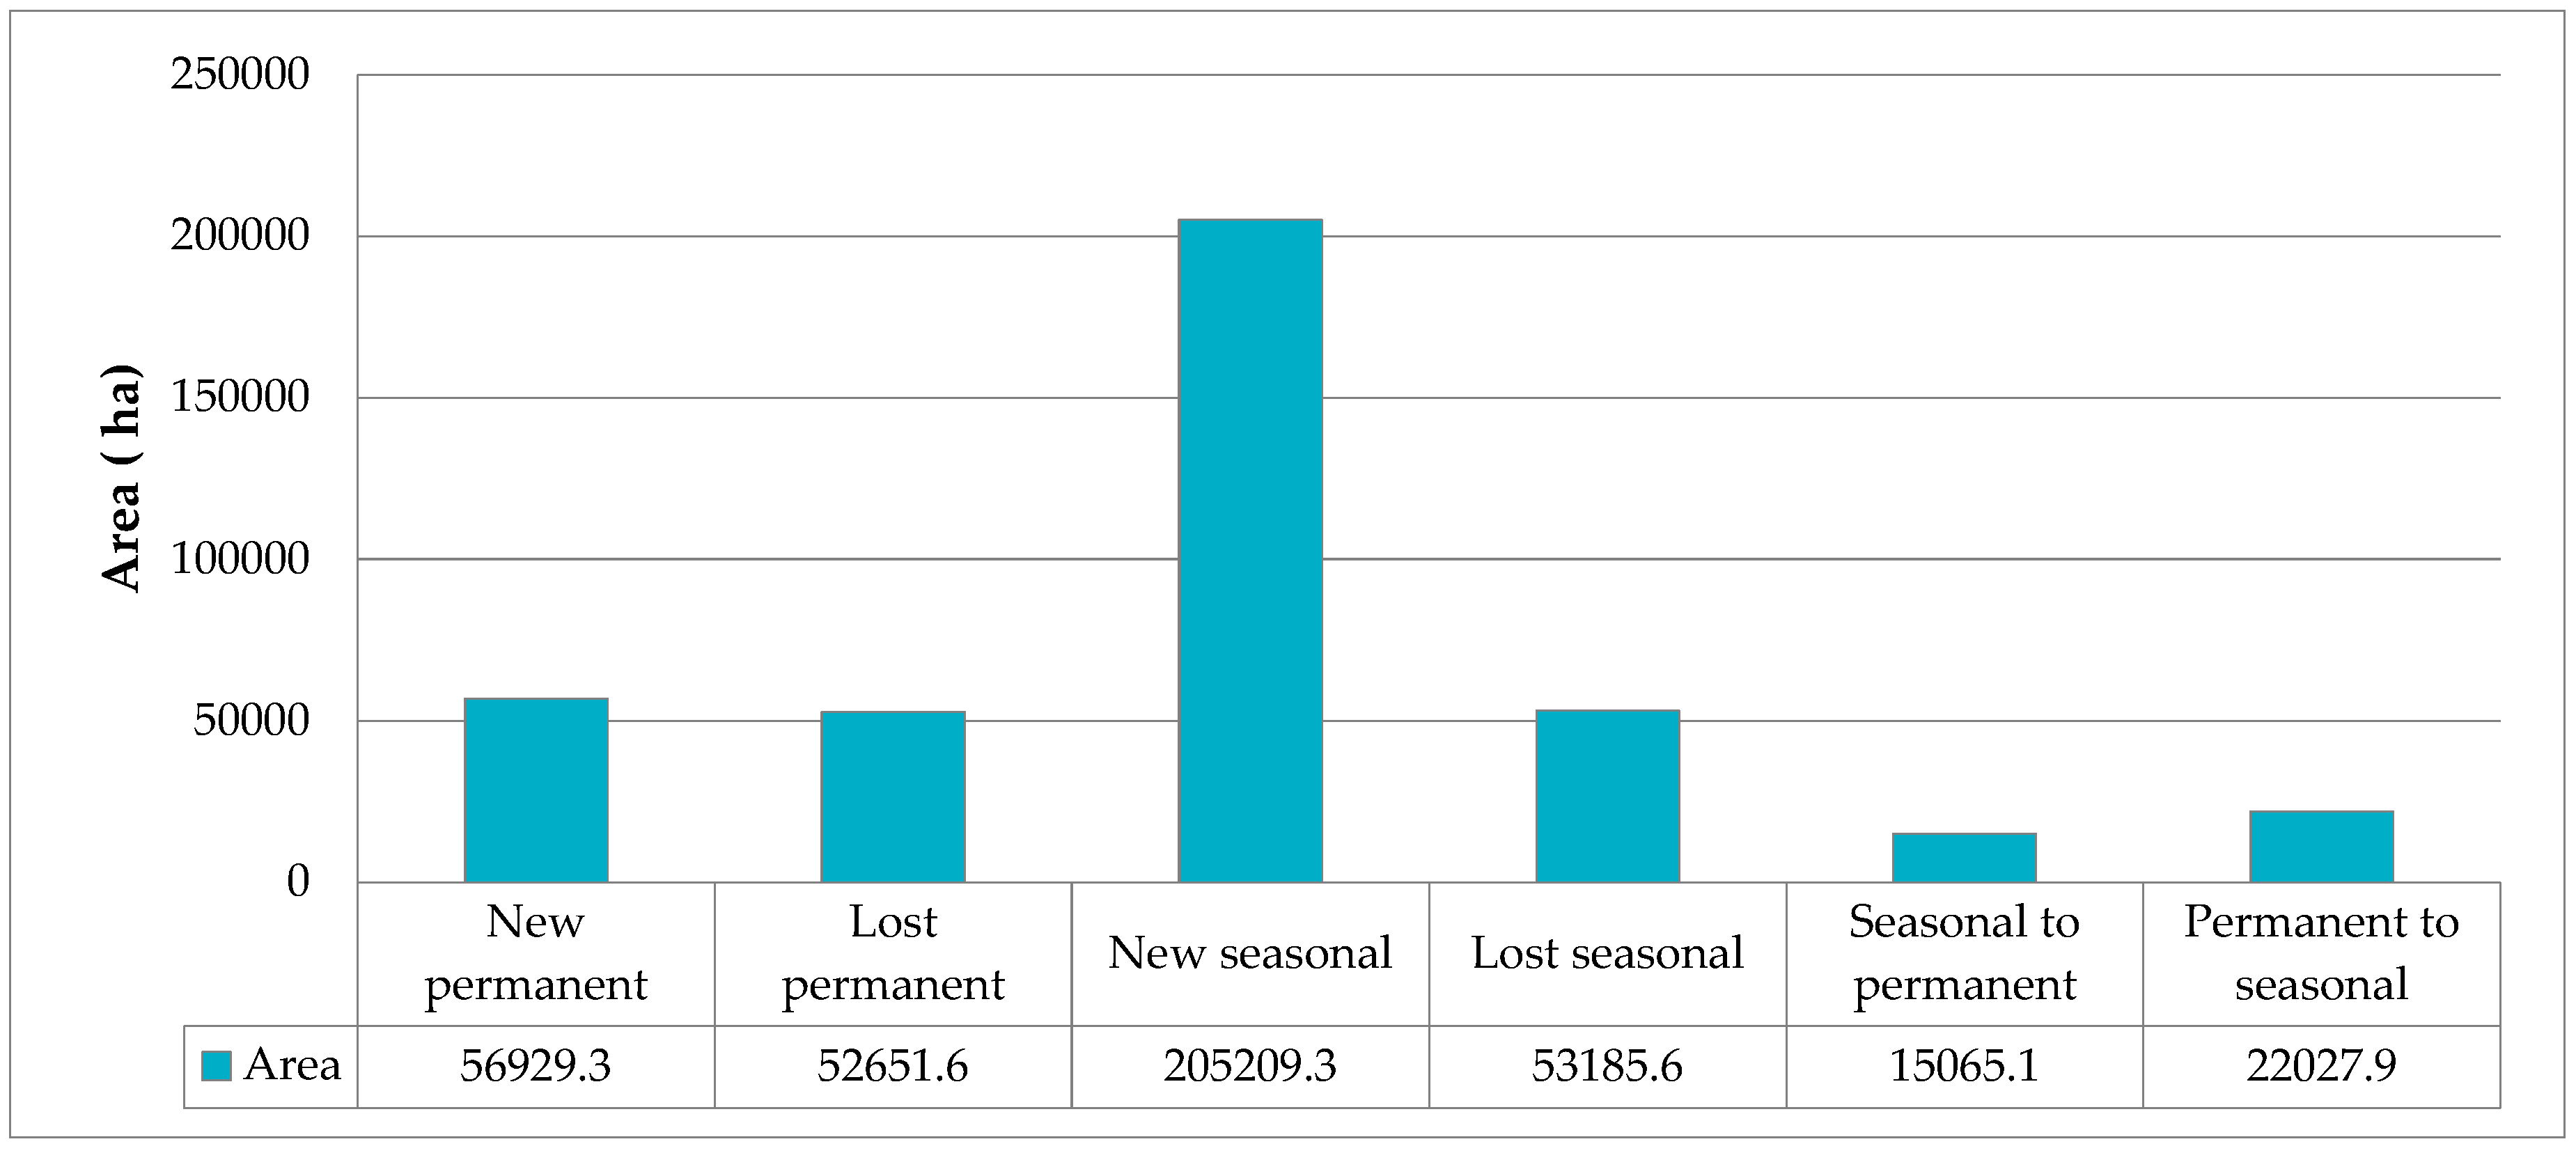
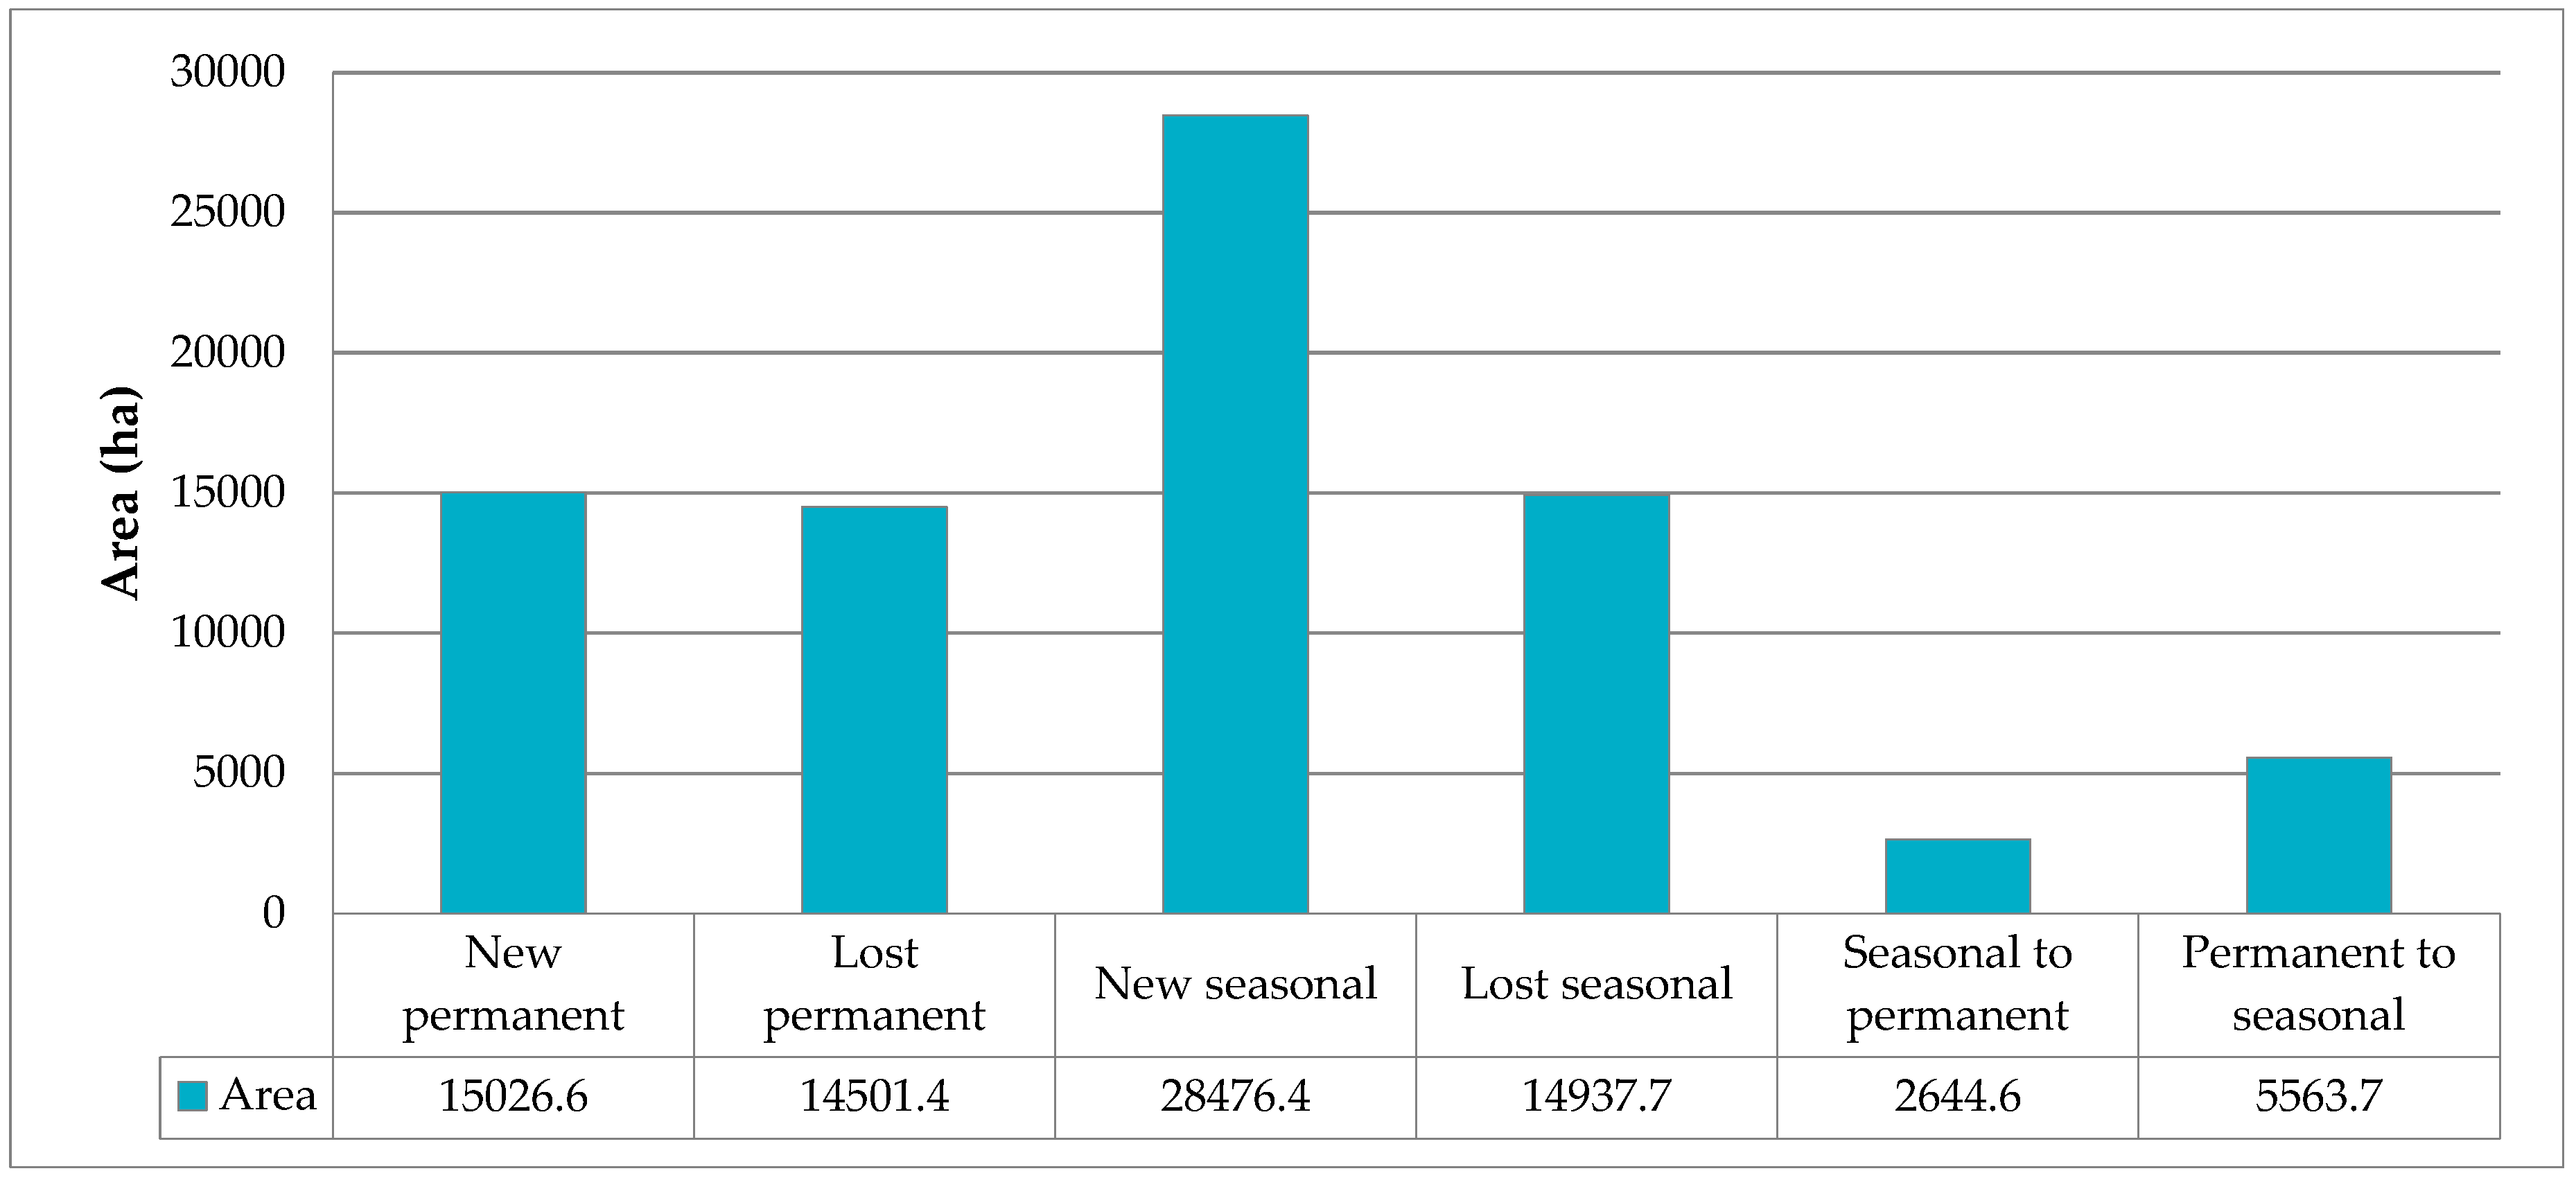
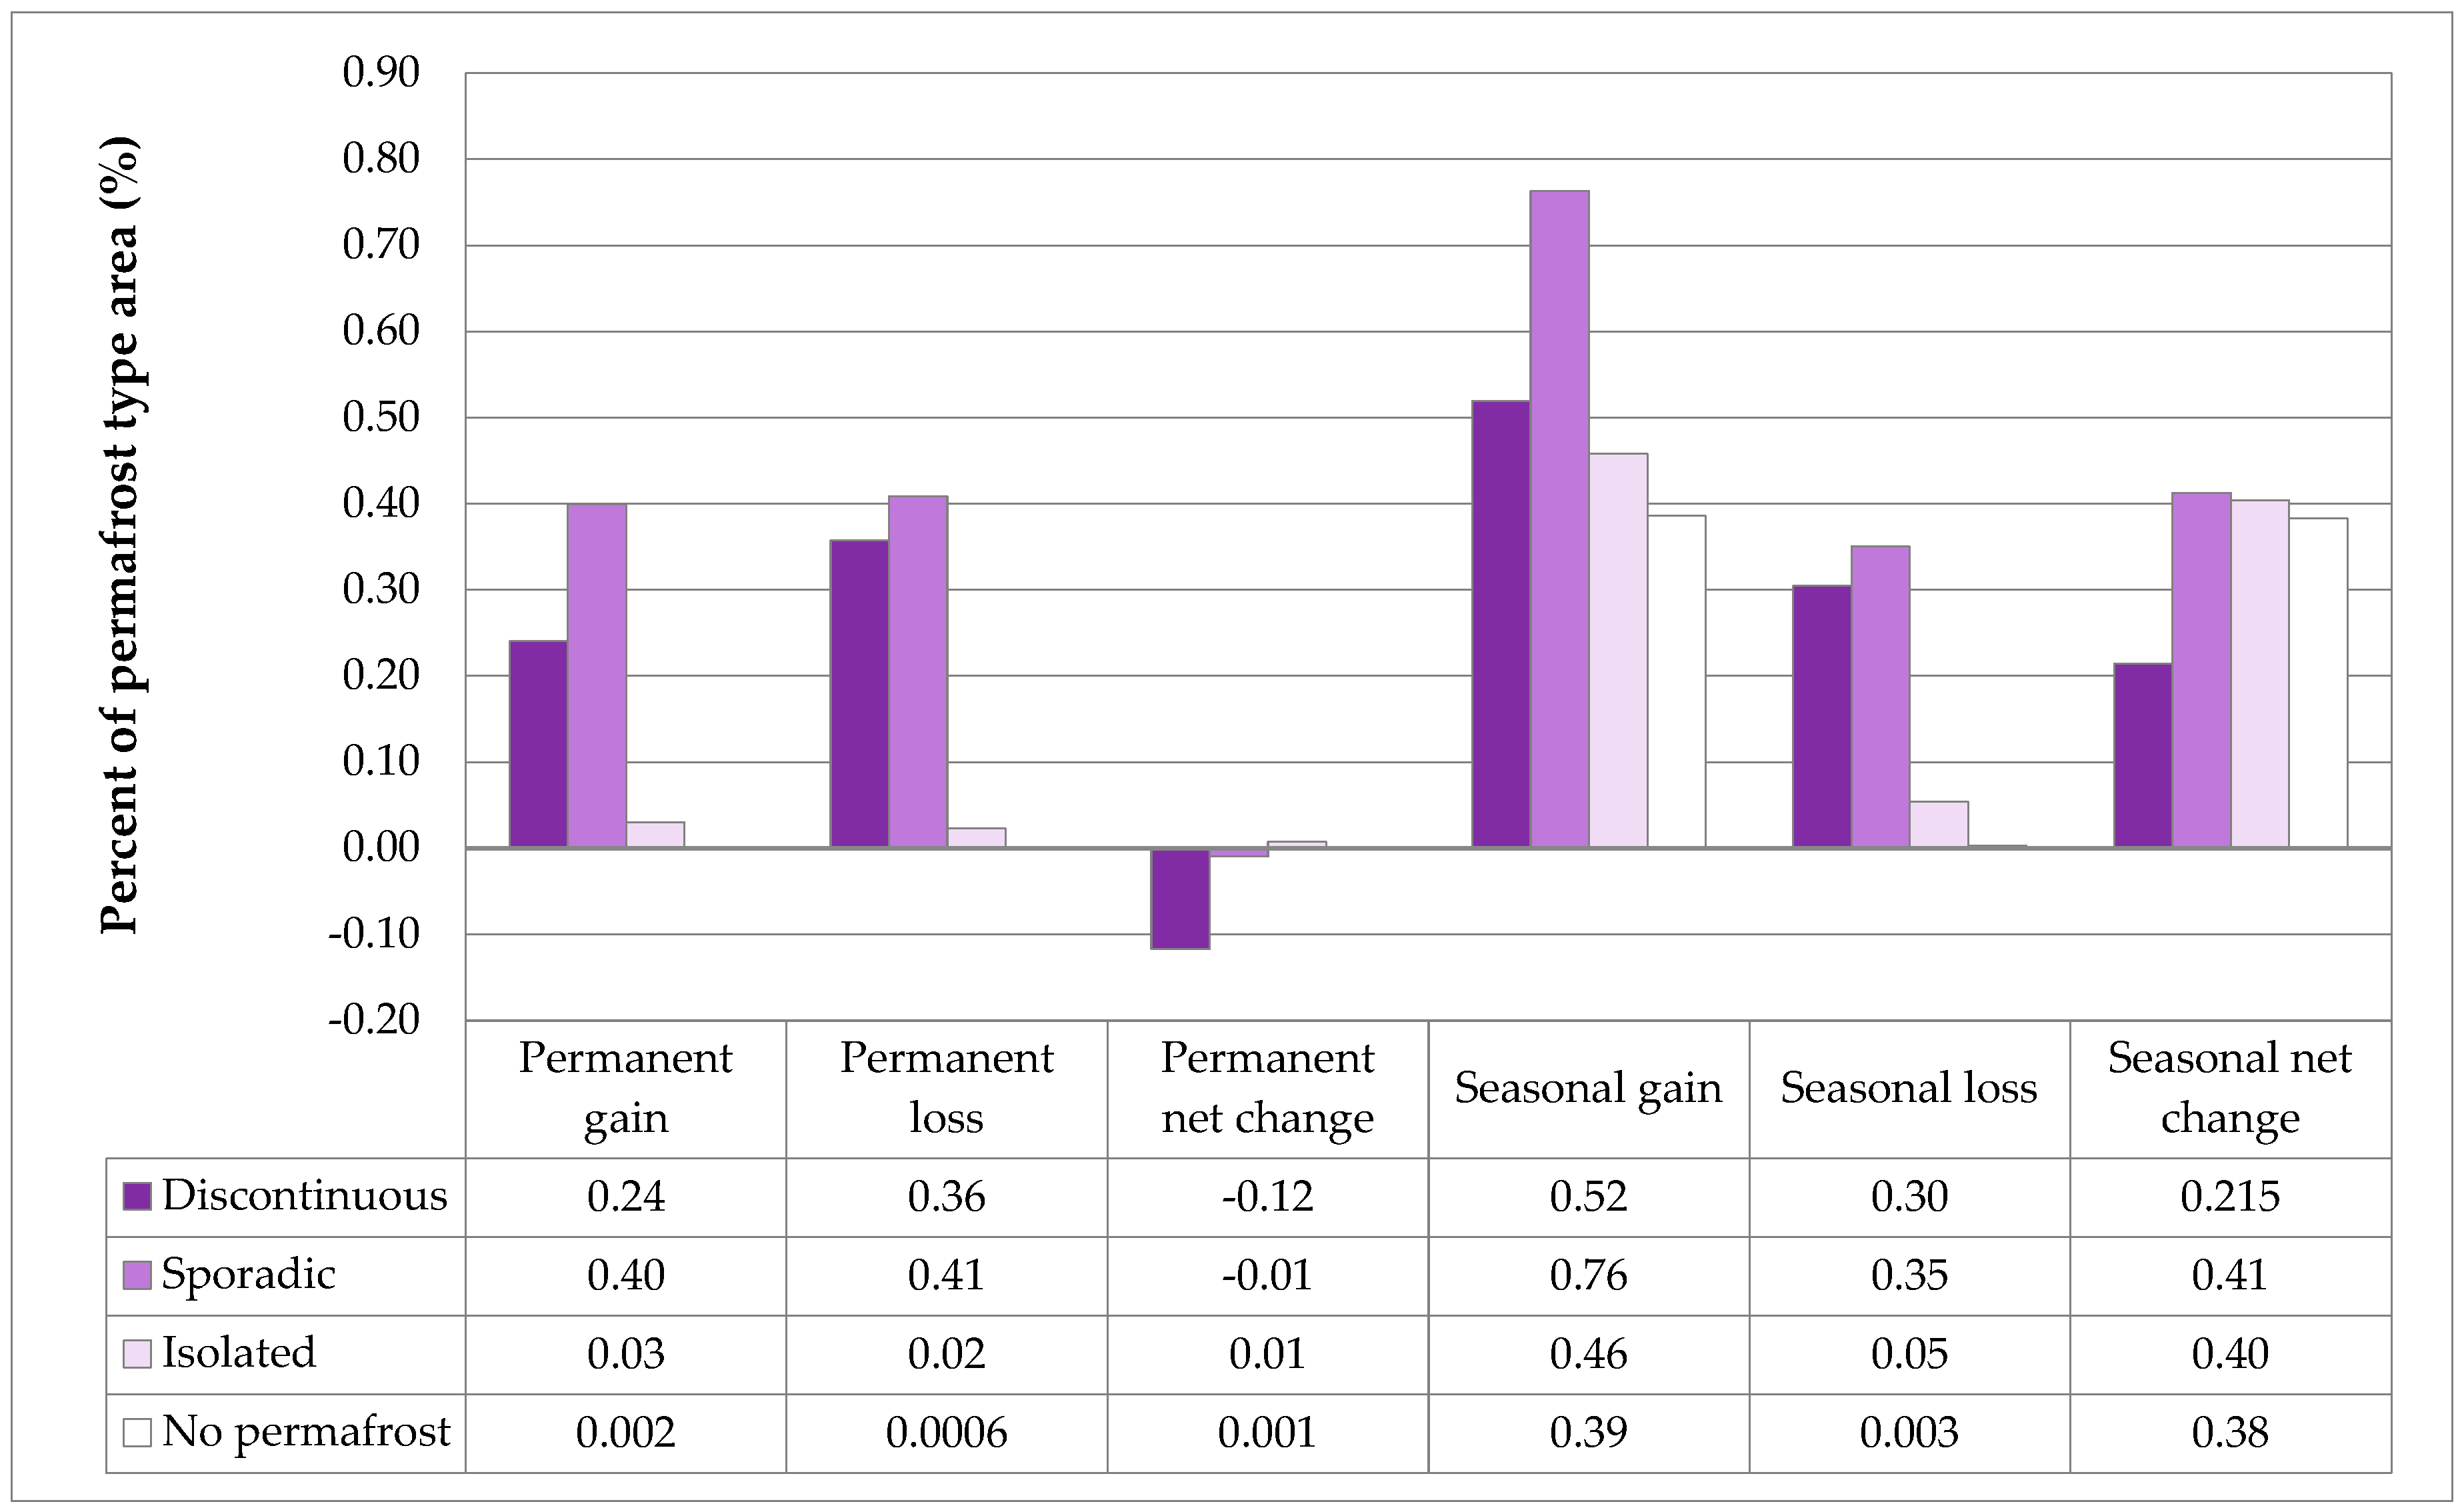
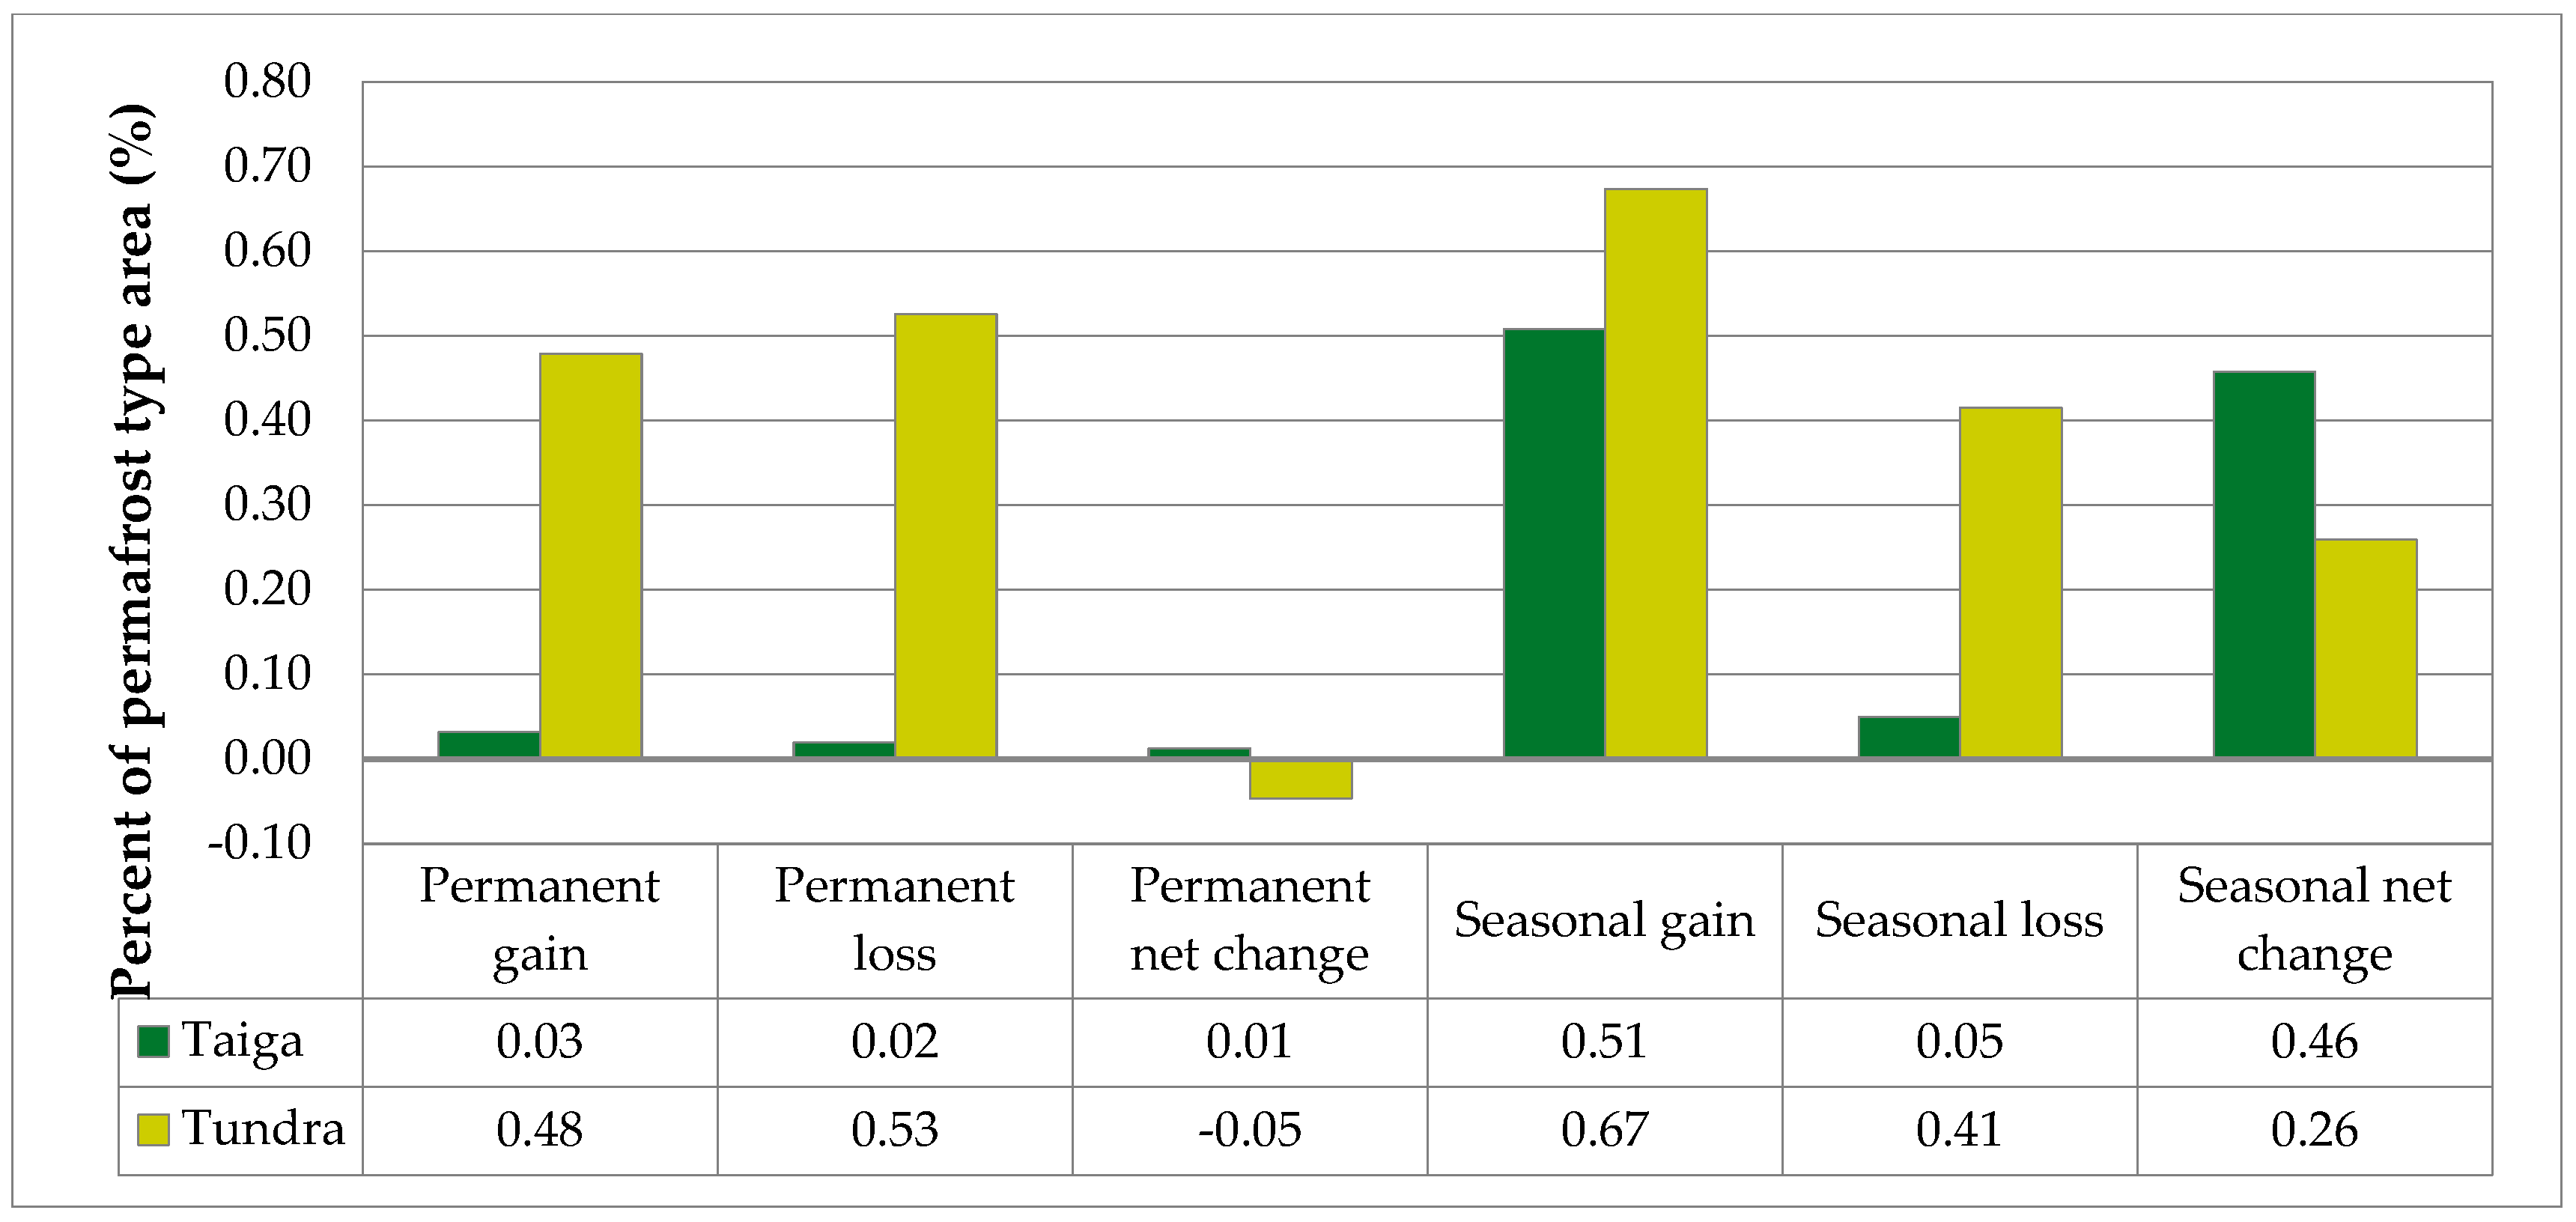
In the Pechora catchment the NDVI mean value ranges temporarily from a minimum of 0.54 in 1991 to a maximum of 0.74 in 2019, while the delta region recorded lower mean values ranging from 0.34 in 2007 to 0.63 in 2017. The discontinuous permafrost area show mean NDVI values highly similar to the delta region, between 0.37 and 0.68, while isolated (0.53–0.79), sporadic (0.49–0.74) and permafrost free areas (0.52–0.81), as well as taiga (0.53–0.76) and tundra (0.49–0.72) regions show values similar to the entire catchment. Contrary to the NDVI, the temporal NDMI values are very similar across the entire catchment and delta region, ranging from 0.21 (1998) to 0.35 (2017), and from 0.18 (1985) to 0.36 (2019), respectively. Different permafrost types reveal the same tendencies for NDMI as for NDVI, with similar mean values across isolated (0.25–0.39), sporadic (0.17–0.29), and permafrost free areas (0.27–0.38), and strikingly lower values across discontinuous permafrost areas (0.03–0.23). The mean NDVI in the Pechora catchment shows an increasing trend in the last 35 years, with a gain of 0.12 between 1985 and 2019 (Figure 3). However, the NDVI only started to increase after 2002, before the NDVI was almost constant or even showed a slight decrease. These results suggest a slight vegetation decline in the Pechora catchment until 2002, but then significantly developed afterwards. The results are in accordance with the average summer air temperature, which shows several colder summers before 2002, but increased frequency of warmer summer since then. Overall, the NDVI tends to follow the average summer temperature, in most cases with a delay of one year. The CCF analysis yields statistically significant values for the highest correlation coefficients of 0.39 at lag 0, and 0.35 at 1-year lag. For example, a warm summer is followed by a peak of NDVI in the next year, such as in 1989–1990, 1993–1994, 2000–2001 or 2016–2017, and a cold summer is followed by NDVI minima in the next year like in 1999–2000, 2001–2003, 2010–2011, 2015–2016 or 2018–2019 (Figure 3).
The spatial distribution of regression slopes of NDVI in the Pechora catchment scale is heterogeneous with an evident general greening trend. Areas showing decreases (browning) or only slight increases in NDVI are distributed mainly at higher altitudes and seem to be correlated with the regression slopes of negative NDMI (Figure 4).
In the Pechora Delta, the NDVI does not show a notable trend over the whole period. However, the NDVI has a pronounced variability that can be separated into three distinct periods. During the first period until 2001/2002, NDVI shows an increasing trend, especially after 1987. This is followed by a decrease until 2007. After 2007, the NDVI was strongly increasing from 0.34 in 2007 to 0.51 in 2019. Like in the Pechora catchment, the vegetation dynamics in the Pechora Delta region is quite consistent with the average summer temperature development, also showing a one-year delay for a significant number of years, the highest correlation coefficient of 0.31 being reached at 1-year lag. Within the period 2001–2006, the pronounced NDVI decrease is most probably due to the lack of cloud-free satellite images, since the average summer temperature shows an increase between 2002 and 2004. Overall, the vegetation greenness is increasing in the Pechora Delta after 1987. Other studies have shown that the increase in NDVI is correlated with the rise in temperature and decrease of precipitation over the same area [54].
The same tendencies were observed in all permafrost zones of the Pechora catchment, however with some delays. In the areas with discontinuous permafrost, the NDVI started to increase noticeably in 2007, while in sporadic permafrost zones an increase was observed distinctively after 2011. In the isolated and permafrost free areas, the NDVI began to reverse its decreasing trend in 2002, coinciding with the trend in the entire Pechora catchment. The gain in NDVI between 1985 and 2019 is much more similar in permafrost areas, with 0.127 on discontinuous permafrost, 0.136 on isolated permafrost and 0.126 on sporadic permafrost, as compared to the permafrost free area, with a gain of 0.088. These results suggest a slightly different behavior of vegetation in permafrost and permafrost free areas, as the vegetation developed in the last years more substantially in permafrost areas (Figure 5).
Throughout the entire period time, the NDVI behaved similarly over the permafrost free area and over areas with isolated and sporadic permafrost, showing more or less the same trends and evolution. However, areas with discontinuous permafrost exhibited much more variation throughout the 35 years. Except for the discontinuous permafrost zone where no significant correlation was found, the highest coefficients of correlation between NDVI time series and average summer temperature was found at 1-year lag. For example, peaks and minimums in temperature were followed by NDVI in 1986–1987, 1989–1990, 1993–1994, 1999–2000, 2000–2001, 2010–2011 or 2016–2017 (Figure 5).
Analyzing the essential biomes of tundra and taiga, the relative differences are small in terms of NDVI evolution, as the trends for both biomes are the same as for the entire Pechora catchment. For both biomes, NDVI was slightly decreasing until 2002, followed by a strong increase with a gain in NDVI from 2002 until 2019 by 0.225 in the taiga area and 0.174 in the tundra. Over the entire period (1985–2019), the NDVI increased by 0.128 in tundra and 0.117 in taiga area. As for the cases considered above, the vegetation dynamic tends to be in accordance with the average summer temperature both in tundra and taiga, showing the same delay of one year (Figure 6).
Regarding vegetation moisture, both Pechora catchment and Pechora Delta show a clear increasing trend in the last 35 years. In the Pechora catchment the NDMI increased by 0.07 between 1985 and 2019, while in the Pechora Delta by 0.18. Unexpectedly, the NDMI trend did not show any decrease before 2011, like NDVI. Contrary to the NDVI, which was following average summer temperature rather than the annual average, the vegetation moisture dynamics seems to better concur with annual total precipitation (R-coefficient of 0.4) rather than summer precipitation (R-coefficient of 0.2), with no lag. NDMI changes are also explained by the annual snow water equivalent, showing an even higher R-coefficient of 0.45. The annual total precipitation shows an increasing trend between 1985 and 2005/2007, both in the Pechora catchment and the delta region, in accordance with the rising trend of NDMI. After the 2005/2007, the annual total precipitation slightly decreases, while NDMI shows only a weak increase (Figure 7).
Our results show that vegetation moisture illustrated by NDMI, similar to vegetation greening illustrated by NDVI, exhibited an increasing and similar trend in the last 35 years within isolated and sporadic permafrost areas, as well as in permafrost free areas. In contrast to these areas, NDMI over the discontinuous permafrost area showed, like for NDVI, much more variation and a slighter increasing trend, suggesting an influence of this type of permafrost on vegetation processes. The gain in NDMI in the last 35 years is lower in the permafrost free area (0.03), compared to the relatively similar values in the permafrost areas, with 0.063 on discontinuous permafrost, 0.075 on isolated permafrost and 0.098 on sporadic permafrost.
These results strengthen the statement above, that permafrost determines a slightly different behavior of vegetation, tending to accelerate vegetation greening and increase moisture. This assumption has meaning in the context of a warming climate, with consequences on permafrost degradation. This is a long term process that also determines an increase in soil temperature that might accelerate the plant growth as revealed by other studies [9,55]. The vegetation moisture increase before 2007 is in accordance with annual total precipitation and annual snow water equivalent data within all permafrost types. This accordance changes somewhat after 2007 when the annual total precipitation tends to decrease while NDMI still increases for all areas except for the discontinuous permafrost zone. For the latter, NDMI also tends to decrease after 2011 (Figure 8).
For the taiga and tundra biomes, vegetation moisture shows the same increasing trends within the entire Pechora catchment in the last 35 years. However, the gain in NDMI is almost double in tundra biome, with a gain of 0.108, compared to the gain of 0.059 in the taiga biome. The vegetation moisture for both biomes is in accordance with annual total precipitation, with increases prior to 2007, decreases between 2007 and 2011, and again increases after 2011 (Figure 9).

3.2. Lake Dynamics

In the Pechora catchment, 161,119 permanent lakes were identified for the analyzed period (1984–2018). Their unchanging water area of 592,289 ha represents 1.47% of the total area of the Pechora catchment. The permanent lakes have a density of 0.4 lakes/km2, an average area of 3.7 ha, a minimum area of 0.19 ha, and the largest lake covers 18,736.3 ha. The minimum area corresponds to the resolution of the resampled Global Surface Water dataset, representing one pixel.
The area of permanent lakes experienced a net loss of 2685.1 ha during 1984–2018, with a gain of 4277.8 ha through the conversion of land into permanent lakes, but a loss of 6962.9 ha through the transformation of permanent to seasonal lakes (Figure 10).
The stable water area of seasonal lakes was 200,101 ha (0.49%), while the number of seasonal lakes was 255,703. Therefore, an average seasonal lake area was 0.79 ha. The smallest seasonal lake covers 0.19 ha and the largest, 10,011.9 ha, with a density of 0.63 lakes/km2. The seasonal lake area showed the highest changes with a net gain of 158,986.5 ha (0.397%). Increases in this area were associated with the loss of land (0.51%) and permanent lakes (0.054%), while decreases were induced by land expansion (0.13%) and permanent lake expansion (0.037%) (Figure 10). The net gain of seasonal lakes could be related to annual snow water equivalent, which increased by 150 mm between 1984 and 2018.
In the Pechora Delta, permanent lakes cover an area of 100,089.4 ha (5.52% of the Pechora Delta study area) between 1984 and 2018. Counting 24,037 permanent lakes, the average density reaches 1.33 lakes/km2, more than three times higher than lake density in the Pechora catchment. The average area of permanent lakes is 4.2 ha, with a minimum of 0.19 ha. The largest permanent lake in Pechora Delta is also the largest in the entire Pechora catchment, with an area of 18,736.3 ha. The same change tendencies as for the entire catchment emerged in the Pechora Delta, with a net loss of permanent lake area of 2393.9 ha (0.13%) (Figure 11).
The stable area of 39,418 seasonal lakes is 39807.8 ha (2.2%), leading to an average lake area of approximately 1 ha. The smallest seasonal lake in the Pechora Delta is 0.19 ha and the largest covering 670.9 ha, with an average density of 2.17 lakes/km2. Throughout the analyzed period, seasonal lakes increased by 16,457.9 ha (0.91%) (Figure 11), which is also most probably related to the increase of annual snow water equivalent by 110 mm.
The highest percentage of permanent lakes from the total area of permafrost type (4.1%) and the highest permanent lake density (1.1 lakes/km2) were found for discontinuous permafrost, followed by sporadic and isolated permafrost, with the lowest values in permafrost free regions (0.03% and 0.01 lakes/km2 respectively). Isolated permafrost and permafrost free regions feature fewer lakes with higher lake average size (4.5 ha), while discontinuous and sporadic permafrost areas are covered by much more permanent lakes with a smaller size (3.6–3.7 ha) (Table 1). The latter is the dominant waterbody type in the Arctic region [56].
Stable seasonal lakes show different behavior depending on the permafrost type. The highest percentages occur for sporadic (1%) and discontinuous permafrost (0.8%) with reversed density values (1.8 lakes/km2 in discontinuous permafrost, and 1.2 lakes/km2 in sporadic permafrost). The isolated permafrost seems to favor the development of larger seasonal lakes (mean area of 0.9 ha), but it is covered by a lower percentage with a much lower lake density (Table 2).
The results reveal that discontinuous and sporadic permafrost type seems to favor the development of a much denser lake network, covering a much higher percentage than isolated and permafrost free regions, regardless of lake type.
Permanent lake area decreased by 0.01% (1520 ha) and 0.12% (2144.5 ha) across sporadic and discontinuous permafrost, respectively. The isolated and permafrost free region exhibited positive net changes regarding permanent lakes, but with much lower amounts, of 0.01% (863.3 ha) and 0.001% (110 ha), respectively (Figure 12).
Seasonal lakes exhibited more pronounced changes, with higher gains and losses over all types (Figure 12). The net gain of seasonal lakes is also in accordance with the annual snow water equivalent, which increased by 200 mm across discontinuous permafrost and 130 mm across sporadic permafrost between 1984 and 2018.
The analysis of lake changes by permafrost types reveals that sporadic and discontinuous permafrost impose a much higher dynamics of lake area across both lake types.
The analysis of the two major biomes shows that in the tundra region a much denser stable lake network exists with higher cover percentage (0.99 lakes/km2 and 3.8% for permanent lakes, 1.38 lakes/km2 and 0.8% for seasonal lakes). The tundra region also has larger permanent lakes (average size of 3.9 ha compared to 2.9 ha in taiga), and smaller seasonal lakes (0.55 ha compared to 1.37 ha in taiga) (Table 3 and Table 4).
Lakes in the tundra region exhibited much higher gains and losses, both for permanent and seasonal lakes. In the tundra region, the net loss of permanent lakes is 0.05% (6153 ha), while in taiga biome a net gain of 0.01% (3462.2 ha) occurred.
As expected, seasonal lakes show much higher net changes, with larger expansions and losses in the tundra region compared to the taiga biome. The net changes of seasonal lakes are positive both in tundra and taiga biomes, with 0.26% (34,159.3 ha) and 0.46% (124,812.6 ha) respectively. Like previous results, the seasonal lake expansion is in accordance with annual snow water equivalent, which increased by 110 mm across the tundra region, and 170 mm across taiga. It is worth to mention that while in taiga biome, both permanent and seasonal lakes showed positive changes, in tundra biome the permanent lakes reduced their area (Figure 13).

4. Discussion

The Landsat images proved to be suitable for assessing the vegetation response to the increasing air temperature since they provide a fair temporal resolution and spatial coverage [20]. Our Landsat NDVI analysis over the Pechora catchment indicates that this sensitive Arctic region experienced a gradual moderate greening trend, mainly since 2002. NDVI values of the entire catchment split by permafrost categories and main vegetation type displayed positive increasing trends in all areas, including the Pechora Delta. Greening trend values of NDVI/year are similar to others captured elsewhere in the northern regions [20,27,43]. Thus, the NDVI has a mean decadal increase of 0.031 in the Pechora catchment over the last 35 years, whereas in the Lena Delta an increase of 0.035 was calculated between 1999 and 2014 [20]. A similar gradual moderate greenness trend (0.003 unit NDVI/year) over 1984–2012 was derived for Canada and Alaska in the US [27]. For the Arctic Mackenzie Delta, a mean decadal NDVI increase of 0.031 was calculated for the 1985–2018 period [43]. The results mentioned above are in agreement with recent findings by Epstein et al. (2018) [57], revealing an overall greening trend throughout most of the Arctic tundra. According to this report, in Eastern Siberia, North Slope of Alaska and the southern zones of the Canadian tundra the NDVI increase is stronger.
Moreover, the spatial distribution of NDVI trend slope reveals the prevalence of regions with extensive and moderate greening of the Pechora catchment, with only a few exceptions (Figure 4). Thus, the north-eastern extremity and the Ural Mountains are associated with the lowest increasing rate of NDVI (0.022 unit NDVI/decade). In contrast to these areas underlain by discontinuous permafrost, the central and southern lowlands of the catchment, dominated by the taiga biome are characterized by a strong greening trend (0.032 unit NDVI/decade). A pronounced greening tendency was also observed in the floodplains in the Pechora Delta (0.030 unit NDVI/decade). At the catchment scale, the distribution of the NDVI trend slope generally decreases as the altitudes rise. Thus, above 500 m the increasing rate of NDVI is relatively small (0.023 unit NDVI/decade), whereas between 200 and 500 m a maximum of 0.033 unit NDVI/decade was calculated.
Arctic greening is generally associated with the lengthening of the growing season [26], changes in land cover type [58], or increases in vegetation productivity [59] as a consequence of warming atmosphere temperatures [60]. In this study, we show that the average summer air temperature is a good proxy for vegetation productivity in the Pechora catchment. Based on plot-based evidence for vegetation transformation or tree-ring analysis, other studies [25,58,61] also revealed increased productivity over the Arctic tundra vegetation due to recent summer warming. Analyzing the relationships between summer maximum NDVI and climatic factors (temperature and precipitation) across four biomes in northern West Siberia, Miles et al., (2019) [62] highlighted strong relationships between the peak annual value of NDVI and June-July surface air temperature. Based on similar findings, other studies [63,64] assumed a recent increase in canopy abundance, height, and radial growth due to increasing summer warmth. Along coastlines, the sustained warming pattern is linked to the decrease of sea ice concentration and, according to Bhatt et al. (2010) [65], the sea-ice retreat is a driving factor for positive NDVI trends. The Pechora Sea located in the south-eastern corner of the Barents Sea is seasonally ice-covered, experiencing the largest fraction of ice loss in March throughout the Northern Hemisphere [66].
Recent studies showed that the most prominent increase of NDVI might be found in the southern tundra and northern taiga [67] where the abundance of relatively tall vegetation leads to greater productivity and a decreased albedo compared with low vegetation of the typical arctic tundra, composed by mosses, lichens, herbs, and small shrubs [68]. In the Pechora catchment, ‘tall shrub tundra’ dominated by dwarf birch (Betula nana L.), lower shrubs and forest-tundra prevail [69] and this might explain the positive NDVI trend. According to the Circumpolar Arctic Vegetation Map [34], the greatest part of the Pechora taiga belongs to bioclimate subzone E and is dominated by shrubs greater than 40 cm tall. This subzone has undergone significant positive trends in the peak annual value of NDVI, both in Eurasia and North America in the last three decades [67]. The north-eastern part of the catchment is characterized by the occurrence of erect dwarf-shrub tundra, which belongs to subzone D. Here, small shrubs (less than 40 cm tall) occupy most of the wet areas, whereas lichen-rich dwarf shrub tundra is common on the sandy soils of the Pechora Sea shore. In this area underlain by discontinuous permafrost, the mean decadal NDVI increase is only 0.022, considerably lower than on sporadic and isolated permafrost area or permafrost-free terrain. Based on our findings it seems that dwarf-shrub tundra in the north-eastern part of the Pechora catchment responds in a different way to increasing summer warmth and has lower productivity. Similar inconsistencies were reported in different Arctic sites, where vegetation productivity was not tightly linked with summer air temperature variations [70].
In the discontinuous permafrost regions, significant differences in productivity and thus, high spatio-temporal variations of NDVI are associated with acidic versus nonacidic soils [63]. The dynamics of NDVI can also be attributed to the composition of vegetation species assemblages since in the discontinuous permafrost zone small shrubs mainly occur in a matrix with lichen-covered bedrock [34]. Despite the overall greening illustrated by the positive NDVI trend throughout most of the Pechora catchment, signs of browning have also been observed, particularly at higher altitude. Several localized hot-spots of browning were also noticed near the river channels, similar to those mentioned in the Lena Delta region [20]. These negative NDVI trends correspond to local-scale processes and might be linked with an increase in bare ground cover as a result of permafrost thaw [71], the occurrence of retrogressive thaw slumps [72], or disturbances of vegetation due to selective foraging and trampling by large herbivores [73]. In the Pechora catchment, the NDMI trend correlates well with the increase of NDVI. For NDMI a mean decadal increase of 0.014 is calculated for the entire Pechora catchment, with the highest increase in the Pechora Delta (0.022 unit NDMI/decade) and the smallest among the areas underlain by discontinuous permafrost (0.004 unit NDMI/decade). The NDMI analysis also revealed strong wetting in the Lena Delta, where a decadal increase of 0.0271 was determined [20]. In the Pechora catchment, as the altitudes increase, the NDMI slope trend decreases considerably. In the Ural Mountains, above 500 m, a low increase was observed (0.004 unit NDMI/decade), whereas between 0 and 100 m the increase was nearly four times larger (0.015 unit NDMI/decade). Similar moderate wetting trends characterize the landscapes with sporadic and isolated permafrost as well as permafrost free regions (between 0.013 and 0.016 unit NDMI/decade). Insignificant differences in the NDMI trend were observed when comparing tundra (0.015 unit NDMI/decade) and taiga (0.014 unit NDMI/decade) biomes. Related to lake dynamics in the Pechora catchment and Pechora Delta, an overall slight decreasing trend has been observed in permanent lakes for the last 35 years. The results indicate a net loss of nearly 27 km2 in the surface area of water in permanent lakes, which is insignificant compared to other arctic regions. Similar findings of disappearing or shrinking lakes were reported for lakes located in different parts of the Arctic [74,75,76]. In Canada, a net reduction of 6700 km2 in lakes area was reported for a territory 25 times larger [75], whereas in Central Siberia large lakes (greater than 40 ha) declined by 11% [74]. For comparison in the Pechora catchment, the most significant decreasing (0.12%) was observed in areas underlain by discontinuous permafrost. In sporadic and isolated permafrost regions and in permafrost free areas the majority of lakes remained relatively stable. Intensive gross lake area loss (−12 to −29%) was reported in discontinuous permafrost regions in Western Siberia [77]. Pokrovsky et al. (2013) [78], also reported rapid decreasing size and water levels (approximately 50 cm) of the thermokarst lakes in the discontinuous permafrost zone within Western Siberia, after the anomalously hot summer in 2012. Analyzing four transects in Alaska, western Canada, Western Siberia, and East Siberia, Nitze et al. [16], concluded that lake area loss is dominant in discontinuous permafrost regions. In Western Siberia, a net lake loss of nearly 8% due to drainage and drying was observed [16]. However, in continuous permafrost regions, a general lake expansion pattern is dominant and was described in central Yakutia [19], Western Siberia [77], East Siberia [16]. The reduction in the surface area of water in permanent lakes is coincident with increased evaporation, due to a warming atmosphere [79]. Vanishing lakes in high-latitude regions are also caused by the permafrost thawing, which increases the subsurface drainage [80]. Also, permafrost thawing may release more nutrients into the warmer soils, stimulating the aquatic vegetation and further contribute to ponds shrinkage [81]. The expansion of seasonal lake area is most likely related to the overall increase of annual snow water equivalent, followed by snow melting peaks, increased water flow and budget in streams that connect the lakes and provide their recharge as mentioned in other studies with test sites in European Russia [21].
Regarding data quality and the confidence of the results, the usage of various Landsat sensors is known to be suitable for such applications [20], however with minor issues. As Nitze and Grosse, 2016 [20], we also used Landsat data at the highest preprocessing level, specifically surface reflectance Level-1 data, subjected to radiometric and atmospheric corrections. The radiometric corrections result in a high normalization of the signal among various sensors with 5% or less uncertainty between TM and ETM+ [82]. Therefore, the very low radiometric differences among sensors could hardly influence the trend analysis. Besides, Nill et al. [43] indicate that the trend analysis of NDVI has a high level of confidence as recording low temporal variations. The issue of the stripe pattern and the corresponding noise, recorded by other studies, has been overcome in our study by using only Landsat 7 satellite images acquired before the failing of the Scan Line Corrector (SLC).

5. Conclusions

Based on remote sensing images, we analyzed trends of summer vegetation greenness (NDVI) and moisture (NDMI) in the Pechora catchment between 1985 and 2019. We found a dominant greening and a consistent moistening of vegetation at the Pechora catchment scale and in the Pechora Delta, however also small areas with a browning trend have been identified. The evolution of NDVI is similar in tundra and taiga biomes, but its increase is slightly higher in the tundra area. Considering NDVI over different permafrost types, a different pattern is only found on the discontinuous permafrost terrain, where NDVI has a higher variability compared to permafrost free, isolated and sporadic permafrost areas that showed a notable increase of vegetation greenness during the analyzed period. One important finding of this study is that in the Pechora catchment, the remote sensing identified dynamics and trends of vegetation greenness are consistent with the evolution of the average summer temperature with a one year lag, while vegetation moisture is following annual total precipitation and annual snow water equivalent without lag. The respective climate parameters were estimated by the ERA-Interim reanalysis and observed at meteorological stations. ERA-Interim reanalysis data was found to be reliable over the Pechora catchment since it showed a very good agreement with the measured meteorological data.
At the Pechora catchment scale, an overall decrease in the area of permanent lakes was observed, but an expansion of seasonal lakes, with distinct behavior depending on the underlying terrain. The permanent and seasonal lakes showed a higher dynamic in areas of permafrost as compared to permafrost free terrain. Regarding the distribution of lakes in major biomes, there is a more evident change in the tundra as compared to taiga areas. The seasonal lake expansion is in accordance with the overall increase of annual snow water equivalent, estimated by ERA-Interim reanalysis across all study areas and different zones.
The general consistency between the indices of vegetation greenness and moisture based on satellite imagery and the climate data highlights the efficacy and reliability of combining Landsat satellite data, ERA-Interim reanalysis and meteorological data to monitor temporal dynamics of the land surface in Arctic areas.

Author Contributions

Conceptualization, F.A. and A.O.; Data curation, M.-A.C.; Formal analysis, M.-A.C., F.A. and G.G.; Funding acquisition, S.H. and A.O.; Investigation, M.-A.C., A.D., F.A., G.G., S.H., V.E.R., A.O. and D.S.D.; Methodology, M.-A.C. and A.D.; Project administration, S.H. and A.O.; Software, M.-A.C., A.D. and G.G.; Supervision, S.H. and V.E.R.; Validation, D.S.D.; Writing—original draft, M.-A.C., A.D. and F.A.; Writing—review & editing, G.G., S.H., V.E.R., A.O. and D.S.D. All authors have read and agreed to the published version of the manuscript.

Funding

This work was supported by a grant of the Romanian National Authority for Scientific Research and Innovation, CCDI-UEFISCDI, project number ERANET-RUS-PLUS-SODEEP, within PNCDI III and by a grant of Ministry of Research and Innovation in Romania, CNCS – UEFISCDI, project title Big Data Science (BID), project number PN III 28-PFE, within PNCDI III. This work was also supported by RSF, grant 16-17-00102. AWI and HZG are supported within ERANET-plus-Russia by BMBF (Grant no. 01DJ18016A and 01DJ18016B).

Acknowledgments

We would like to thank the three anonymous reviewers for their insightful comments and suggestions.

Conflicts of Interest

The authors declare no conflict of interest. The funders had no role in the design of the study; in the collection, analyses, or interpretation of data; in the writing of the manuscript, or in the decision to publish the results.

References

  1. Serreze, M.C.; Barry, R.G. Processes and impacts of Arctic amplification: A research synthesis. Glob. Planet. Chang. 2011, 77, 85–96. [Google Scholar] [CrossRef]
  2. Pörtner, H.; Roberts, D.; Masson-Delmotte, V.; Zhai, P.; Tignor, M.; Poloczanska, E.; Mintenbeck, K.; Nicolai, M.; Okem, A.; Petzold, J. IPCC Special Report on the Ocean and Cryosphere in a Changing Climate; IPCC: Geneva, Switzerland, 2019; Available online: https://ipcc.ch/sr15/ (accessed on 11 March 2020).
  3. Wookey, P.A.; Aerts, R.; Bardgett, R.D.; Baptist, F.; Bråthen, K.A.; Cornelissen, J.H.; Gough, L.; Hartley, I.P.; Hopkins, D.W.; Lavorel, S. Ecosystem feedbacks and cascade processes: Understanding their role in the responses of Arctic and alpine ecosystems to environmental change. Glob. Chang. Biol. 2009, 15, 1153–1172. [Google Scholar] [CrossRef] [Green Version]
  4. Romanovsky, V.E.; Drozdov, D.S.; Oberman, N.G.; Malkova, G.V.; Kholodov, A.L.; Marchenko, S.S.; Moskalenko, N.G.; Sergeev, D.O.; Ukraintseva, N.G.; Abramov, A.A.; et al. Thermal state of permafrost in Russia. Permafr. Periglac. Process. 2010, 21, 136–155. [Google Scholar] [CrossRef]
  5. Chadburn, S.E.; Burke, E.J.; Cox, P.M.; Friedlingstein, P.; Hugelius, G.; Westermann, S. An observation-based constraint on permafrost loss as a function of global warming. Nat. Clim. Chang. 2017, 7, 340–344. [Google Scholar] [CrossRef]
  6. Drozdov, D.; Malkova, G.; Romanovsky, V.; Sergeev, D.; Shiklomanov, N.; Kholodov, A.; Ponomareva, O.; Streletskiy, D. Monitoring of permafrost in Russia. Russian database and the international GTN-P project. In Proceedings of the 68th Canadian Geotechnical Conf. and Seventh Canadian Conf. on Permafrost (GEOQuébec 2015), Quebec, QC, Canada, 21–23 September 2015. Paper 617. [Google Scholar]
  7. Romanovsky, V.; Isaksen, K.; Drozdov, D.; Anisimov, O.; Instanes, A.; Leibman, M.; McGuire, D.; Shiklomanov, N.; Smith, S.; Walker, D. Changing permafrost and its impacts. In Snow, Water, Ice and Permafrost in the Arctic (SWIPA) 2017, Arctic, Monitoring and Assessment Programme (AMAP); Narayana Press: Oslo, Norway, 2017; pp. 65–102. [Google Scholar]
  8. Biskaborn, B.K.; Smith, S.L.; Noetzli, J.; Matthes, H.; Vieira, G.; Streletskiy, D.A.; Schoeneich, P.; Romanovsky, V.E.; Lewkowicz, A.G.; Abramov, A. Permafrost is warming at a global scale. Nat. Commun. 2019, 10, 264. [Google Scholar] [CrossRef] [Green Version]
  9. Guo, J.; Hu, Y.; Xiong, Z.; Yan, X.; Li, C.; Bu, R. Variations in growing-season NDVI and its response to permafrost degradation in Northeast China. Sustainability 2017, 9, 551. [Google Scholar] [CrossRef] [Green Version]
  10. Lloyd, A.H.; Yoshikawa, K.; Fastie, C.L.; Hinzman, L.; Fraver, M. Effects of permafrost degradation on woody vegetation at arctic treeline on the Seward Peninsula, Alaska. Permafr. Periglac. Process. 2003, 14, 93–101. [Google Scholar] [CrossRef]
  11. Wang, X.; Chen, R.; Yang, Y. Effects of Permafrost Degradation on the Hydrological Regime in the Source Regions of the Yangtze and Yellow Rivers, China. Water 2017, 9, 897. [Google Scholar] [CrossRef] [Green Version]
  12. Jorgenson, M.T.; Harden, J.; Kanevskiy, M.; O’Donnell, J.; Wickland, K.; Ewing, S.; Manies, K.; Zhuang, Q.; Shur, Y.; Striegl, R.; et al. Reorganization of vegetation, hydrology and soil carbon after permafrost degradation across heterogeneous boreal landscapes. Environ. Res. Lett. 2013, 8, 035017. [Google Scholar] [CrossRef]
  13. Hjort, J.; Karjalainen, O.; Aalto, J.; Westermann, S.; Romanovsky, V.E.; Nelson, F.E.; Etzelmüller, B.; Luoto, M. Degrading permafrost puts Arctic infrastructure at risk by mid-century. Nat. Commun. 2018, 9, 1–9. [Google Scholar] [CrossRef] [PubMed]
  14. Karjalainen, O.; Aalto, J.; Luoto, M.; Westermann, S.; Romanovsky, V.E.; Nelson, F.E.; Etzelmüller, B.; Hjort, J. Circumpolar permafrost maps and geohazard indices for near-future infrastructure risk assessments. Sci. Data 2019, 6, 190037. [Google Scholar] [CrossRef] [PubMed] [Green Version]
  15. Grosse, G.; Romanovsky, V.; Jorgenson, T.; Anthony, K.W.; Brown, J.; Overduin, P.P. Vulnerability and feedbacks of permafrost to climate change. EosTrans. Am. Geophys. Union 2011, 92, 73–74. [Google Scholar] [CrossRef]
  16. Nitze, I.; Grosse, G.; Jones, B.M.; Romanovsky, V.E.; Boike, J. Remote sensing quantifies widespread abundance of permafrost region disturbances across the Arctic and Subarctic. Nat. Commun. 2018, 9, 1–11. [Google Scholar] [CrossRef] [PubMed]
  17. Malkova, G.V.; Pavlov, A.V. GIS mapping of climate and permafrost change in northern Russia. In Proceedings of the 10th International Conference on Permafrost, Salekhard, Russia, 25–29 June 2012; pp. 313–318. [Google Scholar]
  18. Ge, S.; McKenzie, J.; Voss, C.; Wu, Q. Exchange of groundwater and surface-water mediated by permafrost response to seasonal and long term air temperature variation. Geophys. Res. Lett. 2011, 38. [Google Scholar] [CrossRef] [Green Version]
  19. Boike, J.; Grau, T.; Heim, B.; Günther, F.; Langer, M.; Muster, S.; Gouttevin, I.; Lange, S. Satellite-derived changes in the permafrost landscape of central Yakutia, 2000–2011: Wetting, drying, and fires. Glob. Planet. Chang. 2016, 139, 116–127. [Google Scholar] [CrossRef] [Green Version]
  20. Nitze, I.; Grosse, G. Detection of landscape dynamics in the Arctic Lena Delta with temporally dense Landsat time-series stacks. Remote Sens. Environ. 2016, 181, 27–41. [Google Scholar] [CrossRef]
  21. Kravtsova, V.; Rodionova, T. Variations in size and number of thermokarst lakes in different permafrost regions: Spaceborn evidence. Earth’s Cryosphere 2016, 1, 75–81. [Google Scholar]
  22. Zhiliba, A.; Vandisheva, G.; Gribanov, G.; Zakharov, V. Global climate change. Is «Methane bomb» scenario sensitive to melting permafrost of West Siberia peat land? Environ. Dyn. Glob. Clim. Chang. 2011, 2, 1–14. [Google Scholar] [CrossRef] [Green Version]
  23. Bhatt, U.S.; Walker, D.A.; Raynolds, M.K.; Bieniek, P.A.; Epstein, H.E.; Comiso, J.C.; Pinzon, J.E.; Tucker, C.J.; Polyakov, I.V. Recent Declines in Warming and Vegetation Greening Trends over Pan-Arctic Tundra. Remote Sens. 2013, 5, 4229–4254. [Google Scholar] [CrossRef] [Green Version]
  24. Forbes, B.C.; Fauria, M.M.; Zetterberg, P. Russian Arctic warming and ‘greening’are closely tracked by tundra shrub willows. Glob. Chang. Biol. 2010, 16, 1542–1554. [Google Scholar] [CrossRef]
  25. Myers-Smith, I.H.; Forbes, B.C.; Wilmking, M.; Hallinger, M.; Lantz, T.; Blok, D.; Tape, K.D.; Macias-Fauria, M.; Sass-Klaassen, U.; Lévesque, E.; et al. Shrub expansion in tundra ecosystems: Dynamics, impacts and research priorities. Environ. Res. Lett. 2011, 6, 045509. [Google Scholar] [CrossRef] [Green Version]
  26. Arndt, K.A.; Santos, M.J.; Ustin, S.; Davidson, S.J.; Stow, D.; Oechel, W.C.; Tran, T.T.; Graybill, B.; Zona, D. Arctic greening associated with lengthening growing seasons in Northern Alaska. Environ. Res. Lett. 2019, 14, 125018. [Google Scholar] [CrossRef]
  27. Ju, J.; Masek, J.G. The vegetation greenness trend in Canada and US Alaska from 1984–2012 Landsat data. Remote Sens. Environ. 2016, 176, 1–16. [Google Scholar] [CrossRef]
  28. Epstein, H.E.; Raynolds, M.K.; Walker, D.A.; Bhatt, U.S.; Tucker, C.J.; Pinzon, J.E. Dynamics of aboveground phytomass of the circumpolar Arctic tundra during the past three decades. Environ. Res. Lett. 2012, 7, 015506. [Google Scholar] [CrossRef]
  29. Frost, G.V.; Epstein, H.E.; Walker, D.A. Regional and landscape-scale variability of Landsat-observed vegetation dynamics in northwest Siberian tundra. Environ. Res. Lett. 2014, 9, 025004. [Google Scholar] [CrossRef] [Green Version]
  30. Field, C.; Barros, V.; Dokken, D.; Mach, K.; Mastrandrea, M.; Bilir, T.; Chatterjee, M.; Ebi, K.; Estrada, Y.; Genova, R.; et al. Climate Change 2014. Impacts, Adaptation, and Vulnerability. Part A: Global and Sectoral Aspects; CUP: Cambridge, UK; New York, NY, USA, 2014. [Google Scholar]
  31. Wulder, M.A.; White, J.C.; Loveland, T.; Woodcock, C.; Belward, A.; Cohen, W.B.; Fosnight, E.A.; Shaw, J.; Masek, J.G.; Roy, D.P. The global Landsat archive: Status, consolidation, and direction. Remote Sens. Environ. 2016, 185, 271–283. [Google Scholar] [CrossRef] [Green Version]
  32. Dee, D.P.; Uppala, S.M.; Simmons, A.; Berrisford, P.; Poli, P.; Kobayashi, S.; Andrae, U.; Balmaseda, M.; Balsamo, G.; Bauer, D.P. The ERA-Interim reanalysis: Configuration and performance of the data assimilation system. Q. J. R. Meteorol. Soc. 2011, 137, 553–597. [Google Scholar] [CrossRef]
  33. Obu, J.; Westermann, S.; Bartsch, A.; Berdnikov, N.; Christiansen, H.H.; Dashtseren, A.; Delaloye, R.; Elberling, B.; Etzelmüller, B.; Kholodov, A.; et al. Northern Hemisphere permafrost map based on TTOP modelling for 2000–2016 at 1 km2 scale. Earth-Sci. Rev. 2019, 193, 299–316. [Google Scholar] [CrossRef]
  34. Walker, D.A.; Raynolds, M.K.; Daniëls, F.J.; Einarsson, E.; Elvebakk, A.; Gould, W.A.; Katenin, A.E.; Kholod, S.S.; Markon, C.J.; Melnikov, E.S. The circumpolar Arctic vegetation map. J. Veg. Sci. 2005, 16, 267–282. [Google Scholar] [CrossRef]
  35. Van der Sluis, T.; Degteva, S.; Slim, P.; Pedroli, B. Towards biodiversity assessment for boreal forests in the Pechora River Basin (Russian Federation). In Proceedings of the Conference on Monitoring and Indicators of Forest Biodiversity in Europe-From Ideas to Operationality, Florence, Italy, 12–15 November 2003; pp. 467–480. [Google Scholar]
  36. Zhong, X.; Zhang, T.; Wang, K. Snow density climatology across the former USSR. Cryosphere 2014, 8, 785. [Google Scholar] [CrossRef] [Green Version]
  37. Drozdov, D.; Malkova, G.; Melnikov, E. The set of eco-geologic digital maps of the Timan-Pechora province. In Proceedings of the 8th International Conference on Permafrost, Zürich, Switzerland, 21–25 July 2003; pp. 21–25. [Google Scholar]
  38. Van der Sluis, T.; Degteva, S.; Ference System for NorthwPedroli Group. The Pechora River (Russia): Reest European Rivers? In Proceedings of the International Conference ‘Towards Natural Flood Reduction Strategies’, Warsaw, Poland, 6–13 September 2003; pp. 6–13. [Google Scholar]
  39. Degteva, S.V.; Ponomarev, V.I.; Eisenman, S.W.; Dushenkov, V. Striking the balance: Challenges and perspectives for the protected areas network in northeastern European Russia. Ambio 2015, 44, 473–490. [Google Scholar] [CrossRef] [PubMed] [Green Version]
  40. Walker, T.R.; Crittenden, P.D.; Dauvalter, V.A.; Jones, V.; Kuhry, P.; Loskutova, O.; Mikkola, K.; Nikula, A.; Patova, E.; Ponomarev, V.I. Multiple indicators of human impacts on the environment in the Pechora Basin, north-eastern European Russia. Ecol. Indic. 2009, 9, 765–779. [Google Scholar] [CrossRef]
  41. Magritsky, D.; Lebedeva, S.; Skripnik, E. Hydrological hazards at mouths of the Northern Dvina and the Pechora rivers, Russian Federation. Nat. Hazards 2017, 88, 149–170. [Google Scholar] [CrossRef]
  42. Mazhitova, G.; Malkova, G.; Chestnykh, O.; Zamolodchikov, D. Active-layer spatial and temporal variability at European Russian Circumpolar-Active-Layer-Monitoring (CALM) sites. Permafr. Periglac. Process. 2004, 15, 123–139. [Google Scholar] [CrossRef]
  43. Fraser, R.H.; Olthof, I.; Kokelj, S.V.; Lantz, T.C.; Lacelle, D.; Brooker, A.; Wolfe, S.; Schwarz, S. Detecting landscape changes in high latitude environments using landsat trend analysis: 1. Visualization. Remote Sens. 2014, 6, 11533–11557. [Google Scholar] [CrossRef] [Green Version]
  44. Nill, L.; Ullmann, T.; Kneisel, C.; Sobiech-Wolf, J.; Baumhauer, R. Assessing Spatiotemporal Variations of Landsat Land Surface Temperature and Multispectral Indices in the Arctic Mackenzie Delta Region between 1985 and 2018. Remote Sens. 2019, 11, 2329. [Google Scholar] [CrossRef] [Green Version]
  45. Ji, L.; Zhang, L.; Wylie, B.K.; Rover, J. On the terminology of the spectral vegetation index (NIR − SWIR)/(NIR + SWIR). Int. J. Remote Sens. 2011, 32, 6901–6909. [Google Scholar] [CrossRef]
  46. Rouse, J.; Haas, R.; Schell, J.; Deering, D. Monitoring vegetation systems in the Great Plains with ERTS. NASA Spec. Publ. 1974, 351, 309. [Google Scholar]
  47. Wilson, E.H.; Sader, S.A. Detection of forest harvest type using multiple dates of Landsat TM imagery. Remote Sens. Environ. 2002, 80, 385–396. [Google Scholar] [CrossRef]
  48. Fensholt, R.; Proud, S.R. Evaluation of earth observation based global long term vegetation trends—Comparing GIMMS and MODIS global NDVI time series. Remote Sens. Environ. 2012, 119, 131–147. [Google Scholar] [CrossRef]
  49. Pekel, J.-F.; Cottam, A.; Gorelick, N.; Belward, A.S. High-resolution mapping of global surface water and its long-term changes. Nature 2016, 540, 418. [Google Scholar] [CrossRef] [PubMed]
  50. JRC. Global Surface Water- Data Users Guide (v2); Joint Research Centre: Ispra, Italy, 2019. [Google Scholar]
  51. OpenStreetMap Contributors. Planet Dump Northwestern Federal District. 2015. Available online: Https://Planet.Openstreetmap.Org (accessed on 28 May 2020).
  52. Lindsay, R.; Wensnahan, M.; Schweiger, A.; Zhang, J. Evaluation of seven different atmospheric reanalysis products in the Arctic. J. Clim. 2014, 27, 2588–2606. [Google Scholar] [CrossRef] [Green Version]
  53. De Rosnay, P.; Balsamo, G.; Albergel, C.; Muñoz-Sabater, J.; Isaksen, L. Initialisation of land surface variables for numerical weather prediction. Surv. Geophys. 2014, 35, 607–621. [Google Scholar] [CrossRef]
  54. Lopatin, E.; Kolström, T.; Spiecker, H. Determination of forest growth trends in Komi Republic (northwestern Russia): Combination of tree-ring analysis and remote sensing data. Boreal Environ. Res. 2006, 11, 341–353. [Google Scholar]
  55. Schuur, E.A.; Crummer, K.G.; Vogel, J.G.; Mack, M.C. Plant species composition and productivity following permafrost thaw and thermokarst in Alaskan tundra. Ecosystems 2007, 10, 280–292. [Google Scholar] [CrossRef]
  56. Muster, S.; Heim, B.; Abnizova, A.; Boike, J. Water body distributions across scales: A remote sensing based comparison of three arctic tundra wetlands. Remote Sens. 2013, 5, 1498–1523. [Google Scholar] [CrossRef] [Green Version]
  57. Epstein, J.; Bhatt, U.; Raynolds, M.; Walker, D.; Forbes, B.; Phoenix, G.; Bjerke, J.; Tommervik, H.; Karlsen, S.R.; Myneni, R.; et al. Tundra Greenness. Noaa Arct. Rep. Card. 2018. Available online: https://arctic.noaa.gov/Report-Card/Report-Card-2018/ArtMID/7878/ArticleID/777/Tundra-Greenness (accessed on 28 May 2020).
  58. Elmendorf, S.C.; Henry, G.H.R.; Hollister, R.D.; Björk, R.G.; Boulanger-Lapointe, N.; Cooper, E.J.; Cornelissen, J.H.C.; Day, T.A.; Dorrepaal, E.; Elumeeva, T.G.; et al. Plot-scale evidence of tundra vegetation change and links to recent summer warming. Nat. Clim. Chang. 2012, 2, 453–457. [Google Scholar] [CrossRef]
  59. Hudson, J.M.G.; Henry, G.H.R. Increased plant biomass in a High Arctic heath community from 1981 to 2008. Ecology 2009, 90, 2657–2663. [Google Scholar] [CrossRef]
  60. Zhu, Z.; Piao, S.; Myneni, R.B.; Huang, M.; Zeng, Z.; Canadell, J.G.; Ciais, P.; Sitch, S.; Friedlingstein, P.; Arneth, A.; et al. Greening of the Earth and its drivers. Nat. Clim. Chang. 2016, 6, 791–795. [Google Scholar] [CrossRef]
  61. Ackerman, D.E.; Griffin, D.; Hobbie, S.E.; Popham, K.; Jones, E.; Finlay, J.C. Uniform shrub growth response to June temperature across the North Slope of Alaska. Environ. Res. Lett. 2018, 13, 044013. [Google Scholar] [CrossRef]
  62. Miles, M.W.; Miles, V.V.; Esau, I. Varying climate response across the tundra, forest-tundra and boreal forest biomes in northern West Siberia. Environ. Res. Lett. 2019, 14, 075008. [Google Scholar] [CrossRef] [Green Version]
  63. Walker, D.; Epstein, H.; Raynolds, M.; Kuss, P.; Kopecky, M.; Frost, G.; Daniëls, F.; Leibman, M.; Moskalenko, N.; Matyshak, G. Environment, vegetation and greenness (NDVI) along the North America and Eurasia Arctic transects. Environ. Res. Lett. 2012, 7, 015504. [Google Scholar] [CrossRef] [Green Version]
  64. Verbyla, D.; Kurkowski, T.A. NDVI–Climate relationships in high-latitude mountains of Alaska and Yukon Territory. Arct. Antarct. Alp. Res. 2019, 51, 397–411. [Google Scholar] [CrossRef] [Green Version]
  65. Bhatt, U.S.; Walker, D.A.; Raynolds, M.K.; Comiso, J.C.; Epstein, H.E.; Jia, G.; Gens, R.; Pinzon, J.E.; Tucker, C.J.; Tweedie, C.E.; et al. Circumpolar Arctic Tundra Vegetation Change Is Linked to Sea Ice Decline. Earth Interact. 2010, 14, 1–20. [Google Scholar] [CrossRef] [Green Version]
  66. Onarheim, I.H.; Eldevik, T.; Smedsrud, L.H.; Stroeve, J.C. Seasonal and Regional Manifestation of Arctic Sea Ice Loss. J. Clim. 2018, 31, 4917–4932. [Google Scholar] [CrossRef]
  67. Reichle, L.M.; Epstein, H.E.; Bhatt, U.S.; Raynolds, M.K.; Walker, D.A. Spatial Heterogeneity of the Temporal Dynamics of Arctic Tundra Vegetation. Geophys. Res. Lett. 2018, 45, 9206–9215. [Google Scholar] [CrossRef] [Green Version]
  68. Lawrence, D.M.; Swenson, S.C. Permafrost response to increasing Arctic shrub abundance depends on the relative influence of shrubs on local soil cooling versus large-scale climate warming. Environ. Res. Lett. 2011, 6, 045504. [Google Scholar] [CrossRef]
  69. Virtanen, T.; Mikkola, K.; Patova, E.; Nikula, A. Satellite image analysis of human caused changes in the tundra vegetation around the city of Vorkuta, north-European Russia. Environ. Pollut. 2002, 120, 647–658. [Google Scholar] [CrossRef] [Green Version]
  70. Elmendorf, S.C.; Henry, G.H.; Hollister, R.D.; Björk, R.G.; Bjorkman, A.D.; Callaghan, T.V.; Collier, L.S.; Cooper, E.J.; Cornelissen, J.H.; Day, T.A. Global assessment of experimental climate warming on tundra vegetation: Heterogeneity over space and time. Ecol. Lett. 2012, 15, 164–175. [Google Scholar] [CrossRef]
  71. Grosse, G.; Goetz, S.; McGuire, A.; Romanovsky, V.; Schuur, E. Changing permafrost in a warming world and feedbacks to the Earth system. Environ. Res. Lett. 2016, 11, 040201. [Google Scholar] [CrossRef]
  72. Myers-Smith, I.H.; Kerby, J.T.; Phoenix, G.K.; Bjerke, J.W.; Epstein, H.E.; Assmann, J.J.; John, C.; Andreu-Hayles, L.; Angers-Blondin, S.; Beck, P.S.A.; et al. Complexity revealed in the greening of the Arctic. Nat. Clim. Chang. 2020, 10, 106–117. [Google Scholar] [CrossRef] [Green Version]
  73. Olofsson, J.; Post, E. Effects of large herbivores on tundra vegetation in a changing climate, and implications for rewilding. Philos. Trans. R. Soc. B: Biol. Sci. 2018, 373, 20170437. [Google Scholar] [CrossRef] [Green Version]
  74. Smith, L.C.; Sheng, Y.; MacDonald, G.; Hinzman, L. Disappearing arctic lakes. Science 2005, 308, 1429. [Google Scholar] [CrossRef] [PubMed] [Green Version]
  75. Carroll, M.L.; Townshend, J.R.G.; DiMiceli, C.M.; Loboda, T.; Sohlberg, R.A. Shrinking lakes of the Arctic: Spatial relationships and trajectory of change. Geophys. Res. Lett. 2011, 38. [Google Scholar] [CrossRef] [Green Version]
  76. Andresen, C.G.; Lougheed, V.L. Disappearing Arctic tundra ponds: Fine-scale analysis of surface hydrology in drained thaw lake basins over a 65 year period (1948–2013). J. Geophys. Res. Biogeosciences 2015, 120, 466–479. [Google Scholar] [CrossRef]
  77. Kirpotin, S.; Polishchuk, Y.; Bryksina, N. Abrupt changes of thermokarst lakes in Western Siberia: Impacts of climatic warming on permafrost melting. Int. J. Environ. Stud. 2009, 66, 423–431. [Google Scholar] [CrossRef]
  78. Pokrovsky, O.S.; Shirokova, L.S.; Kirpotin, S.N.; Kulizhsky, S.P.; Vorobiev, S.N. Impact of western Siberia heat wave 2012 on greenhouse gases and trace metal concentration in thaw lakes of discontinuous permafrost zone. Biogeosciences 2013, 10, 5349–5365. [Google Scholar] [CrossRef] [Green Version]
  79. Roach, J.K.; Griffith, B.; Verbyla, D. Landscape influences on climate-related lake shrinkage at high latitudes. Glob. Chang. Biol. 2013, 19, 2276–2284. [Google Scholar] [CrossRef]
  80. Jepsen, S.M.; Voss, C.I.; Walvoord, M.A.; Minsley, B.J.; Rover, J. Linkages between lake shrinkage/expansion and sublacustrine permafrost distribution determined from remote sensing of interior Alaska, USA. Geophys. Res. Lett. 2013, 40, 882–887. [Google Scholar] [CrossRef]
  81. Grosse, G.; Romanovsky, V.; Walter, K.; Morgenstern, A.; Lantuit, H.; Zimov, S. Distribution of thermokarst lakes and ponds at three yedoma sites in Siberia. In Proceedings of the Ninth International Conference on Permafrost, Institute of Northern Engineering, University of Alaska Fairbanks, Fairbanks, Alaska, 29 June–3 July 2008; pp. 551–556. [Google Scholar]
  82. Markham, B.L.; Helder, D.L. Forty-year calibrated record of earth-reflected radiance from Landsat: A review. Remote Sens. Environ. 2012, 122, 30–40. [Google Scholar] [CrossRef] [Green Version]
Figure 1. Location of the study area (a), altitude (b), main biomes (c) and permafrost types (d) within Pechora catchment; Pechora delta is highlighted by a red square.
Remotesensing 12 01863 g001
Figure 2. Climatology of the regions of interest estimated from ERA-Interim data in comparison with meteorological observations. Top panel shows monthly 2 m air temperature with annual means for various regions of interest. Mid panel shows monthly precipitations with annual sum. Bottom panel shows Snow Water Equivalent (SWE) with annual total. Note that for meteorological stations (Naryan-Mar and C. Konstantinovski) snow depth was converted to SWE assuming climatological values of snow density for tundra estimated by Zhong et al. [52].
Remotesensing 12 01863 g002
Figure 3. Vegetation greening (NDVI) dynamics over the last 35 years, comparison with climatic data (ERA-Interim for Pechora catchment and Pechora delta, and meteorological stations Naryan Mar and Cape Konstantinovski).
Remotesensing 12 01863 g003
Figure 4. Annual trend slope of vegetation multi-spectral indices within Pechora catchment.
Remotesensing 12 01863 g004
Figure 5. Vegetation greening (NDVI) dynamics within permafrost types (DP—discontinuous permafrost; IP—isolated permafrost; SP—sporadic permafrost; NoP—no permafrost), comparison with climatic data (ERA-Interim for permafrost types, and meteorological stations Naryan Mar and Cape Konstantinovski).
Remotesensing 12 01863 g005
Figure 6. Vegetation greening (NDVI) dynamics within major biomes, comparison with climatic data (ERA-Interim for biomes, and meteorological stations Naryan Mar and Cape Konstantinovski).
Remotesensing 12 01863 g006
Figure 7. Vegetation moisture (NDMI) dynamics within study areas, comparison with climatic data (ERA-Interim for Pechora catchment and Pechora delta, and meteorological stations Naryan Mar and Cape Konstantinovski).
Remotesensing 12 01863 g007
Figure 8. Vegetation moisture (NDMI) dynamics within permafrost types (DP—discontinuous permafrost; IP—isolated permafrost; SP—sporadic permafrost; NoP—no permafrost), comparison with climatic data (ERA-Interim for permafrost types, and meteorological stations Naryan Mar and Cape Konstantinovski).
Remotesensing 12 01863 g008
Figure 9. Vegetation moisture (NDMI) dynamics within major biomes, comparison with climatic data (ERA-Interim for biomes, and meteorological stations Naryan Mar and Cape Konstantinovski).
Remotesensing 12 01863 g009
Figure 10. Changes of permanent and seasonal lakes in the Pechora catchment.
Remotesensing 12 01863 g010
Figure 11. Changes regarding permanent and seasonal lakes in Pechora delta.
Remotesensing 12 01863 g011
Figure 12. Changes regarding permanent and seasonal lakes across permafrost types.
Remotesensing 12 01863 g012
Figure 13. Changes regarding permanent and seasonal lakes across biomes.
Remotesensing 12 01863 g013
Table 1. Statistics on stable permanent lakes for different permafrost types.
Total Area (ha)Number of LakesLake Area
(ha)
Percent
(%)
Mean (ha)Min (ha)Max (ha)Density (lakes/km2)
Discontinuous1,833,06520,18475,039.34.13.70.195200.51.1
Sporadic15,992,650130,473469,998.02.93.60.1917,130.10.8
Isolated11,737,817985044,476.40.44.50.193026.70.1
No permafrost10,870,3416122775.30.034.50.191606.30.01
Table 2. Statistics on stable seasonal lakes for different permafrost types.
Total Area (ha)Number of LakesArea
(ha)
Percent
(%)
Mean (ha)Min (ha)Max (ha)Density (lakes/km2)
Discontinuous1,833,06533,65515,065.40.80.40.19859.71.8
Sporadic15,992,650188,146155,027.41.00.80.199152.21.2
Isolated11,737,81731,29829,081.60.20.90.191038.30.3
No permafrost10,870,3412604928.20.010.40.1918.70.02
Table 3. Statistics on stable permanent lakes across different biomes.
Permanent Unchanged
Total Area (ha)Number of LakesLake Area
(ha)
Percent
(%)
Mean (ha)Min (ha)Max (ha)Density (lakes/km2)
Tundra13,180,900130,120503,966.03.83.90.1918,736.30.99
Taiga27,253,00030,26888,329.10.32.90.193026.70.11
Table 4. Statistics on stable seasonal lakes across different biomes.
Seasonal Unchanged
Total Area (ha)Number of LakesArea
(ha)
Percent
(%)
Mean (ha)Min (ha)Max (ha)Density (lakes/km2)
Tundra13,180,900181,688100,209.30.80.550.191038.31.38
Taiga27,253,00072,92699,893.30.41.370.1910,011.80.27

