Agreement Index for Burned Area Mapping: Integration of Multiple Spectral Indices Using Sentinel-2 Satellite Images

 ,
,  ,
,  and
and 
Abstract
1. Introduction
2. Materials and Methods
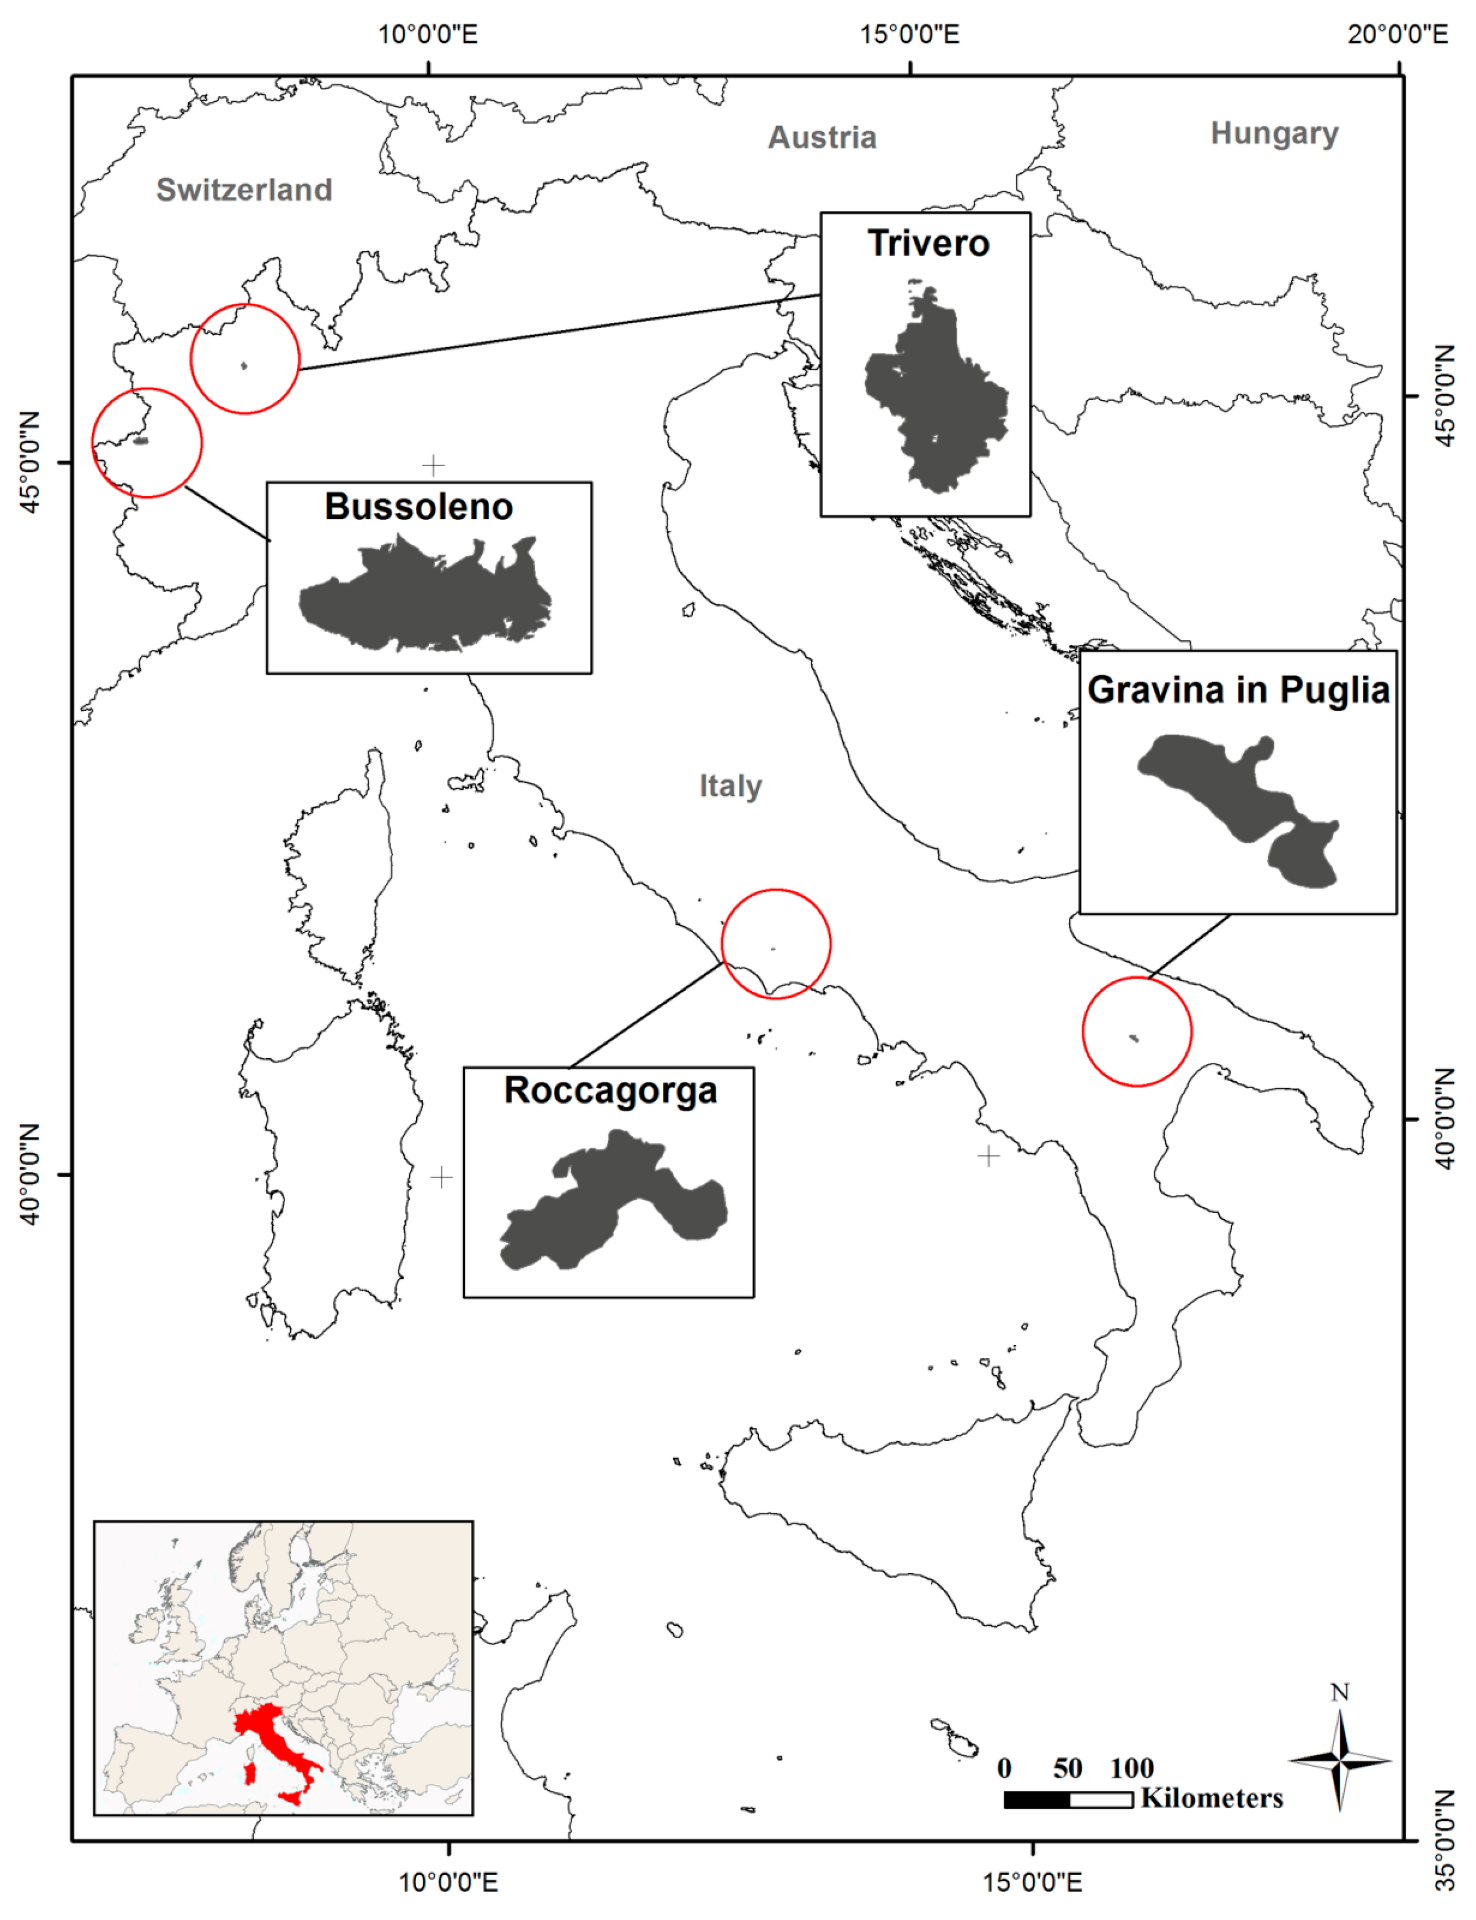
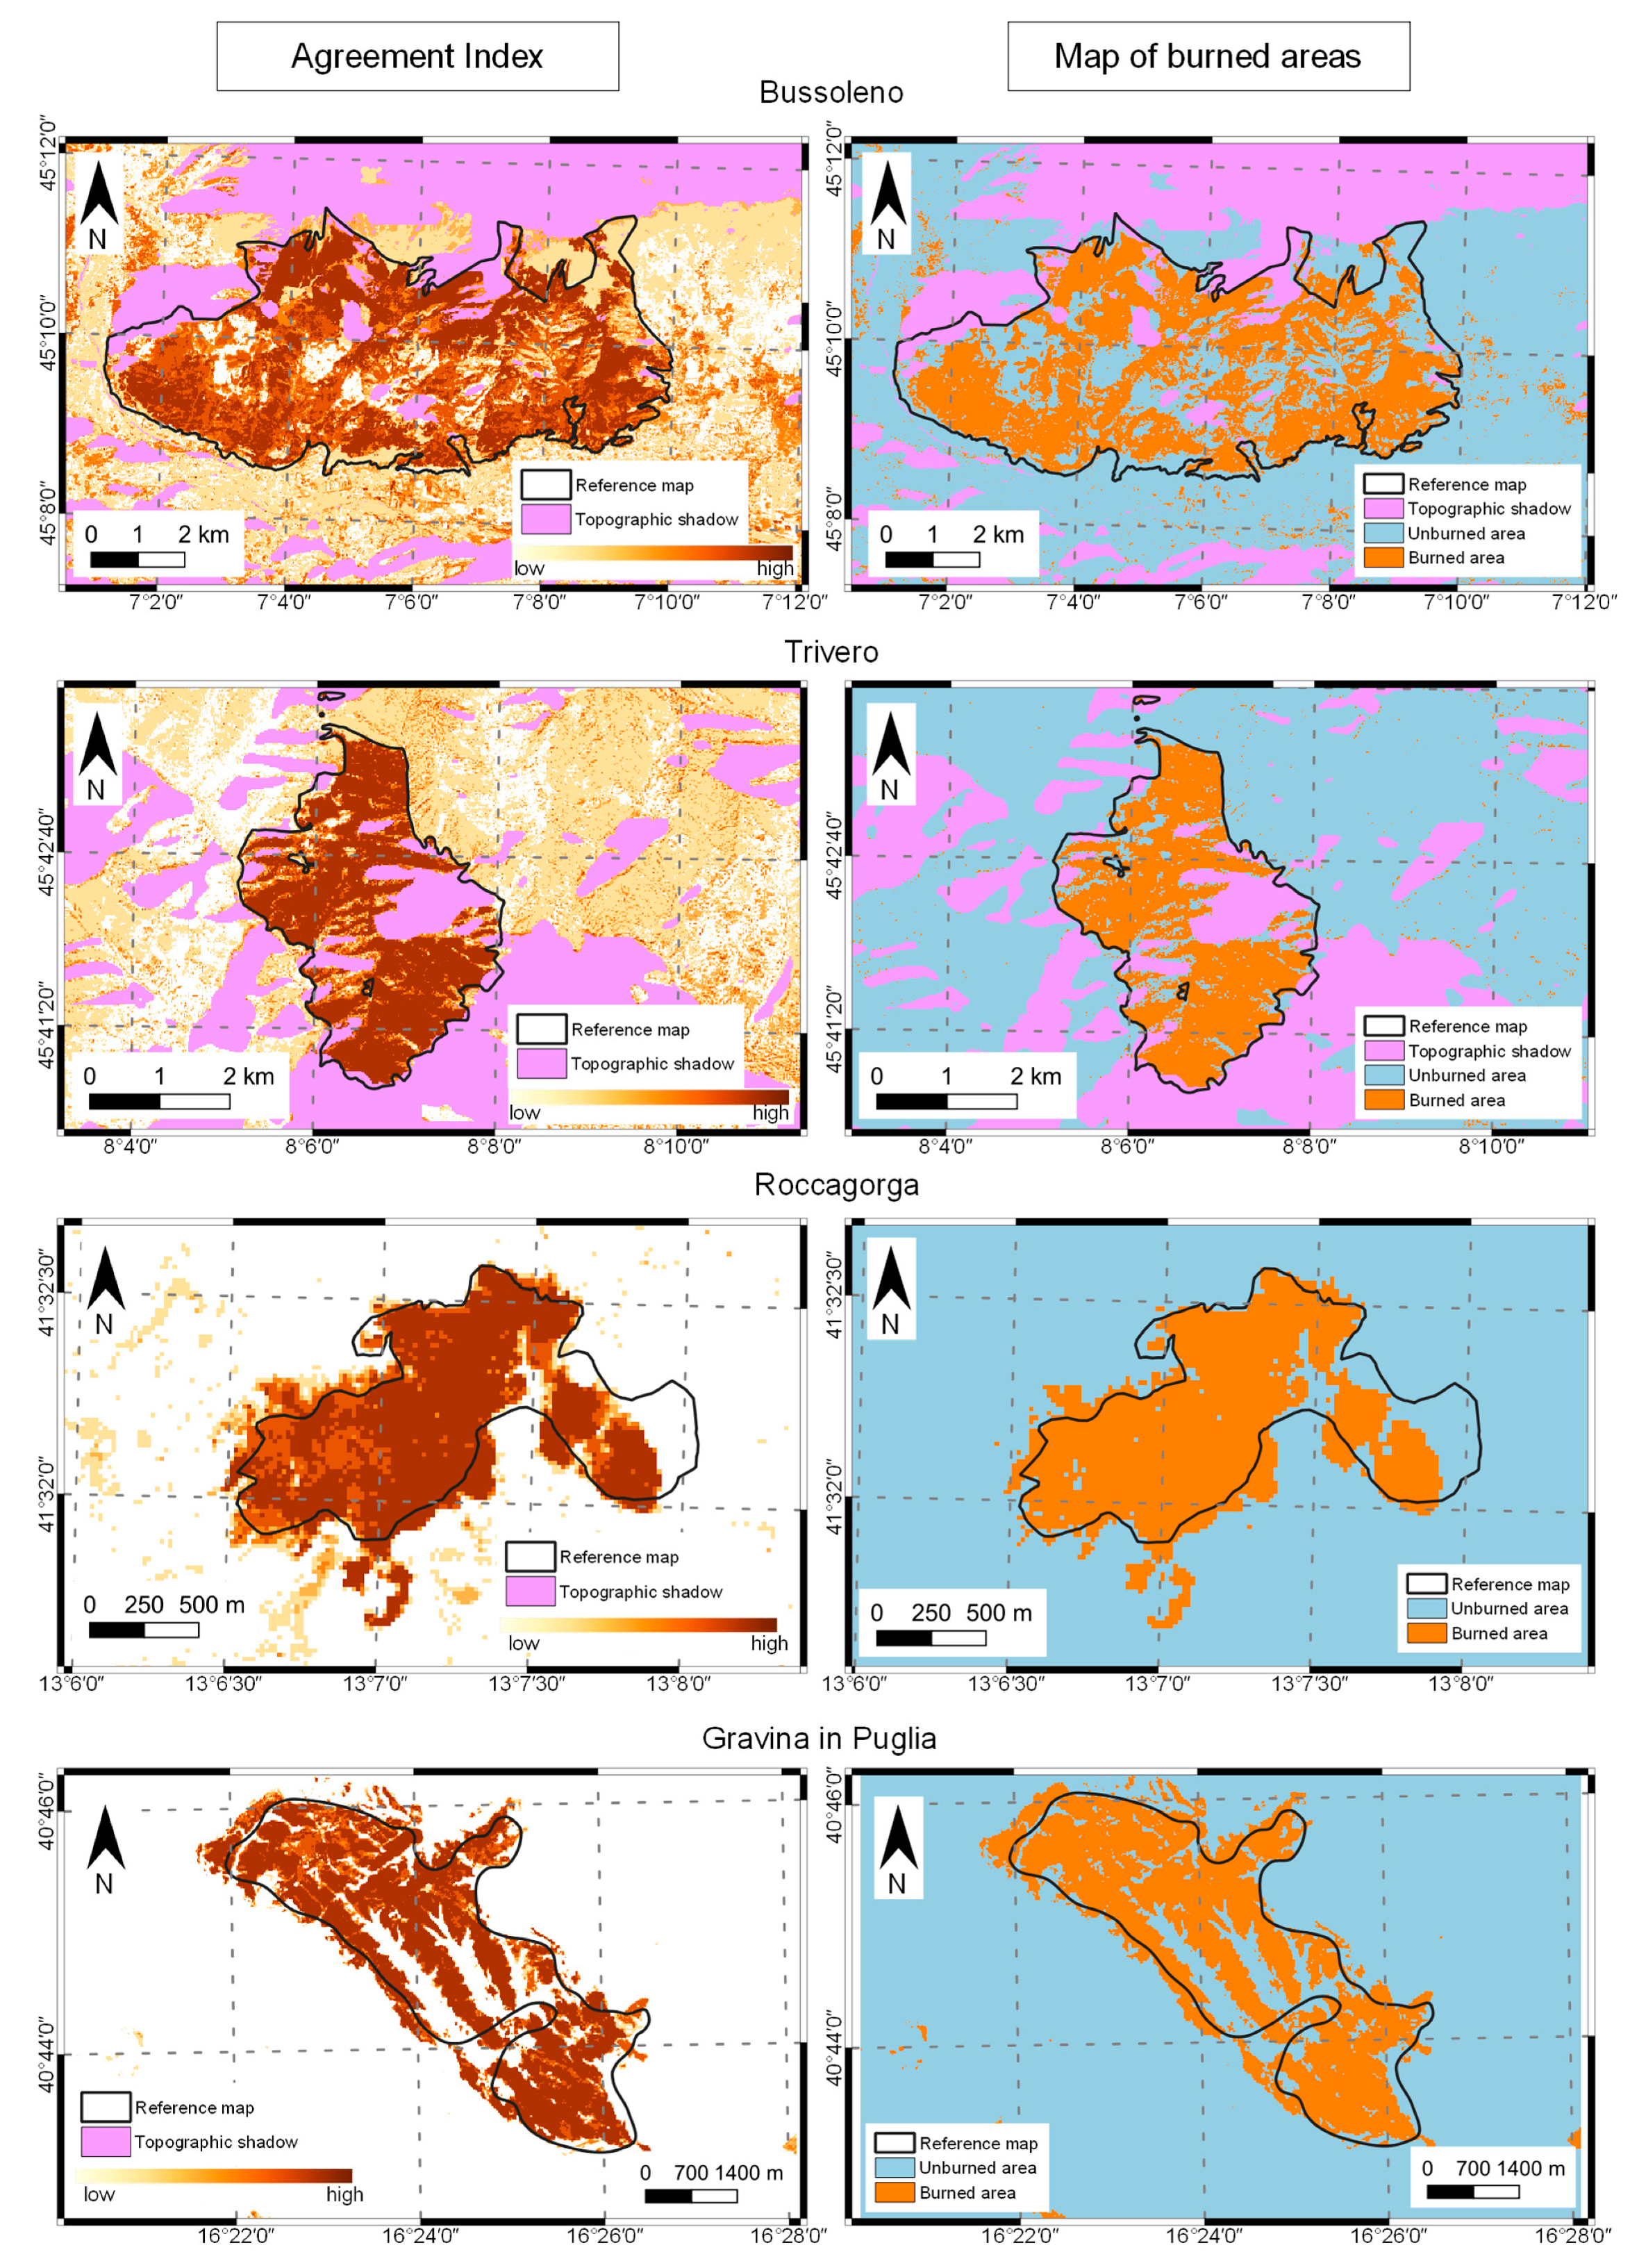
2.1. Study Area
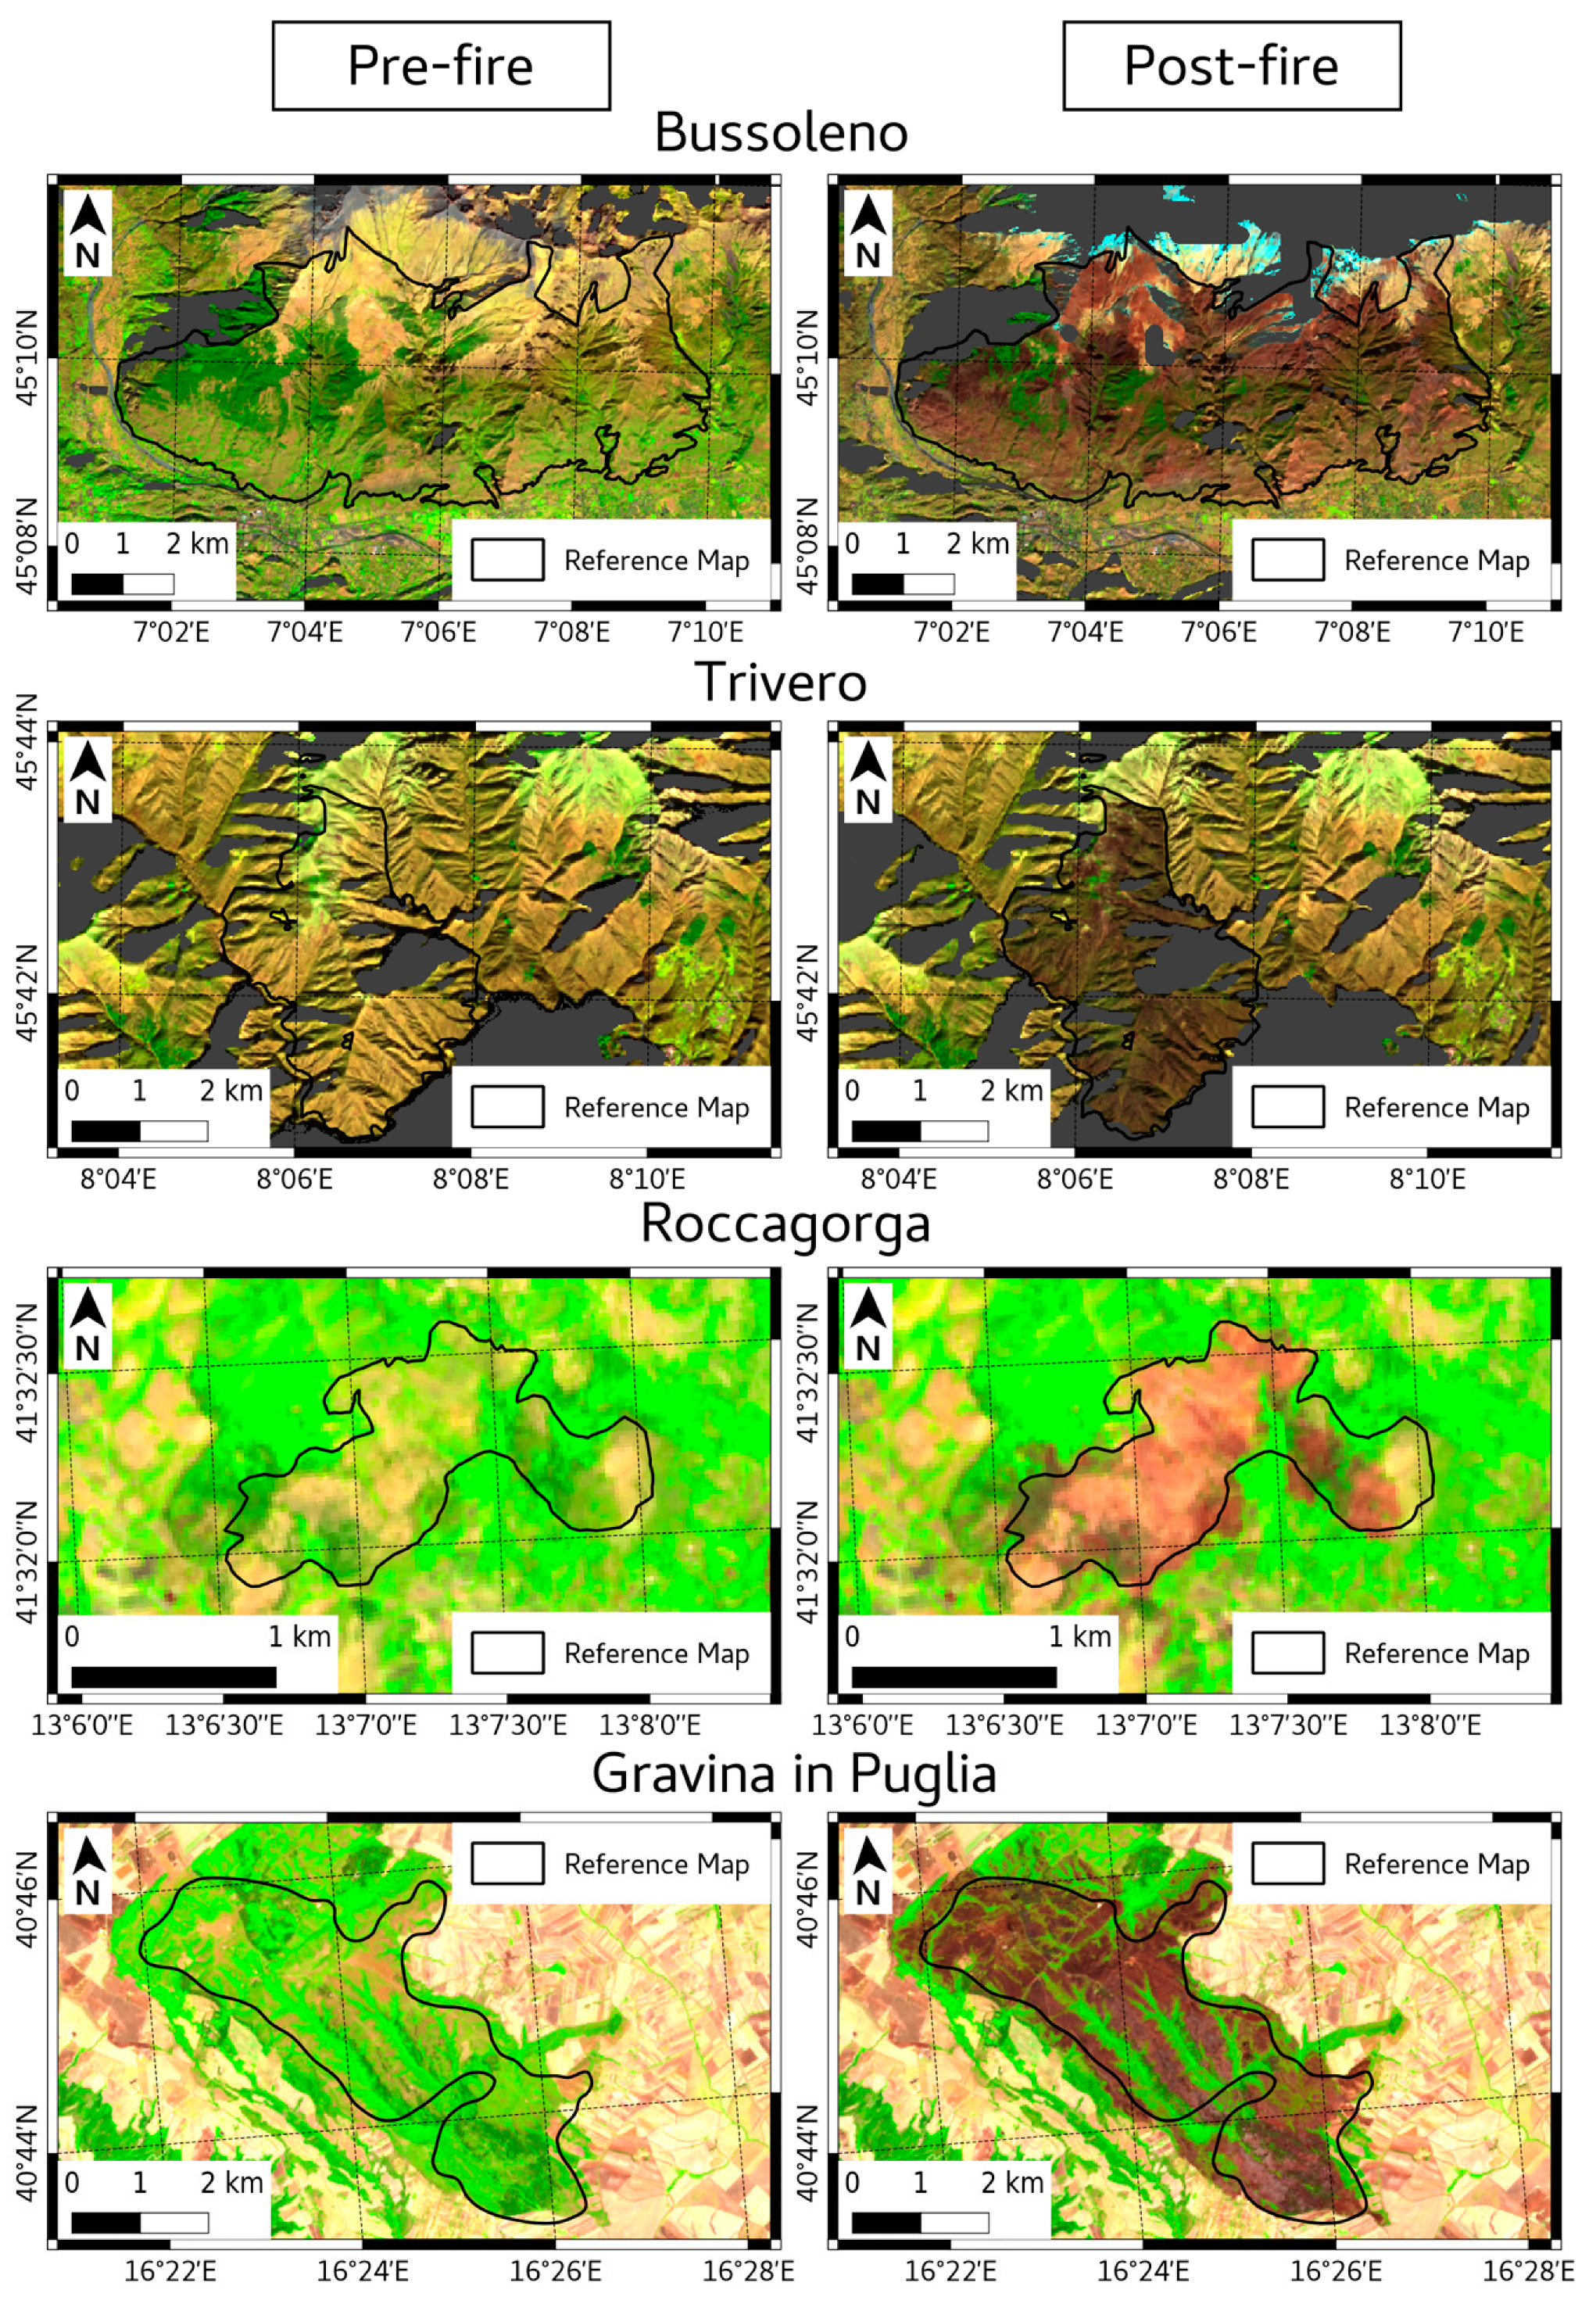
2.2. Satellite Images
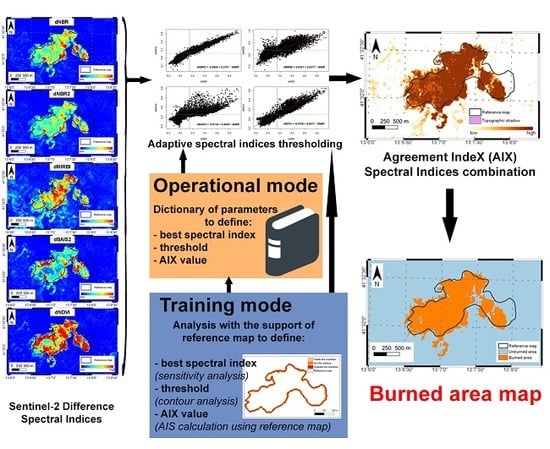
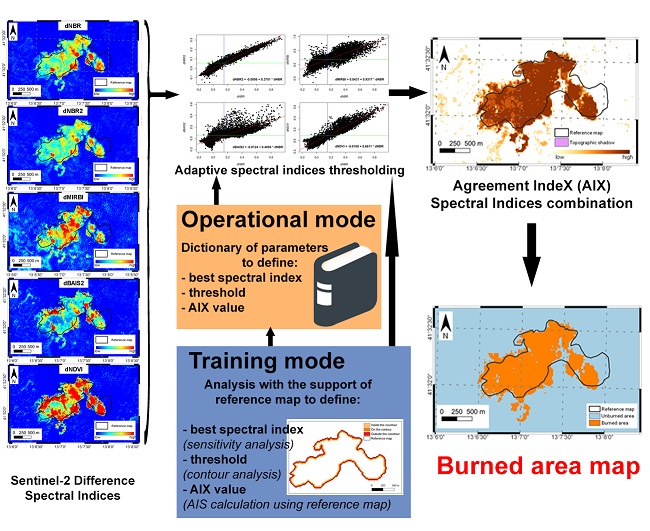
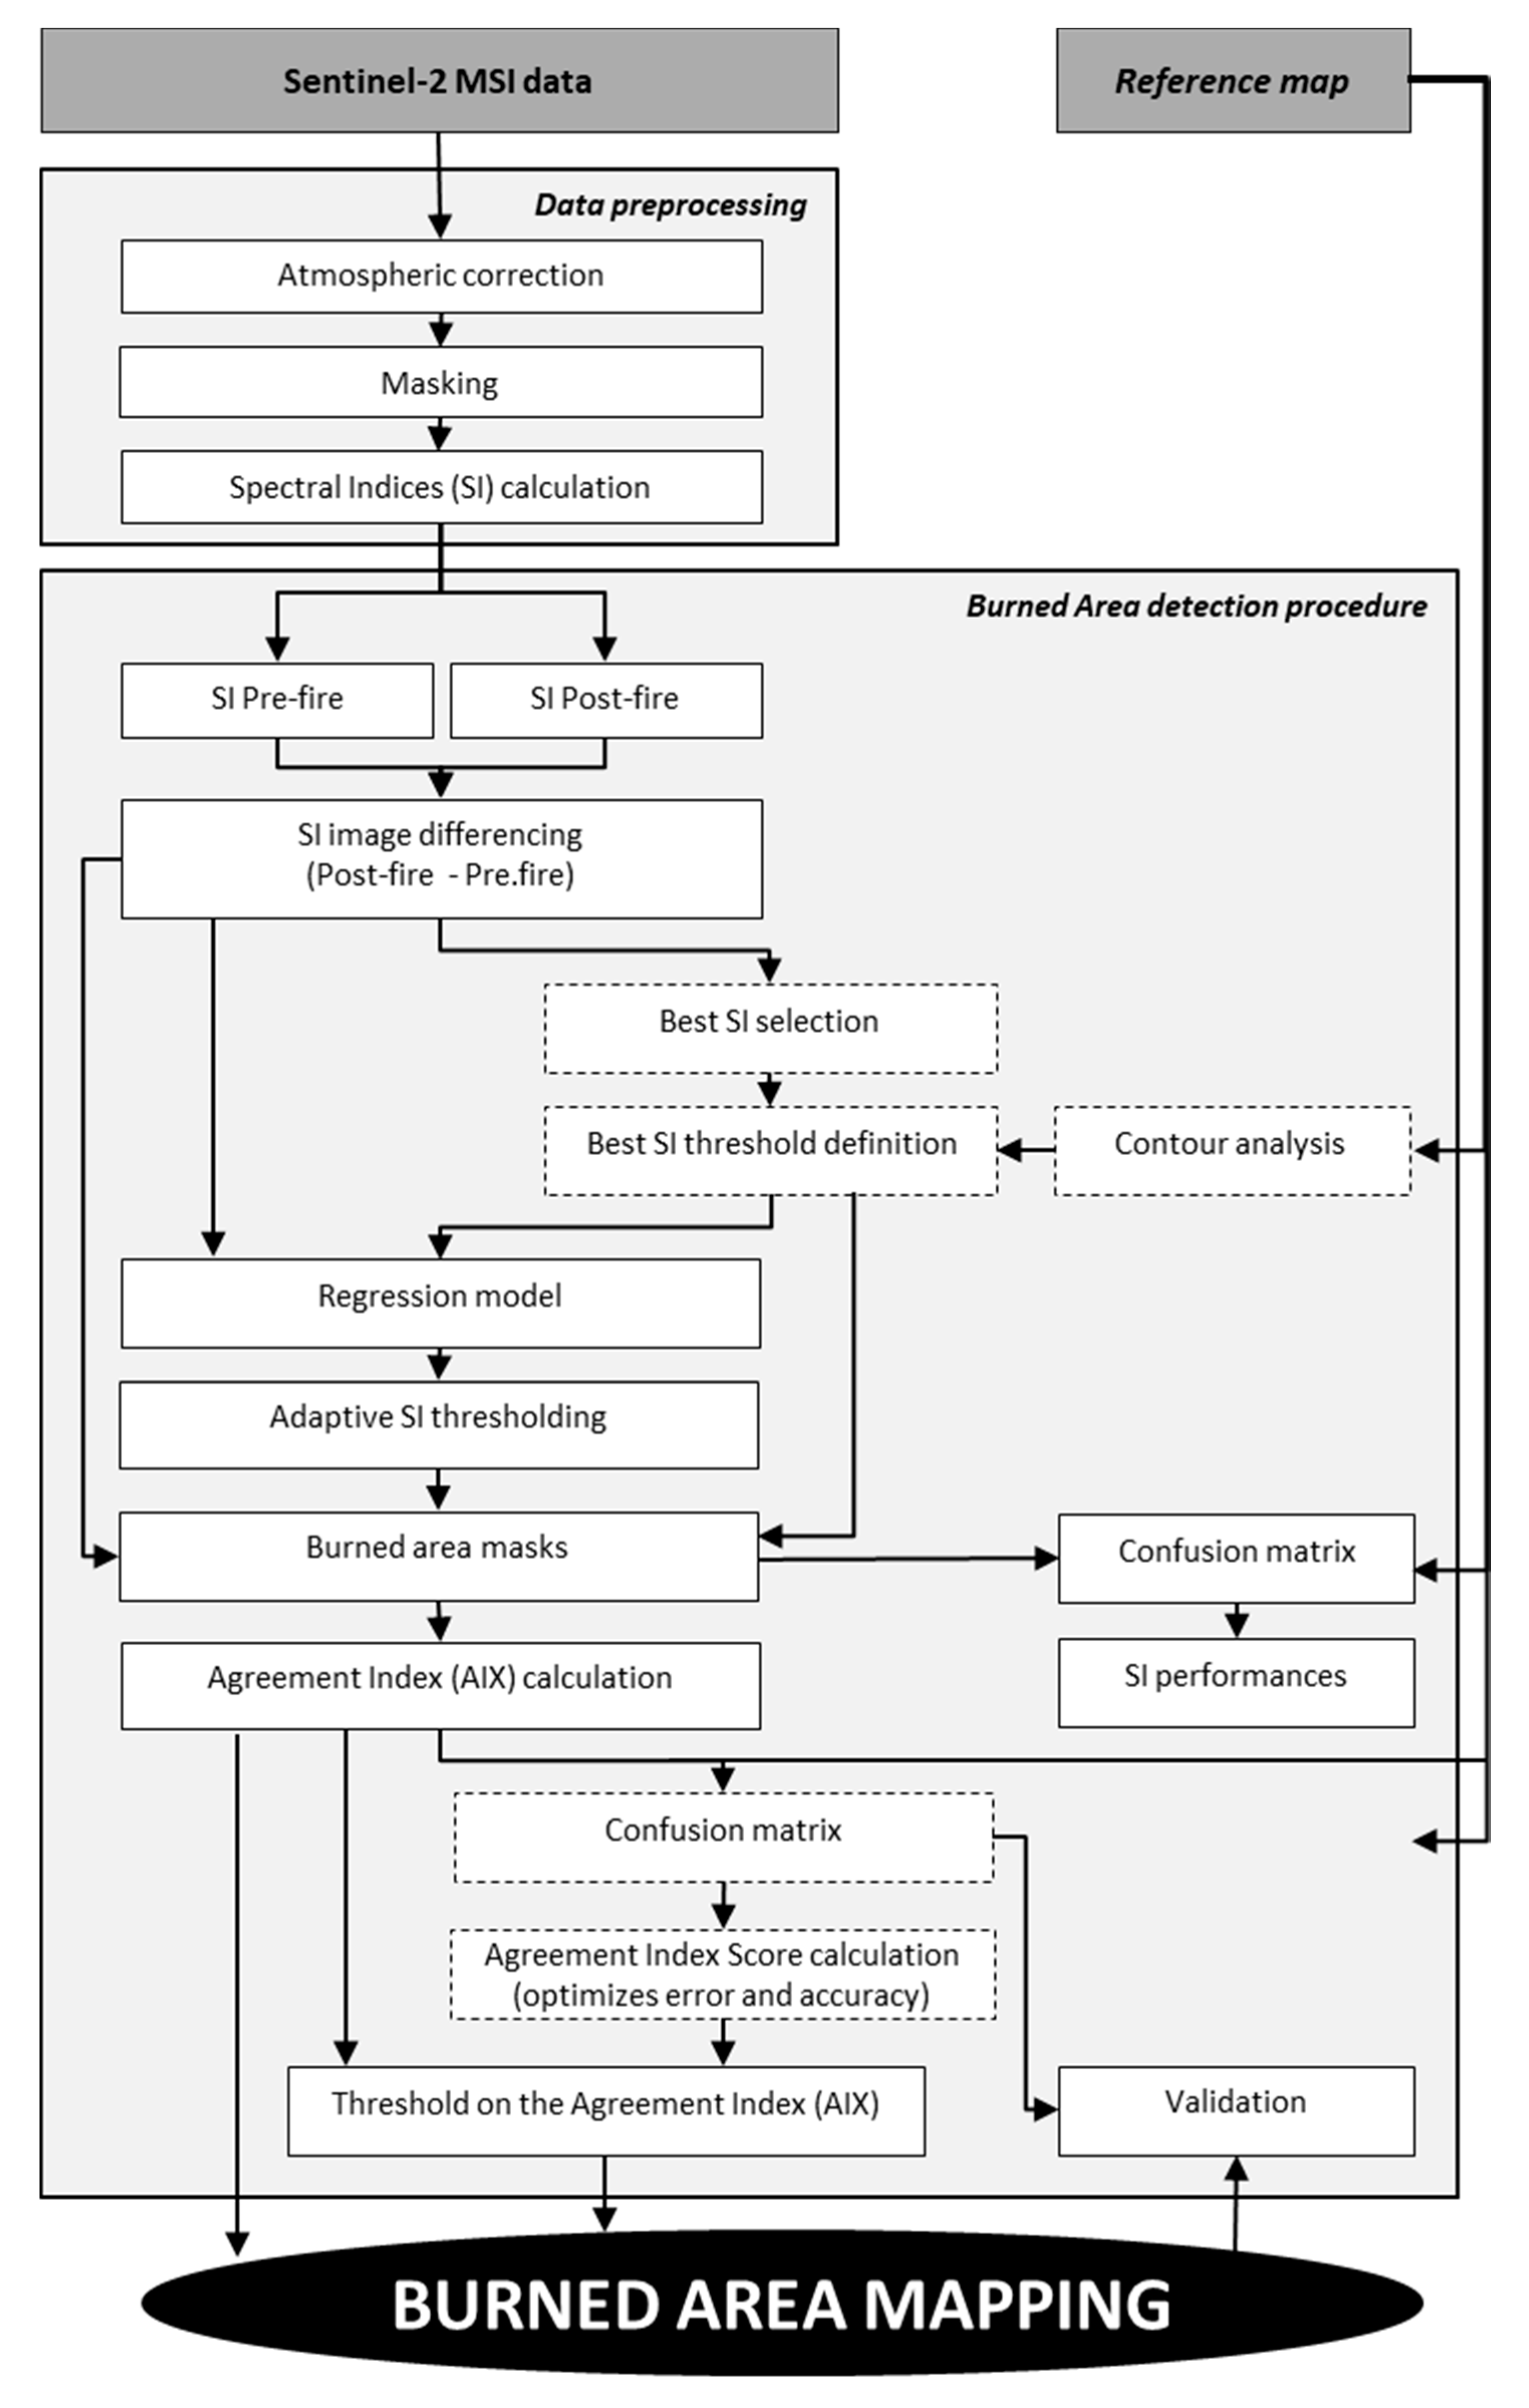
2.3. Methods
3. Results
4. Discussion
5. Conclusions
Supplementary Materials
Author Contributions
Funding
Acknowledgments
Conflicts of Interest
References
- Westerling, A.L.; Hidalgo, H.G.; Cayan, D.R.; Swetnam, T.W. Warming and earlier spring increase Western U.S. forest wildfire activity. Science 2006, 313, 940–943. [Google Scholar] [CrossRef] [PubMed]
- Bajocco, S.; Salvati, L.; Ricotta, C. Land degradation versus fire: A spiral process? Prog. Phys. Geogr. 2011, 35, 3–18. [Google Scholar] [CrossRef]
- Thonicke, K.; Venevsky, S.; Sitch, S.; Cramer, W. The role of fire disturbance for global vegetation dynamics: Coupling fire into a Dynamic Global Vegetation Model. Glob. Ecol. Biogeogr. 2001, 10, 661–677. [Google Scholar] [CrossRef]
- Lloret, F.; Calvo, E.; Pons, X.; Díaz-Delgado, R. Wildfires and landscape patterns in the eastern Iberian peninsula. Landsc. Ecol. 2002, 17, 745–759. [Google Scholar] [CrossRef]
- Viedma, O.; Moreno, J.M.; Rieiro, I. Interactions between land use/land cover change, forest fires and landscape structure in sierra de Gredos (Central Spain). Environ. Conserv. 2006, 33, 212–222. [Google Scholar] [CrossRef]
- Turner, M.G.; Gardner, R.H. Landscape Ecology in Theory and Practice. Pattern and Process; Springer: New York, NY, USA, 2015; p. 482. [Google Scholar] [CrossRef]
- Calvo, L.; Tárrega, R.; Luis, E. Secondary succession after perturbations in a shrubland community. Acta Oecologica 2002, 23, 393–404. [Google Scholar] [CrossRef]
- Anderson, R.C. Evolution and origin of the Central Grassland of North America: Climate, fire, and mammalian grazers. J. Torrey Bot. Soc. 2006, 133, 626–647. [Google Scholar] [CrossRef]
- French, N.H.F.; Kasischke, E.S.; Williams, D.G. Variability in the emissions of carbon-based trace gases from wildfire in the Alaskan boreal forest. J. Geophys. Res. 2003, 107, 8151. [Google Scholar] [CrossRef]
- Chuvieco, E. Earth Observation of Wildland Fires in Mediterranean Ecosystems; Springer: Berlin/Heidelberg, Germany, 2009; p. 257. [Google Scholar] [CrossRef]
- Bastarrika, A.; Alvarado, M.; Artano, K.; Martinez, M.P.; Mesanza, A.; Torre, L.; Ramo, R.; Chuvieco, E. BAMS: A Tool for Supervised Burned Area Mapping Using Landsat Data. Remote Sens. 2014, 6, 12360–12380. [Google Scholar] [CrossRef]
- Roteta, E.; Bastarrika, A.; Padilla, M.; Storm, T.; Chuvieco, E. Development of a Sentinel-2 burned area algorithm: Generation of a small fire database for sub-Saharan Africa. Remote Sens. Environ. 2019, 222, 1–17. [Google Scholar] [CrossRef]
- Boschetti, M.; Stroppiana, D.; Brivio, P.A. Mapping burned areas in a Mediterranean environment using soft integration of spectral indices from high-resolution satellite images. Earth Interact. 2010, 14, 1–20. [Google Scholar] [CrossRef]
- Wooster, M.J.; Zhukov, B.; Oertel, D. Fire radiative energy for quantitative study of biomass burning: Derivation from the BIRD experimental satellite and comparison to MODIS fire products. Remote Sens. Environ. 2003, 86, 83–107. [Google Scholar] [CrossRef]
- Schroeder, W.; Prins, E.; Giglio, L.; Csiszar, I.; Schmidt, C.; Morisette, J.; Morton, D. Validation of GOES and MODIS active fire detection products using ASTER and ETM+ data. Remote Sens. Environ. 2008, 112, 2711–2726. [Google Scholar] [CrossRef]
- Giglio, L.; Schroeder, W.; Justice, C.O. The collection 6 MODIS active fire detection algorithm and fire products. Remote Sens. Environ. 2016, 178, 31–41. [Google Scholar] [CrossRef]
- Filipponi, F. Exploitation of Sentinel-2 Time Series to Map Burned Areas at the National Level: A Case Study on the 2017 Italy Wildfires. Remote Sens. 2019, 11, 622. [Google Scholar] [CrossRef]
- Van Leeuwen, W.J.; Casady, G.M.; Neary, D.G.; Bautista, S.; Alloza, J.A.; Carmel, Y.; Wittenberg, L.; Malkinson, D.; Orr, B.J. Monitoring post-wildfire vegetation response with remotely sensed time-series data in Spain, USA and Israel. Int. J. Wildland Fire 2010, 19, 75–93. [Google Scholar] [CrossRef]
- Chu, T.; Guo, X. Remote Sensing Techniques in Monitoring Post-Fire Effects and Patterns of Forest Recovery in Boreal Forest Regions: A Review. Remote Sens. 2014, 6, 470–520. [Google Scholar] [CrossRef]
- Storey, E.A.; Stow, D.A.; O’Leary, J.F. Assessing postfire recovery of chamise chaparral using multi-temporal spectral vegetation index trajectories derived from Landsat imagery. Remote Sens. Environ. 2016, 183, 53–64. [Google Scholar] [CrossRef]
- Filipponi, F.; Manfron, G. Observing Post-Fire Vegetation Regeneration Dynamics Exploiting High-Resolution Sentinel-2 Data. Proceedings 2019, 18, 10. [Google Scholar] [CrossRef]
- Ichoku, C.; Ellison, L. Global top-down smoke-aerosol emissions estimation using satellite fire radiative power measurements. Atmos. Chem. Phys. Discuss. 2014, 14, 6643–6667. [Google Scholar] [CrossRef]
- Patra, P.K.; Ishizawa, M.; Maksyutov, S.; Nakazawa, T.; Inoue, G. Role of biomass burning and climate anomalies for land-atmosphere carbon fluxes based on inverse modeling of atmospheric CO2. Glob. Biogeochem. Cycles. 2005, 19, GB3005. [Google Scholar] [CrossRef]
- Boschetti, L.; Roy, D.P. Defining a fire year for reporting and analysis of global interannual fire variability. J. Geophys. Res. 2008, 113, G03020. [Google Scholar] [CrossRef]
- Casa, R.; Castaldi, F.; Pascussi, S.; Pignatti, S. Chlorophyll estimation in field crops: An assessment of handheld leaf meters and spectral reflectance measurements. J. Agric. Sci. 2015, 153, 876–890. [Google Scholar] [CrossRef]
- Xie, Q.; Dash, J.; Huang, W.; Peng, D.; Qin, Q.; Mortimer, H.; Casa, R.; Pignatti, S.; Laneve, G.; Pascucci, S.; et al. Vegetation indices combining the Red and Red-Edge spectral information for Leaf Area Index retrieval. IEEE J. Sel. Top. Appl. Earth Obs. Remote Sens. 2018, 11, 1482–1493. [Google Scholar] [CrossRef]
- Filipponi, F. BAIS2: Burned Area Index for Sentinel-2. Multidisciplinary Digital Publishing Institute. Proceedings 2018, 2, 364. [Google Scholar] [CrossRef]
- Axel, A.C. Burned Area Mapping of an Escaped Fire into Tropical Dry Forest in Western Madagascar Using Multi-Season Landsat OLI Data. Remote Sens. 2018, 10, 371. [Google Scholar] [CrossRef]
- Pereira, J.M.C. A comparative evaluation of NOAA/AVHRR vegetation indexes for burned surface detection and mapping. IEEE Trans. Geosci. Remote Sens. 1999, 37, 217–226. [Google Scholar] [CrossRef]
- Roy, D.P.; Boschetti, L.; Trigg, S.N. Remote sensing of fire severity: Assessing the performance of the normalized burn ratio. IEEE Geosci. Remote Sens. Lett. 2005, 3, 112–116. [Google Scholar] [CrossRef]
- Bastarrika, A.; Chuvieco, E.; Pilar Martín, M. Mapping burned areas from Landsat TM/ETM + data with a two-phase algorithm: Balancing omission and commission errors. Remote Sens. Environ. 2011, 115, 1003–1012. [Google Scholar] [CrossRef]
- Veraverbeke, S.; Lhermitte, S.; Verstraeten, W.W.; Goossens, R. Evaluation of pre/post-fire differenced spectral indices for assessing burn severity in a Mediterranean environment with Landsat Thematic Mapper. Int. J. Remote Sens. 2011, 32, 3521–3537. [Google Scholar] [CrossRef]
- Lasaponara, R. Estimating spectral separability of satellite derived parameters for burned areas mapping in the Calabria region by using SPOT-Vegetation data. Ecol. Model. 2006, 196, 265–270. [Google Scholar] [CrossRef]
- Stroppiana, D.; Boschetti, M.; Zaffaroni, P.; Brivio, P.A. Analysis and Interpretation of Spectral Indices for Soft Multicriteria Burned-Area Mapping in Mediterranean Regions. IEEE Geosci. Remote Sens. Lett. 2009, 6, 499–503. [Google Scholar] [CrossRef]
- Stroppiana, D.; Bordogna, G.; Carrara, P.; Boschetti, M.; Boschetti, L.; Brivio, P.A. A method for extracting burned areas from Landsat TM/ETM+ images by soft aggregation of multiple Spectral Indices and a region growing algorithm. ISPRS J. Photogramm. Remote Sens. 2012, 69, 88–102. [Google Scholar] [CrossRef]
- Kolden, C.A.; Lutz, J.A.; Key, C.H.; Kane, J.T.; van Wagtendonk, J.W. Mapped versus actual burned area within wildfire perimeters: Characterizing the unburned. For. Ecol. Manag. 2012, 286, 38–47. [Google Scholar] [CrossRef]
- Lozano, F.J.; Suárez-Seoane, S.; de Luis, S. Assessment of several spectral indices derived from multi-temporal Landsat data for fire occurrence probability modeling. Remote Sens. Environ. 2007, 107, 533–544. [Google Scholar] [CrossRef]
- Stroppiana, D.; Bordogna, G.; Boschetti, M.; Carrara, P.; Boschetti, L. Positive and Negative Information for Assessing and Revising Scores of Burn Evidence. IEEE Geosci. Remote Sens. Lett. 2012, 9, 363–367. [Google Scholar] [CrossRef]
- Li, Z.; Kaufman, Y.J.; Ichoku, C.; Fraser, R.; Trishchenke, A.; Giglio, L.; Jin, J.; Yu, X. A review of AVHRR-based active fire detection algorithms: Principles, limitations, and recommendations. In Global and Regional Vegetation Fire Monitoring From Space. Planning a Coordinated and International Effort; Ahern, F.J., Goldammer, J.G., Justice, C.O., Eds.; SPB Academic: The Hague, The Netherlands, 2001; pp. 199–225. [Google Scholar]
- Forman, R.T.T.; Godron, M. Landscape Ecology; J. Wiley and Sons: New York, NY, USA, 1986; p. 640. [Google Scholar]
- Zonneveld, I.S. Land Ecology: An Introduction to Landscape Ecology as a Base for Land Evaluation. Land Management and Conservation.; SPB Academic Publishing: Amsterdam, The Netherlands, 1995; p. 199. [Google Scholar]
- Bonan, G.B.; Levis, S.; Kergoat, L.; Oleson, K.W. Landscapes as patches of plant functional types: An integrating concept for climate and ecosystem model. Global Biogeochem. Cycles 2002, 16, 5. [Google Scholar] [CrossRef]
- Poulter, B.; MacBean, N.; Hartley, A.; Khlystova, I.; Arino, O.; Betts, R.; Bontemps, S.; Boettcher, M.; Brockmann, C.; Defourny, P.; et al. Plant functional type classification for earth system models: Results from the European Space Agency’s Land Cover Climate Change Initiative. Geosci. Model Dev. 2015, 8, 2315–2328. [Google Scholar] [CrossRef]
- Fernández-Manso, A.; Fernández-Manso, O.; Quintano, C. SENTINEL-2A red-edge spectral indices suitability for discriminating burn severity. Int. J. Appl. Earth Obs. Geoinf. 2016, 50, 170–175. [Google Scholar] [CrossRef]
- Huang, H.; Roy, D.P.; Boschetti, L.; Zhang, H.K.; Yan, L.; Kumar, S.S.; Gomez-Dans, J.; Li, J. Separability analysis of Sentinel-2A multi-spectral instrument (MSI) data for burned area discrimination. Remote Sens. 2016, 8, 873. [Google Scholar] [CrossRef]
- Navarro, G.; Caballero, I.; Silva, G.; Parra, P.C.; Vázquez, A.; Caldeira, R. Evaluation of forest fire on Madeira Island using Sentinel-2A MSI imagery. Int. J. Appl. Earth Obs. Geoinf. 2017, 58, 97–106. [Google Scholar] [CrossRef]
- Fernández-Manso, A.; Quintano, C.A. Synergetic Approach to Burned Area Mapping Using Maximum Entropy Modeling Trained with Hyperspectral Data and VIIRS Hotspots. Remote Sens. 2020, 12, 858. [Google Scholar] [CrossRef]
- Brivio, A.P.; Petrucci, B.; Boschetti, M.; Carrara, P.; Pepe, M.; Rampini, A.; Stroppiana, D.; Zaffaroni, P. A multi-year geographic database off ire affected areas derived from satellite images in the National parks of Italy. Riv. Ital. Di Telerilevamento-Ital. J. Remote Sens. 2009, 41, 65–78. [Google Scholar]
- Pulvirenti, L.; Squicciarino, G.; Fiori, E.; Fiorucci, P.; Ferraris, L.; Negro, D.; Gollini, A.; Severino, M.; Puca, S. An Automatic Processing Chain for Near Real-Time Mapping of Burned Forest Areas Using Sentinel-2 Data. Remote Sens. 2020, 12, 674. [Google Scholar] [CrossRef]
- Azar, R.; Stroppiana, D.; Bresciani, M.; Giardino, C.; Boschetti, M.; Brivio, P.A. Accuracy of fuzzy burned area mapping as a function of the aerosol parameterization of atmospheric correction. In Proceedings of the Remote Sensing for Agriculture, Ecosystems, and Hydrology, Dresden, Germany, 23–26 September 2013; SPIE-International Society for Optics and Photonics: Washington, DC, USA, 2013; Volume XV(8887), p. 88870M. [Google Scholar] [CrossRef]
- Stroppiana, D.; Azar, R.; Calò, F.; Pepe, A.; Imperatore, P.; Boschetti, M.; Silva, J.M.N.; Lanari, R. Integration of Optical and SAR Data for Burned Area Mapping in Mediterranean Regions. Remote Sens. 2015, 7, 1320–1345. [Google Scholar] [CrossRef]
- Pesaresi, S.; Galdenzi, D.; Biondi, E.; Casavecchia, S. Bioclimate of Italy: Application of the worldwide bioclimatic classification system. J. Maps 2014, 10, 538–553. [Google Scholar] [CrossRef]
- Smiraglia, D.; Capotorti, G.; Guida, D.; Mollo, B.; Siervo, V.; Blasi, C. Land units map of Italy. J. Maps 2013, 9, 239–244. [Google Scholar] [CrossRef]
- Hagolle, O.; Huc, M.; Desjardins, C.; Auer, S.; Richter, R. MAJA Algorithm Theoretical Basis Document. Available online: https://doi.org/10.5281/zenodo.1209633 (accessed on 7 December 2017).
- Rouquié, B.; Hagolle, O.; Bréon, F.M.; Boucher, O.; Desjardins, C.; Rémy, S. Using Copernicus atmosphere monitoring service products to constrain the aerosol type in the atmospheric correction processor MAJA. Remote Sens. 2017, 9, 1230. [Google Scholar] [CrossRef]
- Csiszar, I.; Loboda, T.; French, N.H.F.; Giglio, L.; Hockenberry, T.L. A multisensory Approach to Fine-Scale Characterization; University of Maryland: College Park, MD, USA, 2014; p. 4. [Google Scholar]
- Chuvieco, E.; Martin, M.P.; Palacios, A. Assessment of different spectral indices in the red-near-infrared spectral domain for burned land discrimination. Int. J. Remote Sens. 2002, 23, 5103–5110. [Google Scholar] [CrossRef]
- Hislop, S.; Jones, S.; Soto-Berelov, M.; Skidmore, A.; Haywood, A.; Nguyen, T.H. Using Landsat Spectral Indices in Time-Series to Assess Wildfire Disturbance and Recovery. Remote Sens. 2018, 10, 460. [Google Scholar] [CrossRef]
- Trigg, S.; Flasse, S. An evaluation of different bi-spectral spaces for discriminating burned shrub savanna. Int. J. Remote Sens. 2001, 22, 2641–2647. [Google Scholar] [CrossRef]
- Rouse, J., Jr.; Haas, R.H.; Schell, J.A.; Deering, D.W. Monitoring vegetation systems in the Great Plains with ERTS. NASA Spec. Publ. 1974, 351, 309. [Google Scholar]
- Singh, A. Digital change detection techniques using remotely sensing data. Int. J. Remote Sens. 1989, 10, 989–1003. [Google Scholar] [CrossRef]
- Kaufman, Y.J.; Remer, L.A. Detection of forests using mid-IR reflectance: An application for aerosol studies. IEEE Trans. Geosci. Remote Sens. 1994, 32, 672–683. [Google Scholar] [CrossRef]
- Smith, A.M.S.; Drake, N.A.; Wooster, M.J.; Hudak, A.T.; Holden, Z.A.; Gibbons, C.J. Production of Landsat ETM+ reference imagery of burned areas within Southern African savannahs: Comparison of methods and application to MODIS. Int. J. Remote Sens. 2007, 28, 2753–2775. [Google Scholar] [CrossRef]
- Zanetti, M.; Marinelli, D.; Bertoluzza, M.; Saha, S.; Bovolo, F.; Bruzzone, L.; Magliozzi, M.L.; Zavagli, M.; Costantini, M. A high resolution burned area detector for Sentinel-2 and Landsat-8. In Proceedings of the 10th International Workshop on the Analysis of Multitemporal Remote Sensing Images (MultiTemp 2019), Shanghai, China, 5–7 August 2019. [Google Scholar]
- Bovio, G. Method for forest fire damage level assessment based on detectable effects. In Evaluation of Forest Fire Damages in Italy; Ciancio, O., Corona, P., Marinelli, M., Pettenella, D., Eds.; Accademia Italiana di Scienze Forestali: Florence, Italy, 2007; pp. 55–60. [Google Scholar]


| Study Area | Climate [52] and Lithomorphology [53] | Vegetation (CUFAA) | Start Date–End Date (CUFAA) | Fire Extension (CUFAA) | Elevation Range a.s.l. (CUFAA) |
|---|---|---|---|---|---|
| Bussoleno | - Temperate semi-continental–oceanic - Metamorphic slopes | - Coniferous forest (evergreen and deciduous) - Oak and beech forest - Grasslands | 2017-10-22–2017-11-02 | 4000 ha | 600–2700 |
| Trivero | - Temperate oceanic - Igneous intrusive slopes | - Beech forest - Shrublands | 2015-11-27–2015-12-06 | 1000 ha | 700–1800 |
| Roccagorga | - Transitional Mediterranean oceanic - Carbonate slopes | - Pine forest - Shrublands - Grasslands | 2017-07-21–2017-07-22 | 80 ha | 450–900 |
| Gravina in Puglia | - Mediterranean oceanic–semi-continental - Sedimentary clastic table-land | - Pine forest - Oak forest - Shrublands - Grasslands | 2017-08-12–2017-08-14 | 1300 ha | 350–450 |
| Study Area | Tile Name | Acquisition Date | Acquisition Time | Satellite |
|---|---|---|---|---|
| Bussoleno | T32TLR | 2017-10-17 | 10:30:24 | S2A |
| T32TLR | 2017-11-21 | 10:33:23 | S2B | |
| Trivero | T32TMR | 2015-11-24 | 10:23:39 | S2A |
| T32TMR | 2015-12-17 | 10:39:53 | S2A | |
| Roccagorga | T33TUG | 2017-07-20 | 10:00:27 | S2A |
| T33TUG | 2017-07-30 | 10:05:35 | S2A | |
| Gravina in Puglia | T33TXF | 2017-08-11 | 09:55:12 | S2B |
| T33TXF | 2017-08-18 | 09:40:28 | S2B |
| Spectral Index | Equation | Reference |
|---|---|---|
| NBR Normalized Burn Ratio | [30,56,57] | |
| NBR2 Normalized Burn Ratio 2 | [20,58] | |
| MIRBI Mid-Infrared Bispectral Index | [59] | |
| BAIS2 Burned Area Index for Sentinel-2 | [17,27] | |
| NDVI Normalized Difference Vegetation Index | [60] |
| Spectral Index | Bussoleno | Trivero | Roccagorga | Gravina in Puglia |
|---|---|---|---|---|
| dNBR | 0.58845 | 0.85566 | 1.28991 | 1.24775 |
| dNBR2 | 0.85765 | 1.21820 | 1.27707 | 1.31510 |
| dMIRBI | 0.76930 | 1.26844 | 0.99870 | 1.14082 |
| dBAIS2 | 0.57760 | 0.96142 | 1.28847 | 1.25714 |
| dNDVI | 0.29361 | 0.11608 | 1.19782 | 1.03085 |
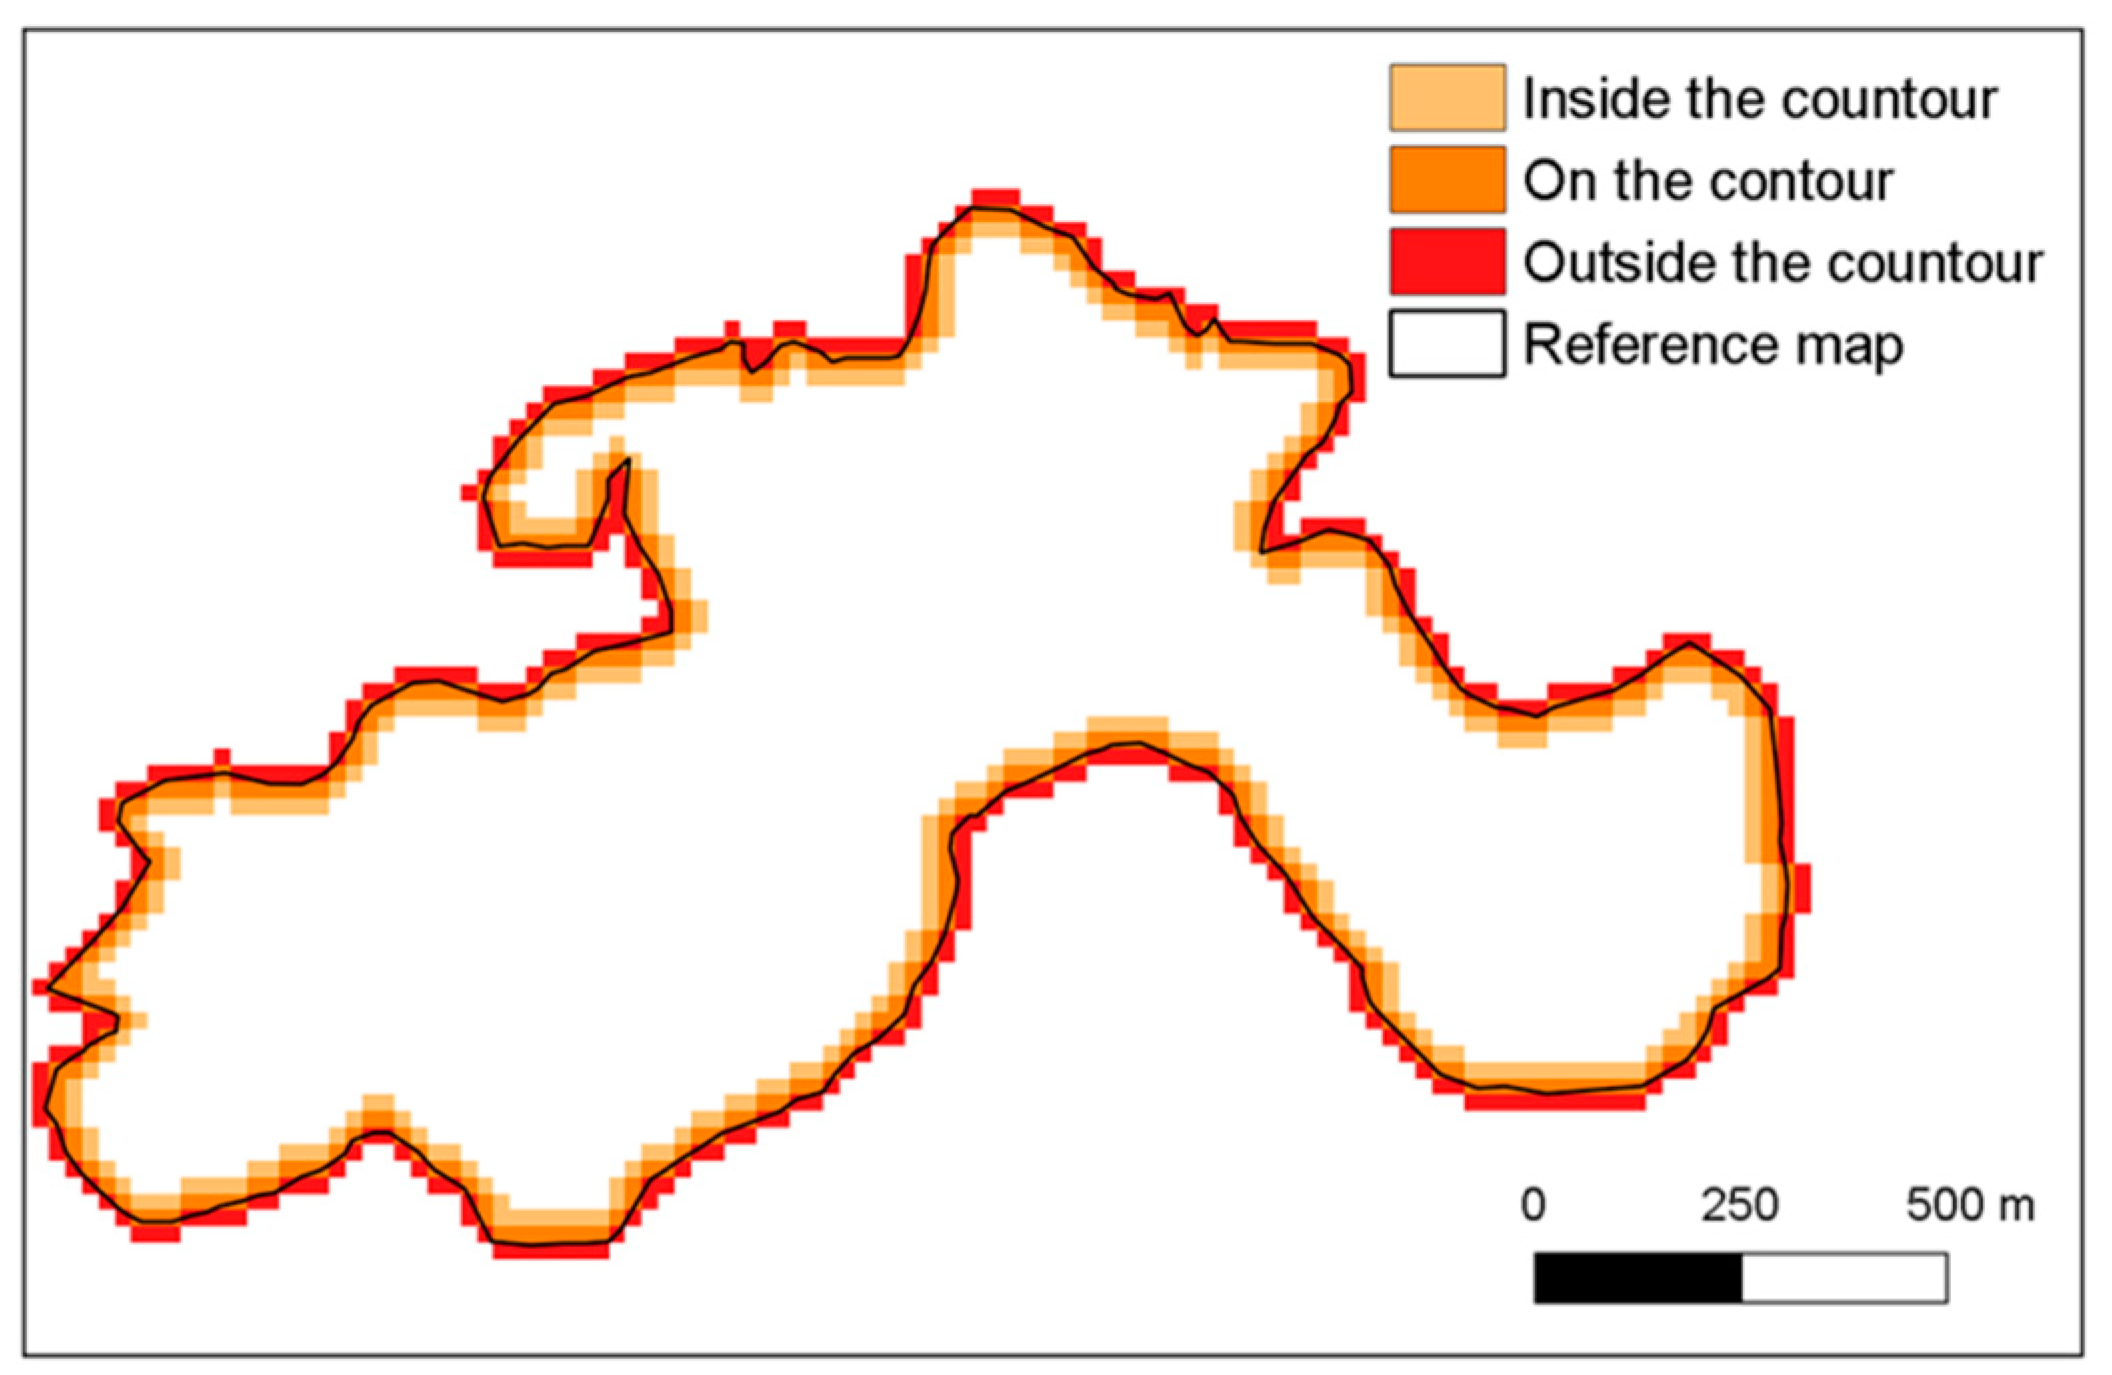
| Study Area | Spectral Index | Outside the Boundary | On the Boundary | Inside the Boundary | Threshold | |||
|---|---|---|---|---|---|---|---|---|
| Med | MAD | Med | MAD | Med | MAD | |||
| Bussoleno | dNBR2 | 0.064 | 0.0323 | 0.076 | 0.0345 | 0.091 | 0.0364 | 0.08 |
| Trivero | dMIRBI | 0.085 | 0.1078 | 0.165 | 0.1368 | 0.329 | 0.1737 | 0.20 |
| Roccagorga | dNBR | 0.148 | 0.1174 | 0.226 | 0.1430 | 0.291 | 0.1254 | 0.15 |
| Gravina in Puglia | dNBR2 | 0.157 | 0.0832 | 0.171 | 0.0806 | 0.182 | 0.0822 | 0.18 |
| Study Area | Spectral Index | Index Threshold | Omission Error | Commission Error | Overall Accuracy |
|---|---|---|---|---|---|
| Bussoleno | dNBR | 0.17811 | 0.25617 | 0.59035 | 0.50137 |
| dNBR2 | 0.08000 | 0.20319 | 0.42630 | 0.57173 | |
| dMIRBI | 0.24750 | 0.22810 | 0.42883 | 0.57004 | |
| dBAIS2 | 0.10419 | 0.25069 | 0.60330 | 0.49316 | |
| dNDVI | 0.15673 | 0.43883 | 0.69454 | 0.45251 | |
| Trivero | dNBR | 0.02911 | 0.16533 | 0.82592 | 0.54387 |
| dNBR2 | 0.01287 | 0.08047 | 0.67916 | 0.61069 | |
| dMIRBI | 0.20000 | 0.15396 | 0.46814 | 0.64666 | |
| dBAIS2 | 0.02644 | 0.15438 | 0.77732 | 0.57587 | |
| dNDVI | 0.07412 | 0.46000 | 0.93336 | 0.42093 | |
| Roccagorga | dNBR | 0.15000 | 0.16636 | 0.20783 | 0.96287 |
| dNBR2 | 0.05340 | 0.15768 | 0.24661 | 0.95821 | |
| dMIRBI | 0.17666 | 0.26177 | 0.44008 | 0.91882 | |
| dBAIS2 | 0.09405 | 0.16326 | 0.21936 | 0.96159 | |
| dNDVI | 0.08408 | 0.17472 | 0.22355 | 0.96024 | |
| Gravina in Puglia | dNBR | 0.36187 | 0.29721 | 0.19421 | 0.93050 |
| dNBR2 | 0.18000 | 0.29446 | 0.18933 | 0.93160 | |
| dMIRBI | 0.53050 | 0.35442 | 0.21729 | 0.92053 | |
| dBAIS2 | 0.21710 | 0.28462 | 0.20447 | 0.93022 | |
| dNDVI | 0.20464 | 0.36463 | 0.17008 | 0.92630 |
| Study Area | SI | AIX | Omission Error | Commission Error | Overall Accuracy | Total Error | AIS |
|---|---|---|---|---|---|---|---|
| Bussoleno | 1 | >=0.2 | 0.15682 | 0.67286 | 0.53281 | 0.82968 | 0.62355 |
| 2 | >=0.4 | 0.22073 | 0.60890 | 0.59720 | 0.82963 | 0.69895 | |
| 3 | >=0.6 | 0.28272 | 0.53317 | 0.64398 | 0.81589 | 0.76254 | |
| 4 | >=0.8 | 0.34470 | 0.40699 | 0.68729 | 0.75170 | 0.85795 | |
| 5 | =1 | 0.61131 | 0.23673 | 0.69611 | 0.84804 | 0.80189 | |
| Trivero | 1 | >=0.2 | 0.04100 | 0.91096 | 0.36407 | 0.95196 | 0.38156 |
| 2 | >=0.4 | 0.08080 | 0.81790 | 0.54567 | 0.89870 | 0.60094 | |
| 3 | >=0.6 | 0.14426 | 0.71530 | 0.60730 | 0.85956 | 0.69259 | |
| 4 | >=0.8 | 0.21627 | 0.48889 | 0.65005 | 0.70516 | 0.84171 | |
| 5 | =1 | 0.57412 | 0.20937 | 0.65903 | 0.78349 | 0.80172 | |
| Roccagorga | 1 | >=0.2 | 0.14157 | 0.45453 | 0.91738 | 0.59610 | 1.28791 |
| 2 | >=0.4 | 0.15520 | 0.24313 | 0.95887 | 0.39834 | 1.53579 | |
| 3 | >=0.6 | 0.16636 | 0.21408 | 0.96207 | 0.38043 | 1.55813 | |
| 4 | >=0.8 | 0.17813 | 0.19630 | 0.96347 | 0.37443 | 1.56619 | |
| 5 | =1 | 0.28253 | 0.15628 | 0.95995 | 0.43881 | 1.49866 | |
| Gravina in Puglia | 1 | >=0.2 | 0.24300 | 0.22162 | 0.93180 | 0.46462 | 1.43066 |
| 2 | >=0.4 | 0.27420 | 0.20573 | 0.93125 | 0.47993 | 1.41556 | |
| 3 | >=0.6 | 0.29569 | 0.19413 | 0.93078 | 0.48981 | 1.40566 | |
| 4 | >=0.8 | 0.32716 | 0.18282 | 0.92895 | 0.50998 | 1.38414 | |
| 5 | =1 | 0.45529 | 0.15999 | 0.91685 | 0.61528 | 1.26957 |
© 2020 by the authors. Licensee MDPI, Basel, Switzerland. This article is an open access article distributed under the terms and conditions of the Creative Commons Attribution (CC BY) license (http://creativecommons.org/licenses/by/4.0/).
Share and Cite
Smiraglia, D.; Filipponi, F.; Mandrone, S.; Tornato, A.; Taramelli, A. Agreement Index for Burned Area Mapping: Integration of Multiple Spectral Indices Using Sentinel-2 Satellite Images. Remote Sens. 2020, 12, 1862. https://doi.org/10.3390/rs12111862
Smiraglia D, Filipponi F, Mandrone S, Tornato A, Taramelli A. Agreement Index for Burned Area Mapping: Integration of Multiple Spectral Indices Using Sentinel-2 Satellite Images. Remote Sensing. 2020; 12(11):1862. https://doi.org/10.3390/rs12111862
Chicago/Turabian StyleSmiraglia, Daniela, Federico Filipponi, Stefania Mandrone, Antonella Tornato, and Andrea Taramelli. 2020. "Agreement Index for Burned Area Mapping: Integration of Multiple Spectral Indices Using Sentinel-2 Satellite Images" Remote Sensing 12, no. 11: 1862. https://doi.org/10.3390/rs12111862
APA StyleSmiraglia, D., Filipponi, F., Mandrone, S., Tornato, A., & Taramelli, A. (2020). Agreement Index for Burned Area Mapping: Integration of Multiple Spectral Indices Using Sentinel-2 Satellite Images. Remote Sensing, 12(11), 1862. https://doi.org/10.3390/rs12111862