Article

Effects of Typhoon Paths on Storm Surge and Coastal Inundation in the Pearl River Estuary, China

1
Key Laboratory of Ocean Circulation and Waves, Institute of Oceanology, Chinese Academy of Sciences, 7 Nanhai Road, Qingdao 266071, China
2
University of Chinese Academy of Sciences, Beijing 100049, China
3
Center for Ocean Mega–Science, Chinese Academy of Sciences, 7 Nanhai Road, Qingdao 266071, China
4
Laboratory for Ocean and Climate Dynamics, Qingdao National Laboratory for Marine Science and Technology, 1 Wenhai Road, Qingdao 266237, China
*
Author to whom correspondence should be addressed.
Remote Sens. 2020, 12(11), 1851; https://doi.org/10.3390/rs12111851
Submission received: 11 April 2020 / Revised: 19 May 2020 / Accepted: 27 May 2020 / Published: 8 June 2020
(This article belongs to the Special Issue Coastal Environments and Coastal Hazards)

Abstract

:
A coastal inundation simulation system was developed for the coast of the Pearl River estuary (PRE), which consists of an assimilation typhoon model and the coupled ADCIRC (Advanced Circulation) + SWAN (Simulating Waves Nearshore) model. The assimilation typhoon model consists of the Holland model and the analysis products of satellite images. This is the first time an assimilation typhoon model has been implemented and tested for coastal inundation via case studies. The simulation results of the system agree well with the real measurements. Three observed typhoon paths (Hope, Nida, and Hato) were chosen to be the studied paths based on their positions relative to the PRE, China. By comparing the results of experiments with different forcing fields, we determined that the storm surge and the coastal inundation were mainly induced by wind forcing. By simulating coastal inundation for different typhoon center speeds, the Hato3 path most easily causes coastal inundation in the PRE. Moreover, the moving speed of the typhoon’s center significantly affects the coastal inundation in the PRE. The inundation becomes very serious as the movement of the typhoon center was slow down. This study provides a new reference for future predictions of coastal inundations.

1. Introduction

Coastal inundations are caused by typhoons, which are common in the Pearl River Estuary (PRE) in the northern part of the South China Sea in summer in the northern hemisphere. In August 1979, Typhoon Hope severely affected the coastal area of the PRE extending to Shantou City. During this typhoon, the maximum storm surge of 3.3 m occurred at Daya Bay, and the maximum inundation depth of 2.83 m occurred in Shenzhen City. The sea breached the seawall, flooding fields and towns, killing 114 people, leaving 7 missing, and injuring 1489 [1]. In August 2016, Typhoon Nida generated destructive storm surges and coastal inundations in the PRE, causing a direct economic loss of more than 75 million dollars in Guangdong Province [2]. In August 2017, Typhoon Hato landed at Zhuhai City, Guangdong, during a high astronomical tide, damaging 1.22 km of wharf, 240.15 km of breakwater, and 532.08 km of seawall, killing 6 people (including the missing people), and causing a direct economic loss of 784 million dollars [3]. Moreover, climate warming will probably increase the intensity of typhoons [4,5,6], and the more intense typhoons and the accelerated sea-level rise will increase the risk to coastal areas [7,8,9,10,11]. If this occurs, the magnitude of the losses induced by coastal inundation will increase in the PRE. Thus, it is critical that we develop a reliable simulation for inundation, which can provide a reliable damage estimation for the larger disasters in this region.
Hydrodynamic modeling is a useful tool for simulating coastal inundation, which is affected by storm surges and waves, which are generated by a typhoon. Examples include the inundation simulations for New York City [12,13], the Mississippi [14], the Gulf of Mexico [15,16], the Bay of Bengal [17,18,19], Shanghai City [20,21], Zhejiang Province [22], and Macau [23,24]. Most of these studies focused on the simulation and verification of the coastal inundation induced by waves and storm surges caused by typhoons. However, the increasing inundation risk and typhoon intensity require more research on the action of typhoon paths. Several studies have focused on the effects of typhoon intensity on the storm surge near the PRE [25,26,27], but they did not study the inundation in that region. Based on a comprehensive analysis of previous research results, the coupled ADCIRC (Advanced Circulation) + SWAN (Simulating Waves Nearshore) model (advanced circulation model + the simulating waves nearshore model; http://adcirc.org/) is widely used in studies conducted on storm surge and coastal inundation in coastal areas. This model can produce a high-resolution simulation of coastal areas within an unstructured mesh [22,27,28,29,30,31,32].
Data for typhoon air pressure, wind fields, and center positions are needed to simulate coastal inundation. Some typhoon models have been used to describe typhoon processes [33,34,35,36]. However, symmetric and asymmetric typhoon models cannot accurately reproduce the real meteorological field near the coast. Taking the Holland model as an example, Figure 1a–d shows planar views of the wind and air pressure of Typhoon Hato (2017) at 12:00 UTC on 22 August 2017. According to the comparison between the field from the analysis product dataset (Figure 1b,d; Climate Forecast System Version 2) and the Holland field (Figure 1a,c), the pressure of the Holland model overestimates the pressure field near the PRE at that time. In addition, the pressure, wind, and position of the typhoon’s center provided by the analysis product dataset are also inaccurate. Thus, we need to choose a typhoon model that can overcome these two difficulties (Section 2.2).
This study concentrates on the impact of typhoon paths on storm surge and coastal inundation in the PRE, China. A coastal inundation system was developed using a high-resolution numerical hydrodynamic model and an assimilation typhoon model. Section 2 describes the methods and data. The model validation is presented in Section 3. Section 3 also describes the experiments and results of the sensitivity of the coastal inundation to the meteorological forcing field, the typhoon’s path, and the moving speed of the typhoon’s center. Finally, Section 4 summarizes the main results and provides guidance for government departments concerned with coastal inundation forecasting and coastal engineering design.

2. Materials and Methods

2.1. Hydrodynamic Model

The coastal inundation was modeled through the two-dimensional, depth-integrated implementation of the coupled ADCIRC + SWAN model. The ADCIRC model is a finite-element model that was developed by Luettich et al. and Westerink et al. [37,38]. It can flexibly cover complex coastlines to reproduce the tidal hydrodynamics of coastal areas [39]. The SWAN model is a third-generation wave model [40,41], which is suitable for coastal areas, estuaries, and lakes. The ADCIRC model has been used to study coastal inundation generated by storm surges in coastal areas [14,16,17]. The coupled ADCIRC + SWAN model makes the ADCIRC model and the SWAN model run in the same unstructured mesh, resulting in a high computational efficiency [42]. The coupled ADCIRC + SWAN model can be used to simulate the complex processes of coastal inundation over a high-resolution unstructured grid [22]. The SWAN model provides the wave parameters and radiation stress gradients for the ADCIRC model. Furthermore, the SWAN model incorporates the water level and current field data provided by the ADCIRC model into the balance equation of the wave action density spectrum. Then, the SWAN model calculates the wave parameters for each data exchange between the two models.
Overflow and inundation occur when the modeled water level is higher than the coastal elevation. Henderson’s classical hydraulic formula was used to calculate the spillway discharge of the overflow and the inundation in the coupled model:
Q = 2 3 C m 2 g h 2 3 .
C m = 0.611 × [ ( 1 + v 2 2 g h ) 3 2 ( v 2 2 g h ) 3 2 ] ,
where Q is the spillway discharge; h is the height of the water level above the seawall; and g is the acceleration due to gravity. C m is the discharge coefficient; and v is the current velocity.
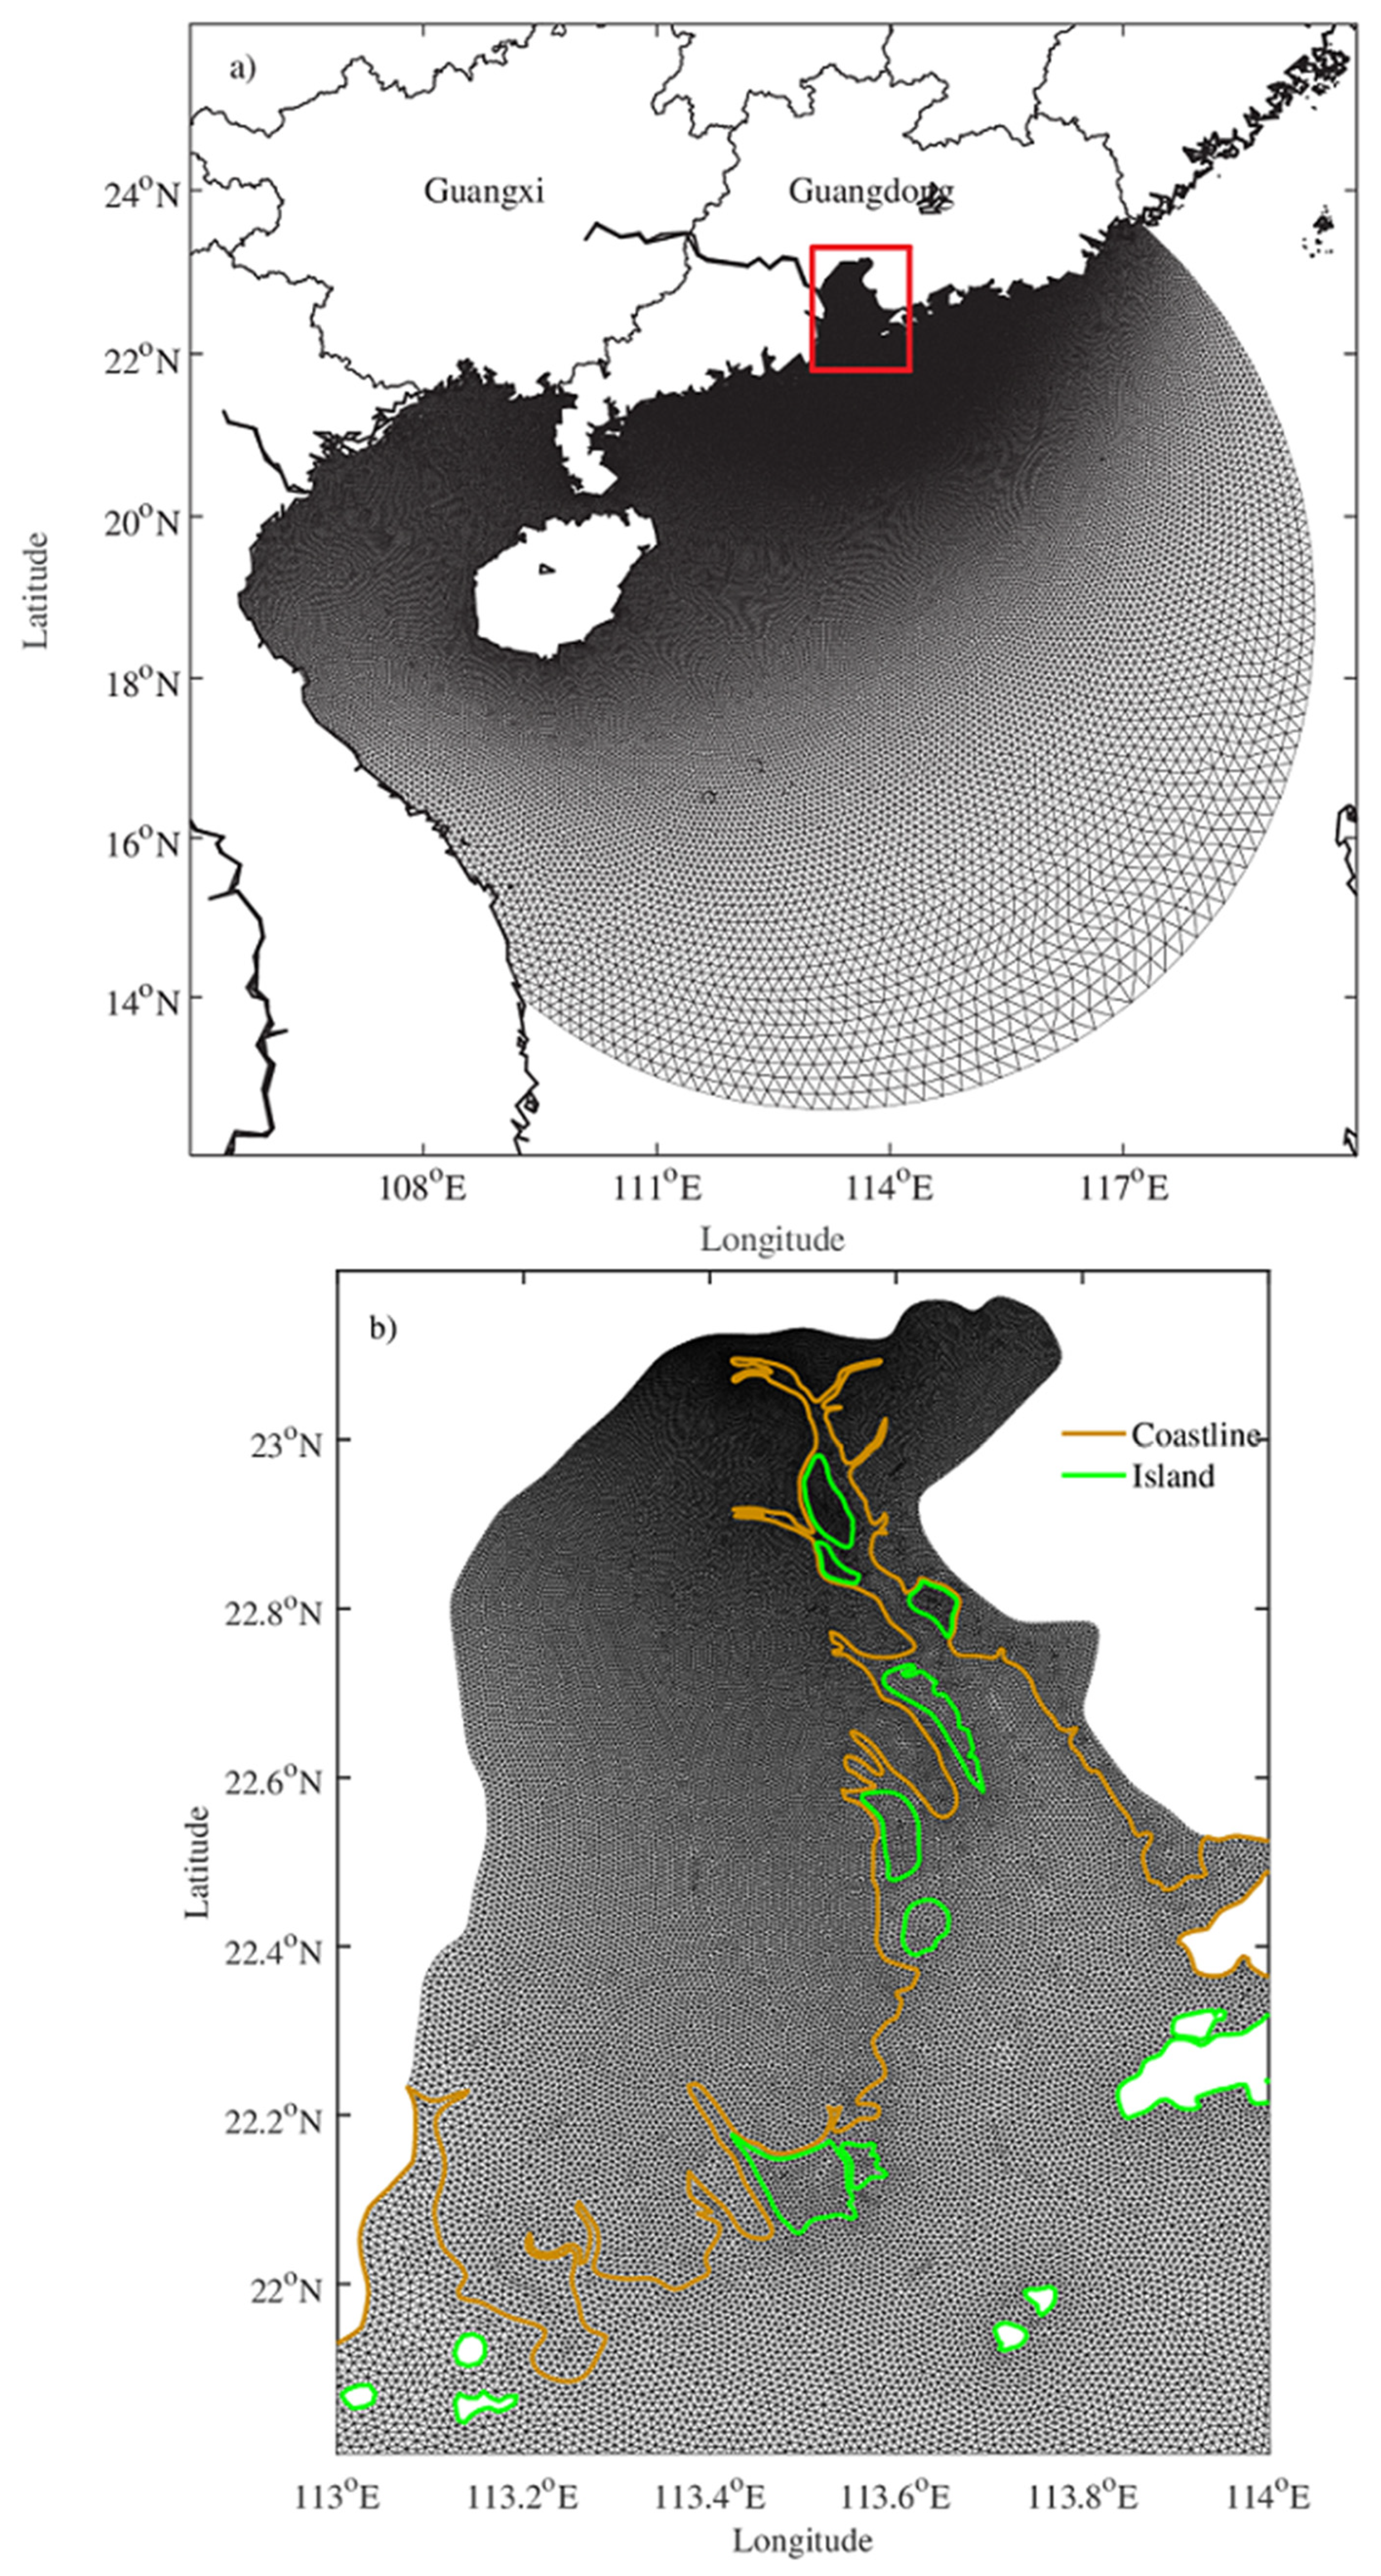
We constructed an unstructured mesh suitable for the coupled ADCIRC + SWAN model. Figure 2a and b shows the coverage and topography of the calculation domain. The land boundary was determined from the electronic nautical charts and the General Bathymetric Chart of the Oceans, and the description is provided in Section 2.3. The resolution of the mesh decreases gradually from inland (70 m) to offshore (300 m) to deep ocean (30 km). In this study, the computational domain extends from 12.5° N to 23.5° N and from 105.5° E to 129.5° E. The grid covers the PRE with a high resolution (100 m–200 m) (Figure 2b). The brown and green lines in Figure 2b are not only the boundaries of the islands and the mainland, but they are also the demarcations of the dry (land) mesh and the wet (sea) mesh. The simulation time of the model was set to UTC. The coupled ADCIRC + SWAN model is forced by the tides, winds, and air pressure. The open boundary is driven by the harmonic constants of the eight main astronomical constituents (K1, K2, M2, N2, O1, P1, Q1, and S2), which were obtained from the Oregon State University Tidal Prediction Software (OTPS). The ADCIRC model calculates per second, while the SWAN model calculates per hour. We set the interval of data exchange between the two models as 1 hour. The output of the coupled model was calculated hourly. The coupled ADCIRC + SWAN model begins with a cold start.

2.2. Assimilation Typhoon Model

As mentioned in Section 1, the meteorological field provided by the Holland typhoon model cannot reproduce the typhoon field before the typhoon center arrives in the PRE (see details in Figure 1c,d). In order to contain these aspects, we chose an assimilation typhoon model composed of the analysis products (CFSR or CFSV2) and the Holland model [33]. The method and details of the assimilation typhoon model have been described by Du et al. [27]. Here, we list some main equations as follows:
V g = [ A B ( p n p c ) exp ( A / r B ) / ρ r B + r 2 f 2 / 4 ] 1 / 2 - r f / 2 ,
P g = P c + ( P n P c ) exp ( A / r B ) ,
V = ( 1 λ ) V H + λ V b ,
P = ( 1 λ ) P H + λ P b ,
λ = ξ 4 / ( 1 + ξ 4 ) ,
ξ = r / ( n R max ) ,
R max = 51.6 exp ( 0.0223 V max + 0.0281 φ ) ,
B = 1.0036 + 0.01173 V max 0.0313 ln R max ,
where V g is the gradient of the wind at radius r ; P g is the pressure gradient at radius r ; P n is the ambient pressure ( P n = 1.013e5 Pa); f is the Coriolis parameter; and P c is the central pressure. A and B are scaling parameters expressed by R max = A 1 / B ; R max is the radius of the maximum wind speed; V H is the wind speed from the Holland model [32]; P H is the pressure from the Holland model [33]; V b is the wind speed from the CFSR or CFSV2 dataset; P b is the pressure from the CFSR or CFSV2 dataset; and λ and ξ are weight coefficients. Equations. 9 and 10 are from Willoughby and Rahn [43]. V max is the maximum wind speed of the typhoon; and φ is the latitude. When n = 4, the assimilation typhoon model provides a relatively accurate description of the dynamic characteristics of the typhoon [44].
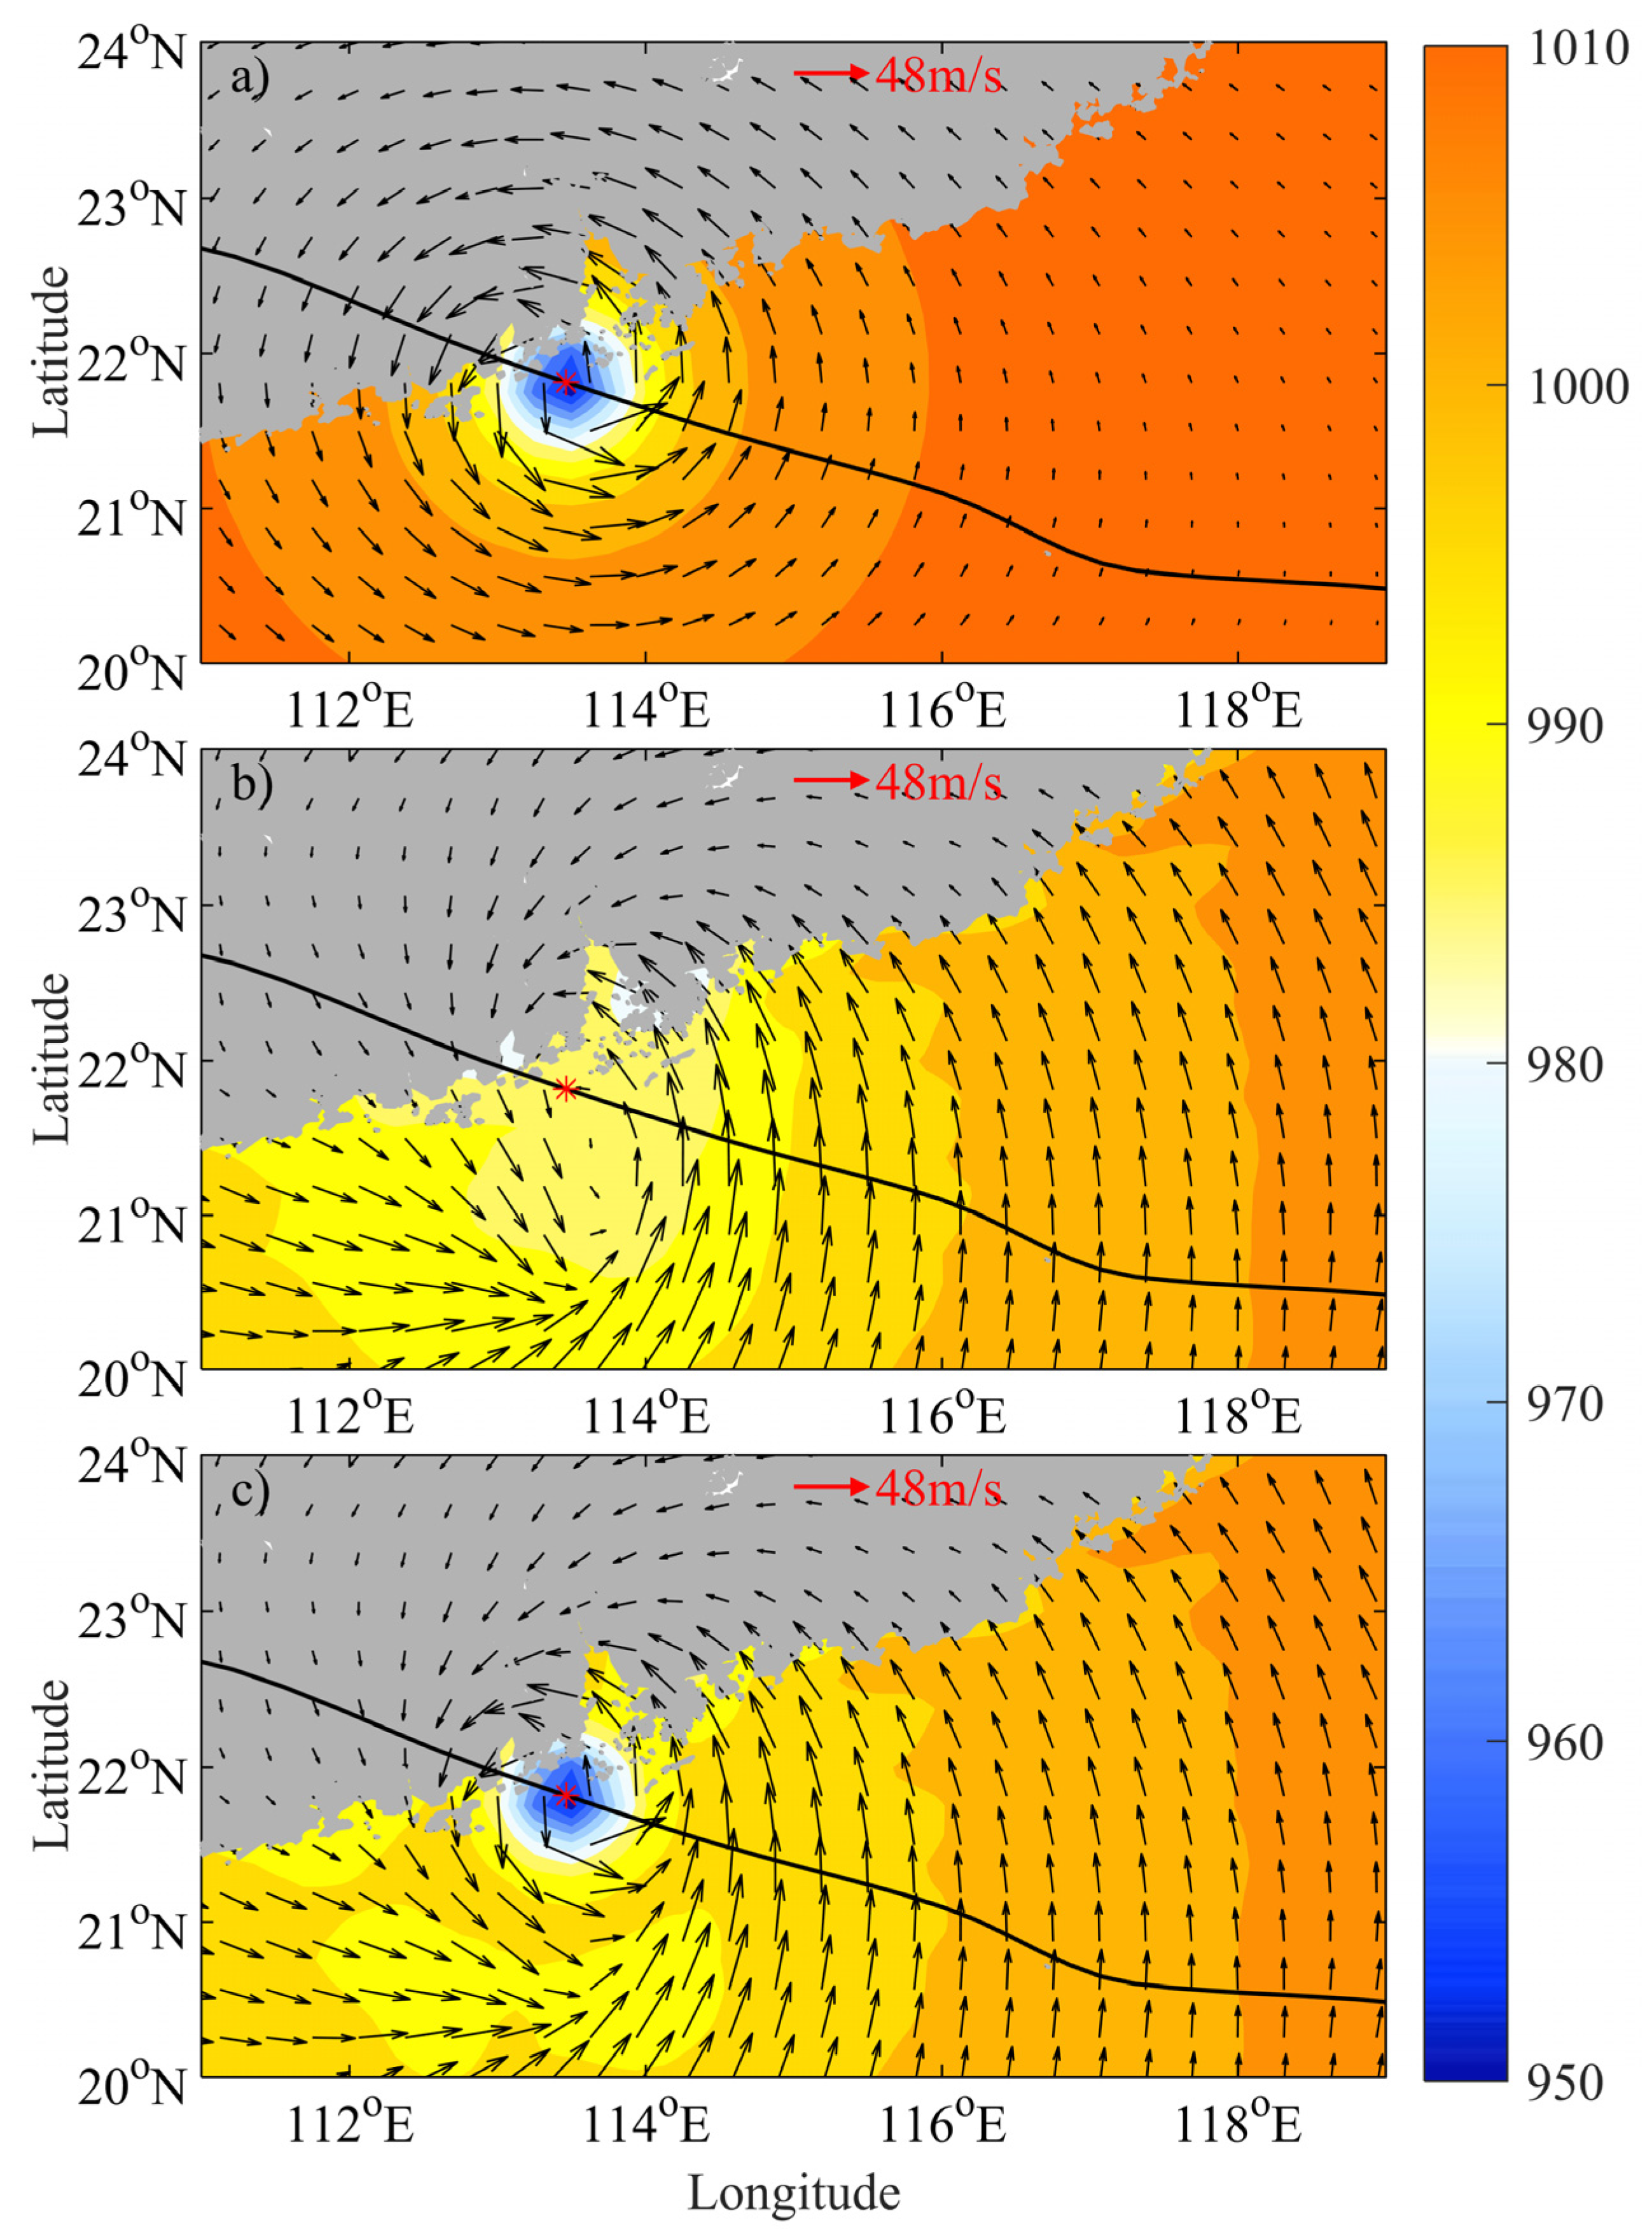
Taking Typhoon Hato (2017) as an example, the planar views of the wind and air pressure fields at 04:00 UTC on 23 August 2017, are shown in Figure 3. Figure 3a shows the view of the Holland model; Figure 3b shows the view of the CFSV2 data set (satellite image analysis data); and Figure 3c shows the typhoon simulated using the assimilation typhoon model. According to the data reported on the website of the National Meteorological Center (NMC) of the China Meteorological Administration (CMA), the maximum wind speed of Hato was 48 m/s, and the position of the typhoon’s center was (21.9° N, 113.5° E) at that moment. Therefore, compared with the satellite image analysis data, the assimilation typhoon model captures the characteristics of the typhoon better.
Using the meteorological field from the assimilation typhoon model, we used the cubic spline interpolation to interpolate the wind speed and air pressure onto the calculation mesh, which is suitable for the coupled ADCIRC + SWAN model. Then, we made the wind-pressure file (NWS = 305 selected in the model’s setting file fort.15), which is input hourly to drive the coupled ADCIRC + SWAN model. In addition, Section 4 describes several experiments on the sensitivities of the storm surge and coastal inundation to different forcing fields. The wind-pressure forcing field consisted of the wind field and the pressure field of the assimilation typhoon model. Then, we set the wind speeds in the x and y directions as zero vectors to achieve the meteorological driving field of the single pressure forcing field and obtained the single wind forcing field by setting the entire pressure field to a constant value (1.013 × 10⁵ Pa). Moreover, we constructed other typhoon events with slower moving speeds based on the path of Hato (2017) in order to concentrate on the effects of the moving speeds of the typhoon center on storm surge and coastal inundation. The central moving speed corresponding to part of the path of Typhoon Hato in the region bounded by (114.5° E, 21.5° N) and (110.9° E, 22.7° N) was modified. Hato1, Hato2, and Hato3 are three new typhoon events with the central speeds of 25 km/h, 20 km/h, and 15 km/h, respectively. The landing time of these three new typhoon events is the same as that of Typhoon Hato (2017), i.e., 04:50 UTC on 23 August 2017. This ensures that the coastal area is experiencing the same astronomical tides when the typhoons land. This can better reflect the effects of the typhoon’s moving speeds on the storm surge and coastal inundation. To clarify, all of these driving fields were made into input files, which are suitable for the coupled ADCIRC + SWAN model, and were input hourly.

2.3. Data

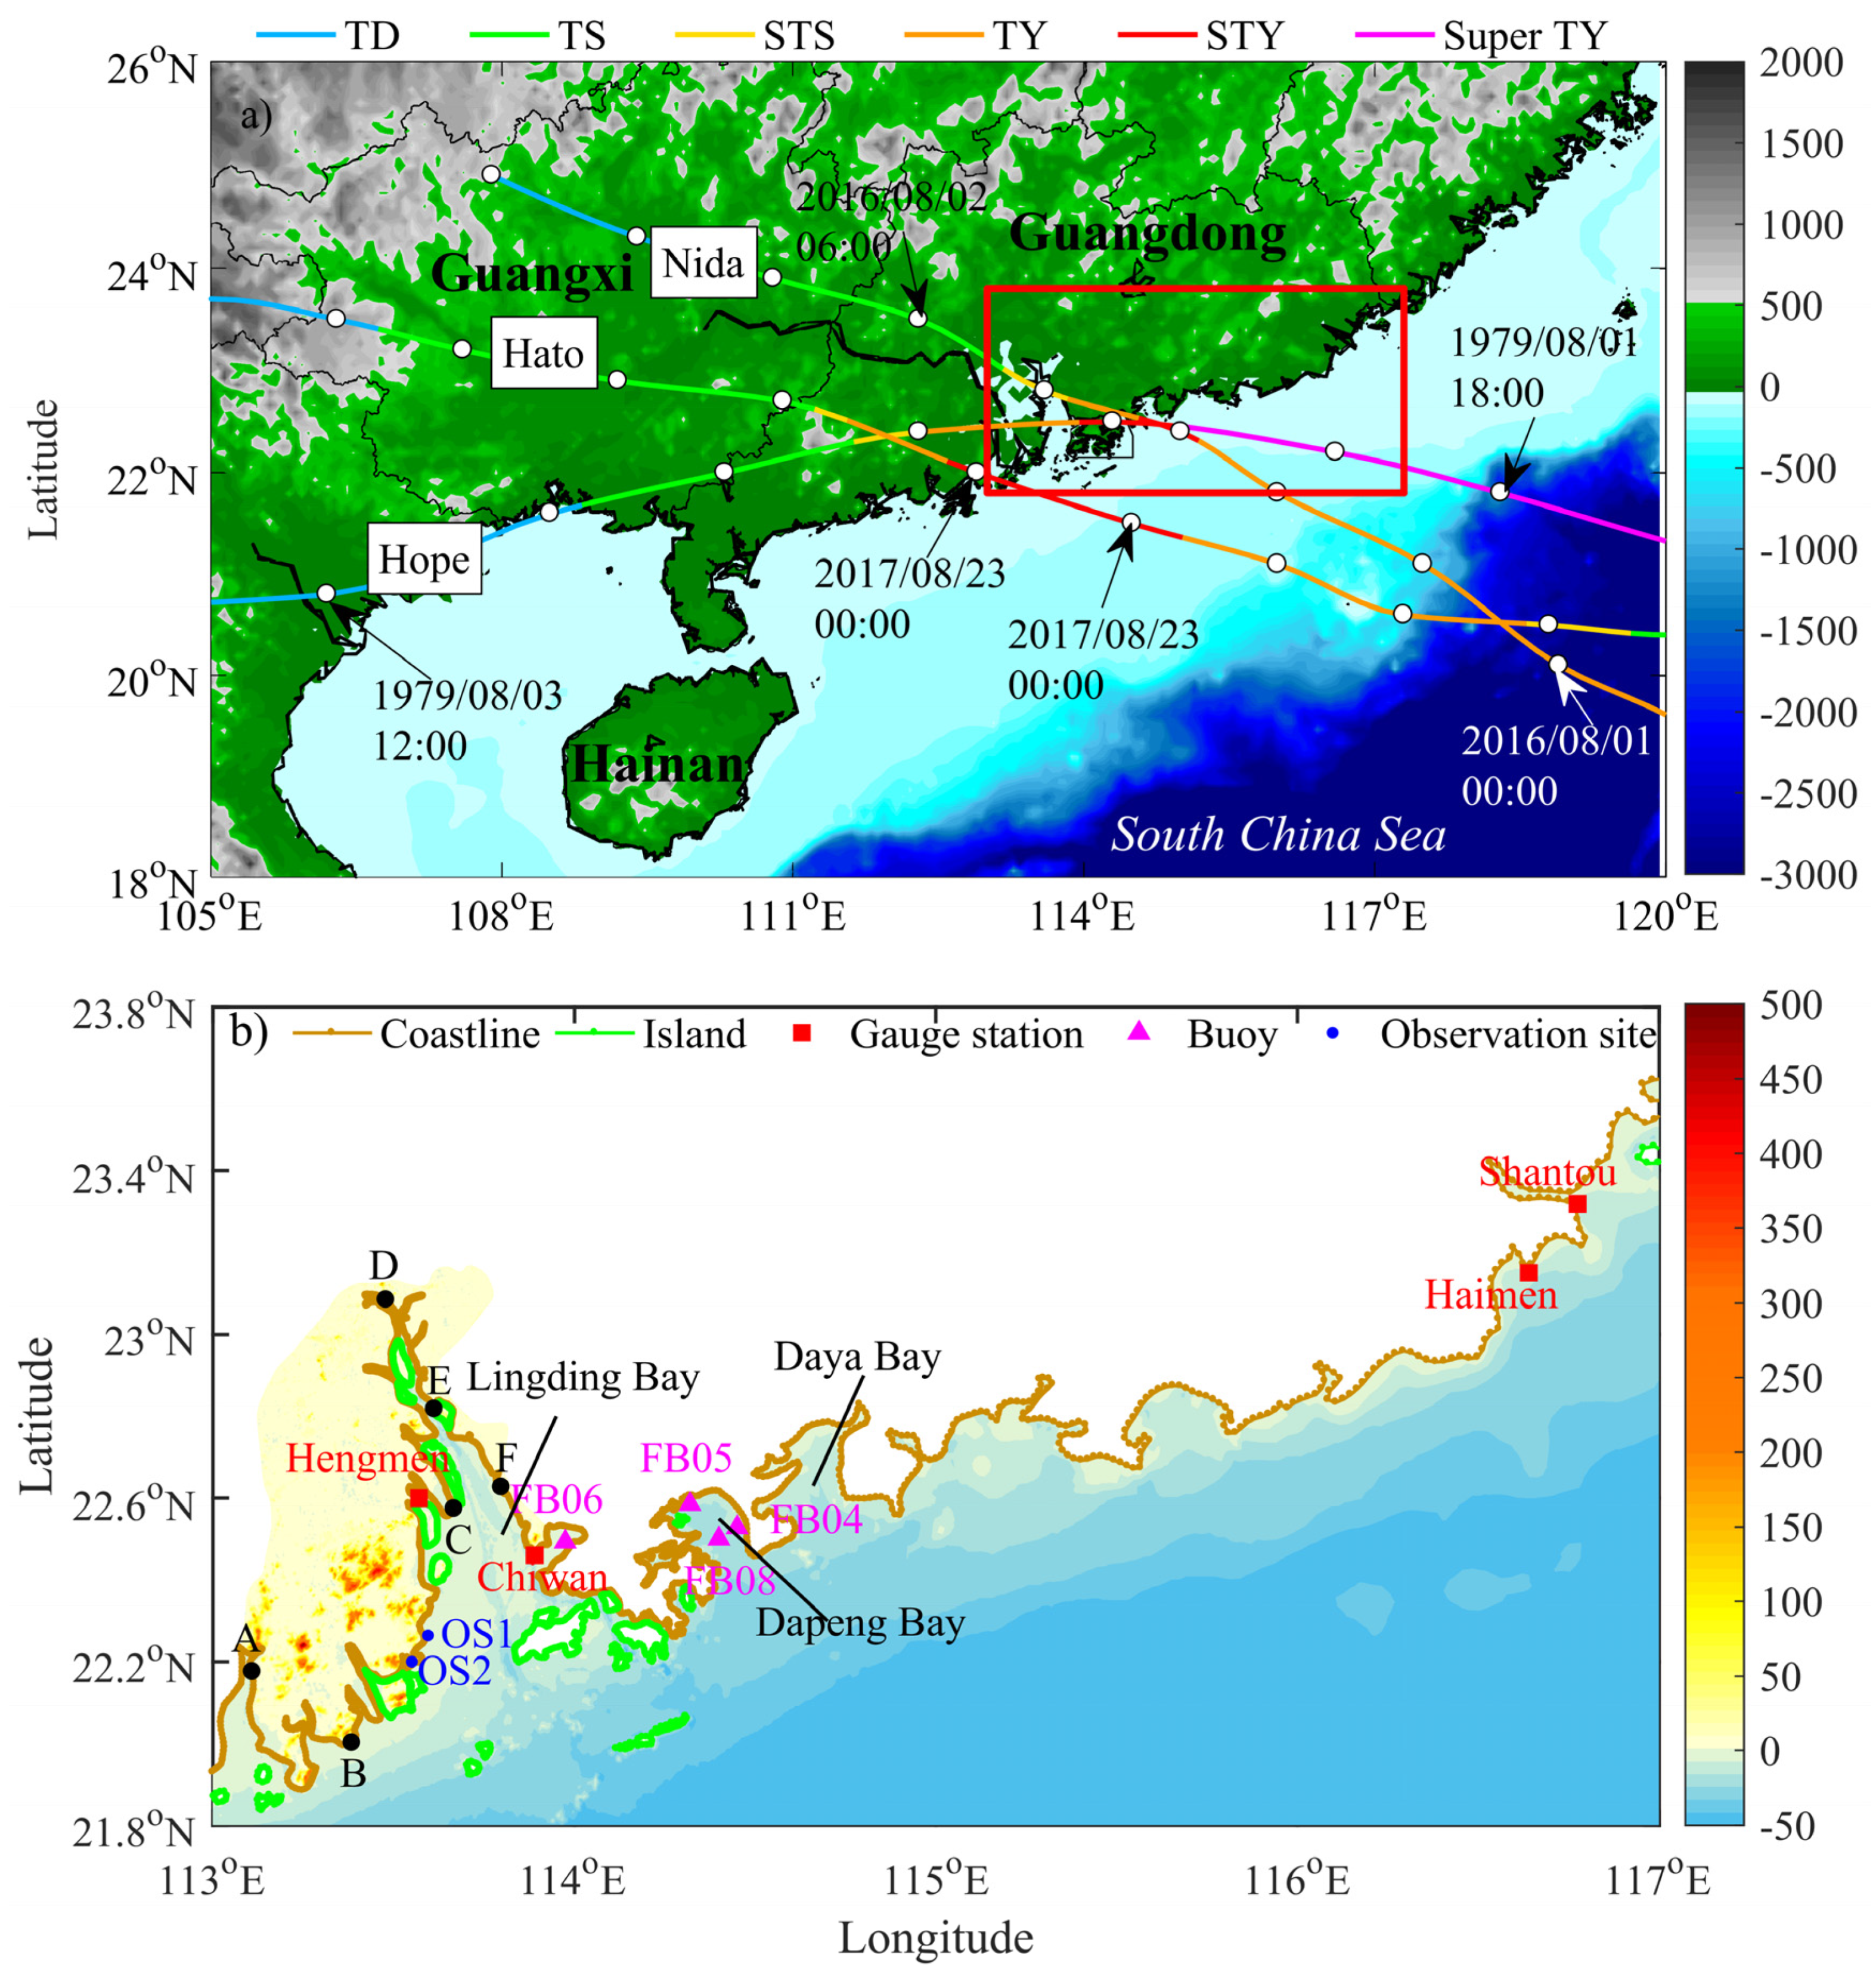
The typhoon paths were obtained from the Tropical Cyclone Best Track Dataset of the China Meteorological Administration (CMA) [45] (http://tcdata.typhoon.org.cn/) and the typhoon network of the National Meteorological Center of the CMA (http://typhoon.nmc.cn/). Typhoon scale refers to the scale of the cyclone recorded by the CMA: tropical depression (TD), tropical storm (TS), strong tropical storm (STS), typhoon (TY), strong typhoon (STY), and super typhoon (Super TY). Typhoon Hope (1979), Typhoon Nida (2016), and Typhoon Hato (2017) are three typical, historical typhoon paths that occurred in the PRE region (Figure 4a). Thus, we chose them to discuss the effects of the typhoon’s path on coastal inundation. Table 1 lists the main features of these three typhoon events. The analysis products were derived from the hourly time-series dataset of the Climate Forecast System Reanalysis (CFSR) (https://rda.ucar.edu/datasets/ds093.1/) Selected Hourly Time-Series Product and the Climate Forecast System Version 2 (CFSV2) (https://rda.ucar.edu/datasets/ds094.1/) Selected Hourly Time-Series product [46,47]. Notably, the CFSR only contains data before 2011, while the data after 2011 is from the CFSV2. Thus, these two datasets cover the range of data needed. Notably, both the CFSR and the CFSV2 are analysis data from satellite images.
The land topography data set was provided by the Geospatial Data Cloud site, Computer Network Information Center, Chinese Academy of Sciences (http://www.gscloud.cn). This data set was processed a second time based on the Advanced Space borne Thermal Emission and Reflection Radiometer Global Digital Elevation Model Version 1 (ASTER GDEM V1). A stereo image pair was obtained from the ASTER near-infrared band vertical downward imaging sensor and the rear-view imaging sensor, and finally, the DEM data was generated. The ASTER GDEM is a digital elevation data product with a global spatial resolution of 30 m. These data provide fine-scale shoreline details and elevation data, so they provide a guarantee for the inundation simulation experiment.
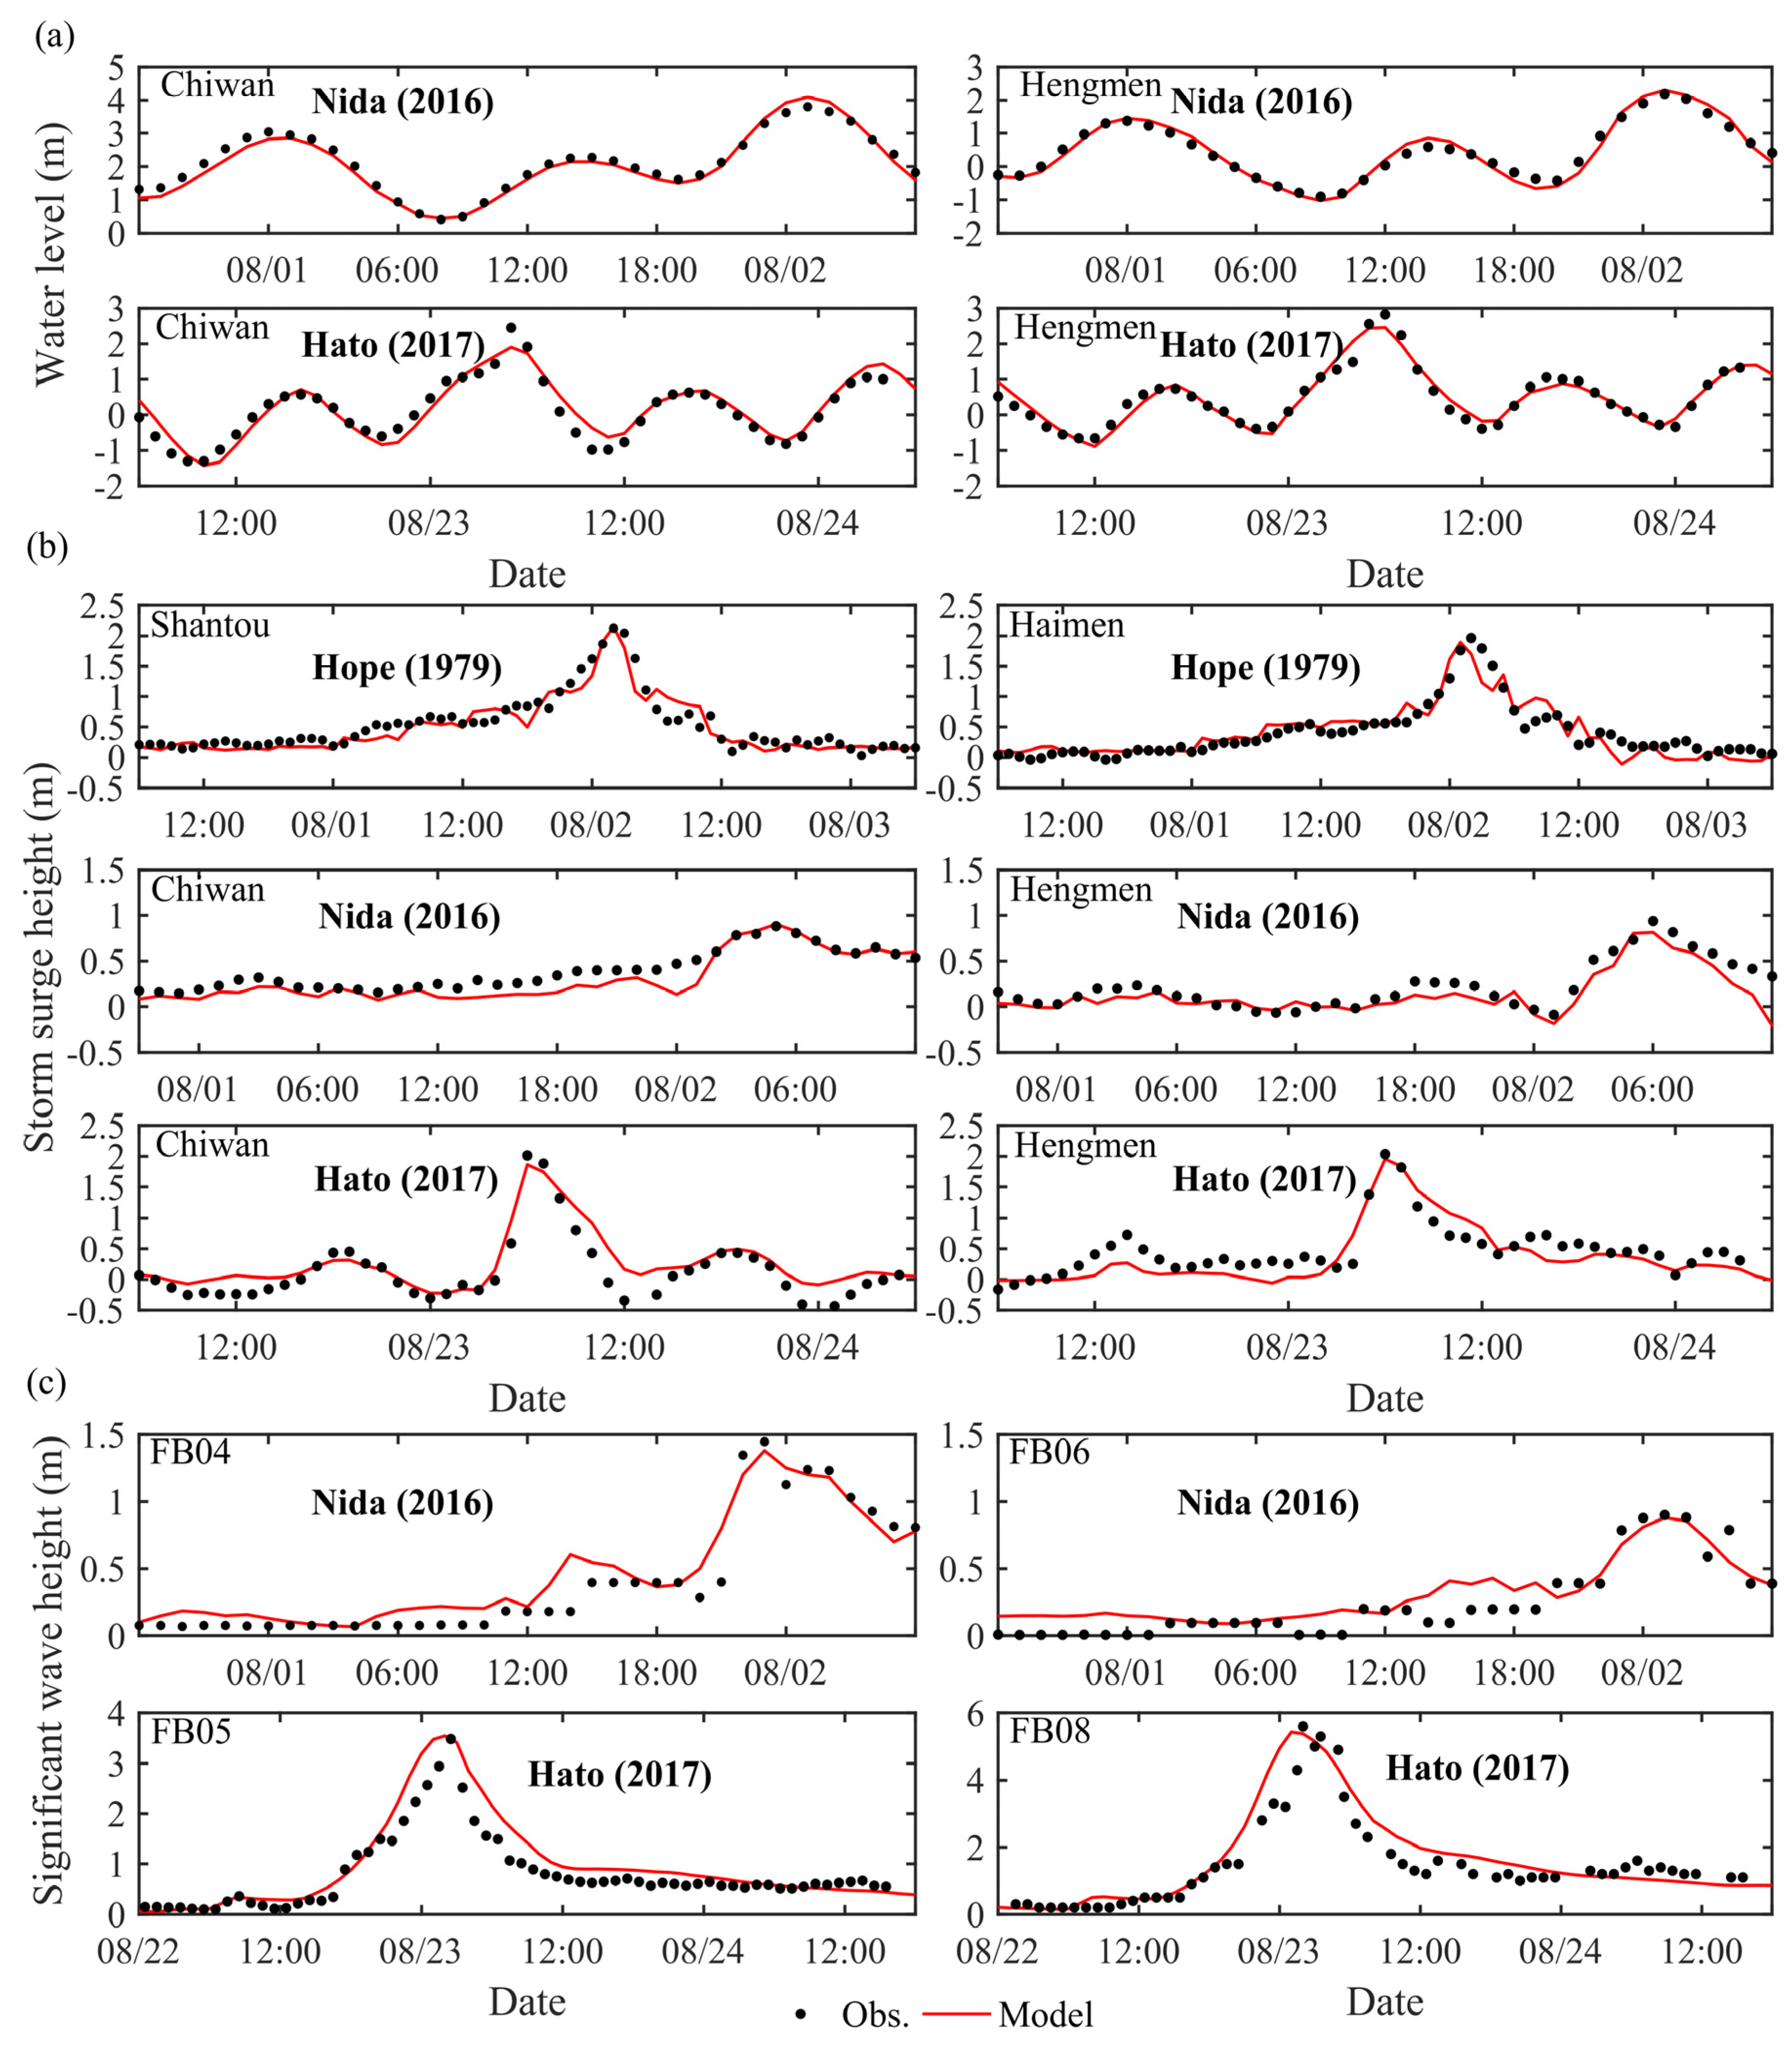
The accuracy of the coastline is also very important for the numerical simulation [48,49,50]. Therefore, the bathymetry and coastline data were derived from the General Bathymetric Chart of the Oceans (GEBCO) (https://www.gebco.net/) and electronic nautical charts (ZHOUSHAN Chart Information Technology Co., Ltd., http://www.zshaitu.com/). The GEBCO has a resolution of 30 s, and the charts have a resolution of 30 m. The measured water level, storm surge height, and significant wave height were used to verify the model using tide gauges and buoys (marked in Figure 4b) deployed by the Shenzhen Ocean Monitor and Forecast Center prior to the typhoon in the coastal seas of the PRE. Indices used to assess the simulation results of the storm surges and significant wave heights are presented in Table 2 and Figure 5. The measurements used to verify the coastal inundation generated by Typhoon Nida (2016) were obtained from field investigations and from the National Marine Hazard Mitigation Service (NMHMS). Finally, the measurements of the inundation generated by Typhoon Hato (2017) were obtained from Li et al. [23]. The details of the measured inundation will be described in Section 3.

3. Results and Discussion

3.1. Model Validation

According to the data records of the NMHMS and Li et al. [23], significant inundation occurred along the PRE coast during typhoons Nida and Hato. The survey stations in Zhuhai City are marked as OS1 in Figure 4b, while the survey stations in Macau are marked as OS2 in Figure 4b. The comparison of the simulation results and the measured inundations is summarized in Table 3. At OS1, the root mean square error (RMSE) of the inundation depths and the inundation distance is 0.21 m and 12.75 m, respectively, and the correlation coefficient (CC) of the simulation and the measurement is 0.99. Notably, the survey location of Zhuhai’s inundation is in a beach area (OS1), while the survey location of Macau Peninsula’s inundation is in an inland area (OS2). During typhoon events, the precipitation aggravates the ponding at OS2 more seriously than at OS1. Because the survey station in Macau is located in an inland urban area, the flood discharge capacity in this area is limited. Therefore, the measured inundation depths at OS2 contain the precipitation height. However, the effects of meteorological precipitation are not considered in the coupled ADCIRC + SWAN model used in this study, so the OS2’s simulation results are smaller than its measurements. In addition, according to Table 3, the coastal inundation system can reproduce the coastal inundation generated by the increasing water level of the PRE’s coast. The maximum coastal inundation refers to the deepest inundation caused by a typhoon on the land of the coastal area. Although the coastal inundation caused by a typhoon often occurs in the PRE, people have limited records of inundation disasters due to the limitations of existing technology. The data for recorded inundation disasters are too limited to use to analyze the sensitivity of the inundations to the typhoon paths, so it is very effective and meaningful to use the validated numerical model to conduct the sensitivity experiments. In this section, the various verifications of the pattern results ensure the practical significance of our work. Furthermore, the bathymetry and topography have been changed by rapid urban development and reclamation and channel dredging in the PRE. If any inaccurate or uncertain bathymetry and topography data are used in the numerical model, there will be a difference between simulation results and the observations of the distance from the inundation place to the coastline.

3.2. Sensitivity Experiments on Storm Surge and Coastal Inundation

3.2.1. Different Forcing Fields

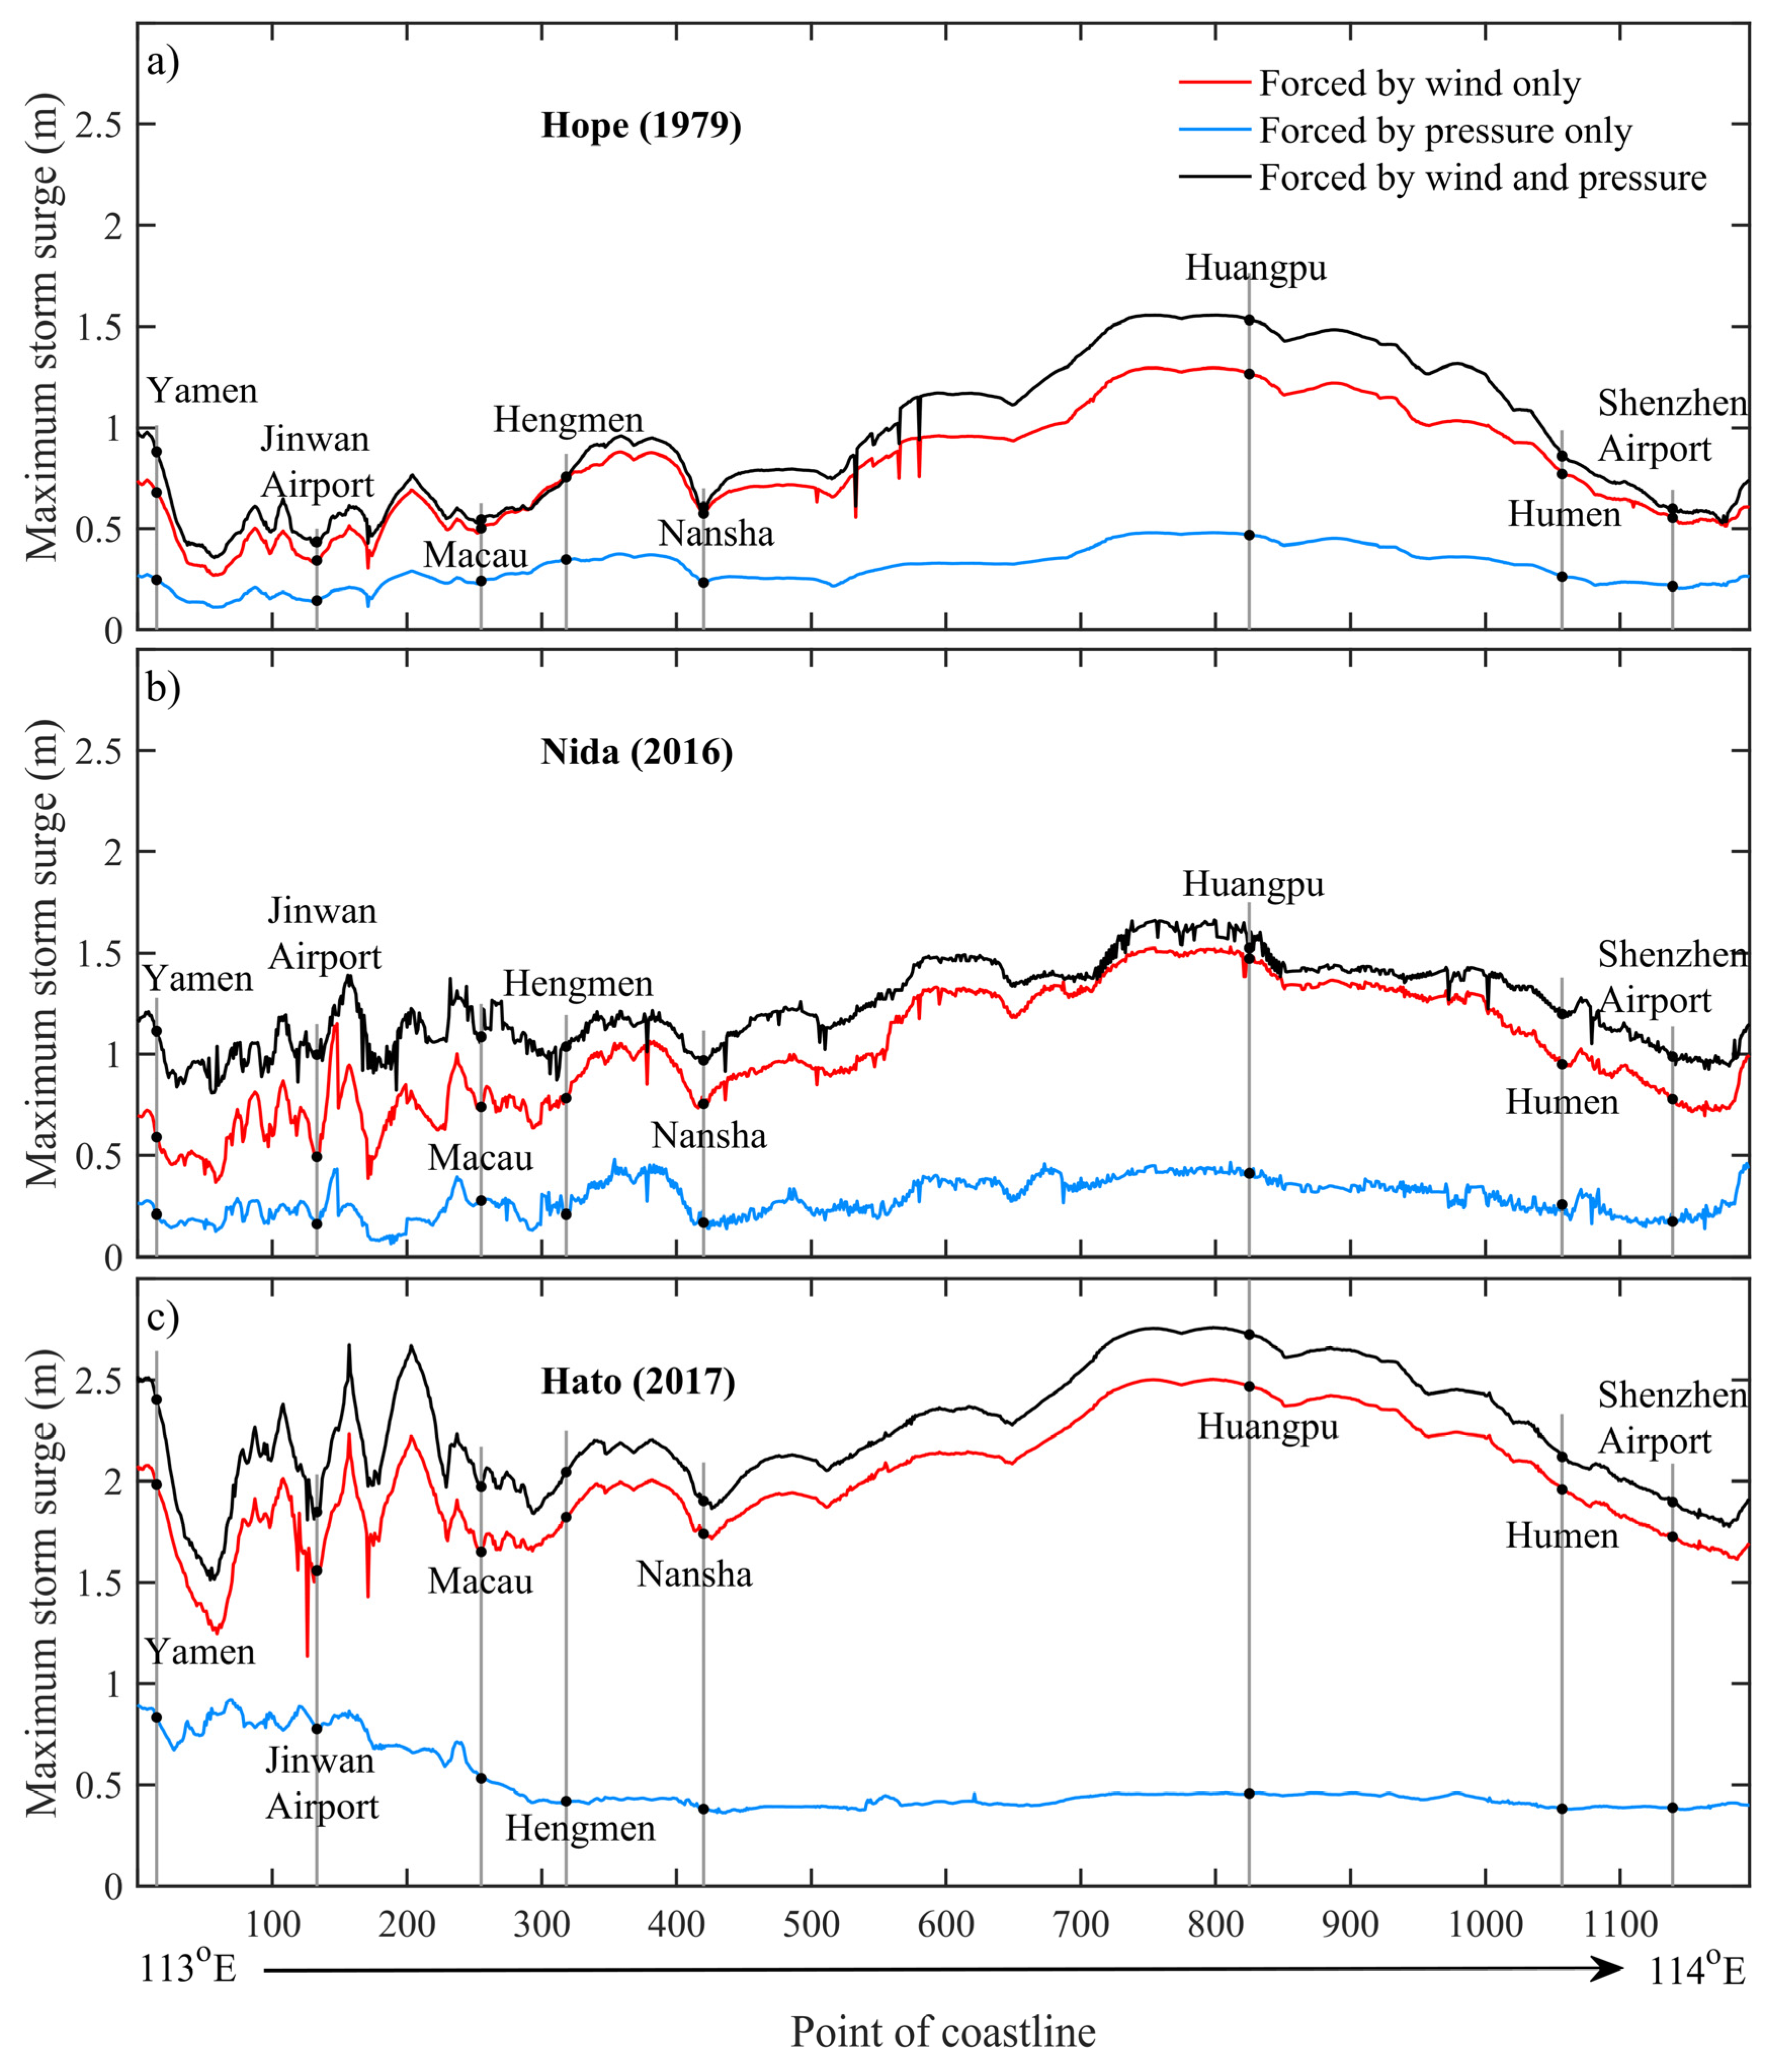
Using the forcing fields constructed in Section 2.2, nine simulations of three typhoons were conducted to analyze the sensitivity of storm surges to the pressure field, the wind field, and the wind-pressure field. The maximum storm surge refers to the highest storm surge caused by the typhoon. Figure 6a–c shows the simulated results of the maximum storm surges generated by the different forcing fields of the three typhoons. As can be seen in Figure 6a, the wind-pressure forcing generated the most serious storm surges in the PRE during Typhoon Hope. The storm surges generated only by pressure forcing (blue curves in Figure 6a) were far smaller than those generated by wind-pressure forcing (black curves in Figure 6a) or by only wind forcing (red curves in Figure 6a). The effective contribution of the wind forcing field to the storm surge is 85.36% on average, while the contribution of the pressure field is 26.15%. This demonstrates that storm surges are mainly generated by wind forcing. Moreover, the sum of the storm surges only forced by pressure plus those only forced by wind is greater than those forced by wind pressure. These descriptions also apply to the storm surges generated by Typhoon Nida and Typhoon Hato (Figure 6b,c). These results demonstrate that the effect of pressure forcing and wind forcing on storm surges is not a simple linear superposition, but rather a nonlinear interaction between them.
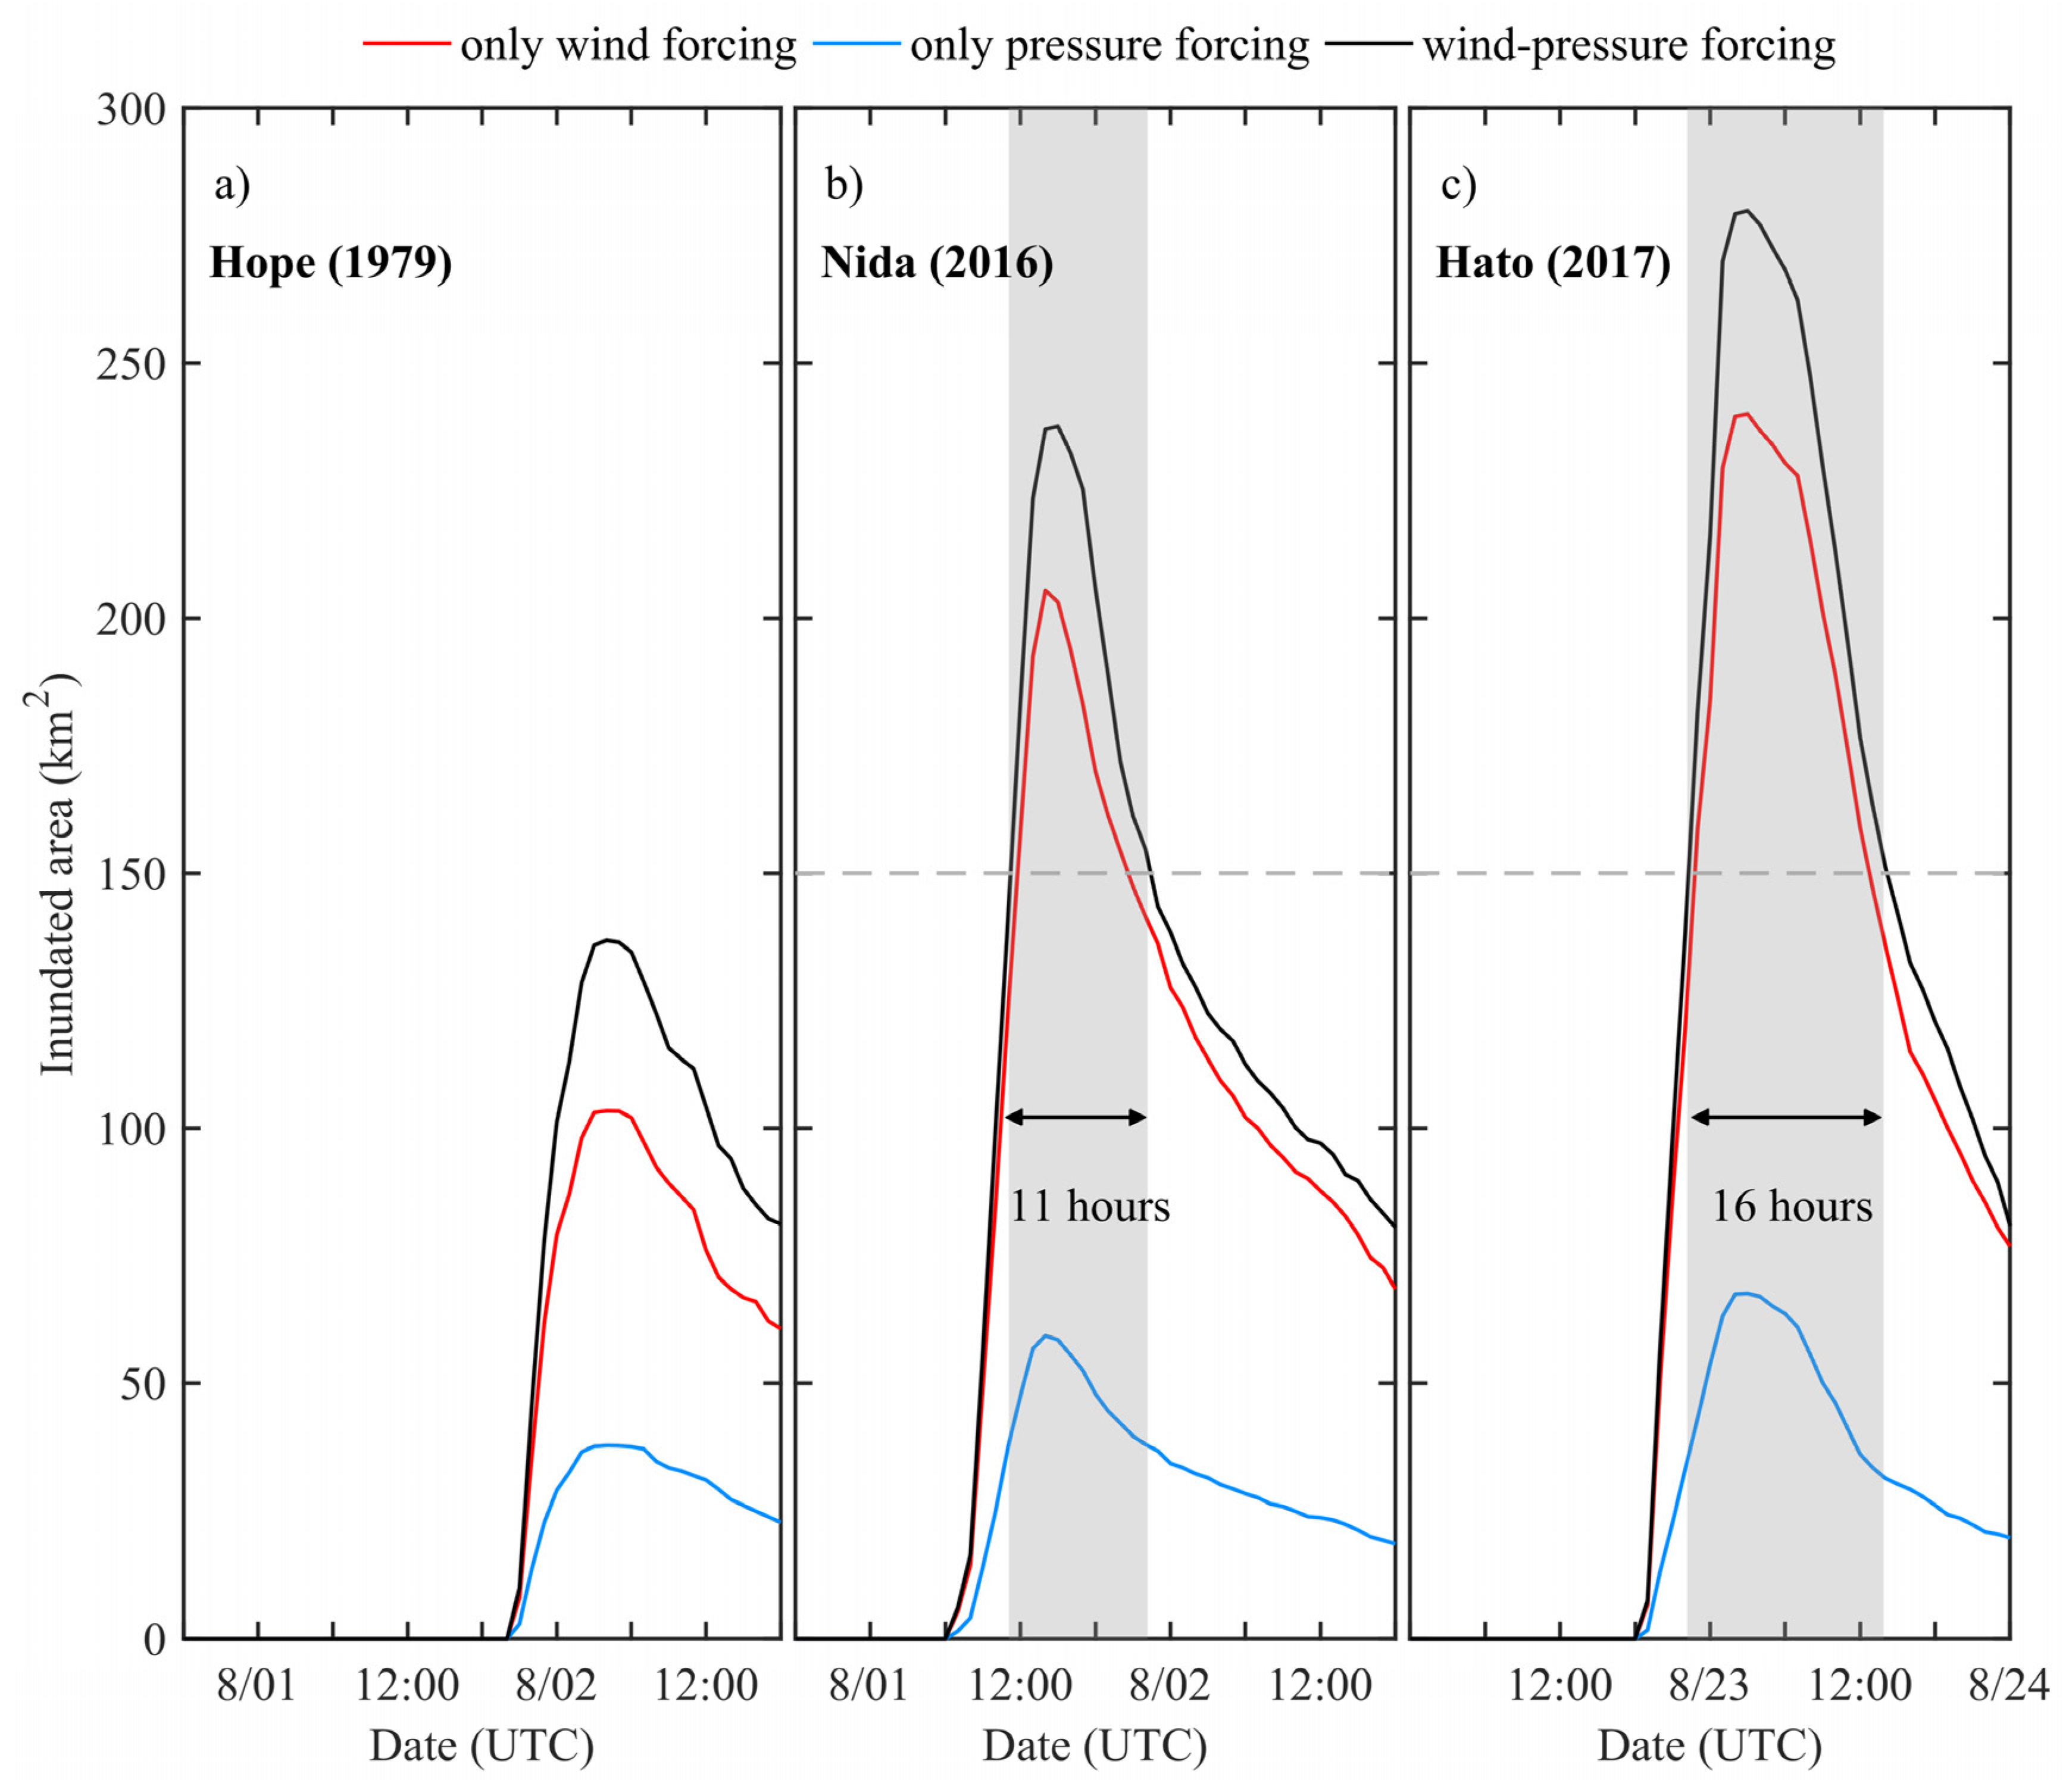
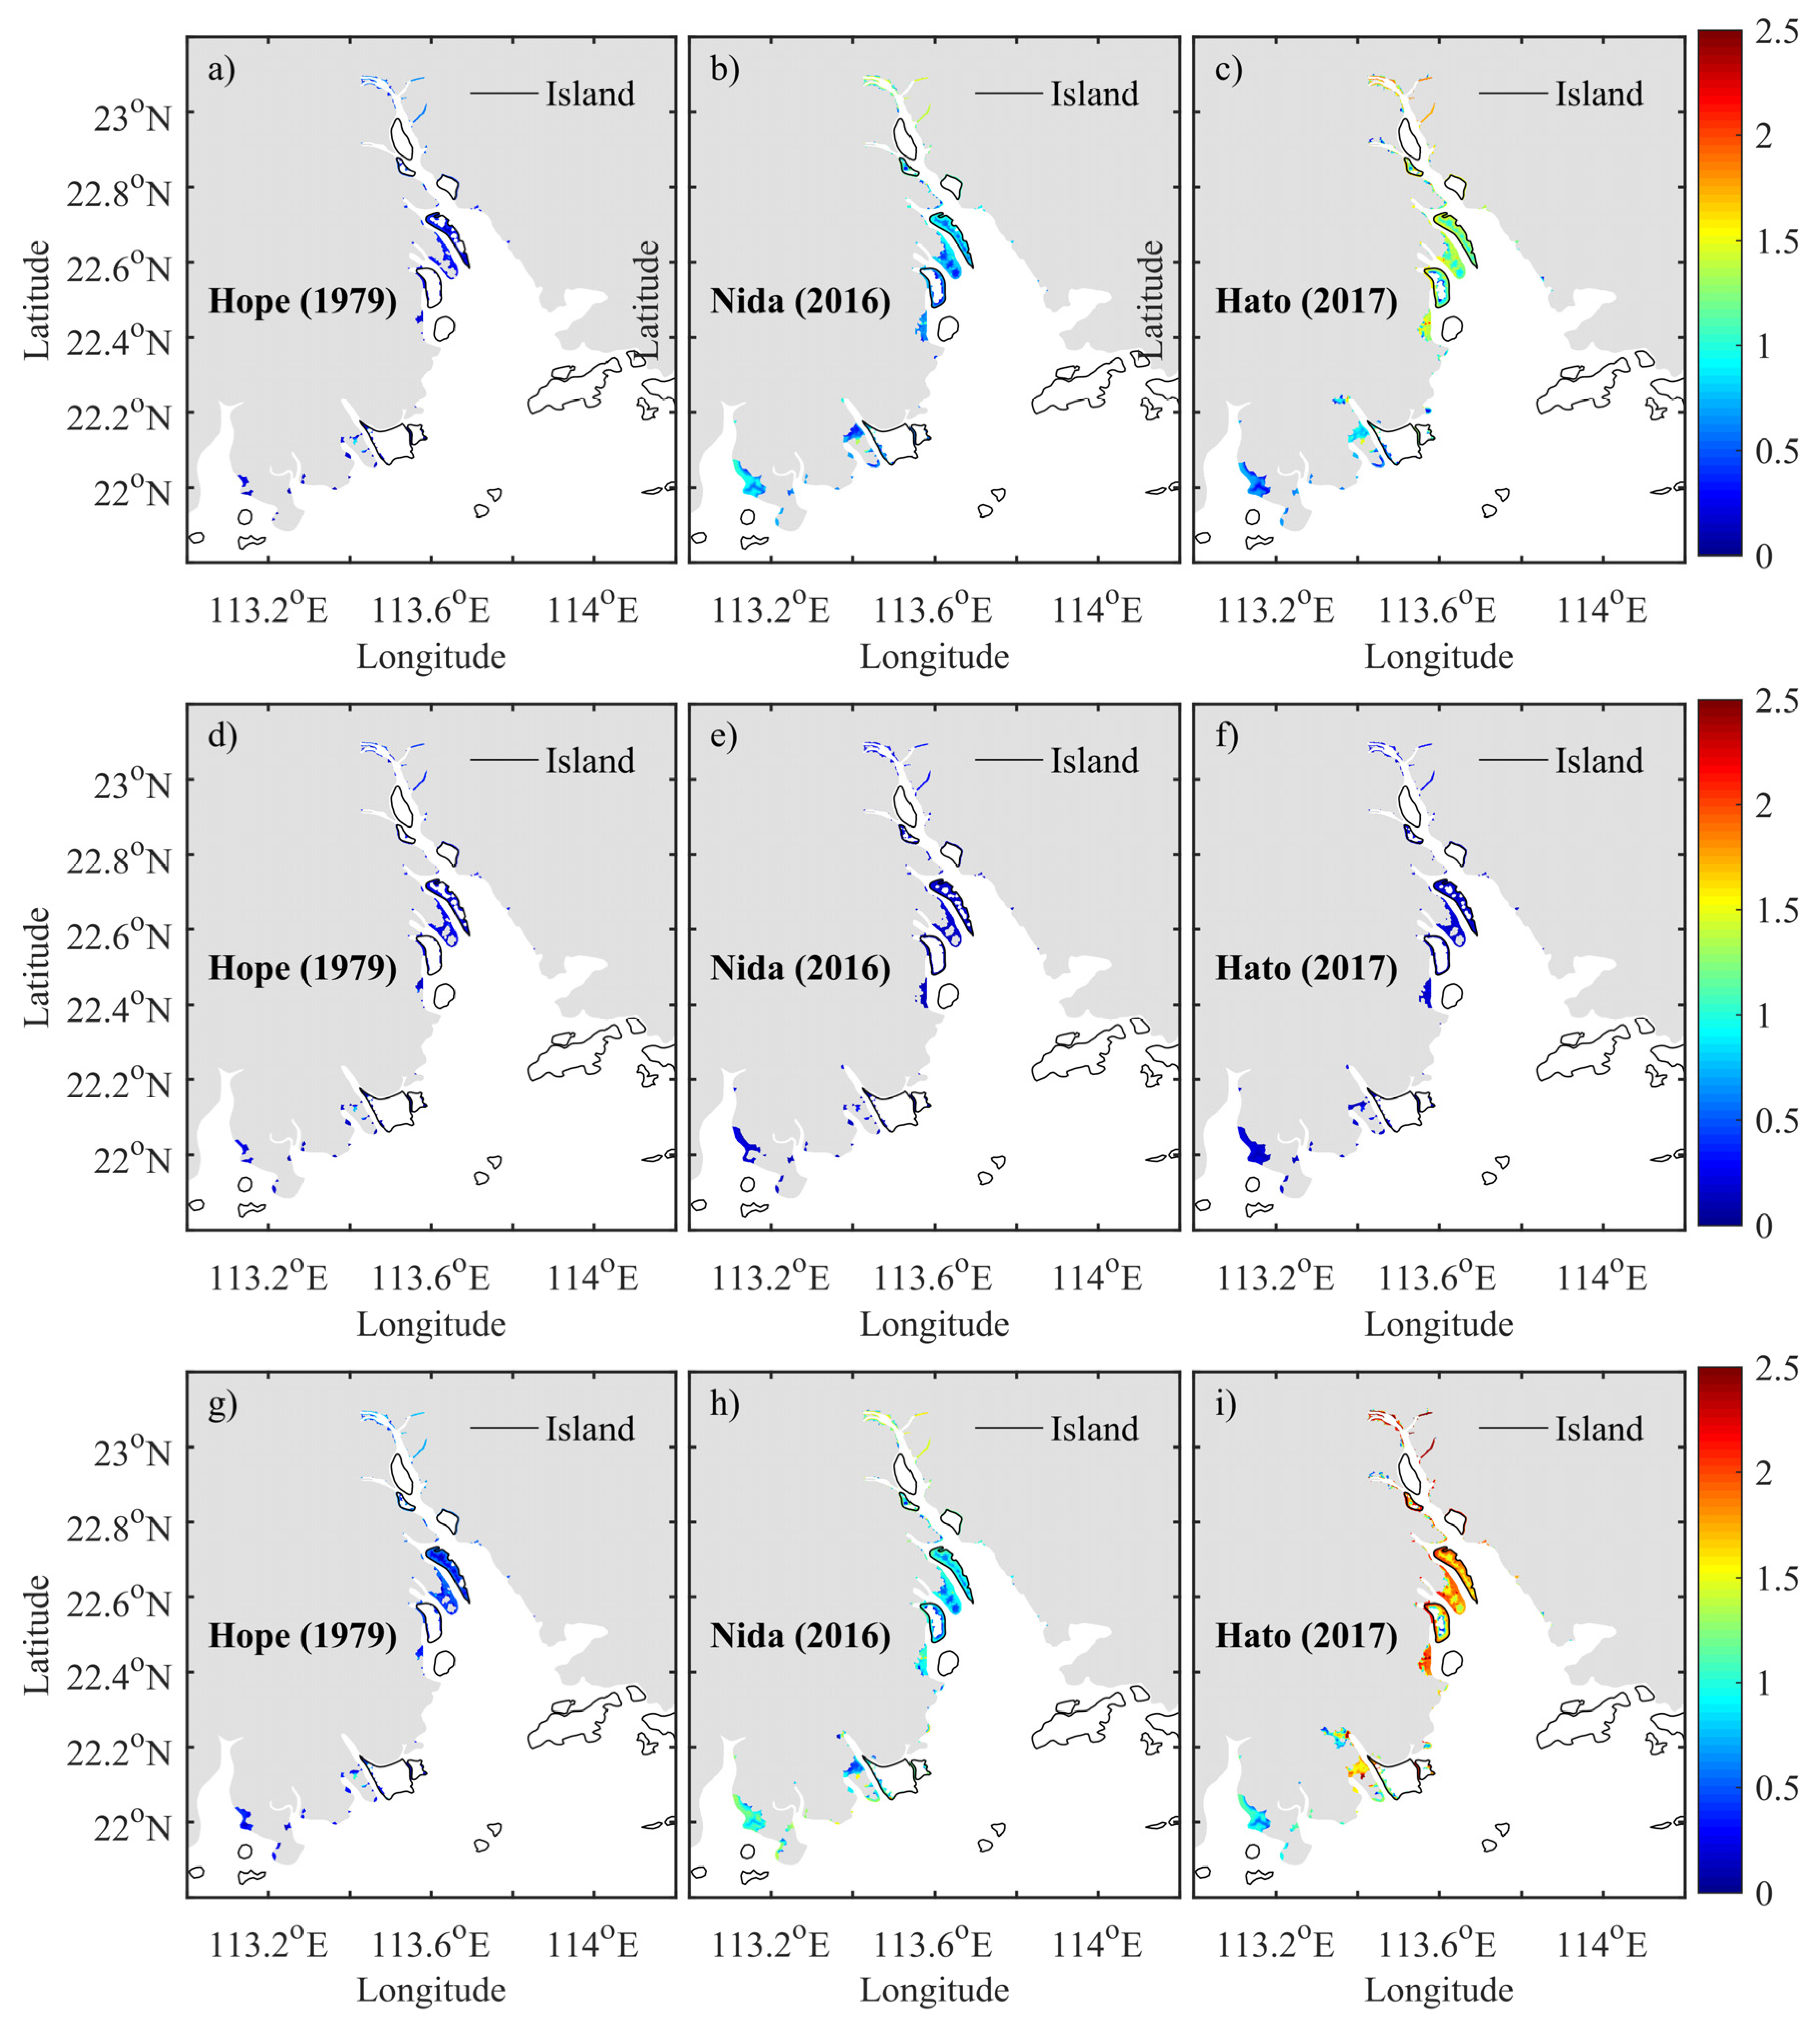
As we all know, inundation occurs when the water level is higher than the land elevation. The simulated inundations were compared to evaluate the effects of the different forcing fields on coastal inundation. The variations in the inundation areas caused by the different forcing fields are shown in Figure 7. The curves in Figure 7 look like parabolas that open downward. Figure 8 shows the inundation maps of the three typhoons. Figure 8a–c shows the inundation induced by only wind forcing; Figure 8d–f shows the inundation induced by only pressure forcing; and Figure 8g–i shows the inundation induced by wind-pressure forcing. In Figure 7a, the downward opening and the elevation of the black curve are larger than those of the other two curves. This indicates that the wind-pressure forcing of the Typhoon Hope generated the largest inundation extent and the longest inundation duration in the PRE. According to the shaded region in Figure 8a,d,g, the wind-pressure forcing of Typhoon Hope caused the deepest inundation in the PRE, while pressure forcing caused the shallowest inundation. The blue curve in Figure 7a has the lowest elevation of the three curves, indicating that pressure forcing generated the smallest inundation area among the three forcing fields. These descriptions also apply to the inundations of the Typhoon Nida and Typhoon Hato (Figure 7b,c). The effective contribution of the wind forcing field to the coastal inundation area is 84.2% on average, while that of the pressure forcing field is 25.4%. Therefore, the coastal inundation was mainly generated by wind forcing. Moreover, the sum of the inundation area and depth induced by only pressure forcing plus the inundation area and depth induced by only wind forcing is deeper than that induced by wind-pressure forcing. In other words, the effects of pressure forcing and wind forcing on inundation are not a simple linear superposition, but rather a nonlinear interaction between them. Notably, these conclusions are similar to the experiments conducted to determine the sensitivity of storm surges to the various forcing fields. That is, the sensitivities of the storm surges and coastal inundation to meteorological forcing fields are the same in the PRE.

3.2.2. Different Typhoon Paths

Typhoon Nida landed on the east side of the PRE (Shenzhen City, Guangdong) and moved northwest, crossing the inner Lingding Bay. Typhoon Hope crossed the central part of Lingding Bay from east to west. When Typhoon Nida moved from Shenzhen to Guangzhou, its typhoon scale was lower than that of Typhoon Hope (see the typhoon scale in Figure 4a). But in some parts of the PRE, the maximum storm surges generated by Nida were larger than those generated by Hope (Figure 6a,b). This is because during the period when the center of Hope crossed the PRE from east to west, the PRE region experienced both offshore wind and offshore wind. The effects of these two winds on the water partially offset each other, resulting in the storm surge caused by Hope being less severe than expected, but similar to that caused by Nida. Although the storm surges generated by these two typhoons are similar, the coastal inundations they caused are quite different. For example, the storm surge caused by Nida was only 0.25 m higher than that caused by Hope (Figure 6a,b) in the Nansha District, Guangzhou City, while the coastal inundation extent caused by Nida was quite serious (Figure 7a,b and Figure 8g,h). By examining the landing times of typhoons Hope and Nida, we conclude that this phenomenon was caused by the different astronomical tides. For storm surges of the same height, the larger the astronomical tide level, the more serious the inundation. When Nida reached the PRE, it encountered the largest astronomical tide level, but Typhoon Hope did not. Thus, the basic factor determining the inundation of the coast was the total water level (tidal stage + storm surge) during the typhoon, not the storm surges.
Furthermore, the path of Typhoon Hato did not cross the Lingding Bay, but landed in Zhuhai City. This path creates a small angle between the route and the coastline, which puts the cities along the PRE on the more dangerous side of the typhoon. The wind on the right side of the typhoon path blows toward the inner Lingding Bay before landing. Because it had the heaviest wind and the lowest central pressure, Typhoon Hato caused the most severe storm surges throughout the entire PRE (comparing the black lines in Figure 6a–c). However, Typhoon Hato just met the largest astronomical tide when landing. This resulted in Typhoon Hato having the longest inundation duration and the deepest inundation depth. As shown in the gray shaded area in Figure 6c, the duration of Hato caused an inundation area of greater than 150 km2 (about 40,000 standard football fields) in 16 hours. Figure 8i shows that the inundation depth of Hato was greater than 2.5 m. In conclusion, the sensitivities of the storm surge and coastal inundation to the typhoon’s path are different. This is determined by the angle between the typhoon path and the coastline, the astronomical tide level, and the typhoon’s scale.

3.2.3. Moving Speed of Typhoon Center

According to the conclusions of the previous sections, the coastal inundation caused by Typhoon Hato was the most severe of the three typhoons (Hope, Nida, and Hato). In order to model clear and intuitive storm surges and coastal inundations, taking Typhoon Hato (2017) as an example, the sensitivities of storm surges and coastal inundations to the moving speed of the typhoon center were analyzed. As was mentioned in Section 2.2, the newly constructed Hato1, Hato2, and Hato3 paths were used to simulate the storm surges and inundations.
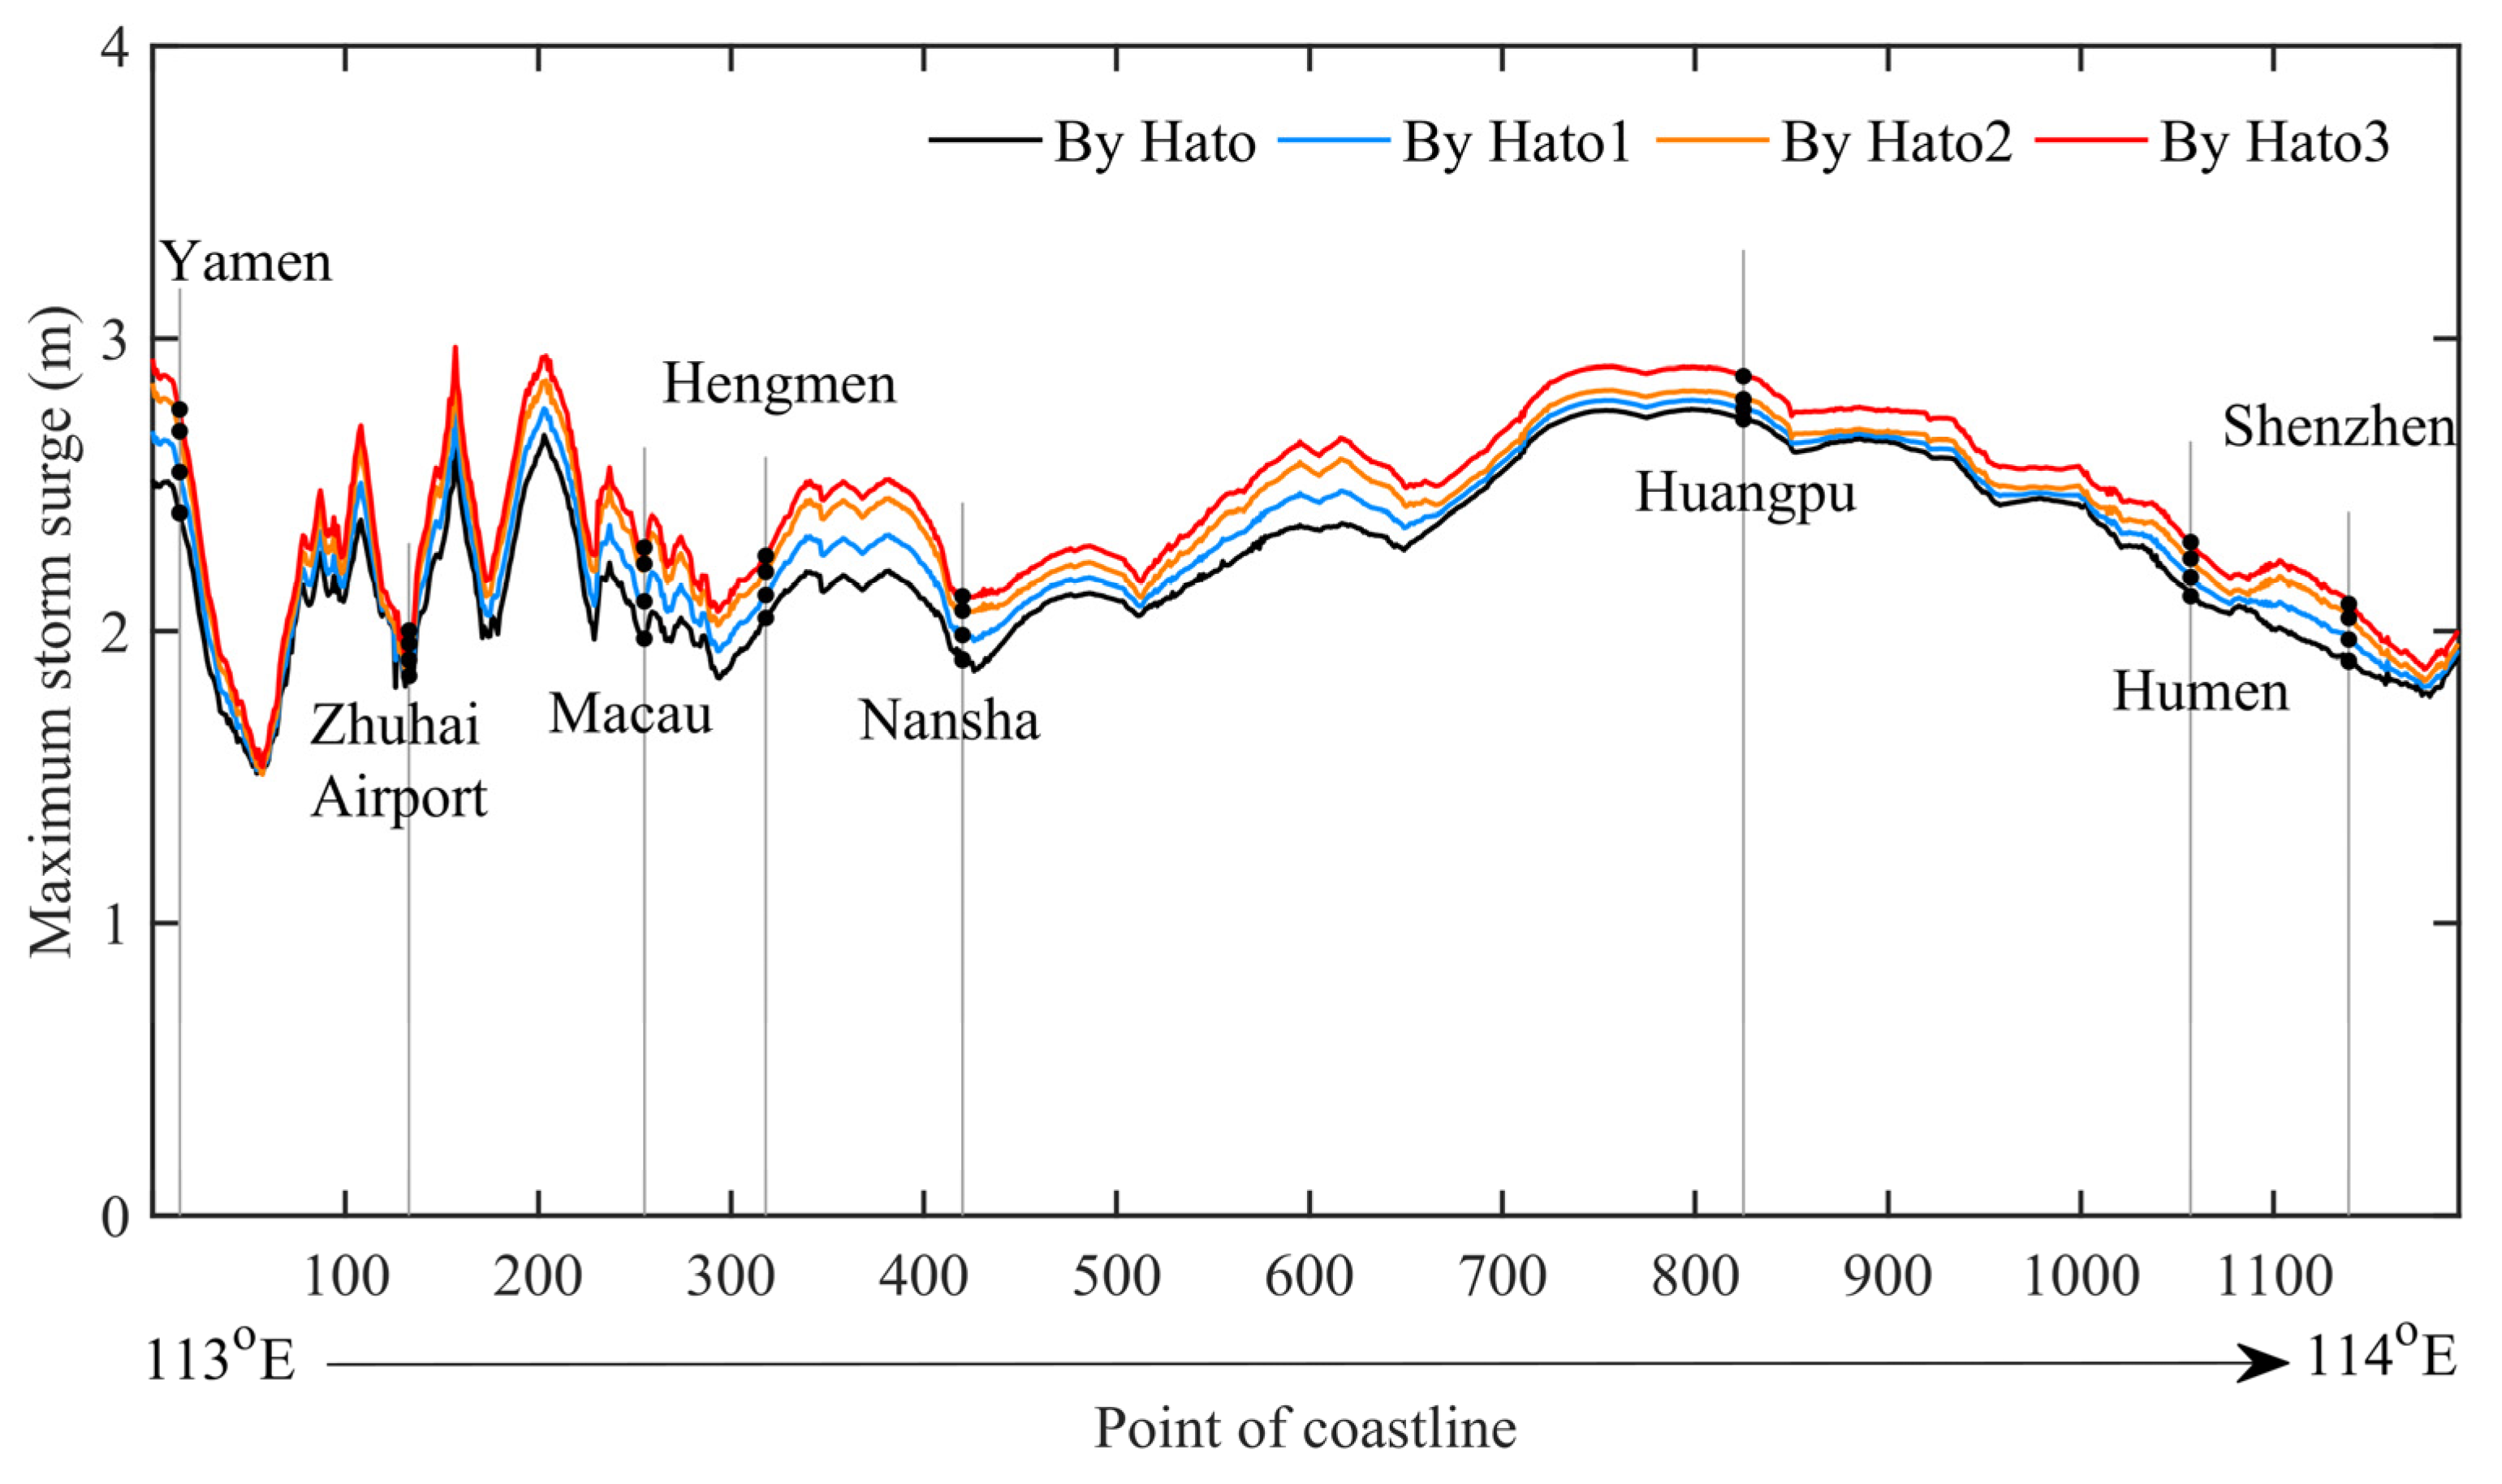
Figure 9 shows the model results for the maximum storm surge generated by the newly constructed typhoons. The maximum storm surge along the PRE increases with decreasing central moving speed (Figure 9). When the moving speed of the typhoon center decreases by 5 km/h, the maximum storm surge increases averagely by 0.06 m (2.79%) or the maximum increases by 0.16 m (6.75%). That is to say, the average and maximum increases in the maximum storm surge are less than 0.5 m when the central moving speed of the typhoon decreases from 30 km/h (Hato) to 15 km/h (Hato3). This indicates that although the moving speed of the typhoon center does affect the storm surges in the PRE, the effect is not significant.
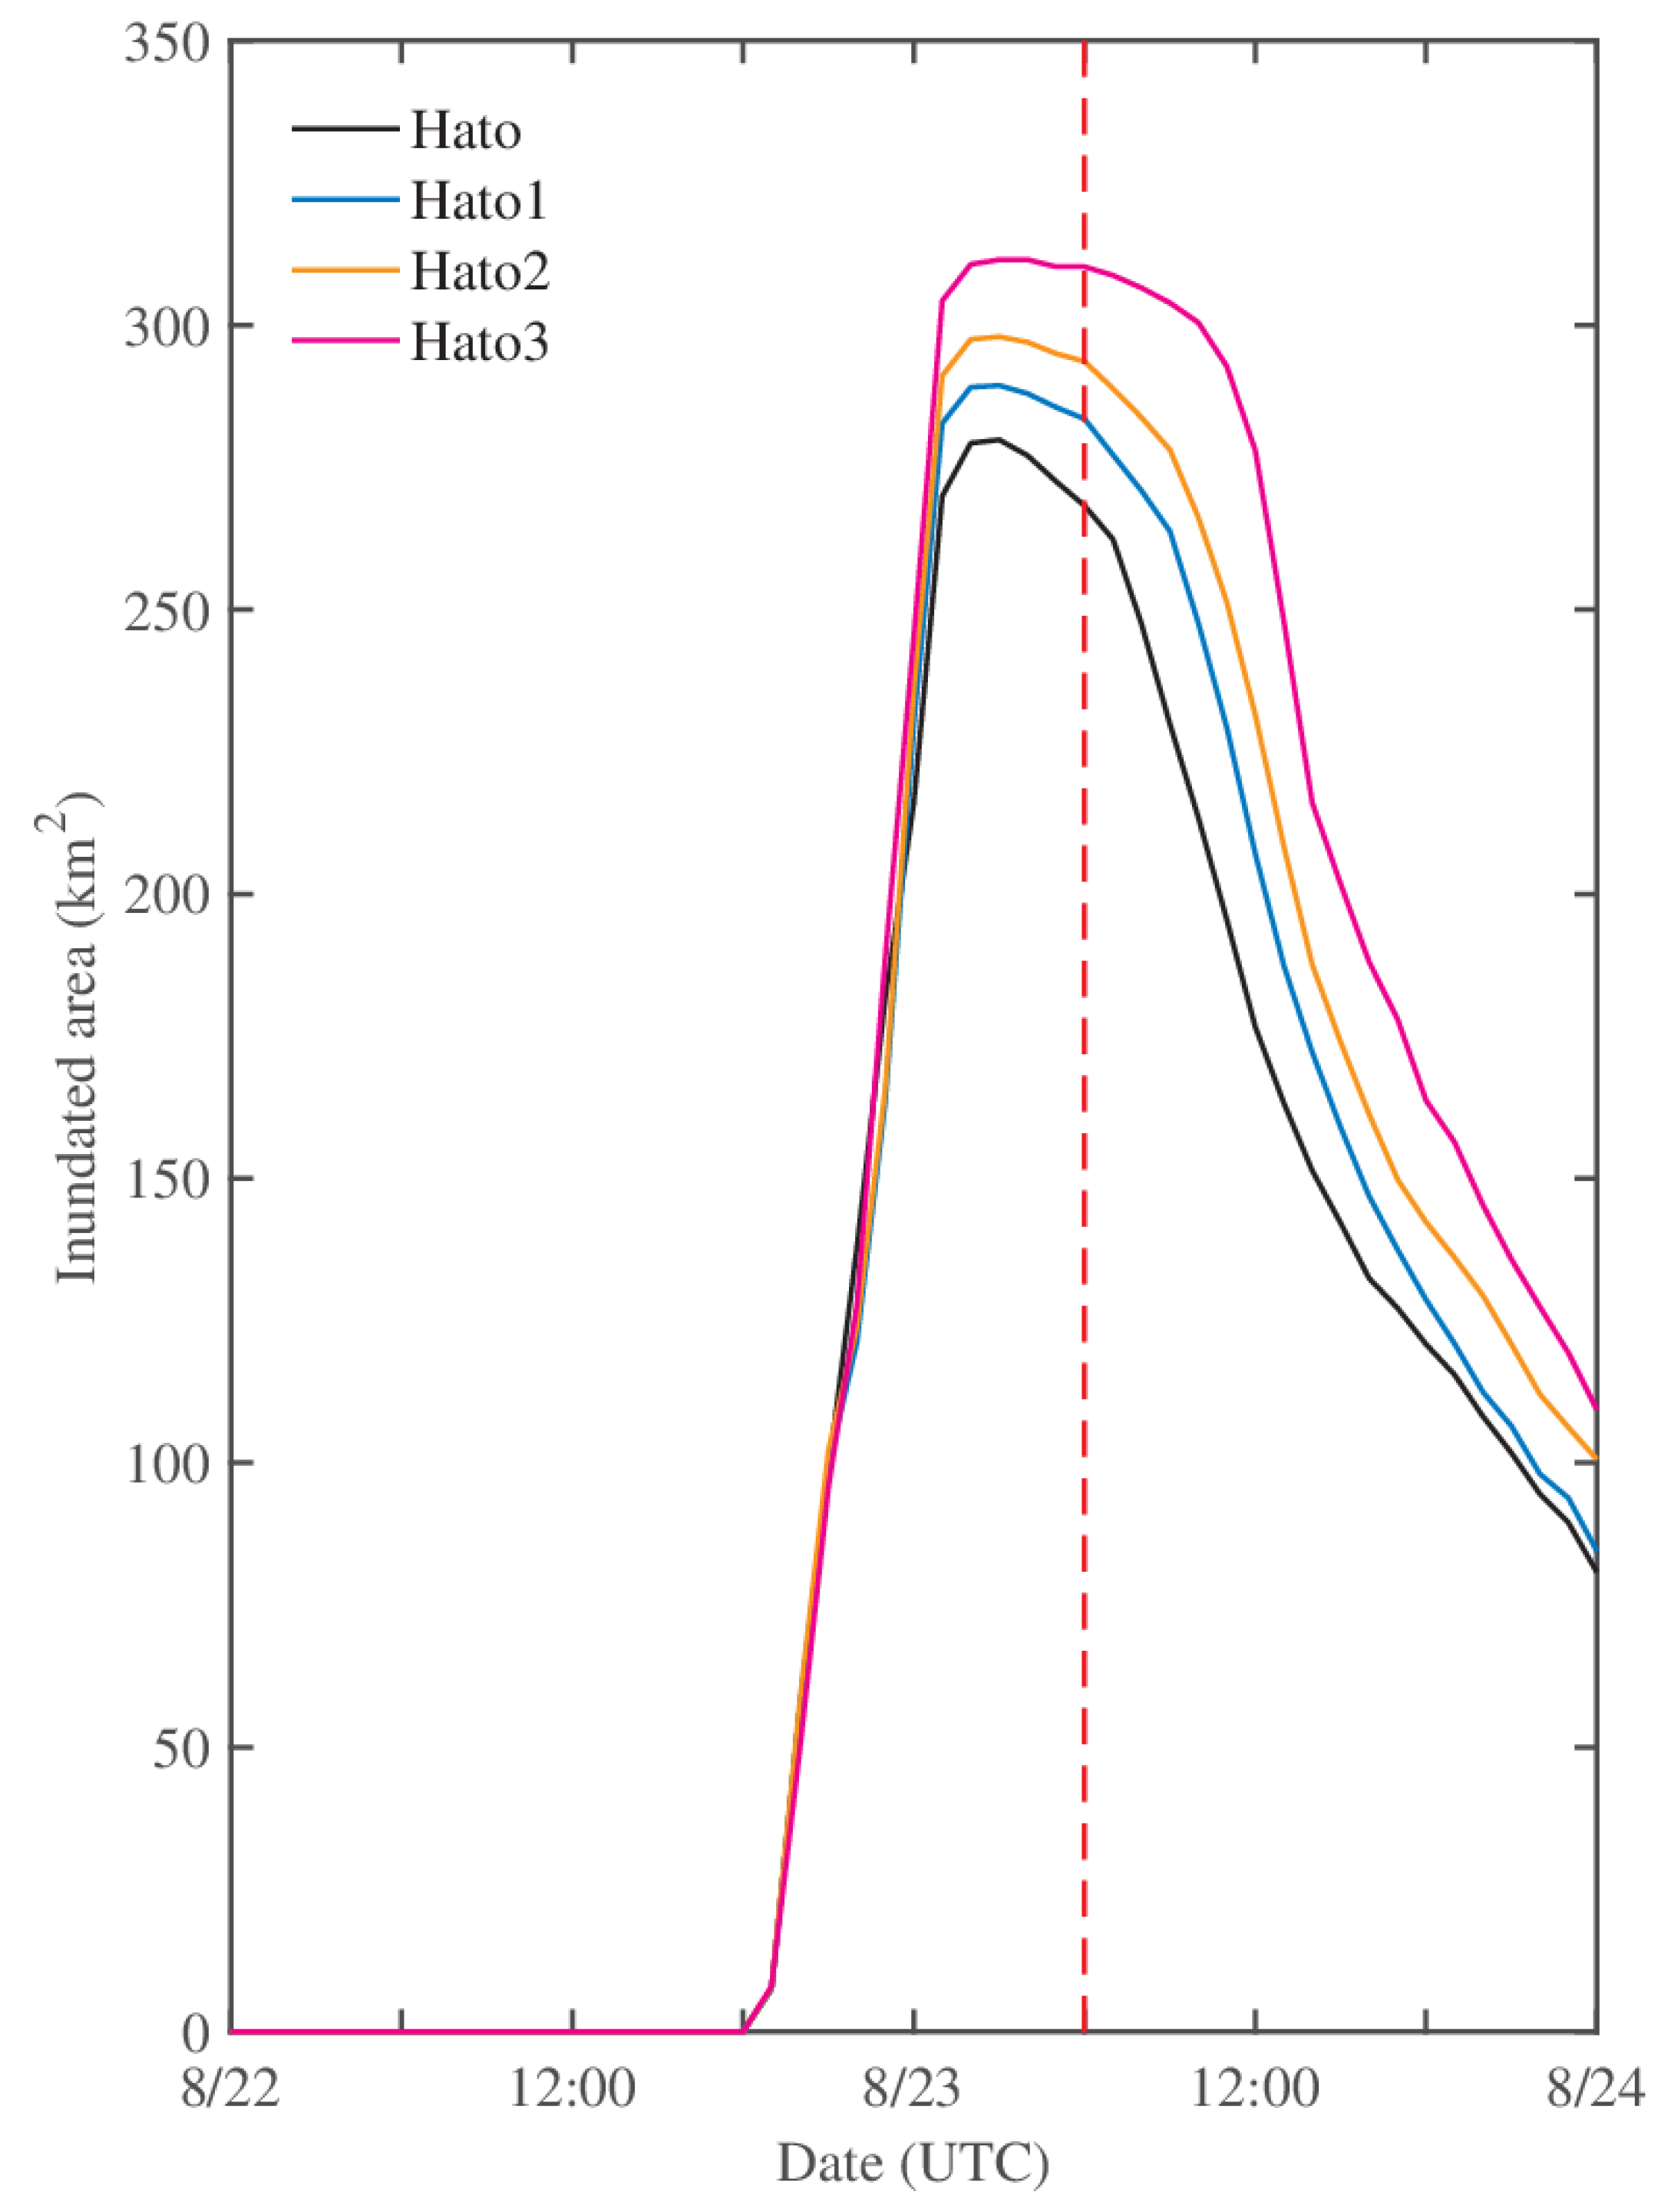
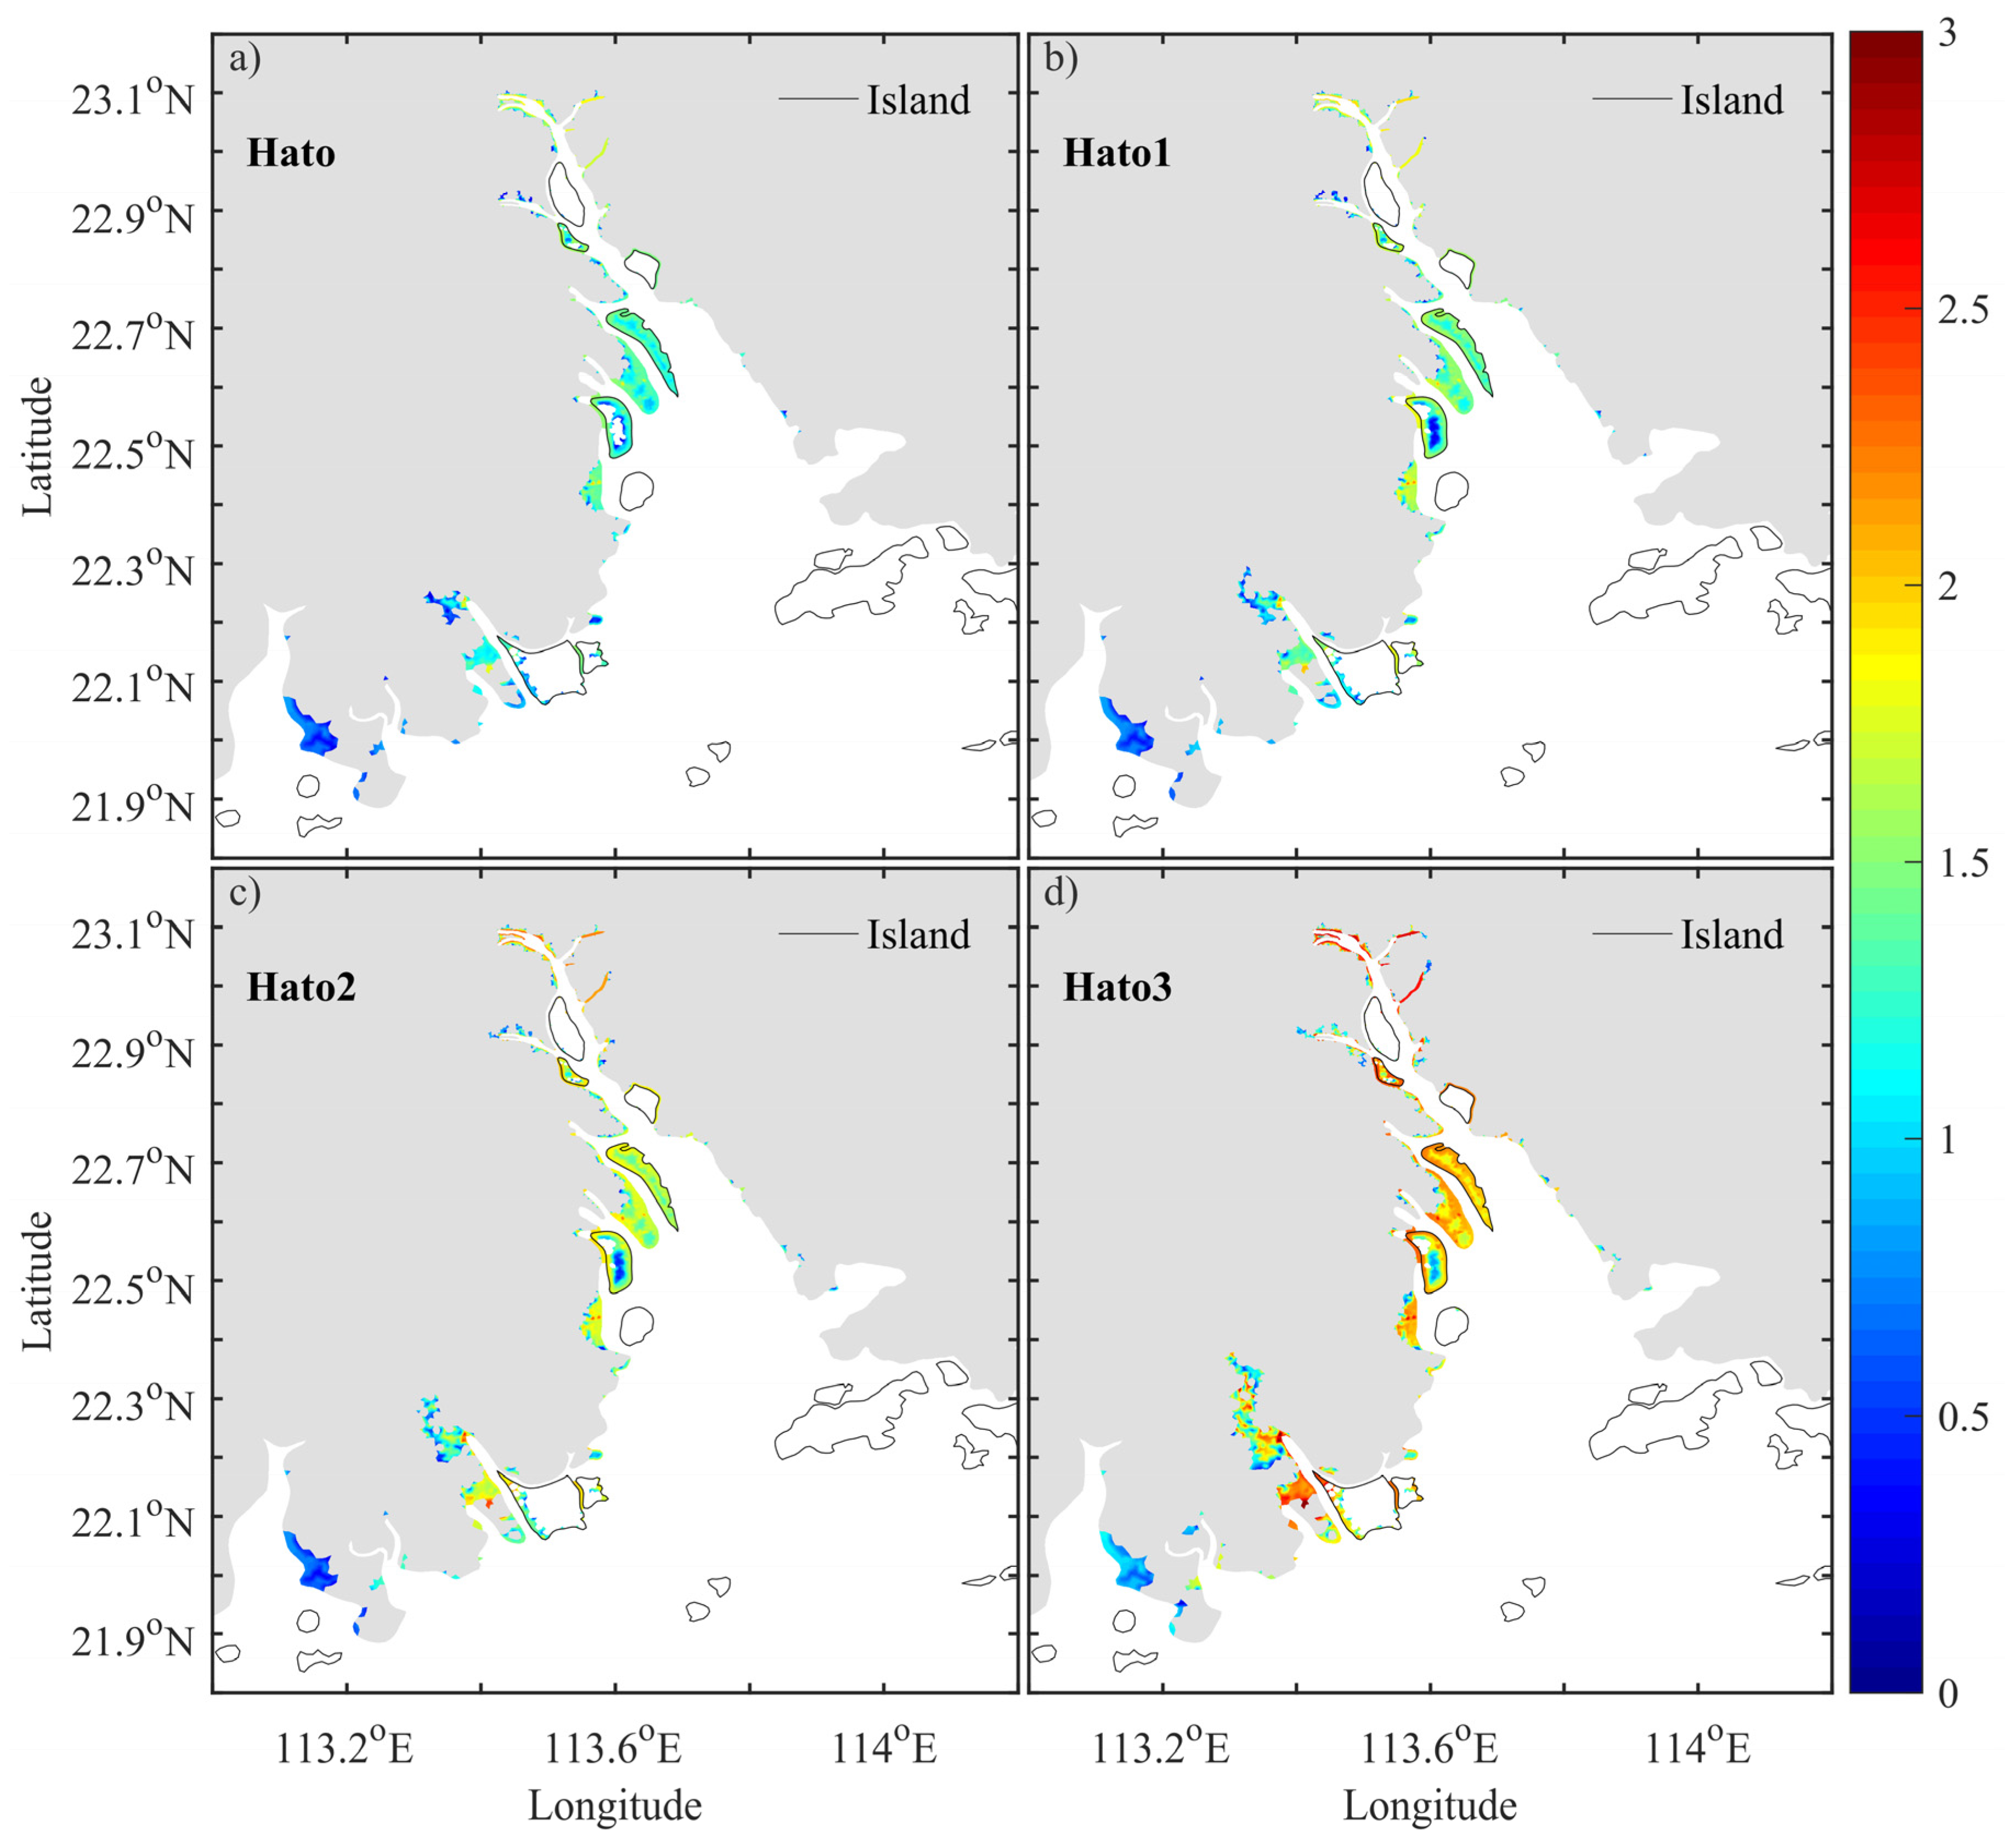
The curves of variations in the inundation area form a parabola that opens downward (Figure 10). According to the position of the dotted line in Figure 10, during typhoon processes, the inundation area reaches the peak value (and the last for a while) before the typhoon lands, but it gradually decreases after the typhoon lands. By comparing the size of the downward opening curves, we conclude that the slower the speed of the typhoon’s center, the longer the inundation duration. Therefore, Hato3 has the longest inundation duration of the four typhoons (Hato, Hato1, Hato2, and Hato3). Figure 11 shows a map of the inundations caused by Hato and the three newly constructed paths. The inundations include all of the areas inundated during the typhoon process, regardless of the length of the inundation duration. Based on the colored fields in Figure 11b–d, when the moving speed of the typhoon center is 25 km/h, 20 km/h, and 15 km/h, the inundation extents and depths on the west side of the PRE are larger than those of Typhoon Hato. For example, some areas that were not inundated originally are inundated when the moving speed of the typhoon center is lower. All of these results demonstrate that slower moving typhoons generate inundations with longer durations, larger extents, and deeper depths. This greatly increases the risk to the coastal cities in the PRE. In summary, the simulation results show that the sensitivities of the storm surges and inundations to the moving speeds of the typhoon’s center differ, and the coastal inundation is more sensitive.

4. Conclusions

In this study, we established a regional scale coastal inundation system in the PRE. The meteorological forcing field of the system was obtained using an assimilation typhoon model, which consists of an analysis dataset and the Holland typhoon model. However, the numerical hydrodynamic model of the system was the coupled ADCIRC + SWAN model, which can produce high-resolution simulations of the PRE. Satellite images provided the analysis data for the background wind-pressure field and the topography of the coastal inundation system, which improved the accuracy of the coastal inundation system to a certain extent. Comparison of the simulations and field observations indicates a relative error of less than 10% in the simulated water level, storm surges, and significant wave heights, demonstrating that the coupled ADCIRC + SWAN model can satisfactorily reproduce the hydrodynamic features induced by typhoons. In addition, the simulation results accurately reflect the coastal inundation caused by the increase in the water level during a typhoon.
Based on the verified system, we investigated the sensitivities of storm surges and coastal inundations to the meteorological forcing fields, the typhoon paths, and moving speeds of the typhoon center in the PRE using several sets of idealized numerical experiments. First, the contribution of the pressure forcing to the storm surge and coastal inundation is very small (less than 30%) in the PRE. Second, the position of the typhoon’s path relative to the PRE significantly affects the storm surges and coastal inundation in this area. Notably, the intensity of the storm surges does not fully reflect the intensity of the coastal inundation. This is because the determinant of coastal inundation is the total water level, not storm surge. Even if the storm surge induced by the typhoon is small, it may cause serious inundations during a high tidal stage. Third, the moving speed of the typhoon center has different effects on the storm surges and coastal inundation. The maximum increase in the storm surge was less than 0.5 m as the moving speed of the typhoon center decreased from 30 km/h to 15 km/h. However, the change in the coastal inundation was significant. Not only the inundation area and depth increase, but the inundation duration also increases. According to the results of our experiments, Hato3 is the most likely to cause destructive storm surges and coastal inundation in the PRE.
The results of this study provide an effective reference for marine disaster forecasting. The coastal inundation system constructed here provides an effective method for the government to simulate storm surges and coastal inundation. When typhoons occur, it is beneficial for government departments to carry out disaster prevention and mitigation work. The system developed in this study can also be used by marine monitoring departments to forecast storm surges and coastal inundation. However, more accurate bathymetric and topographic data are still needed to make the actual application of the coastal inundation system more accurate. It should also be noted that the effect of the rate of sea-level rise on storm surges and coastal inundation is not considered in the numerical model simulation, but relevant research will be conducted on this topic in a future study.

Author Contributions

Conceptualization, M.D. and K.W.; Data curation, M.D.; Formal analysis, M.D.; Funding acquisition, Y.H. and P.H.; Investigation, M.D.; Methodology, M.D. and K.W.; Project administration, Y.H. and P.H.; Software, M.D.; Supervision, Y.H. and P.H.; Validation, M.D.; Visualization, M.D.; Writing—original draft, M.D.; Writing—review & editing, M.D. All authors have read and agreed to the published version of the manuscript.

Funding

This research was funded by the Strategic Priority Research Program of the Chinese Academy of Sciences (Nos. XDA19060202 and 19060502), National Key Research and Development Program of China (Nos. 2016YFC1402000 and 2018YFC1407003), and National Natural Science Foundation of China (Nos. U1606402 and 41421005).

Acknowledgments

The authors appreciate four anonymous reviewers for their valuable suggestions and are also thankful to those public platforms for providing the data listed in Section 2. The authors are thankful to ADCIRC Development Group for developing the model. The authors are grateful to Shenzhen Ocean Monitor and Forecast Center for providing datasets and the High-Performance Computing Center, Institution of Oceanology, CAS.

Conflicts of Interest

The authors declare no conflict of interest.

References

  1. Yu, F.; Dong, J.; Ye, L.; Hou, J.; Li, M.; Liu, S.; Wu, S.; Liu, Q.; Fu, X.; Fu, C.; et al. Collection of Storm Surge Disasters Historical Data in China (1949–2009); China Ocean Press: Beijing, China, 2015. [Google Scholar]
  2. Ministry of Natural Resources of the People’s Republic of China. China Marine Disaster Bulletin in 2016. Available online: http://gc.mnr.gov.cn/201806/t20180619_1798020.html (accessed on 22 March 2018).
  3. Ministry of Natural Resources of the People’s Republic of China. China Marine Disaster Bulletin in 2017. Available online: http://gc.mnr.gov.cn/201806/t20180619_1798021.html (accessed on 22 March 2018).
  4. Chen, X.; Zhang, X.; Church, J.A.; Watson, C.S.; King, M.A.; Monselesan, D.; Legresy, B.; Harig, C. The increasing rate of global mean sea–level rise during 1993–2014. Nat. Clim. Chang. 2017, 7, 492–495. [Google Scholar] [CrossRef]
  5. Emanuel, K.A. Downscaling CMIP5 climate models shows increased tropical cyclone activity over the 21st century. Proc. Natl. Acad. Sci. USA 2013, 110, 12219–12224. [Google Scholar] [CrossRef] [PubMed] [Green Version]
  6. Guan, S.; Li, S.; Hou, Y.; Hu, P.; Liu, Z.; Feng, J. Increasing threat of landfalling typhoons in the western north pacific between 1974 and 2013. Int. J. Appl. Earth Obs. Geoinf. 2018, 68, 279–286. [Google Scholar] [CrossRef]
  7. Hallegatte, S.; Green, C.; Nicholls, R.J.; Corfee–Morlot, J. Future flood losses in major coastal cities. Nat. Clim. Chang. 2013, 3, 802–806. [Google Scholar] [CrossRef]
  8. Sweet, W.V.; Kopp, R.E.; Weaver, C.P.; Obeysekera, J.; Horton, R.M.; Thieler, E.R.; Zervas, C. Global and Regional Sea Level Rise Scenarios for the United States (NOAA Technical Report NOS CO–OPS 083); Washington, DC, 2017. Available online: https://ntrs.nasa.gov/archive/nasa/casi.ntrs.nasa.gov/20180001857.pdf (accessed on 23 February 2020).
  9. Qi, P.; Du, M. Multi–factor evaluation indicator method for the risk assessment of atmospheric and oceanic hazard group due to the attack of tropical cyclones. Int. J. Appl. Earth Obs. Geoinf. 2018, 68, 1–7. [Google Scholar] [CrossRef]
  10. Bukvic, A.; Rohat, G.; Apotsos, A.; de Sherbinin, A. A Systematic Review of Coastal Vulnerability Mapping. Sustainability 2020, 12, 2822. [Google Scholar] [CrossRef] [Green Version]
  11. Dedekorkut–Howes, A.; Torabi, E.; Howes, M. When the tide gets high: A review of adaptive responses to sea level rise and coastal flooding. J. Environ. Plan. Manag. 2020, 1–42. [Google Scholar] [CrossRef]
  12. Wang, H.; Loftis, J.; Liu, Z.; Forrest, D.; Zhang, J. The Storm Surge and Sub–Grid Inundation Modeling in New York City during Hurricane Sandy. J. Mar. Sci. Eng. 2014, 2, 226–246. [Google Scholar] [CrossRef] [Green Version]
  13. Yin, J.; Lin, N.; Yu, D. Coupled modeling of storm surge and coastal inundation: A case study in New York City during Hurricane Sandy. Water Resour. Res. 2016, 52, 8685–8699. [Google Scholar] [CrossRef]
  14. Dietrich, J.C.; Bunya, S.; Westerink, J.J.; Ebersole, B.A.; Smith, J.M.; Atkinson, J.H.; Jensen, R.; Resio, D.T.; Luettich, R.A.; Dawson, C.; et al. A high–resolution coupled riverine flow, tide, wind, wind wave, and storm surge model for southern Louisiana and Mississippi. Part II: Synoptic description and analysis of Hurricanes Katrina and Rita. Mon. Weather Rev. 2010, 138, 378–404. [Google Scholar] [CrossRef] [Green Version]
  15. Sheng, Y.P.; Zhang, Y.; Paramygin, V.A. Simulation of storm surge, wave, and coastal inundation in the northeastern Gulf of Mexico region during hurricane Ivan in 2004. Ocean Model. 2010, 35, 314–331. [Google Scholar] [CrossRef]
  16. Bilskie, M.V.; Hagen, S.C.; Medeiros, S.C.; Cox, A.T.; Salisbury, M.; Coggin, D. Data and numerical analysis of astronomic tides, wind-waves, and hurricane storm surge along the northern Gulf of Mexico. J. Geophys. Res. Ocean. 2016, 121, 3625–3658. [Google Scholar] [CrossRef]
  17. Bhaskaran, P.K.; Gayathri, R.; Murty, P.L.N.; Bonthu, S.R.; Sen, D. A numerical study of coastal inundation and its validation for Thane cyclone in the Bay of Bengal. Coast. Eng. 2014, 83, 108–118. [Google Scholar] [CrossRef]
  18. Bhaskaran, P.K.; Nayak, S.; Bonthu, S.R.; Murty, P.N.; Sen, D. Performance and validation of a coupled parallel ADCIRC–SWAN model for THANE cyclone in the Bay of Bengal. Environ. Fluid Mech. 2013, 13. [Google Scholar] [CrossRef]
  19. Gayathri, R.; Bhaskaran, P.K.; Sen, D. Numerical study on storm surge and associated coastal inundation for 2009 AILA cyclone in the Head Bay of Bengal. Aquat. Procedia 2015, 4, 404–411. [Google Scholar] [CrossRef]
  20. Yin, J.; Yin, Z.E.; Hu, X.M.; Xu, S.Y.; Wang, J.; Li, Z.H.; Zhong, H.D.; Gan, F.B. Multiple scenario analyses forecasting the confounding impacts of sea level rise and tides from storm induced coastal flooding in the city of Shanghai, China. Environ. Earth Sci. 2011, 63, 407–414. [Google Scholar] [CrossRef]
  21. Pan, Z.; Liu, H. Extreme storm surge induced coastal inundation in Yangtze Estuary regions. J. Hydrodyn. 2019, 31, 1127–1138. [Google Scholar] [CrossRef]
  22. Wang, K.; Hou, Y.; Li, S.; Du, M.; Li, R. Numerical Study of Storm Surge Inundation in the Southwestern Hangzhou Bay Region During Typhoon Chan–Hom in 2015. J. Ocean Univ. China 2020, 19, 263–271. [Google Scholar] [CrossRef]
  23. Li, L.; Yang, J.; Lin, C.Y.; Chua, C.T.; Wang, Y.; Zhao, K.; Wu, Y.T.; Liu, P.L.; Switzer, A.D.; Mok, K.M.; et al. Field survey of Typhoon Hato (2017) and a comparison with storm surge modeling in Macau. Nat. Hazards Earth Syst. Sci. 2018, 18, 3167–3178. [Google Scholar] [CrossRef] [Green Version]
  24. Yang, J.; Li, L.; Zhao, K.; Wang, P.; Wang, D.; Sou, I.M.; Yang, Z.; Hu, J.; Tang, X.; Mok, K.M.; et al. A Comparative Study of Typhoon Hato (2017) and Typhoon Mangkhut (2018)—Their Impacts on Coastal Inundation in Macau. J. Geophys. Res. Ocean. 2019. [Google Scholar] [CrossRef]
  25. Yin, K.; Xu, S.; Huang, W.; Xie, Y. Effects of sea level rise and typhoon intensity on storm surge and waves in Pearl River Estuary. Ocean Eng. 2017, 136, 80–93. [Google Scholar] [CrossRef]
  26. Li, J.; Hou, Y.; Mo, D.; Liu, Q.; Zhang, Y. Influence of Tropical Cyclone Intensity and Size on Storm Surge in the Northern East China Sea. Remote Sens. 2019, 11, 3033. [Google Scholar] [CrossRef] [Green Version]
  27. Li, A.; Guan, S.; Mo, D.; Hou, Y.; Hong, X.; Liu, Z. Modeling wave effects on storm surge from different typhoon intensities and sizes in the South China Sea. Estuar. Coast. Shelf Sci. 2020, 235, 106551. [Google Scholar] [CrossRef]
  28. Du, M.; Hou, Y.; Qi, P.; Wang, K. The impact of different historical typhoon tracks on storm surge: A case study of Zhejiang, China. J. Mar. Syst. 2020, 103318. [Google Scholar] [CrossRef]
  29. Feng, X.; Yin, B.; Yang, D. Effect of hurricane paths on storm surge response at Tianjin, china. Estuar. Coast. Shelf Sci. 2012, 106. [Google Scholar] [CrossRef]
  30. Lin, N.; Emanuel, K.A.; Smith, J.A.; Vanmarcke, E. Risk assessment of hurricane storm surge for new york city. J. Geophys. Res. Atmos. 2010, 115. [Google Scholar] [CrossRef] [Green Version]
  31. Wang, Y.; Mao, X.; Jiang, W. Long–term hazard analysis of destructive storm surges using the ADCIRC–SWAN model: A case study of Bohai Sea, China. Int. J. Appl. Earth Obs. Geoinf. 2018, 73, 52–62. [Google Scholar] [CrossRef]
  32. Wang, K.; Hou, Y.; Li, S.; Du, M.; Chen, J.; Lu, J. A comparative study of storm surge and wave setup in the East China Sea between two severe weather events. Estuar. Coast. Shelf Sci. 2020. [Google Scholar] [CrossRef]
  33. Holland, G. An analytic model of the wind and pressure profiles in hurricanes. Mon. Weather Rev. 1980, 108, 1212–1218. [Google Scholar] [CrossRef]
  34. Jelesnianski, C.P. A numerical computation of storm tides induced by a tropical storm impinging on a continental shelf. Mon. Weather Rev. 1965, 93, 343–358. [Google Scholar] [CrossRef] [Green Version]
  35. Wang, X.; Qian, C.; Wang, W.; Yan, T. An elliptical wind field model of typhoons. J. Ocean Univ. China 2004, 3, 33–39. [Google Scholar] [CrossRef]
  36. Xie, L.; Bao, S.; Pietrafesa, L.J.; Foley, K.; Fuentes, M. A real–time hurricane surface wind forecasting model: Formulation and verification. Mon. Weather Rev. 2006, 134, 1355–1370. [Google Scholar] [CrossRef]
  37. Luettich, R.A., Jr.; Westerink, J.J.; Scheffner, N.W. ADCIRC: An Advanced Three–Dimensional Circulation Model for Shelves, Coasts, and Estuaries. Report 1. Theory and Methodology of ADCIRC–2DDI and ADCIRC–3DL (No. CERC–TR–DRP–92–6). Coastal Engineering Research Center Vicksburg MS. 1992. Available online: https://babel.hathitrust.org/cgi/pt?id=uc1.31210025019819&view=1up&seq=1 (accessed on 27 February 2020).
  38. Westerink, J.J.; Luettich, R.A., Jr.; Blain, C.A.; Scheffner, N.W. ADCIRC: An Advanced Three–Dimensional Circulation Model for Shelves, Coasts, and Estuaries. Report 2. User’s Manual for ADCIRC–2DDI (No. WES/TR/DRP–92–6–2). Army Engineer Waterways Experiment Station Vicksburg MS. 1994. Available online: https://babel.hathitrust.org/cgi/pt?id=uc1.31210018603462&view=1up&seq=7 (accessed on 3 March 2020).
  39. Suh, S.W.; Lee, H.Y.; Kim, H.J. Spatio–temporal variability of tidal asymmetry due to multiple coastal constructions along the west coast of Korea. Estuar. Coast. Shelf Sci. 2014, 151, 336–346. [Google Scholar] [CrossRef]
  40. Booij, N.; Ris, R.; Holthuijsen, L. A third–generation wave model for coastal regions: 1: Model description and validation. J. Geophys. Res. Ocean. 1999, 104, 7649–7666. [Google Scholar] [CrossRef] [Green Version]
  41. Ris, R.; Booij, N.; Holthuijsen, L. A third–generation wave model for coastal regions, 2. verification. J. Geophys. Res. Ocean. 1999, 104, 7667–7681. [Google Scholar] [CrossRef]
  42. Dietrich, J.C.; Tanaka, S.; Westerink, J.J.; Dawson, C.N.; Luettich, R.A.; Zijlema, M.; Holthuijsen, L.H.; Smith, J.M.; Westerink, L.G.; Westerink, H.J. Performance of the unstructured–mesh, swan+adcirc model in computing hurricane waves and surge. J. Sci. Comput. 2012, 52, 468–497. [Google Scholar] [CrossRef]
  43. Willoughby, H.E.; Rahn, M.E. Parametric representation of the primary hurricane vortex. Part I: Observations and evaluation of the Holland (1980) model. Mon. Weather Rev. 2004, 132, 3033–3048. [Google Scholar] [CrossRef]
  44. Carr, L.E.; Elsberry, R.L. Models of tropical cyclone wind distribution and beta–effect propagation for application to tropical cyclone track forecasting. Mon. Weather Rev. 1997, 125, 3190–3209. [Google Scholar] [CrossRef]
  45. Ying, M.; Zhang, W.; Yu, H.; Lu, X.; Feng, J.; Fan, Y.; Zhu, Y.; Chen, D. An overview of the China Meteorological Administration tropical cyclone database. J. Atmos. Ocean. Technol. 2014, 31, 287–301. [Google Scholar] [CrossRef] [Green Version]
  46. Saha, S.; Moorthi, S.; Pan, H.; Wu, X.; Wang, J.; Nadiga, S.; Tripp, P.; Kistler, R.; Woollen, J.; Behringer, D.; et al. NCEP Climate Forecast System Reanalysis (CFSR) Selected Hourly Time–Series Products, January 1979 to December 2010. Research Data Archive at the National Center for Atmospheric Research, Computational and Information Systems Laboratory. 2010. Available online: https://doi.org/10.5065/D6513W89 (accessed on 3 March 2020).
  47. Saha, S.; Moorthi, S.; Wu, X.; Wang, J.; Nadiga, S.; Tripp, P.; Behringer, D.; Hou, Y.; Chuang, H.; Iredell, M.; et al. NCEP Climate Forecast System Version 2 (CFSv2) Selected Hourly Time–Series Products. Research Data Archive at the National Center for Atmospheric Research, Computational and Information Systems Laboratory. 2011. Available online: https://doi.org/10.5065/D6N877VB (accessed on 6 March 2020).
  48. Bilskie, M.V.; Hagen, S.C.; Alizad, K.; Medeiros, S.C.; Passeri, D.L.; Needham, H.F.; Cox, A. Dynamic simulation and numerical analysis of hurricane storm surge under sea level rise with geomorphologic changes along the northern Gulf of Mexico. Earth’s Future 2016, 4, 177–193. [Google Scholar] [CrossRef] [Green Version]
  49. Ding, Y.; Wei, H. Modeling the impact of land reclamation on storm surges in Bohai Sea, China. Nat. Hazards 2017, 85, 559–573. [Google Scholar] [CrossRef]
  50. Shen, Y.; Jia, H.; Li, C.; Tang, J. Numerical simulation of saltwater intrusion and storm surge effects of reclamation in Pearl River Estuary, China. Appl. Ocean Res. 2018, 79, 101–112. [Google Scholar] [CrossRef]
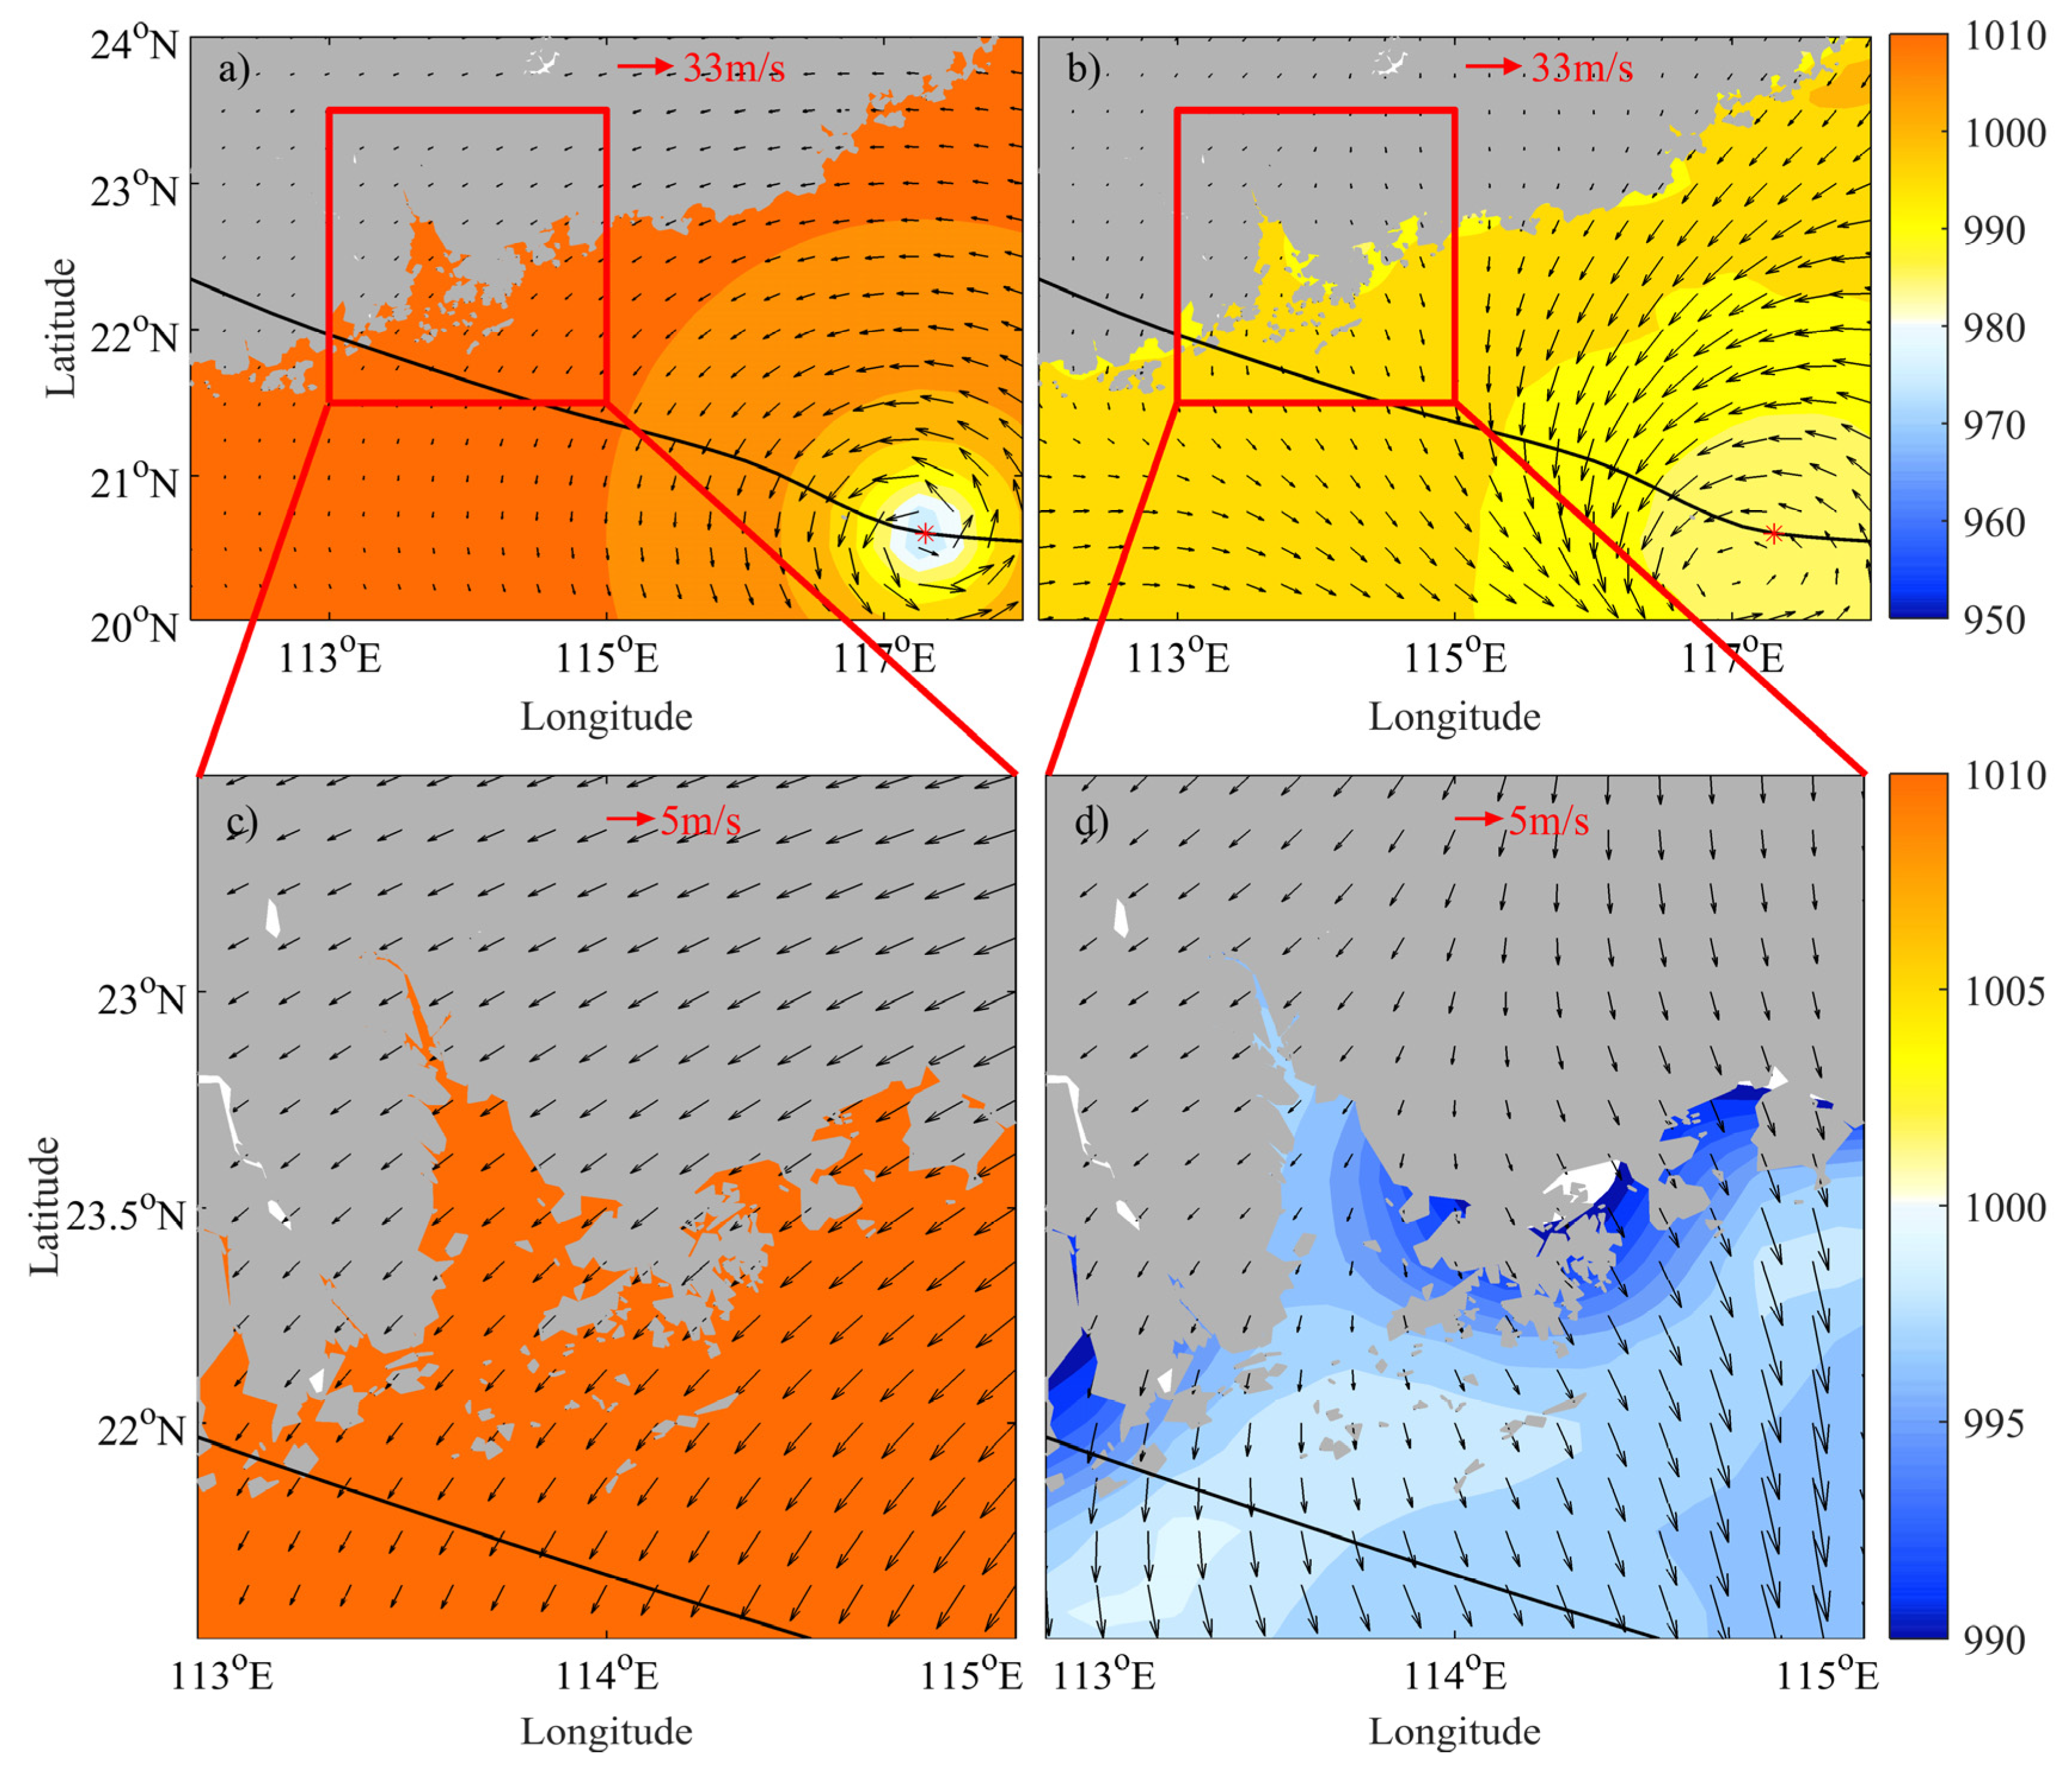
Figure 1. Planar views of Typhoon Hato (2017). (ad) The black lines in (ad) show the path of Typhoon Hato. Wind velocity (black arrows; units: m/s; vectors) and air pressure (units: hPa; shaded) provided by the Holland model (a,c) and CFSV2 (b,d) at 12:00 UTC on 22 August 2017. The (c) and (d) are enlarged views of the (a) and (b), respectively.
Remotesensing 12 01851 g001
Figure 2. The unstructured mesh covering the computational domain for the ADCIRC (Advanced Circulation) + SWAN (Simulating Waves Nearshore) coupled model. (a) There are 110,055 nodes and 216,932 triangular elements in the mesh of (a). (b) is an enlarged view of the Pearl River Estuary (PRE) (the area in the red box of (a)) with a horizontal resolution of 70 m–300 m.
Remotesensing 12 01851 g002
Figure 3. Planar views of Typhoon Hato (2017). (ac) The black lines in (ac) show the path of Typhoon Hato. The red “*” in Figure 4a–c show the center position of Typhoon Hato at 04:00 UTC on 23 August 2017. Wind velocity (units: m/s; vectors) and air pressure (units: hPa; shaded) provided by Holland model (a), CFSV2 (b), and assimilation typhoon model (c) at 04:00 UTC on 23 August 2017.
Remotesensing 12 01851 g003
Figure 4. The topography (units: m; shaded) of computational domain suitable for the ADCIRC + SWAN coupled model. (a) Three typhoon paths are plotted in (a) by rainbow lines to show the typhoon wind scale (CMA). (b) The (b) shows the area corresponding that circled by the red box in the (a). The topography (units: m; shaded) shown in the (b) represents elevation of the PRE within the mesh in Figure 2a. The gauge stations, buoys, and observation sites mentioned in this paper are marked in (b). The typhoon scale represented by the letters in the figure are as follows: TD: Tropical depression; TS: Tropical storm; STS: Strong tropical storm; TY: Typhoon; STY: Strong typhoon; Super TY: Super typhoon. The black dots in (b) represent places at the PRE, A: Yamen; B: Jinwan Airport; C: Nansha; D: Huangpu; E: Humen; F: Shenzhen Airport.
Remotesensing 12 01851 g004
Figure 5. Comparisons between simulations and observations for the temporal variation of water levels (a; units: m), storm surge heights (b; units: m), and significant wave heights (c; units: m). Locations and names of meteorological gauges and buoys are marked in Figure 4b. The black “.” shows the observation data and the red “–” shows the result of the model.
Remotesensing 12 01851 g005
Figure 6. Curves of simulated maximum storm surges (units: m) generated by different forcing fields along the PRE coast. (ac) The range of points shown in (ac) corresponds to the coastline from 113° E to 114° E in the Figure 4b. The blue curves present the maximum storm surge of the pressure forcing, the red curves present the maximum storm surge of the wind forcing, and the black curves present the maximum storm surge of the wind-pressure forcing. Some famous stations of the coastal area are marked in sub figures to show their storm surges.
Remotesensing 12 01851 g006
Figure 7. (ac) Time series of three typhoons’ simulated inundation area (units: km2) generated by different forcing fields. The blue curves present the inundation area of the pressure forcing, the red curves present the inundation area of the wind forcing, and the black curves present the inundation area of the wind-pressure forcing. The grey shaded area in (b), and (c) are present the maximum duration of the serious inundation for the Typhoon Nida (2016) and Typhoon Hato (2017), respectively.
Remotesensing 12 01851 g007
Figure 8. The inundation (units: m; shaded) maps at the PRE based on the simulation results of different forcing fields. (ac): only wind forcing; (df): only pressure forcing; (gi): wind-pressure forcing. The color bars of the 9 sub figures are all in the range of 0 m–2.5 m and displayed in rainbow color.
Remotesensing 12 01851 g008
Figure 9. The curves of simulated maximum storm surge (units: m) generated by different center moving speeds along the PRE coast. The range of points corresponds to the coastline from 113° E to 114° E in the Figure 3b. The maximum storm surge induced by Typhoon Hato (2017), Hato1, Hato2, and Hato3 are marked with black curve, blue curve, orange curve, and red curve, respectively. Some famous stations of the coastal area are marked in sub figures to show their storm surges.
Remotesensing 12 01851 g009
Figure 10. Time series of simulated inundation area (units: km2) generated by different moving speed of typhoon center. The red “––” marks the time of typhoon landing at 04:50 UTC on 23 August 2017. The inundation area induced by Typhoon Hato (2017), Hato1, Hato2, and Hato3 are marked with black curve, blue curve, orange curve, and pink curve, respectively.
Remotesensing 12 01851 g010
Figure 11. The inundation (units: m; shaded) maps at the PRE based on the simulation results of different central moving speeds. (a): central moving speed of 30 km/h; (b): central moving speed of 25 km/h; (c): central moving speed of 20 km/h; (d): central moving speed of 15 km/h. The color bars of the 4 sub figures are all in the range of 0 m–3 m and displayed in rainbow color.
Remotesensing 12 01851 g011
Table 1. Basic information for Typhoon Hope, Typhoon Nida, and Typhoon Hato provided by the China Meteorological Administration (CMA).
ItemTyphoon Hope (1979)Typhoon Nida (2016)Typhoon Hato (2017)
Maximum intensity on the CMA typhoon wind scaleSuper Typhoon
1979/7/31 12:00–8/2 00:00 UTC
Over waters east of the Philippines to the PRE waters
Strong Typhoon
2016/8/1 18:00–19:00 UTC
Over the PRE waters
Strong Typhoon
2017/8/22 23:00–8/23 06:00 UTC
Over the PRE waters
Track forward directionFrom ESE to WNWFrom ESE to WNWFrom ESE to WNW
Minimum central pressure (hPa)898960940
Maximum wind speed (m/s)704248
Landfall location and timeDapeng Peninsula, Shenzhen City, Guangdong Province,
China, 13:35 on 2 August 1979
Dapeng Peninsula, Shenzhen City, Guangdong Province,
China, 19:35 on 1 August 2016
Jinwan District, Zhuhai City, Guangdong Province,
China, 04:50 on 23 August 2017
Table 2. Indices used to assess the simulation results of the storm surges and significant wave heights.
TyphoonPositionComparison of the Peak ValuesComparison of All the Time Series
AE (m)RERMSE (m)CC
Hope (1979)Shantou0.031.18%0.170.94
Hope (1979)Haimen0.073.74%0.180.91
Nida (2016)Chiwan0.022.39%0.120.95
Nida (2016)Hengmen0.033.75%0.140.90
Nida (2016)FB040.064.57%0.120.97
Nida (2016)FB060.022.25%0.130.92
Hato (2017)Chiwan0.157.84%0.240.93
Hato (2017)Hengmen0.073.90%0.220.90
Hato (2017)FB050.020.75%0.270.98
Hato (2017)FB080.193.43%0.500.95
Table 3. Comparison of the inundation measurements and the corresponding model results at the observation sites.
Observation SiteTyphoonMaximum Inundation Depth (m)Difference (m)Distance from Inundated Place to Coastline (m)Difference (m)
Obs.ModelObs.Model
OS1Lover Road Bathing Beach, Zhuhai CityNida (2016)2.12.21+0.116575+10
Viewing Platform of the Fishing Girl, Zhuhai CityNida (2016)1.92.17+0.277085+15
OS2Avenida De Demetrio Cinatti, MacaoHato (2017)2.11.68–0.42
Parking Lot of New Riverside Street, MacaoHato (2017)2.01.69–0.31