Assessment of the Characteristics of Recent Major Wildfires in the USA, Australia and Brazil in 2018–2019 Using Multi-Source Satellite Products


Abstract
1. Introduction
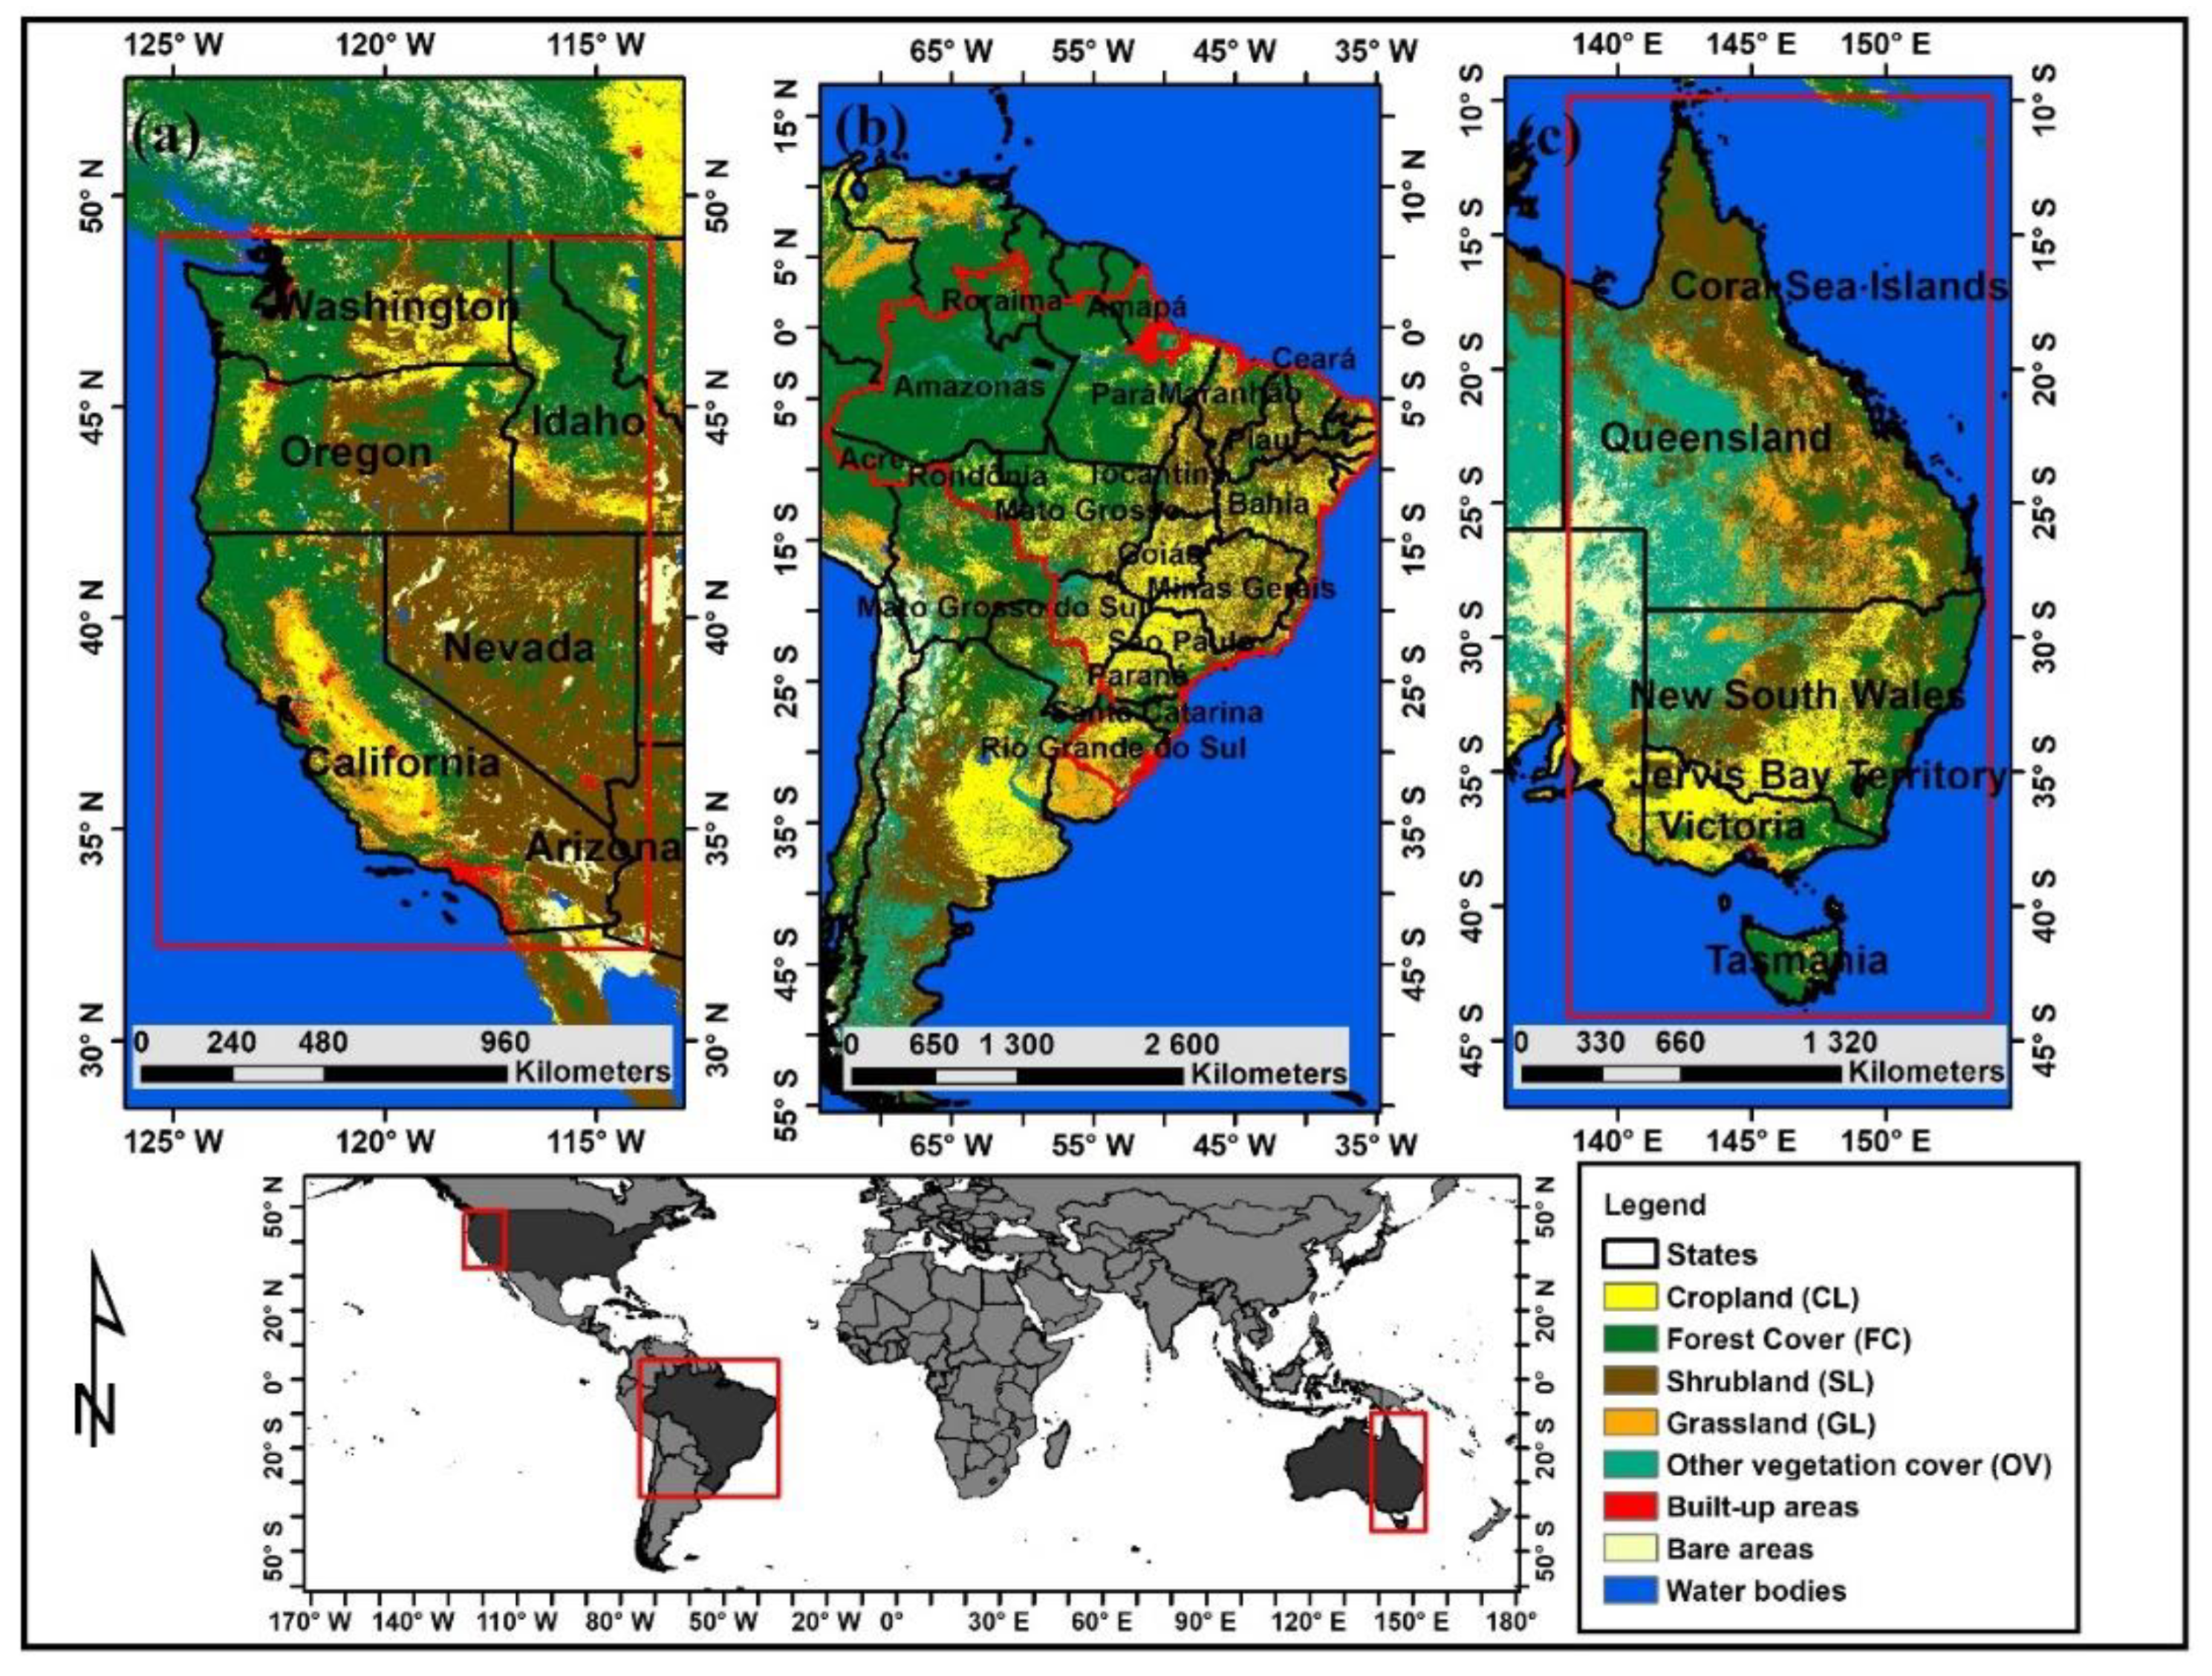
2. Study Area
3. Materials and Methods
3.1. Data
3.1.1. Fire Parameters
3.1.2. Environmental Parameters
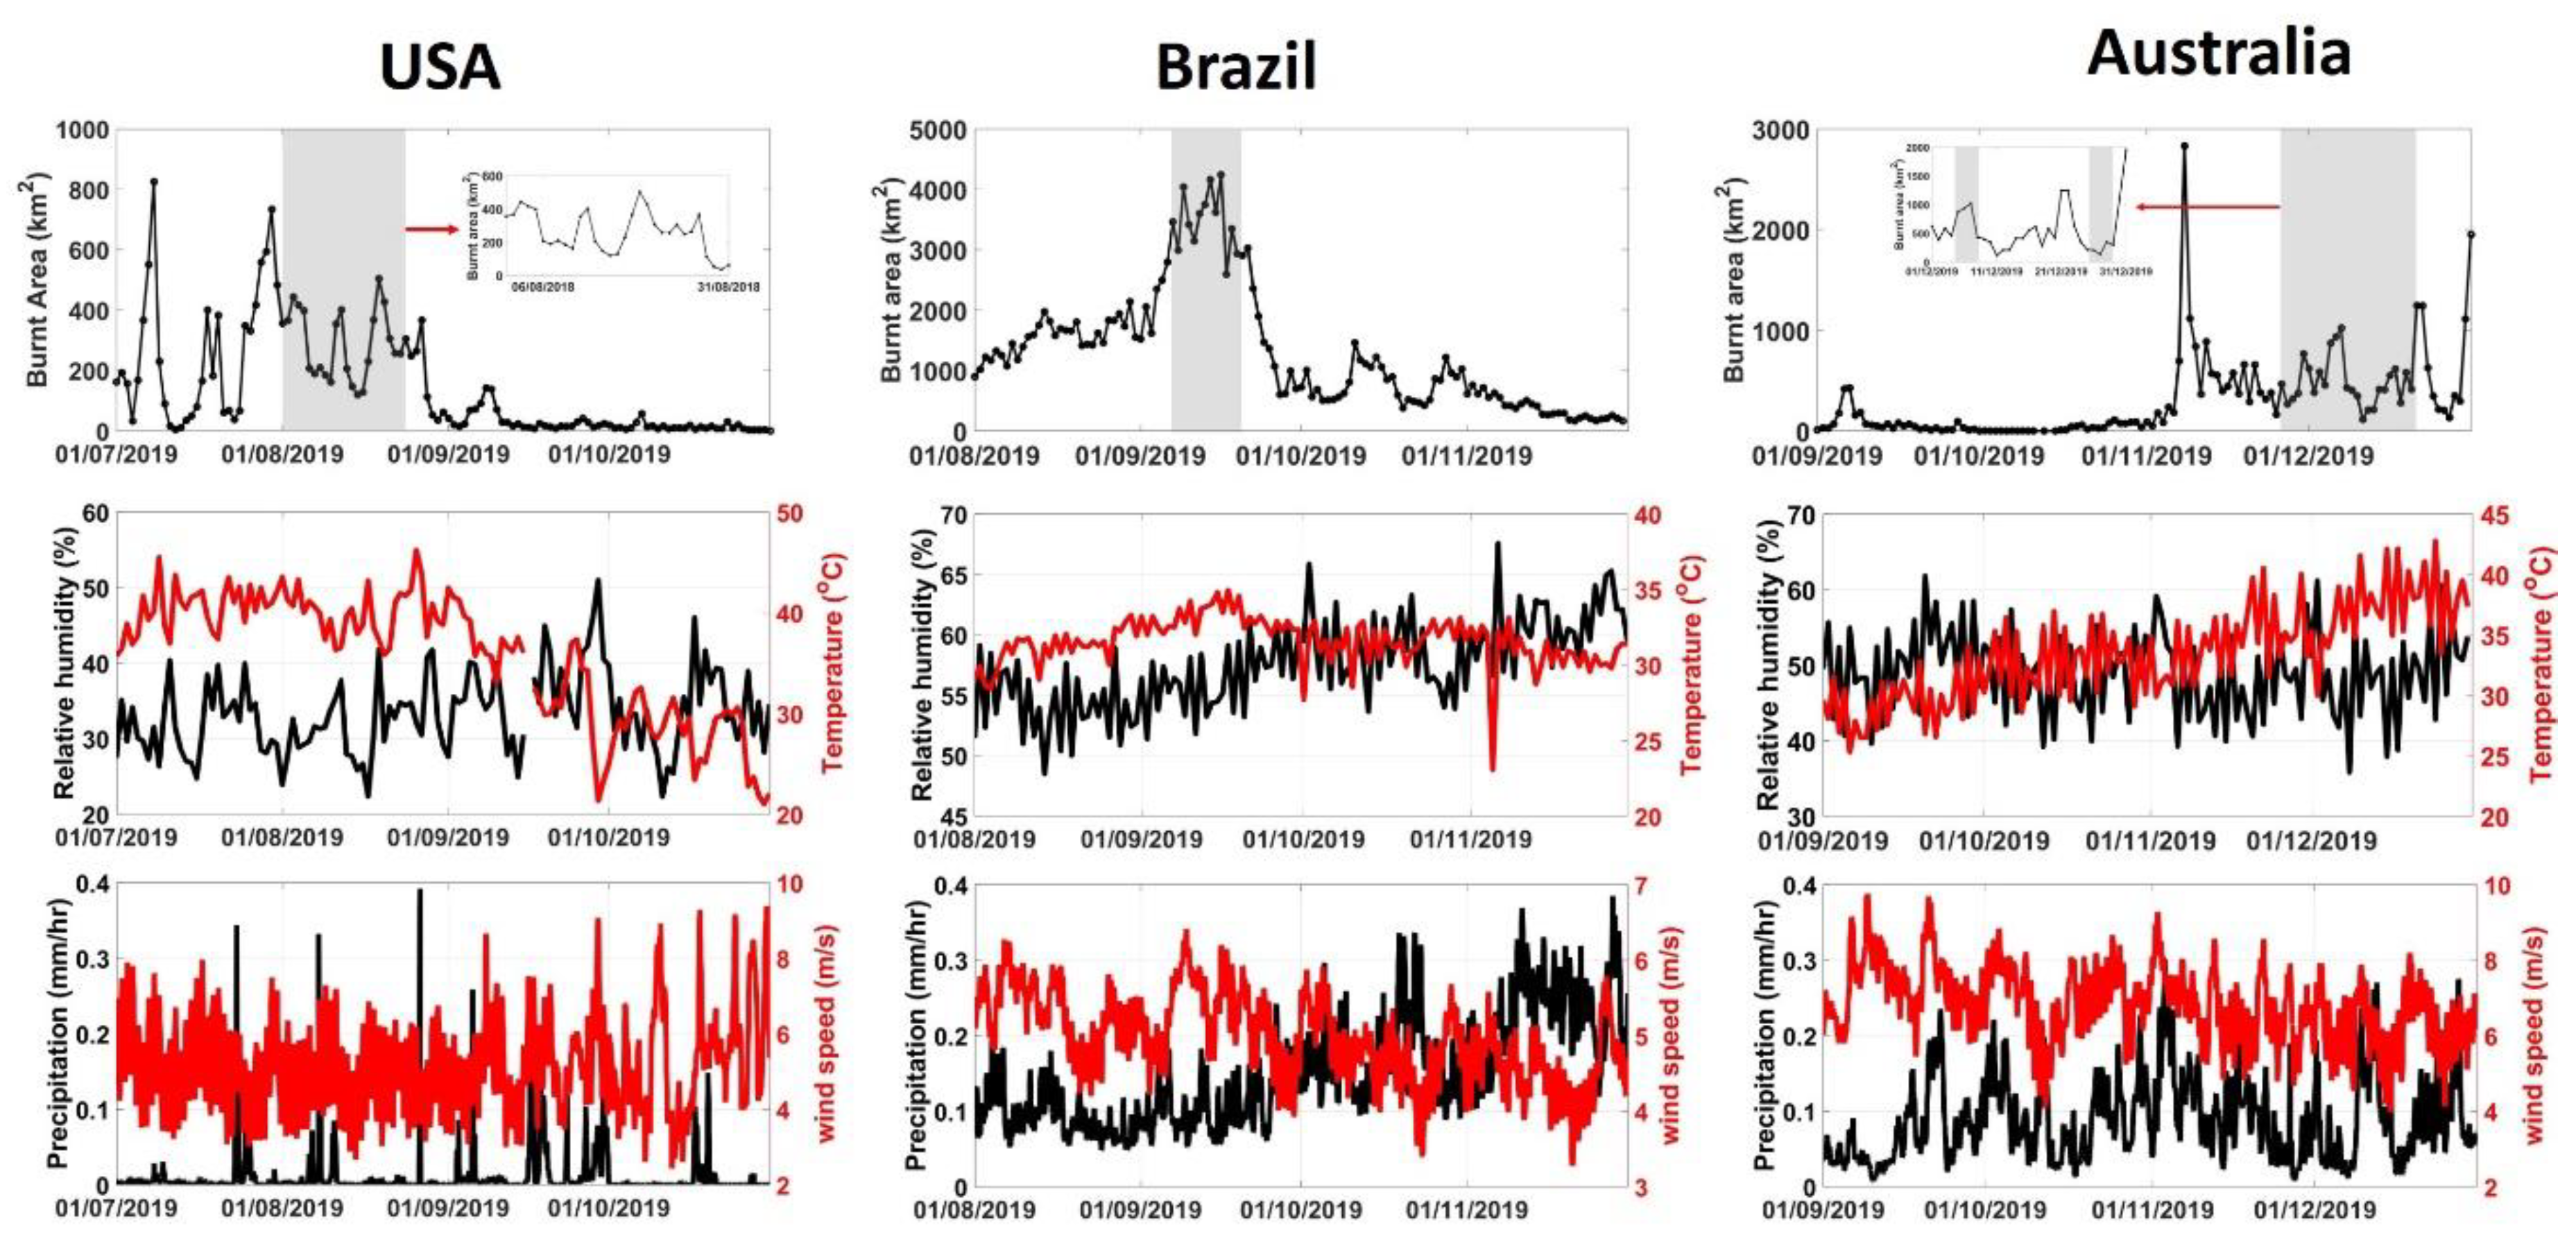
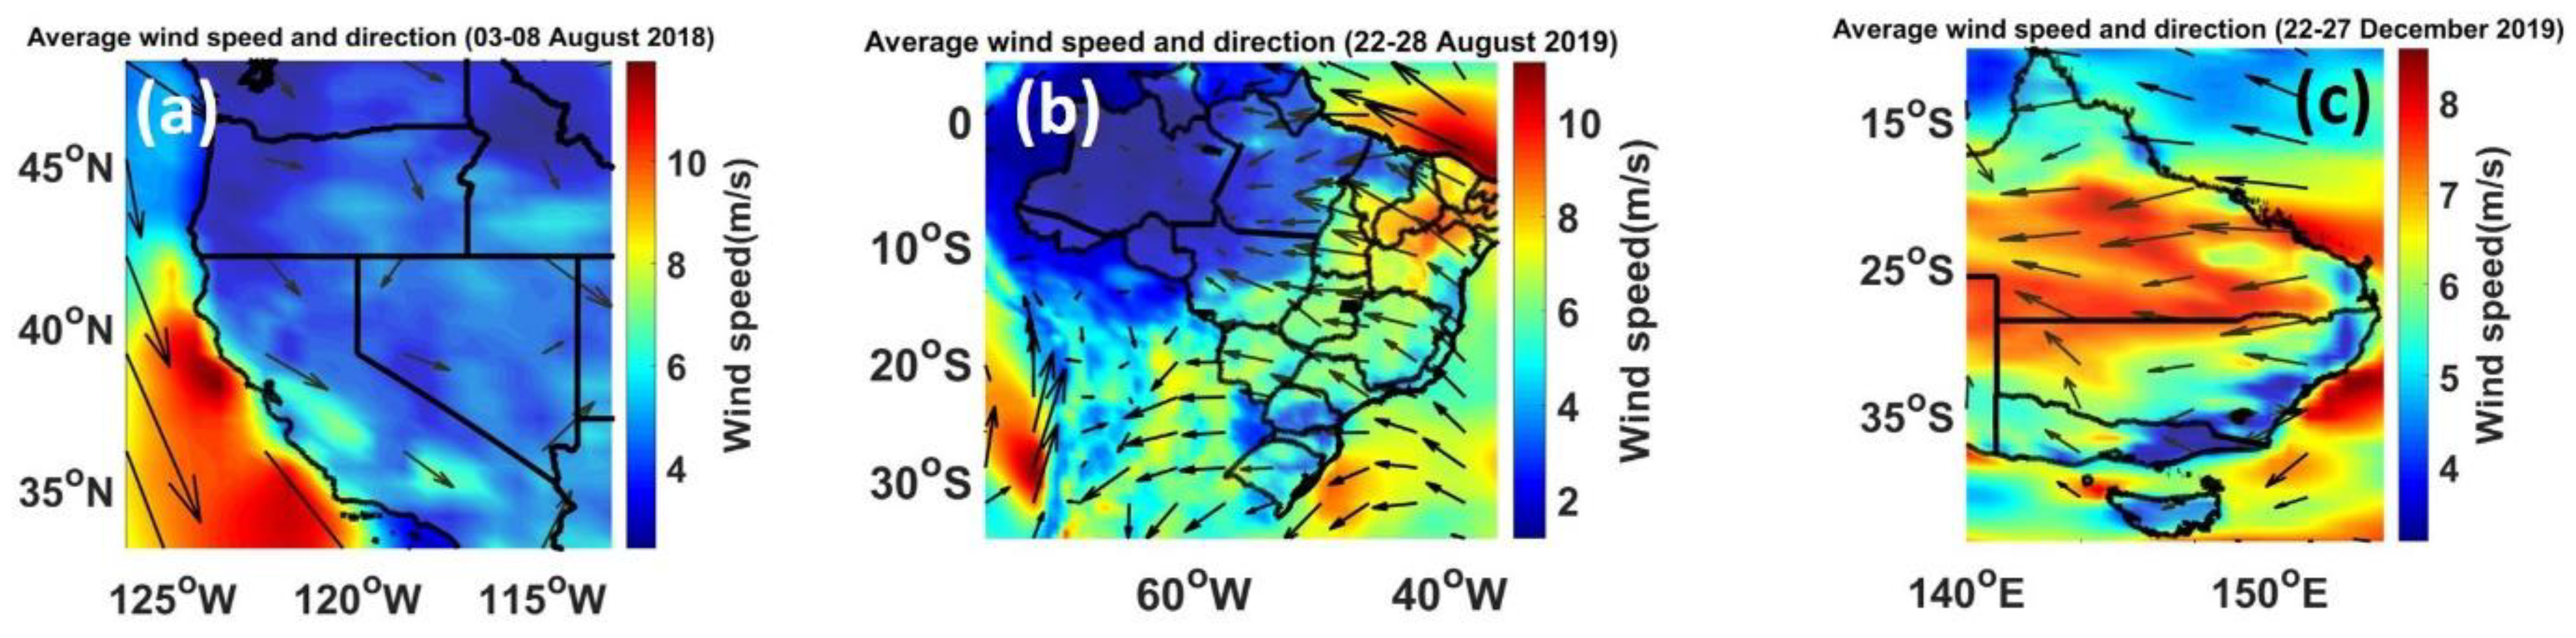
3.1.3. Meteorological Parameters
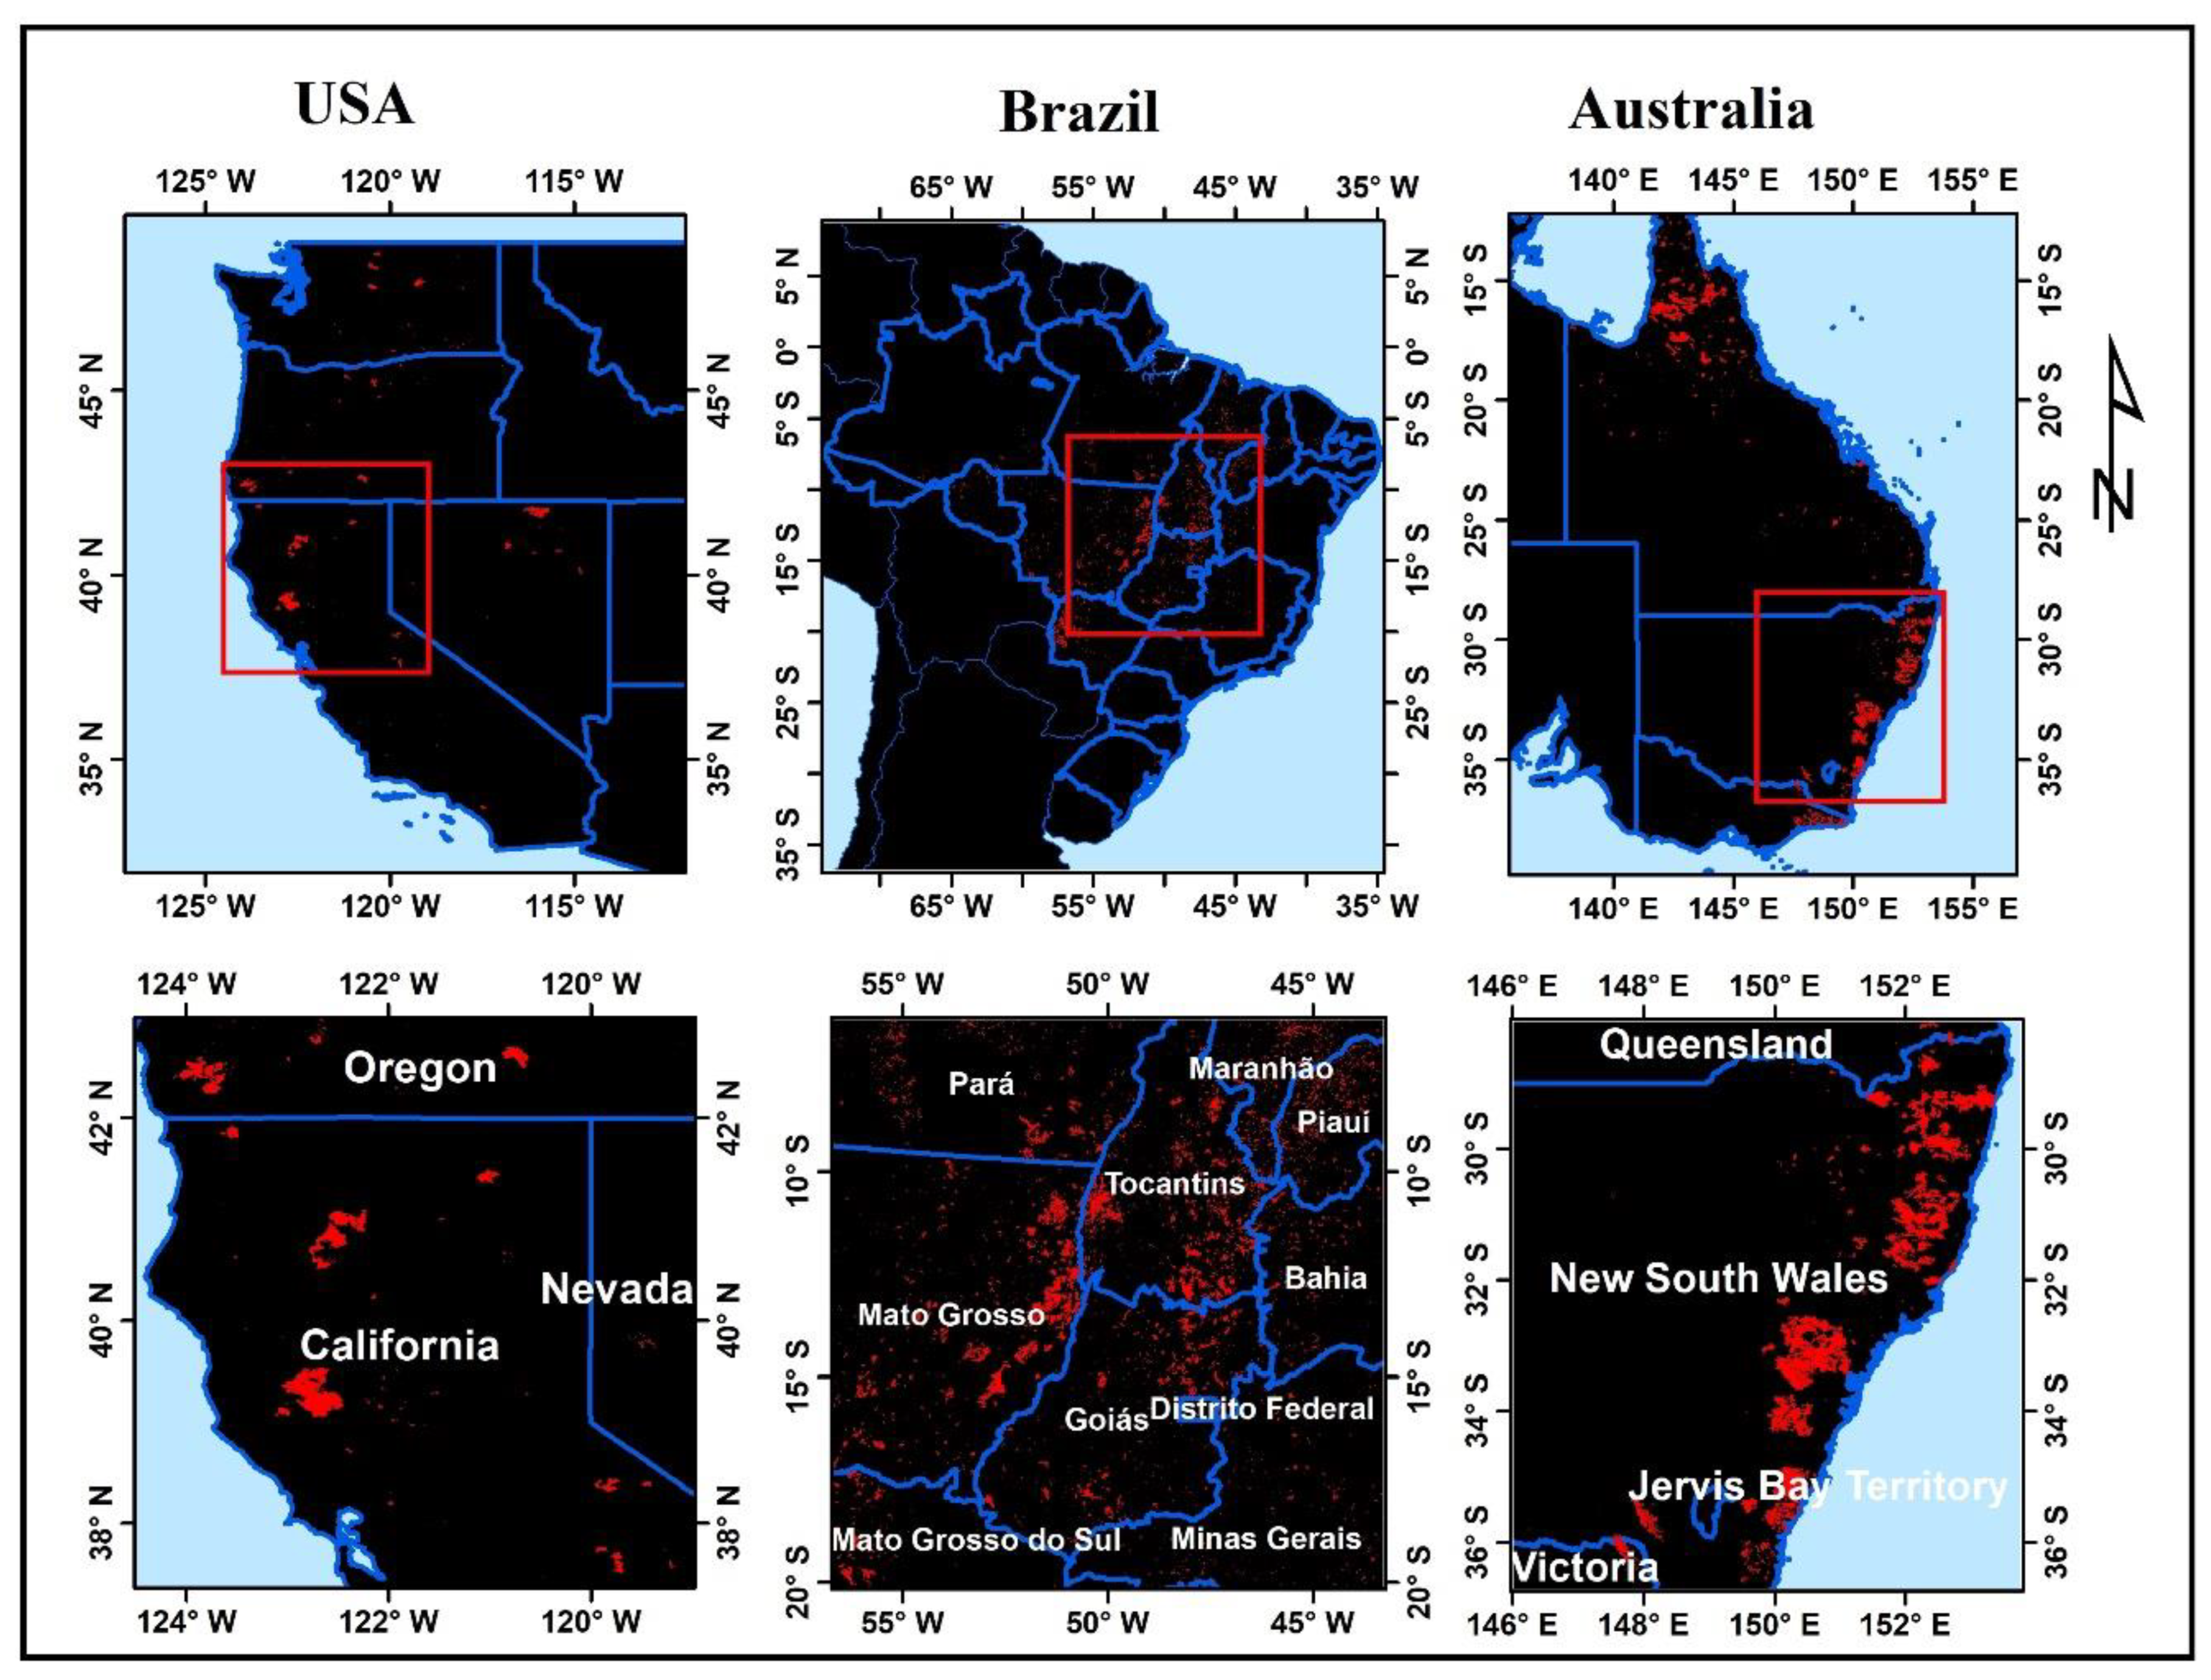
3.2. Spatial Patterns of Fires
3.3. Statistical Analysis
4. Results and Discussion
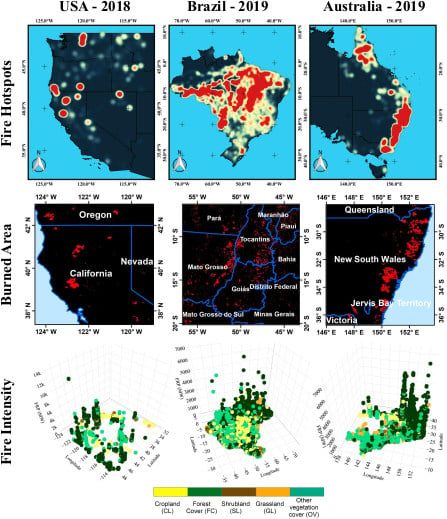
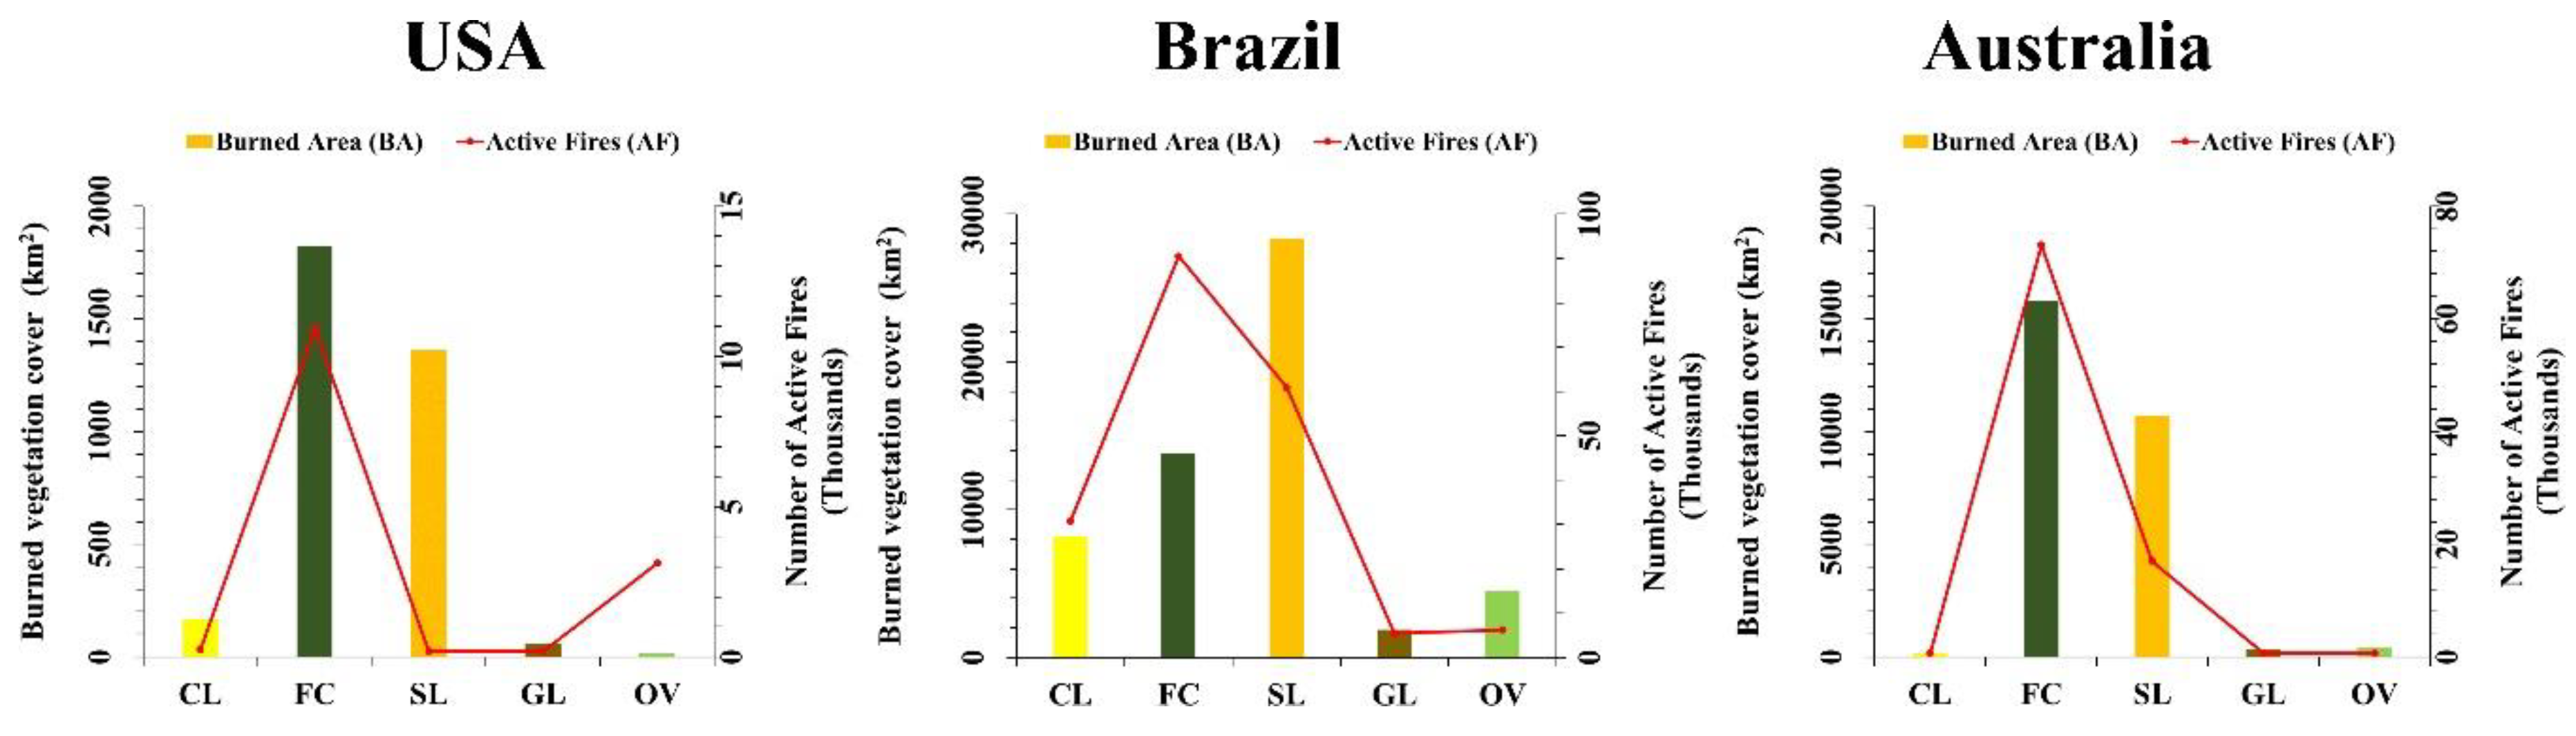
4.1. Analysis of Active Fires and Their Intensity over Various Vegetation Types
4.2. Spatio-Temporal Variations in the Burned Area over Various Vegetation Types
5. Conclusions
Author Contributions
Funding
Acknowledgments
Conflicts of Interest
Appendix A

| USA | Brazil | Australia | |||||||||||||
|---|---|---|---|---|---|---|---|---|---|---|---|---|---|---|---|
| Min | Max | Mean | sd | AF Count | Min | Max | Mean | sd | AF Count | Min | Max | Mean | sd | AF count | |
| CL | 6.2 | 1298 | 74.3 | 137 | 252 | 0 | 3175 | 60.7 | 128 | 30,827 | 0 | 3088 | 91.6 | 219 | 655 |
| FC | 3.8 | 14,376 | 115 | 339 | 10,934 | 0 | 6980 | 62 | 154 | 90,505 | 0 | 7401 | 93 | 244 | 73,100 |
| GL | 4.4. | 2555 | 179 | 349 | 192 | 2.9 | 2489 | 37.3 | 79.4 | 5462 | 0 | 808 | 57.4 | 86.1 | 670 |
| OV | 5.3 | 2155 | 109 | 201 | 181 | 3.2 | 4196 | 67.8 | 148 | 6237 | 0 | 3588 | 81.1 | 239 | 609 |
| SL | 0 | 7184 | 144 | 363 | 3123 | 0 | 5606 | 54.6 | 109 | 60,887 | 0 | 4023 | 62 | 126 | 17,007 |


References
- Snyman, H. Short-term response of the encroacher shrub Seriphium plumosum to fire. Afr. J. Range Forage Sci. 2011, 28, 65–77. [Google Scholar] [CrossRef]
- Everson, C.S.; Everson, T. The long-term effects of fire regime on primary production of montane grasslands in South Africa. Afr. J. Range Forage Sci. 2016, 33, 1–9. [Google Scholar] [CrossRef]
- Adeyolanu, O.; Are, K.S.; Oluwatosin, G.A.; Ayoola, O.T.; Adelana, A. Evaluation of two methods of soil quality assessment as influenced by slash and burn in tropical rainforest ecology of Nigeria. Arch. Agron. Soil Sci. 2013, 59, 1725–1742. [Google Scholar] [CrossRef]
- Varma, A. The economics of slash and burn: A case study of the 1997–1998 Indonesian forest fires. Ecol. Econ. 2003, 46, 159–171. [Google Scholar] [CrossRef]
- Finlay, S.E.; Moffat, A.; Gazzard, R.; Baker, D.; Murray, V. Health Impacts of Wildfires. PLoS Curr. 2012, 4, 4. [Google Scholar] [CrossRef]
- Bowman, D.; Johnston, F. Wildfire Smoke, Fire Management, and Human Health. EcoHealth 2005, 2, 76–80. [Google Scholar] [CrossRef]
- Johnston, F.; Henderson, S.B.; Chen, Y.; Randerson, J.T.; Marlier, M.; DeFries, R.S.; Kinney, P.; Bowman, D.M.; Brauer, M. Estimated Global Mortality Attributable to Smoke from Landscape Fires. Environ. Health Perspect. 2012, 120, 695–701. [Google Scholar] [CrossRef]
- La Rosa, N.S.-D.; González-Cardoso, G.; Figueroa-Lara, J.D.J.; Gutiérrez-Arzaluz, M.; Octaviano-Villasana, C.; Ramírez-Hernández, I.F.; Mugica-Álvarez, V. Emission factors of atmospheric and climatic pollutants from crop residues burning. J. Air Waste Manag. Assoc. 2018, 68, 849–865. [Google Scholar] [CrossRef]
- Shikwambana, L.; Ncipha, X.; Malahlela, O.; Mbatha, N.; Sivakumar, V. Characterisation of aerosol constituents from wildfires using satellites and model data: A case study in Knysna, South Africa. Int. J. Remote Sens. 2019, 40, 4743–4761. [Google Scholar] [CrossRef]
- Shikwambana, L. Long-term observation of global black carbon, organic carbon and smoke using CALIPSO and MERRA-2 data. Remote Sens. Lett. 2019, 10, 373–380. [Google Scholar] [CrossRef]
- Sathaye, J.A.; Dale, L.L.; Larsen, P.H.; Fitts, G.A.; Koy, K.; Lewis, S.M.; Lucena, A.F. Rising Temps, Tides, and Wildfires: Assessing the Risk to California’s Energy Infrastructure from Projected Climate Change. IEEE Power Energy Mag. 2013, 11, 32–45. [Google Scholar] [CrossRef]
- Forzieri, G.; Bianchi, A.; e Silva, F.B.; Herrera, M.A.M.; Leblois, A.; LaValle, C.; Aerts, J.C.; Feyen, L. Escalating impacts of climate extremes on critical infrastructures in Europe. Glob. Environ. Chang. 2018, 48, 97–107. [Google Scholar] [CrossRef]
- Shakesby, R.; Coelho, C.; Ferreira, A.; Terry, J.; Walsh, R. Wildfire Impacts on Soil-Erosion and Hydrology in Wet Mediterranean Forest, Portugal. Int. J. Wildland Fire 1993, 3, 95–110. [Google Scholar] [CrossRef]
- Hunke, P.; Mueller, E.N.; Schroder, B.; Zeilhofer, P.; Müller, E.N. The Brazilian Cerrado: Assessment of water and soil degradation in catchments under intensive agricultural use. Ecohydrology 2014, 8, 1154–1180. [Google Scholar] [CrossRef]
- Pastro, L.A.; Dickman, C.R.; Letnic, M. Burning for biodiversity or burning biodiversity? Prescribed burn vs. wildfire impacts on plants, lizards, and mammals. Ecol. Appl. 2011, 21, 3238–3253. [Google Scholar] [CrossRef]
- Thom, D.; Seidl, R. Natural disturbance impacts on ecosystem services and biodiversity in temperate and boreal forests. Boil. Rev. 2015, 91, 760–781. [Google Scholar] [CrossRef] [PubMed]
- Snyman, H. Short-term response in productivity following an unplanned fire in a semi-arid rangeland of South Africa. J. Arid Environ. 2004, 56, 465–485. [Google Scholar] [CrossRef]
- Snyman, H. Estimating the short-term impact of fire on rangeland productivity in a semi-arid climate of South Africa. J. Arid Environ. 2004, 59, 685–697. [Google Scholar] [CrossRef]
- Pereira, A.A.; Pereira, J.M.C.; Libonati, R.; Oom, D.; Setzer, A.W.; Morelli, F.; Machado-Silva, F.; De Carvalho, L.M.T. Burned Area Mapping in the Brazilian Savanna Using a One-Class Support Vector Machine Trained by Active Fires. Remote Sens. 2017, 9, 1161. [Google Scholar] [CrossRef]
- Maffei, C.; Alfieri, S.M.; Menenti, M. Relating Spatiotemporal Patterns of Forest Fires Burned Area and Duration to Diurnal Land Surface Temperature Anomalies. Remote Sens. 2018, 10, 1777. [Google Scholar] [CrossRef]
- Kganyago, M.; Shikwambana, L. Assessing Spatio-Temporal Variability of Wildfires and their Impact on Sub-Saharan Ecosystems and Air Quality Using Multisource Remotely Sensed Data and Trend Analysis. Sustainability 2019, 11, 6811. [Google Scholar] [CrossRef]
- Filipponi, F. Exploitation of Sentinel-2 Time Series to Map Burned Areas at the National Level: A Case Study on the 2017 Italy Wildfires. Remote Sens. 2019, 11, 622. [Google Scholar] [CrossRef]
- Mallinis, G.; Galidaki, G.; Gitas, I.Z. A Comparative Analysis of EO-1 Hyperion, Quickbird and Landsat TM Imagery for Fuel Type Mapping of a Typical Mediterranean Landscape. Remote Sens. 2014, 6, 1684–1704. [Google Scholar] [CrossRef]
- García, M.; Saatchi, S.; Casas, A.; Koltunov, A.; Ustin, S.L.; Ramirez, C.; Balzter, H. Extrapolating Forest Canopy Fuel Properties in the California Rim Fire by Combining Airborne LiDAR and Landsat OLI Data. Remote Sens. 2017, 9, 394. [Google Scholar] [CrossRef]
- Engelbrecht, J.; Theron, A.; Vhengani, L.; Kemp, J. A Simple Normalized Difference Approach to Burnt Area Mapping Using Multi-Polarisation C-Band SAR. Remote Sens. 2017, 9, 764. [Google Scholar] [CrossRef]
- Huang, H.; Roy, D.P.; Boschetti, L.; Zhang, H.K.; Yan, L.; Kumar, S.S.; Gómez-Dans, J.; Li, J. Separability Analysis of Sentinel-2A Multi-Spectral Instrument (MSI) Data for Burned Area Discrimination. Remote Sens. 2016, 8, 873. [Google Scholar] [CrossRef]
- Long, T.; Zhang, Z.; He, G.; Jiao, W.; Tang, C.; Wu, B.; Zhang, X.; Wang, G.; Yin, R. 30 m Resolution Global Annual Burned Area Mapping Based on Landsat Images and Google Earth Engine. Remote Sens. 2019, 11, 489. [Google Scholar] [CrossRef]
- Wooster, M.J. Fire radiative energy for quantitative study of biomass burning: Derivation from the BIRD experimental satellite and comparison to MODIS fire products. Remote Sens. Environ. 2003, 86, 83–107. [Google Scholar] [CrossRef]
- Oliva, P.; Schroeder, W. Assessment of VIIRS 375m active fire detection product for direct burned area mapping. Remote Sens. Environ. 2015, 160, 144–155. [Google Scholar] [CrossRef]
- Zubkova, M.; Boschetti, L.; Abatzoglou, J.T. Recent changes in fire activity in Africa and their potential drivers. In Proceedings of the AGU Fall Meeting Abstracts, Washington, DC, USA, 10–14 December 2018. [Google Scholar]
- Stellmes, M. Fire frequency, fire seasonality and fire intensity within the Okavango region derived from MODIS fire products. Biodivers. Ecol. 2013, 5, 351. [Google Scholar] [CrossRef]
- Schroeder, W.; Oliva, P.; Giglio, L.; Csiszar, I. The New VIIRS 375m active fire detection data product: Algorithm description and initial assessment. Remote Sens. Environ. 2014, 143, 85–96. [Google Scholar] [CrossRef]
- Lizundia-Loiola, J.; Pettinari, M.L.; Chuvieco, E. Temporal Anomalies in Burned Area Trends: Satellite Estimations of the Amazonian 2019 Fire Crisis. Remote Sens. 2020, 12, 151. [Google Scholar] [CrossRef]
- BBC. Australia Fires: A Visual Guide to the Bushfire Crisis. Available online: https://www.bbc.com/news/world-australia-50951043 (accessed on 11 May 2020).
- Whiteside, P.G. Nathan Scorched Earth: How the Devastating Australia Fires Compare to Those in California and Brazil. Available online: https://news.sky.com/story/scorched-earth-how-the-australia-fires-compare-to-us-and-brazil-11904192 (accessed on 11 May 2020).
- Ichoku, C.; Giglio, L.; Wooster, M.J.; Remer, L.A. Global characterization of biomass-burning patterns using satellite measurements of fire radiative energy. Remote Sens. Environ. 2008, 112, 2950–2962. [Google Scholar] [CrossRef]
- Giglio, L.; Schroeder, W.; Justice, C. The collection 6 MODIS active fire detection algorithm and fire products. Remote Sens. Environ. 2016, 178, 31–41. [Google Scholar] [CrossRef] [PubMed]
- Alvares, C.A.; Stape, J.L.; Sentelhas, P.C.; de Moraes, G.; Leonardo, J.; Sparovek, G. Köppen’s climate classification map for Brazil. Meteorol. Z. 2013, 22, 711–728. [Google Scholar] [CrossRef]
- Ratter, J.A.; Ribeiro, J.F.; Bridgewater, S. The Brazilian Cerrado Vegetation and Threats to its Biodiversity. Ann. Bot. 1997, 80, 223–230. [Google Scholar] [CrossRef]
- Ramos-Neto, M.B.; Pivello, V.R. Lightning Fires in a Brazilian Savanna National Park: Rethinking Management Strategies. Environ. Manag. 2000, 26, 675–684. [Google Scholar] [CrossRef]
- Nepstad, D.; Stickler, C.M.; Filho, B.-S.; Merry, F. Interactions among Amazon land use, forests and climate: Prospects for a near-term forest tipping point. Philos. Trans. R. Soc. B Boil. Sci. 2008, 363, 1737–1746. [Google Scholar] [CrossRef]
- Petty, A.M.; Bowman, D.M.J.S. A Satellite Analysis of Contrasting Fire Patterns in Aboriginal- and Euro-Australian Lands in Tropical North Australia. Fire Ecol. 2007, 3, 32–47. [Google Scholar] [CrossRef]
- Russell-Smith, J.; Yates, C.; Edwards, A.; Allan, G.E.; Cook, G.D.; Cooke, P.; Craig, R.; Heath, B.; Smith, R. Contemporary fire regimes of northern Australia, 1997 - 2001: Change since Aboriginal occupancy, challenges for sustainable management. Int. J. Wildland Fire 2003, 12, 283–297. [Google Scholar] [CrossRef]
- Russell-Smith, J.; Yates, C.; Whitehead, P.J.; Smith, R.; Craig, R.; Allan, G.E.; Thackway, R.; Frakes, I.; Cridland, S.; Meyer, M.C.P.; et al. Bushfires ’down under’: Patterns and implications of contemporary Australian landscape burning. Int. J. Wildland Fire 2007, 16, 361–377. [Google Scholar] [CrossRef]
- Nolan, R.H.; Boer, M.M.; Collins, L.; Resco de Dios, V.; Clarke, H.; Jenkins, M.; Kenny, B.; Bradstock, R.A. Causes and consequences of eastern Australia’s 2019-20 season of mega-fires. Glob. Change Biol. 2020, 26, 1039–1041. [Google Scholar] [CrossRef] [PubMed]
- Giglio, L.; Justice, C.; Boschetti, L.; Roy, D. MCD64A1 MODIS/Terra+ Aqua Burned Area Monthly L3 Global 500 m SIN Grid V006 [Data Set]; NASA EOSDIS Land Processes DAAC: Sioux Falls, SD, USA, 2015.
- Giglio, L.; Boschetti, L.; Roy, D.P.; Humber, M.L.; Justice, C. The Collection 6 MODIS burned area mapping algorithm and product. Remote Sens. Environ. 2018, 217, 72–85. [Google Scholar] [CrossRef] [PubMed]
- Humber, M.L.; Boschetti, L.; Giglio, L.; Justice, C.O. Spatial and temporal intercomparison of four global burned area products. Int. J. Digit. Earth 2018, 12, 460–484. [Google Scholar] [CrossRef]
- Wooster, M.J.; Xu, W.; Nightingale, T. Sentinel-3 SLSTR active fire detection and FRP product: Pre-launch algorithm development and performance evaluation using MODIS and ASTER datasets. Remote Sens. Environ. 2012, 120, 236–254. [Google Scholar] [CrossRef]
- Schroeder, W.; Prins, E.; Giglio, L.; Csiszar, I.; Schmidt, C.; Morisette, J.; Morton, D. Validation of GOES and MODIS active fire detection products using ASTER and ETM+ data. Remote Sens. Environ. 2008, 112, 2711–2726. [Google Scholar] [CrossRef]
- Cheng, D.; Rogan, J.; Schneider, L.; Cochrane, M. Evaluating MODIS active fire products in subtropical Yucatán forest. Remote Sens. Lett. 2013, 4, 455–464. [Google Scholar] [CrossRef]
- Pivello, V.R. The Use of Fire in the Cerrado and Amazonian Rainforests of Brazil: Past and Present. Fire Ecol. 2011, 7, 24–39. [Google Scholar] [CrossRef]
- Defourny, P.; Brockmann, C.; Bontemps, S.; Lamarche, C.; Santoro, M.; Boettcher, M.; Wevers, J. CCI-LC PUGv2 Phase II. Land Cover Climate Change Initiative-Product User Guide. 2017. Available online: https://www.esa-landcover-cci.org/?q=webfm_send/84 (accessed on 25 January 2020).
- Li, W.; MacBean, N.; Ciais, P.; Defourny, P.; Lamarche, C.; Bontemps, S.; Houghton, R.A.; Peng, S. Gross and net land cover changes in the main plant functional types derived from the annual ESA CCI land cover maps (1992–2015). Earth Syst. Sci. Data 2018, 10, 219–234. [Google Scholar] [CrossRef]
- Bontemps, S.; Defourny, P.; Radoux, J.; Van Bogaert, E.; Lamarche, C.; Achard, F.; Mayaux, P.; Boettcher, M.; Brockmann, C.; Kirches, G. Consistent global land cover maps for climate modelling communities: Current achievements of the ESA’s land cover CCI. In Proceedings of the ESA Living Planet Symposium, Edinburgh, UK, 9–13 September 2013. [Google Scholar]
- Kogan, F. Application of vegetation index and brightness temperature for drought detection. Adv. Space Res. 1995, 15, 91–100. [Google Scholar] [CrossRef]
- Kogan, F. Remote sensing of weather impacts on vegetation in non-homogeneous areas. Int. J. Remote Sens. 1990, 11, 1405–1419. [Google Scholar] [CrossRef]
- Domenikiotis, C.; Spiliotopoulos, M.; Tsiros, E.; Dalezios, N.R. Early cotton yield assessment by the use of the NOAA/AVHRR derived Vegetation Condition Index (VCI) in Greece. Int. J. Remote Sens. 2004, 25, 2807–2819. [Google Scholar] [CrossRef]
- Kogan, F.N. Global Drought Watch from Space. Bull. Am. Meteorol. Soc. 1997, 78, 621–636. [Google Scholar] [CrossRef]
- Wang, L.; Zhang, L.; Chang, Q.; Fu, D.; Cen, Y.; Tong, Q. Evaluating an Enhanced Vegetation Condition Index (VCI) Based on VIUPD for Drought Monitoring in the Continental United States. Remote Sens. 2016, 8, 224. [Google Scholar] [CrossRef]
- Gelaro, R.; Mccarty, W.; Suárez, M.J.; Todling, R.; Molod, A.; Takacs, L.; Randles, C.; Darmenov, A.; Bosilovich, M.G.; Reichle, R.; et al. The Modern-Era Retrospective Analysis for Research and Applications, Version 2 (MERRA-2). J. Clim. 2017, 30, 5419–5454. [Google Scholar] [CrossRef] [PubMed]
- Wargan, K.; Labow, G.; Frith, S.; Pawson, S.; Livesey, N.; Partyka, G. Evaluation of the Ozone Fields in NASA’s MERRA-2 Reanalysis. J. Clim. 2017, 30, 2961–2988. [Google Scholar] [CrossRef] [PubMed]
- Buchard, V.; Randles, C.; Da Silva, A.M.; Darmenov, A.; Colarco, P.R.; Govindaraju, R.; Ferrare, R.; Hair, J.; Beyersdorf, A.J.; Ziemba, L.D.; et al. The MERRA-2 Aerosol Reanalysis, 1980 Onward. Part II: Evaluation and Case Studies. J. Clim. 2017, 30, 6851–6872. [Google Scholar] [CrossRef]
- Randles, C.; Da Silva, A.M.; Buchard, V.; Colarco, P.R.; Darmenov, A.; Govindaraju, R.; Smirnov, A.; Holben, B.; Ferrare, R.; Hair, J.; et al. The MERRA-2 Aerosol Reanalysis, 1980 Onward. Part I: System Description and Data Assimilation Evaluation. J. Clim. 2017, 30, 6823–6850. [Google Scholar] [CrossRef] [PubMed]
- Anselin, L. Local Indicators of Spatial Association-LISA. Geogr. Anal. 2010, 27, 93–115. [Google Scholar] [CrossRef]
- Vadrevu, K.; Csiszar, I.; Ellicott, E.A.; Giglio, L.; Badarinath, K.V.S.; Vermote, E.; Justice, C. Hotspot Analysis of Vegetation Fires and Intensity in the Indian Region. IEEE J. Sel. Top. Appl. Earth Obs. Remote Sens. 2013, 6, 224–238. [Google Scholar] [CrossRef]
- Kelley, D.I.; Burton, C.; Huntingford, C.; Brown, M.A.J.; Whitley, R.; Dong, N. Technical note: Low meteorological influence found in 2019 Amazonia fires. J. Geophys. Res. Biogeosci. 2020, 1–17. [Google Scholar] [CrossRef]
- De Araújo, F.M.; Ferreira, L.G.; Arantes, A.E. Distribution Patterns of Burned Areas in the Brazilian Biomes: An Analysis Based on Satellite Data for the 2002–2010 Period. Remote Sens. 2012, 4, 1929–1946. [Google Scholar] [CrossRef]
- Justice, C.; Giglio, L.; Korontzi, S.; Owens, J.; Morisette, J.; Roy, D.; Descloitres, J.; Alleaume, S.; Petitcolin, F.; Kaufman, Y. The MODIS fire products. Remote Sens. Environ. 2002, 83, 244–262. [Google Scholar] [CrossRef]
- Hyer, E.; Reid, J.S. Baseline uncertainties in biomass burning emission models resulting from spatial error in satellite active fire location data. Geophys. Res. Lett. 2009, 36, 36. [Google Scholar] [CrossRef]
- Schroeder, W.; Oliva, P.; Giglio, L.; Quayle, B.; Lorenz, E.; Morelli, F. Active fire detection using Landsat-8/OLI data. Remote Sens. Environ. 2016, 185, 210–220. [Google Scholar] [CrossRef]
- Di Bella, C.M.; Jobbágy, E.G.; Paruelo, J.; Pinnock, S. Continental fire density patterns in South America. Glob. Ecol. Biogeogr. 2006, 15, 192–199. [Google Scholar] [CrossRef]
- Morton, D. Conservation challenge at the agricultural frontier: Deforestation, fire, and land use dynamics in Mato Grosso. Ambient. e Agua - Interdiscip. J. Appl. Sci. 2007, 2, 5–20. [Google Scholar] [CrossRef]
- Jin, H. Drivers of Global Wildfires: Statistical Analyses. Master’s Thesis, Lund University, Lund, Sweden, 2010. [Google Scholar]
- Turco, M.; Levin, N.; Tessler, N.; Saaroni, H. Recent changes and relations among drought, vegetation and wildfires in the Eastern Mediterranean: The case of Israel. Glob. Planet. Chang. 2017, 151, 28–35. [Google Scholar] [CrossRef]
- Estes, B.L.; Knapp, E.E.; Skinner, C.N.; Miller, J.D.; Preisler, H.K. Factors influencing fire severity under moderate burning conditions in the Klamath Mountains, northern California, USA. Ecosphere 2017, 8, e01794. [Google Scholar] [CrossRef]
- Padilla, M.; Stehman, S.V.; Litago, J.; Chuvieco, E. Assessing the Temporal Stability of the Accuracy of a Time Series of Burned Area Products. Remote Sens. 2014, 6, 2050–2068. [Google Scholar] [CrossRef]
- Cardozo, F.D.S.; Pereira, G.; Shimabukuro, Y.E.; Moraes, E.C. Validation of MODIS MCD45A1 product to identify burned areas in Acre State - Amazon forest. In Proceedings of the 2012 IEEE International Geoscience and Remote Sensing Symposium, Munich, Germany, 22–27 July 2012; pp. 6741–6744. [Google Scholar] [CrossRef]
- Boschetti, L.; Roy, D.P.; Giglio, L.; Huang, H.; Zubkova, M.; Humber, M.L. Global validation of the collection 6 MODIS burned area product. Remote Sens. Environ. 2019, 235, 111490. [Google Scholar] [CrossRef] [PubMed]


| USA | Brazil | Australia | ||||
|---|---|---|---|---|---|---|
| No. of AF | Mean FRP | No. of AF | Mean FRP | No. of AF | Mean FRP | |
| HH | 1098 | 762.07 | 14128 | 356.77 | 5613 | 494.37 |
| HL | 328 | 827.68 | 1202 | 315.88 | 4093 | 411.82 |
| LH | 125 | 13.17 | 4861 | 14.52 | 13065 | 21.22 |
| LL | 20095 | 59.27 | 907 | 7.45 | 11583 | 18.13 |
| USA | Brazil | Australia | ||||||||||
|---|---|---|---|---|---|---|---|---|---|---|---|---|
| CL | FC | GL | OVC | CL | FC | GL | OVC | CL | FC | GL | OVC | |
| FC | 0.05 | 8.5 × 10⁻⁵ | 0.29 | |||||||||
| GL | 1 × 10⁻⁴ | 5.9 × 10⁻⁴ | <p | <p | 0.003 | 2.0 × 10⁻⁹ | ||||||
| OVC | 0.001 | 0.015 | 0.37 | <p | <p | <p | 0.054 | 1.8 × 10⁻⁵ | 0.29 | |||
| SL | 4.7 × 10⁻⁷ | <p | 0.37 | 0.7 | 0.88 | 1.8 × 10⁻⁷ | <p | <p | 0.03 | <p | 0.01 | 0.29 |
© 2020 by the authors. Licensee MDPI, Basel, Switzerland. This article is an open access article distributed under the terms and conditions of the Creative Commons Attribution (CC BY) license (http://creativecommons.org/licenses/by/4.0/).
Share and Cite
Kganyago, M.; Shikwambana, L. Assessment of the Characteristics of Recent Major Wildfires in the USA, Australia and Brazil in 2018–2019 Using Multi-Source Satellite Products. Remote Sens. 2020, 12, 1803. https://doi.org/10.3390/rs12111803
Kganyago M, Shikwambana L. Assessment of the Characteristics of Recent Major Wildfires in the USA, Australia and Brazil in 2018–2019 Using Multi-Source Satellite Products. Remote Sensing. 2020; 12(11):1803. https://doi.org/10.3390/rs12111803
Chicago/Turabian StyleKganyago, Mahlatse, and Lerato Shikwambana. 2020. "Assessment of the Characteristics of Recent Major Wildfires in the USA, Australia and Brazil in 2018–2019 Using Multi-Source Satellite Products" Remote Sensing 12, no. 11: 1803. https://doi.org/10.3390/rs12111803
APA StyleKganyago, M., & Shikwambana, L. (2020). Assessment of the Characteristics of Recent Major Wildfires in the USA, Australia and Brazil in 2018–2019 Using Multi-Source Satellite Products. Remote Sensing, 12(11), 1803. https://doi.org/10.3390/rs12111803