Article

Assessment of the Characteristics of Recent Major Wildfires in the USA, Australia and Brazil in 2018–2019 Using Multi-Source Satellite Products

by
Mahlatse Kganyago
1,2,* and
Lerato Shikwambana
3
1
Earth Observation, South African National Space Agency, The Enterprise Building, Mark Shuttleworth Street, Pretoria 0001, South Africa
2
School of Geography, Archaeology and Environmental Studies, University of the Witwatersrand, Johannesburg 2050, South Africa
3
Space Science Directorate, South African National Space Agency, Hermanus 7200, South Africa
*
Author to whom correspondence should be addressed.
Remote Sens. 2020, 12(11), 1803; https://doi.org/10.3390/rs12111803
Submission received: 17 April 2020 / Revised: 22 May 2020 / Accepted: 29 May 2020 / Published: 3 June 2020
(This article belongs to the Special Issue Remote Sensing of Biomass Burning)

Abstract

:
This study analysed the characteristics of the recent (2018–2019) wildfires that occurred in the USA, Brazil, and Australia using Moderate Resolution Imaging Spectroradiometer (MODIS) active fires (AF), fire radiative power (FRP, MW) and burned area (BA) products. Meteorological and environmental parameters were also analysed. The study found various patterns in the spatial distribution of fires, FRP and BA at the three sites, associated with various vegetation compositions, prevailing meteorological and environmental conditions and anthropogenic activities. We found significant fire clusters along the western and eastern coasts of the USA and Australia, respectively, while vastly distributed clusters were found in Brazil. Across all sites, significant fire intensity was recorded over forest cover (FC) and shrublands (SL), attributed to highly combustible tree crown fuel load characterised by leafy canopies and thin branches. In agreement, BA over FC was the highest in the USA and Australia, while Brazil was dominated by the burning of SL, characteristic of fire-tolerant Cerrado. The relatively lower BA over FC in Brazil can be attributed to fuel availability and proximity to highly flammable cover types such as cropland, SL and grasslands rather than fuel flammability. Overall, this study contributes to a better understanding of wildfires in various regions and the underlying environmental and meteorological causal factors, towards better wildfire disaster management strategies and habitat-specific firefighting.

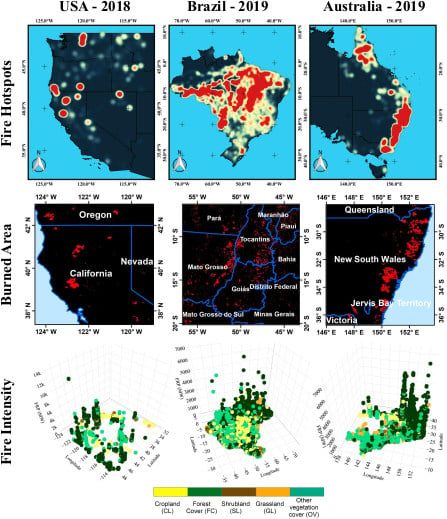
Graphical Abstract

1. Introduction

Fires are essential for shaping most ecosystems around the globe; thus, they are crucial for conservation and ecosystems management. In most rangelands and forest ecosystems, fires are used to contain the extensive bush encroachment and invasive species [1], and for improving grasslands productivity [2]. Moreover, fire is an affordable clearance mechanism for agricultural expansion in most rural communities, especially in developing countries, where the adoption of machinery is limited due to the high cost and poor living standards [3,4]. In other communities, fires are a fundamental part of culture and heritage. While the above-mentioned fires are related to intentional or accidental anthropogenic activities, fires can also be ignited naturally through lighting and extreme and prolonged heat conditions. Regardless of the ignition source, wildfires can rapidly become widespread, uncontrollable, intense and disastrous due to the prevailing local meteorological and environmental conditions. Such fire behaviour is devastating, causing losses to human life and well-being [5,6,7], air quality [8,9,10], infrastructure [11,12], soils [13,14], biodiversity [15,16] and ecological services [17,18]. Therefore, it is crucial to understand the after-effects and implications of such wildfires on ecosystems and associated services.
Remotely sensed data has been, for decades, used for the objective, accurate and systematic wildfire assessment and monitoring. Studies [19,20,21,22,23,24,25], using a variety of optical, Light Detection And Ranging (LiDAR) and Synthetic-Aperture Radar (SAR) data, have demonstrated that information on fuel loads, burn frequency, burn intensity and burned area can be extracted at various spatial and temporal scales. In particular, fire-related information at medium to high spatial resolution is probable and highly sought after as it is essential for the accurate estimation of fire perimeters and fuel loads and for quantifying environmental, social and economic losses [22,24,26,27]. However, fire-related information at higher spatial resolution has been limited to smaller areas and shorter temporal scales due to available sensor configurations. For example, sensors such as Landsat 8 Operational Land Imager (OLI) and Sentinel-2 Multi-Spectral Instrument (MSI) have lower spatial coverage (i.e., narrow swath width) and longer temporal revisit (i.e., ≥5 days); thus, they cannot keep up with the pace of rapidly spreading wildfire. Moreover, there is currently (at the time of writing of this manuscript) no global operational burned area products at medium (<30 m) to high (<5 m) resolutions.
Therefore, operational coarse resolution fire products such as from Moderate Resolution Imaging Spectroradiometer (MODIS) and Visible Infrared Imaging Radiometer Suite (VIIRS), and associated vegetation and land cover products from MEdium Resolution Imaging Spectrometer (MERIS), PROBA-V, Satellite Pour l’Observation de la Terre Vegetation (SPOT-VGT), are indispensable in characterising and quantifying the impacts of wildfires at local to regional scales [21,28,29,30]. For example, Stellmes et al. [31] characterise spatial and temporal fire dynamics in southern Africa using MODIS Active Fire (AF) and Burned Area (BA) products from 2001 to 2012. In other studies, Schroeder et al. [32] and Oliva and Schroeder [29] show that VIIRS data, at a spatial resolution of 375 m, was more sensitive to small fires (i.e., with a theoretical minimum detectable area of ~5 m2), and thus, essential for near real-time fire mapping.
The objectives of this study were to assess the characteristics and environmental impacts of recent (i.e., 2018–2019) major wildfires that occurred in the western United States of America (USA), Brazil and eastern Australia using multi-source remotely sensed products. The study sites were selected based on recent major wildfires that resulted in extensive damage to ecosystems and loss of life, and thus, attracted global attention [33,34,35]. MODIS Monthly Burned Area (MCD64A1) and Monthly Fire Location (MCD14ML) products were used to characterise the wildfires in terms of the daily accumulation and distribution of burned areas (BA, km2), active fires (AF) and fire intensity (i.e., Fire Radiative Power, FRP) at the three study sites, i.e., western United States of America (USA), Brazil and eastern Australia. The satellite-derived FRP characterises radiant energy, measured at approximately 4 µm, released from burning vegetation per unit time. This is useful for characterising the strength of the fire, i.e., fire intensity, and it is linearly related to the biomass consumption rate [28,36,37]. Moreover, we compared burned vegetation types based on 2018 European Space Agency (ESA) Climate Change Initiative Land Cover (CCI-LC), the variability of fire intensity by vegetation type and density of active fires. Lastly, meteorological conditions during the fires (i.e., surface temperature, precipitation and wind speed and direction) and environmental conditions (i.e., relative humidity and vegetation condition index) were analysed to explain the observed intensity and spread (propagation) of these wildfires.

2. Study Area

The study area (see Figure 1) consisted of recent, i.e., 2018–2019, major wildfires that occurred in the United States of America (USA), Brazil (BR) and Australia (AS). The first study site is located in western USA (Washington, Oregon, Idaho, Nevada and California) at latitudes 32.179° N to 49.058° N and longitudes 125.368° W to 113.693° W. This area is characterised by low rainfall and warm temperatures during a dry, summer season (i.e., June–August). The majority (i.e., 94%) of fires in this region occur between May and October. The fires of August 2018 resulted in about 100 deaths and extensive damage to infrastructure amounting $24 billion; thus, it was reportedly amongst the worst fires ever recorded in this region [35]. In contrast, the second site consisted of the entire Brazilian territory, located at latitudes 34.095° S to 5.464° N and longitudes 74.431° W to 34.194° W. Brazil consists of six biomes, i.e., Amazon, Caatinga, Cerrado, Atlantic Forest, Pampa and Pantanal, with varying climatic patterns and fire regimes. Much of Brazil, i.e., 81.4% (including the Amazon), is characterised by a tropical climate [38]. The Amazon has a Humid Equatorial climate with annual precipitation of between 2050 mm and 2650 mm. Towards the south, the region is occupied by indigenous people, and dominated by increasing livestock and cultivation activities. Cerrado biome is characterised by a humid climate, with an average annual rainfall of between 800 to 2000 mm [39] during the wet season. The dry season in the Brazilian Cerrado is long, i.e., from May to September or October; thus, increases fuel flammability. Consequently, fires from natural (i.e., lightning) and anthropogenic (i.e., grazing management) sources are common during the dry season [40]. In the southernmost part of the country, the subtropical grasslands, i.e., known as Pampas, exists under a humid climate and borders the Atlantic Forest, which also has higher precipitation throughout the year, i.e., an annual average of 1800 mm. Consequently, the fires are very low in Pampas and Atlantic Forest biomes [41]. The 2019 fires resulted in a diplomatic crisis and controversy [33].
The third site constituted eastern Australia (Queensland, New South Wales, Victoria and Tasmania), located at latitudes 44.092° S to 9.872° S and longitudes 138.177° E to 153.864° E. The dry seasons are typically divided into early (i.e., April–July) and late (August–November) dry seasons in northern Australia [42]. Generally, eastern Australia is characterised by tropical Savannas and tussock grasslands (mainly in Queensland), and temperate forests in southeastern Australia. Both Savannas and grasslands burn extensively, on an annual basis, between March and December [43], as a result of declining rainfall from ~2000 mm to <400 mm and anthropogenic activities. Occasionally, i.e., around November–December, fires may be lit naturally by lightning due to the onset of monsoonal conditions [44]. The 2019 fires over temperate forest were unprecedented and reportedly the worst (i.e., largest) fires since the Black Friday fires in 1939 [35,45]. The fire season, in this region, starts from September to February.

3. Materials and Methods

3.1. Data

3.1.1. Fire Parameters

Moderate Resolution Imaging Spectroradiometer (MODIS) Burned Area (MCD64A1) and Global Monthly Fire Location (MCD14ML) products at 500 m and 1 km [37,46], respectively, were used to characterise the wildfires at the three study sites, i.e., western USA, Brazil and eastern Australia. Specifically, burned area (BA), burn date (BD) and Fire Radiative Power (FRP) were used to determine the extent of the burned areas (km2), the date of burning (DOY) and the fire intensity (i.e., FRP, MW), respectively. The MCD64A1 product provides monthly global BA with per-pixel quality information. This product is derived using the Collection 6 (C6) algorithm that uses a combination of Level 2G daily surface reflectance products (i.e., MOD09GHK and MYD09GHK) at 500 m spatial resolution, Level 3 active fire products (MOD14A1 and MYD14A1) at 1 km replicated to 500 m, and the most recent MODIS annual land cover product (i.e., MCD12Q1) at 500 m resolution. Generally, the C6 algorithm characterises burned and non-burned pixels based on persistent changes identified from a time series of burn-sensitive vegetation indices. Then, the spatial and temporal active fire information and burn-sensitive vegetation indices are used to generate dynamic thresholds that are applied to the composite data to determine if the pixel is burned or unburned. The BD is a single data layer consisting of the day-of-year (DOY) on which the burn occurred [37,46,47]. Collection 6 BA algorithm is an improvement of Collection 5.1 MCD64A1 and Collection 5.1 MCD45A1 mapping algorithms. According to Giglio et al. [47] and Humber et al. [48], MCD64A1.006 has a better detection rate for small burns and has reduced temporal uncertainty and extent of unmapped areas.
On the other hand, the MCD14ML product consists of geographic locations (i.e., centroids of 1-km pixels) of daily (i.e., 24-h) active fires and their FRP, based on an approach by Wooster et al. [28] and Wooster et al. [49], detected by MODIS sensors on-board Terra and Aqua satellites, at the time of the satellite overpass, based on the Collection 6 algorithm. The Collection 6 algorithm identifies one or more actively burning fires based on native brightness temperatures from MODIS bands centred at 4 μm, 11 μm and 12 μm and reflectance centred at 0.65 μm, 0.86 μm and 2.1 μm for daytime observations. On the other hand, FRP estimation is based on spectral radiances of a fire pixel and non-fire (i.e., background) pixels in the mid-infrared (MIR) band. Further details can be found in Wooster et al. [28].
Using 2500 images from Advanced Spaceborne Thermal Emission and Reflection Radiometer (ASTER), Giglio et al. [37] found the improved performance of the C6 AF algorithm. Specifically, the authors found reductions in omission errors over large fires, and commission error rates, associated with small forest clearings, in the Brazilian Amazon and other tropical ecosystems relative to previously reported errors by Schroeder et al. [50] and Cheng et al. [51]. The BA and AF products were accessed from Google Earth Engine (GEE) and LANCE Fire Information for Resource Management System (FIRMS, https://earthdata.nasa.gov/data/near-real-time-data/firms), respectively. AF points with < 10% detection confidence were discarded from the analysis.

3.1.2. Environmental Parameters

Vegetation forms the primary fuel load for wildfires. Thus, their frequency and intensity are influenced by vegetation availability, type and condition in a particular period [52]. In this study, the vegetation cover type was used to assess the extent of destruction caused by wildfires on the ecosystems. Specifically, the Vegetation cover types at 300 m spatial resolution were derived from the European Space Agency (ESA) Climate Change Initiative—Land Cover (CCI-LC) of 2018 [53]. The ESA CCI-LC was reclassified into five broad vegetation cover type classes (see Figure 1), namely, Cultivated land (CL), Forest cover (FC), Shrubland (SL), Grassland (GL) and other vegetation covers (OVC), while non-vegetation classes were discarded. The ESA CCI-LC is generated at a spatial resolution of 300 m, from global daily reflectance measurements acquired by MEdium Resolution Imaging Spectrometer (MERIS), Advanced Very High Resolution Radiometer (AVHRR), Satellite Pour l’Observation de la Terre Vegetation (SPOT-VGT), PROBA-Vegetation (PROBA-V) and Sentinel-3. The classification of land cover is based on the United Nations Land Cover Classification System (UN-LCCS) containing 37 classes, unsupervised and supervised algorithms and time-series data [53]. The use of multi-temporal, multi-sensor data allowed backwards and forward cross-checking to detect and verify land cover changes and eliminate false changes occurring due to inter-annual variability [54,55]. The ESA CCI-LC land cover product for 2018 was downloaded from http://maps.elie.ucl.ac.be/CCI/viewer/download.php.
Moreover, the vegetation condition index (VCI) [56] from the Copernicus Global Land Service (CGLS, https://land.copernicus.eu/) was used to analyse the changes in vegetation conditions (%) for a period coinciding with the period of the wildfires. VCI is a measure of the current vegetation condition compared to historical maximum and minimum normalised difference vegetation index (NDVI). As Kogan [57] note, the VCI better portrays the impacts of weather dynamics on relative vigour of the vegetation. Consequently, VCI is one of the widely used satellite-based indices for detecting the onset, intensity, duration, and impacts of drought [56,58,59,60]. CGLS VCI is provided at 1-km spatial resolution and based on a synthesis of 10-day NDVI:
V C I i = N D V I i N D V I m i n N D V I m a x N D V I m i n × 100
where V C I i is the VCI for period i, N D V I i is the observed 10-day NDVI values over period i and N D V I m a x and N D V I m i n are the long-term maximum and minimum NDVI, respectively.

3.1.3. Meteorological Parameters

The Modern-Era Retrospective Analysis for Research and Applications, version 2 (MERRA–2) is a NASA reanalysis product using a new version of the Goddard Earth Observing System Data Assimilation System version 5 (GEOS-5). The Global Modelling and Assimilation Office (GMAO) uses its GEOS-5 atmospheric data assimilation system (ADAS) to synthesise the different observations collected over the satellite era into a dataset that is consistent over time as it uses a fixed assimilation system. MERRA-2 is created with version 5.2.0 of the GEOS-5 ADAS with a 0.5° latitude × 0.625° longitude × 72 layers model configuration [61]. The bottom 32 layers are terrain following, while the remaining model layers from 164 hPa to 0.01 hPa are constant pressure surfaces [62]. MERRA-2 assimilates bias-corrected AOD from the Moderate Resolution Imaging Spectroradiometer (MODIS) and the Advanced Very High-Resolution Radiometer (AVHRR) instruments [63,64]. More details on MERRA-2 can be found in Gelaro et al. [61]. In this work, MERRA-2 is used to produce precipitation (Prec.) and wind speed (Ws) data, averaged over the study sites.
Relative humidity (RH) and surface temperature (Ts) were measured using the Atmospheric Infrared Sounder (AIRS). AIRS Infrared Radiances (IR) have a spatial resolution of 13.5 km at nadir, while AIRS Visible and Near-Infrared Radiances have a spatial resolution of 2.3 × 1.8 km (across-track, along-track). With 2378 spectral channels, AIRS has a spectral resolution more than 100 times greater than previous infrared sounders and provides more accurate information on the vertical profiles of atmospheric temperature and moisture. MERRA-2 and AIRS data were accessed from the Geospatial Interactive Online Visualization and Analysis Infrastructure (Giovanni, http://giovanni.gsfc.nasa.gov) and averaged hourly (i.e., Prec. and Ws) and daily (i.e., Ts and RH) for further analysis.

3.2. Spatial Patterns of Fires

Anselin’s local Moran’s I statistic [65] is widely used for identifying statistically significant local spatial patterns (i.e., association, dispersion or randomness) and types of spatial clusters. A positive (i.e., >0) Moran’s I statistic indicates clustered fires or a positive correlation in the spatial distribution of fires. In contrast, negative values (i.e., <0) indicate dispersed fires or a negative correlation in the spatial distribution of fires, and the values closer to zero indicate randomly distributed fires. In this study, spatial points of active fires (AF) and associated FRP, i.e., representing centroids of MODIS 1-km pixels, were used to identify spatial patterns and types of clusters in western USA (i.e., August–September 2018), Brazil (i.e., August–September 2019), and eastern Australia (i.e., November–December 2019). The z-score and p-values for each AF (i.e., the point representing centroid for 1-km pixel) were used to test the null hypothesis (H0) of no spatial association between the AF. Consequently, two types of statistically significant spatial clusters, i.e., high–high (HH) and low–low (LL), and two statistically significant spatial outliers, i.e., high–low (HL) and low–high (LH) were identified. The HH (LL) clusters indicate several AF with similar high (low) intensity (FRP, MW) values, while the outliers, HL (LH) indicate a high (low) AF surrounded by several low (high) intensity values. Moreover, five fire categories proposed by Ichoku et al. [36] based on FRP (to facilitate fire rating by strength), i.e., category 1 (<100 MW), category 2 (100 to <500 MW), category 3 (500 to <1000 MW), category 4 (1000 to <1500 MW) and category 5 (≥1500 MW), were adopted in this study, to characterise the strength of fires (i.e., fire intensity) at the three study sites.

3.3. Statistical Analysis

A non-parametric test, i.e., Kruskal-Wallis ANOVA, was used to determine whether the fire intensity differed according to different vegetation types. Specifically, we tested the null hypothesis (H0) that there is no significant difference between vegetation type-specific fire intensity, i.e., FRP per vegetation type. Moreover, Pairwise-Wilcox Test was used to determine whether class wise-comparisons of vegetation type-specific fire intensities (FRP) were different.

4. Results and Discussion

4.1. Analysis of Active Fires and Their Intensity over Various Vegetation Types

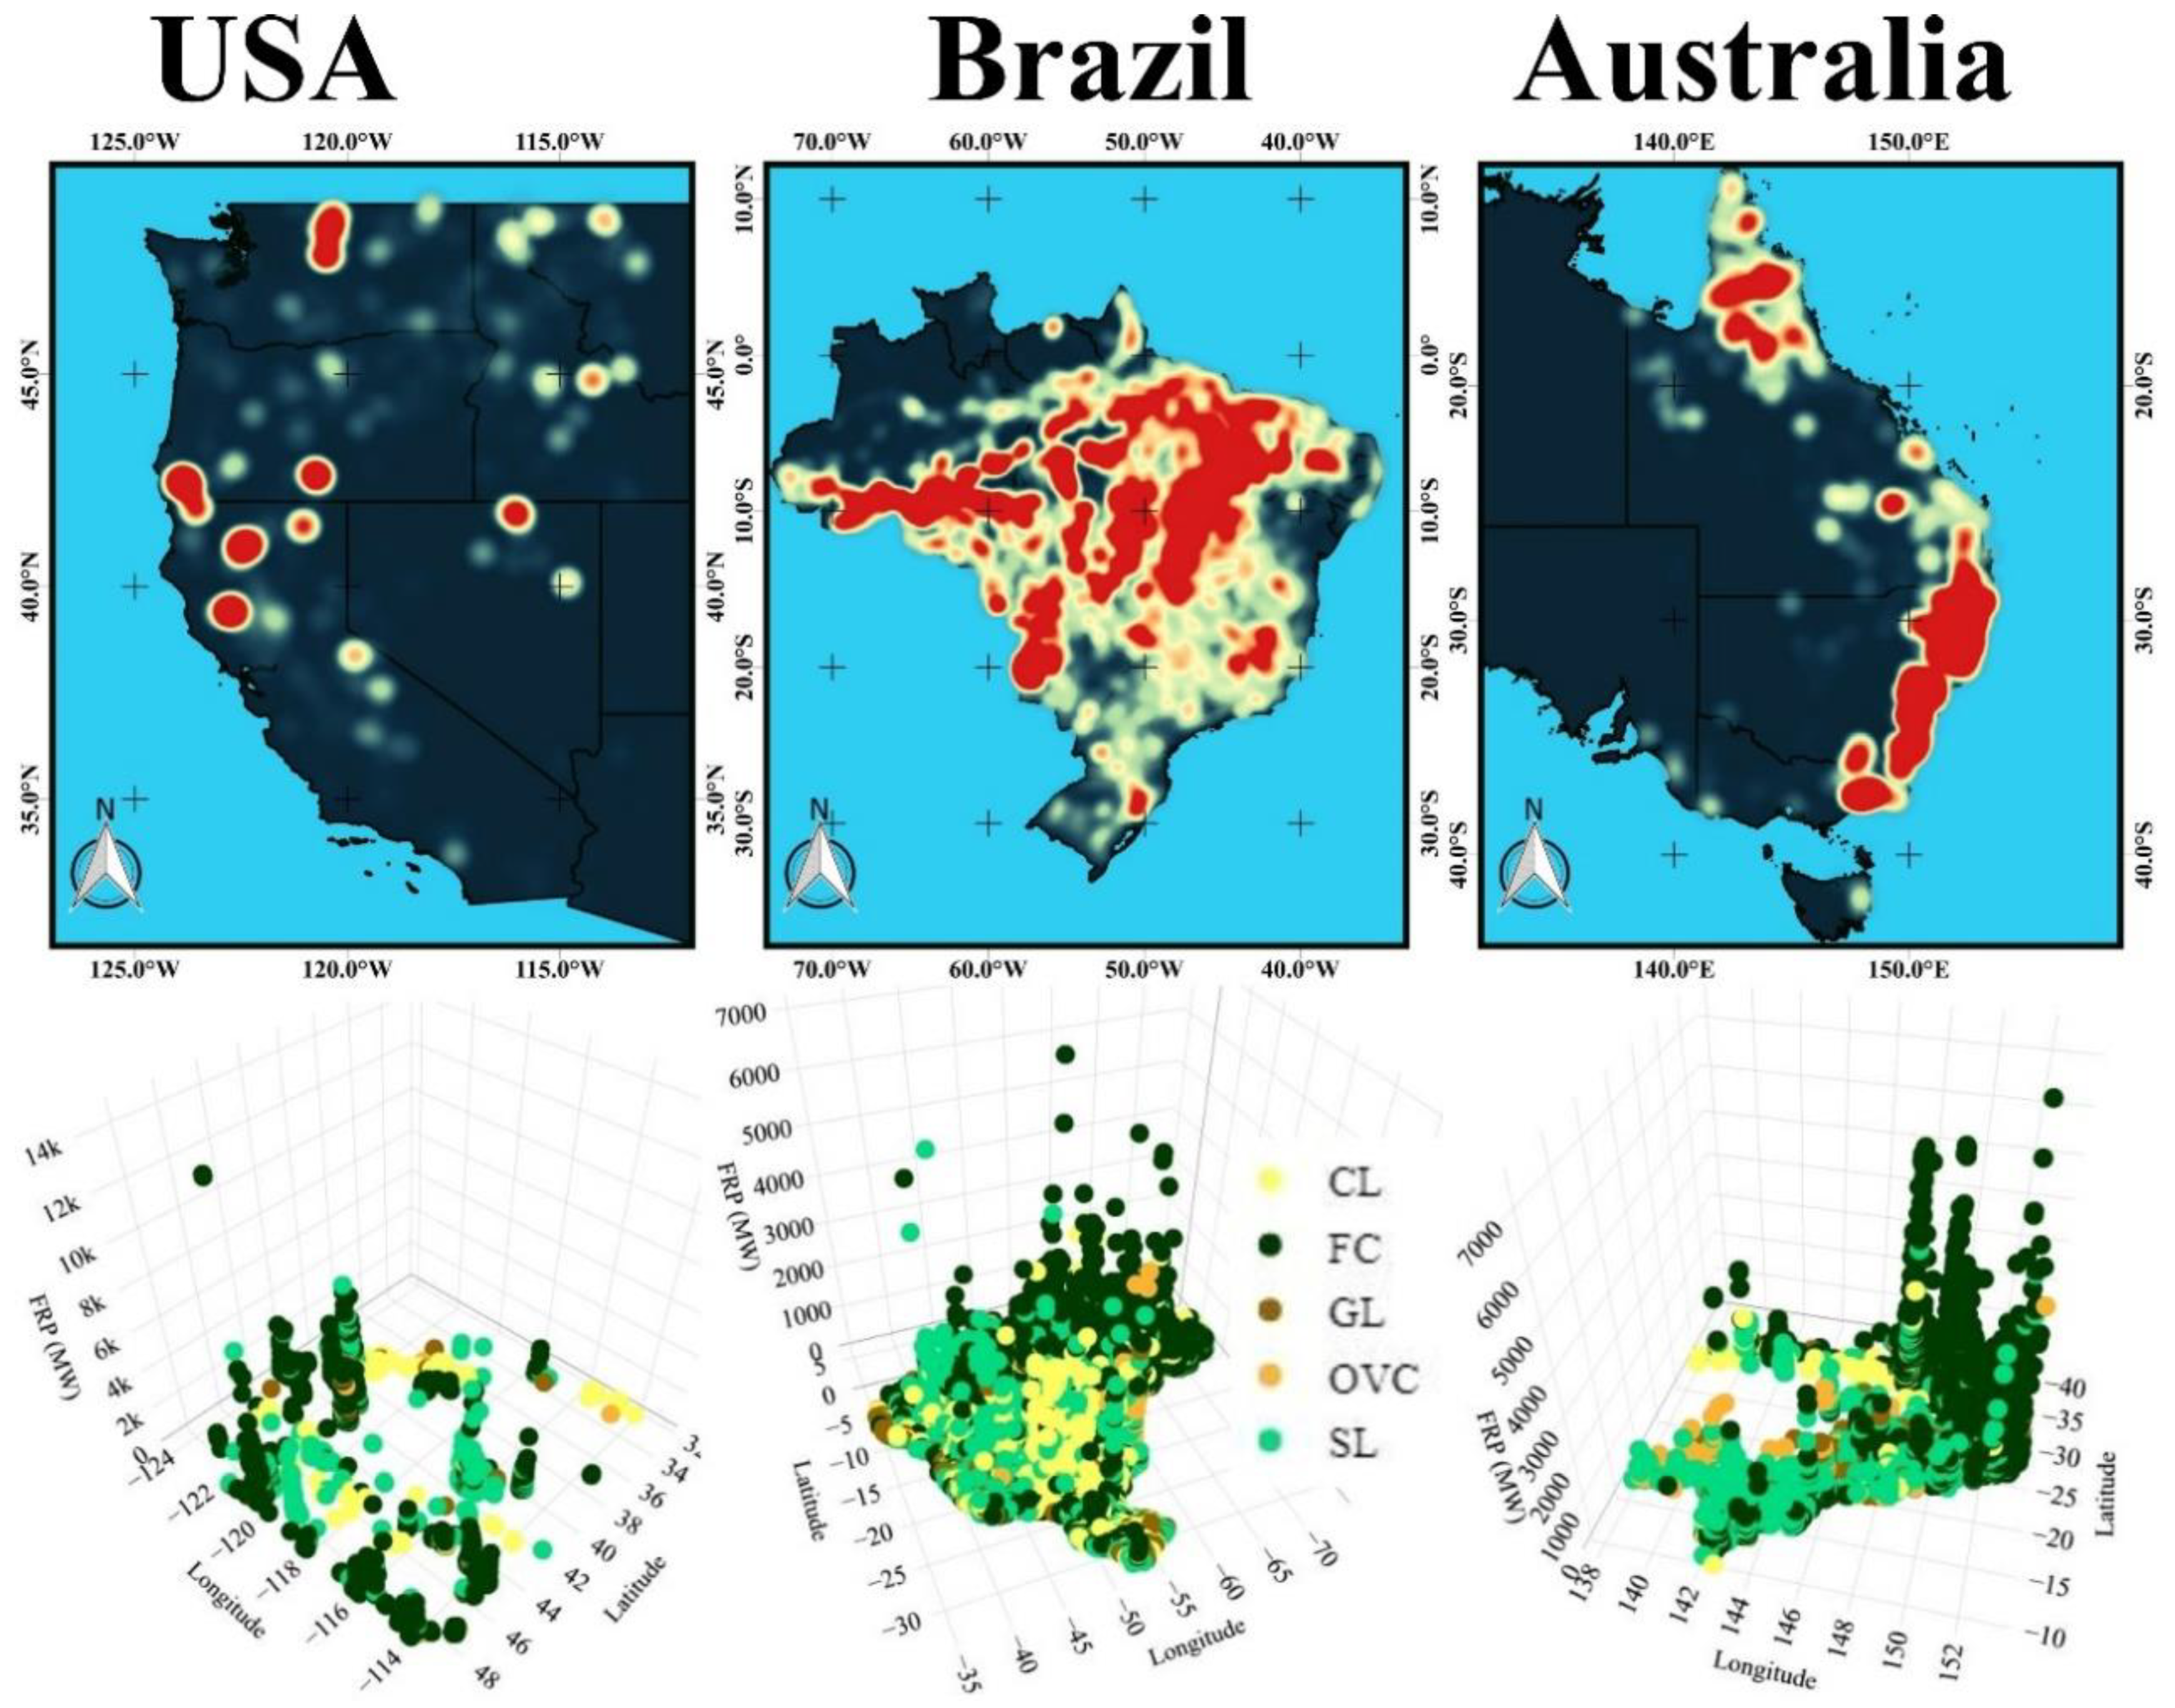
The results of the spatial distribution of Active Fires (AF) and Fire Radiative Power (FRP, MW) for the three study sites (Figure 2) show the vast distribution of high-density fires across all study sites. These dense fires indicate the areas (i.e., hotspots) where these fires were intense and became disastrous. For example, the fires with the highest FRP were found around 40° and 48° N and 120° W (i.e., Washington and California) in the western USA, 10° S and 54° W in Brazil and 30° S and 150° E (i.e., New South Wales) in eastern Australia. Statistically, Moran’s I statistic show the presence of statistically significant clusters and outliers, at all the three sites, at 95% confidence level (see Table 1). The results show that the most intense fire clusters (HH), with an average FRP of 762.02 MW (i.e., category 3) were recorded in western USA, followed by eastern Australia with an average FRP of 494.37 MW (i.e., category 2) and Brazil with an average FRP of 356.77 MW (i.e., category 2). In contrary, the less intense fire clusters (LL) with an average of 7.45 MW (i.e., category 1) were recorded in Brazil, followed by Australia with an average of 18.13 MW (i.e., category 1) and the USA with an average of 59.27 MW (i.e., category 1).
It is also evident from the summary statistics (Table A1) that forest cover (FC) had the highest fire intensity (FRP, MW), followed by shrublands (SL) across all sites, then cultivated land (CL) in Brazil and Australia and GL in the USA. The higher fire intensity in FC and SL can be attributed to highly combustible tree crown fuel load characterised by leafy-closed canopies and thin branches. Such fires can rapidly propagate, given favourable conditions, to nearby crowns especially in areas with non-fragmented vegetation types such as the Forests. This is consistent with Vadrevu et al. [66], who found that higher fire intensity for closed broadleaved evergreen and semi-deciduous forests in India than other vegetation cover types based on empirical cumulative distribution functions. Depending on their severity (not studied here), fires may result in higher tree mortality and permanent land-use conversion, especially in Brazil, where food production needs (i.e., agricultural expansion) surpass conservation [41]. Similarly, the number of AF over FC at the three sites were the highest, followed by SL and CL for the western USA and Brazil and GL in eastern Australia (Table A1). In contrast, grassland (GL) and other vegetation covers (OVC) showed the lowest fire intensity (FRP, MW) across all sites. This observation is expected since herbaceous vegetation types such as GL have relatively lower above-ground-biomass (AGB) than tree cover types such as FC and SL. Overall, the results indicate that the number of AF and fire intensity characteristics at the three sites varied by vegetation cover type. In fact, the null hypothesis that there is no significant difference in vegetation type-specific fire intensity was rejected at 95% confidence level (p-value < 2.2 × 10¹⁶) at all sites.
The class-wise comparisons of vegetation type-specific fire intensity using Pairwise Wilcox test (Table 2) reveal even more exciting results, showing a significant difference in fire intensities between CL vs. GL, GL vs. FC, FC vs. OVC and FC vs. SL across all sites. In contrast, the fire intensities between CL vs. FC and GL vs. SL were significantly different in Brazil and eastern Australia only (see Table 2). These differences were mainly driven by different landscape compositions, such as different vegetation types and conditions, temperature and various sizes of the fires at the three sites. For example, the areas with a high number of AF in Brazil and eastern Australia are characterised by an extensive mosaic of CL, GL, SL and FC, while the predominant AF in western USA was over FC and SL. Therefore, fire intensity over GL was not significantly different from SL and OVC in western USA and OVC only in eastern Australia due to the low abundance of these vegetation types. The observed differences were due to relatively lower herbaceous biomass in GL and CL, which had corresponding lower intensity than FC and SL, which are characterised by thick, woody stems and branches and high density of leaves. When drier, these woody vegetation characteristics result in higher flammability and combustibility; thus, the propagation of wildfires to the broader spatial extent subject to fuel availability and favourable meteorological conditions. Although Brazilian fires were found to be intense, i.e., category 2, in this study, a recent related study [33] found that it is within long-term normal, while Kelley et al. [67] showed that meteorological conditions had an insignificant role, i.e., <7%, in their propagation.
Previous studies [68,69], based on MCD14ML.005, reported possible omission errors in the detection of active fires as a result of clouds and smoke plumes. It is therefore acknowledged that these errors are inevitable; however, expected to be reduced due to improvements in MCD14ML.006 product [37] used in this study. Other sources of error, such as the omission of smaller fires, are probable; however, they were not critical in this study since the focus was on major wildfires characterised by large fires that are detectable at MODIS 500 m spatial resolution. Contrarily, errors in the spatial location of AF and detection efficiency of sensors may be problematic for fire authorities seeking to locate and extinguish actively burning fires and identify the burning vegetation types for habitat-specific fire fighting, to protect endangered fauna and flora. For example, the exact locations of AF are unknown, since each AF point represents the centroids of 1-km MODIS pixels; thus, several fires may be burning within 1-km pixel as the size of the fire relative to pixel size is always small [50]. Moreover, Hyer and Reid [70] showed that using MODIS, an accuracy of identifying the correct vegetation type of a single AF is approximately 88%. This error may be exacerbated by classification errors in land cover maps. Although algorithmic advances for characterising AF at Landsat resolution were achieved [71], the current temporal configurations (i.e., repeat cycle of ≥ 5 days) of medium to high resolution sensors limits their operational application for fire management.

4.2. Spatio-Temporal Variations in the Burned Area over Various Vegetation Types

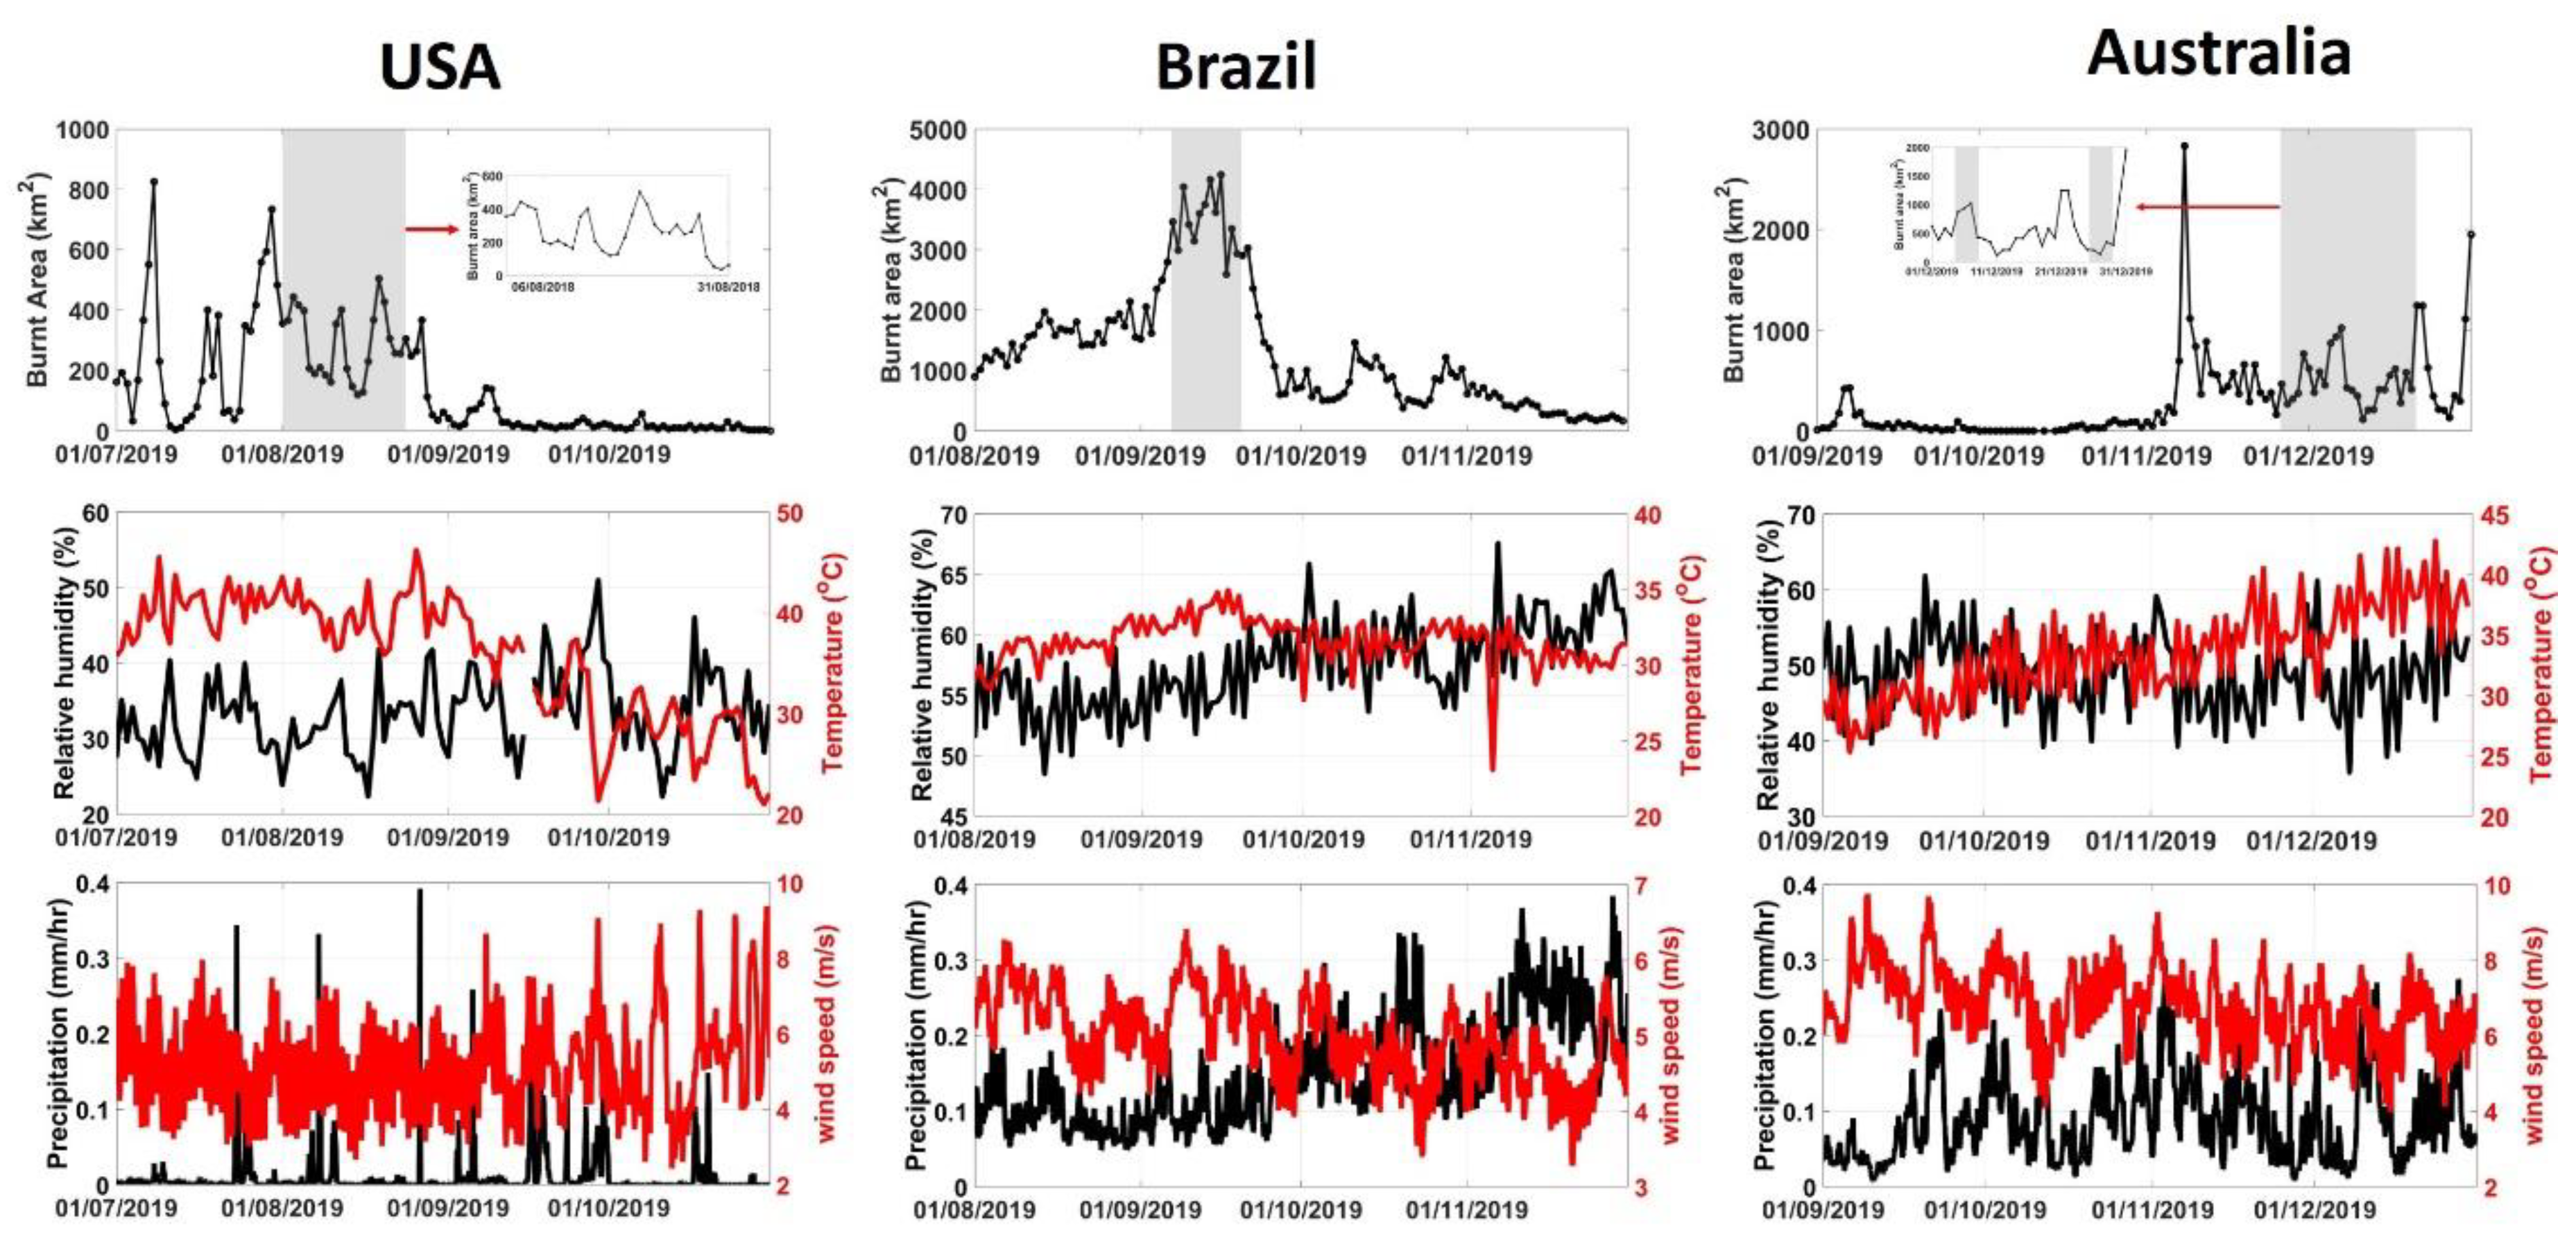
The results (Figure 3) show various peaks in the burned area for specific dates. In western USA, three prominent peaks were observed in August 2018, with the highest BA per day of ~500 km2. In contrast, the BA, in Brazil, increased consistently in August 2019 and peaked to the highest (i.e., ~4300 km2) in September 2019. Although extensive BA are common in Brazil [68,72], this finding is consistent to Lizundia-Loiola et al. [33], who found that the total BA from these fires was more than twice the previous year (i.e., 2018); however, it was similar to an average BA over 17 years. Therefore, the 2019 Brazilian fires BA accumulation and distribution were not extraordinary. On the other hand, the highest peaks, of up to ~2700 km2 in BA per day, were recorded in November and December 2019 in eastern Australia. Comparatively, the peaks in BA per day in the western USA were the lowest among the three sites, followed by eastern Australia, while the highest peaks were recorded in Brazil. The observed higher daily BA can be attributed to its vast area with high continuous fuel load relative to other sites. Moreover, August and September are at the end of the dry season in most of Brazil, providing favourable conditions, i.e., drier and expansive fuel load, for propagation wildfires. Since these fires are mostly anthropogenic, i.e., mainly related to common clearing activities and pasture management [67], little or no effort is taken to combat their spread until they encroach on protected areas. On the other hand, western USA fires were confined to smaller areas, attributable weaker winds (Ws) (i.e., ranging between 4 to 6 m s−1, see Figure 3 and Figure A1) that allowed prolonged burning of various vegetation types. Similar to Brazil, the fires in the western USA occurred mainly towards the end of the season, when preceding higher temperature have dried-out the vegetation. On the other hand, the fluctuating daily BA in eastern Australia, i.e., several peaks (maxima) and troughs (minima), can be attributed to varying fuel (i.e., vegetation) type and conditions. For example, the observed higher temperature (i.e., 30 °C to 40 °C) increased evapotranspiration, resulting in drier twigs and leaves especially in eucalyptus forest, thus supporting propagation of fires and higher BA [45]. Conversely, patches of rainforests impede the spread due to higher moisture content [45]. Across all sites, Ws were weak (i.e., 4 to 8 m s−1); thus they cannot be considered an important driver to the propagation of these fires (during the period under study).
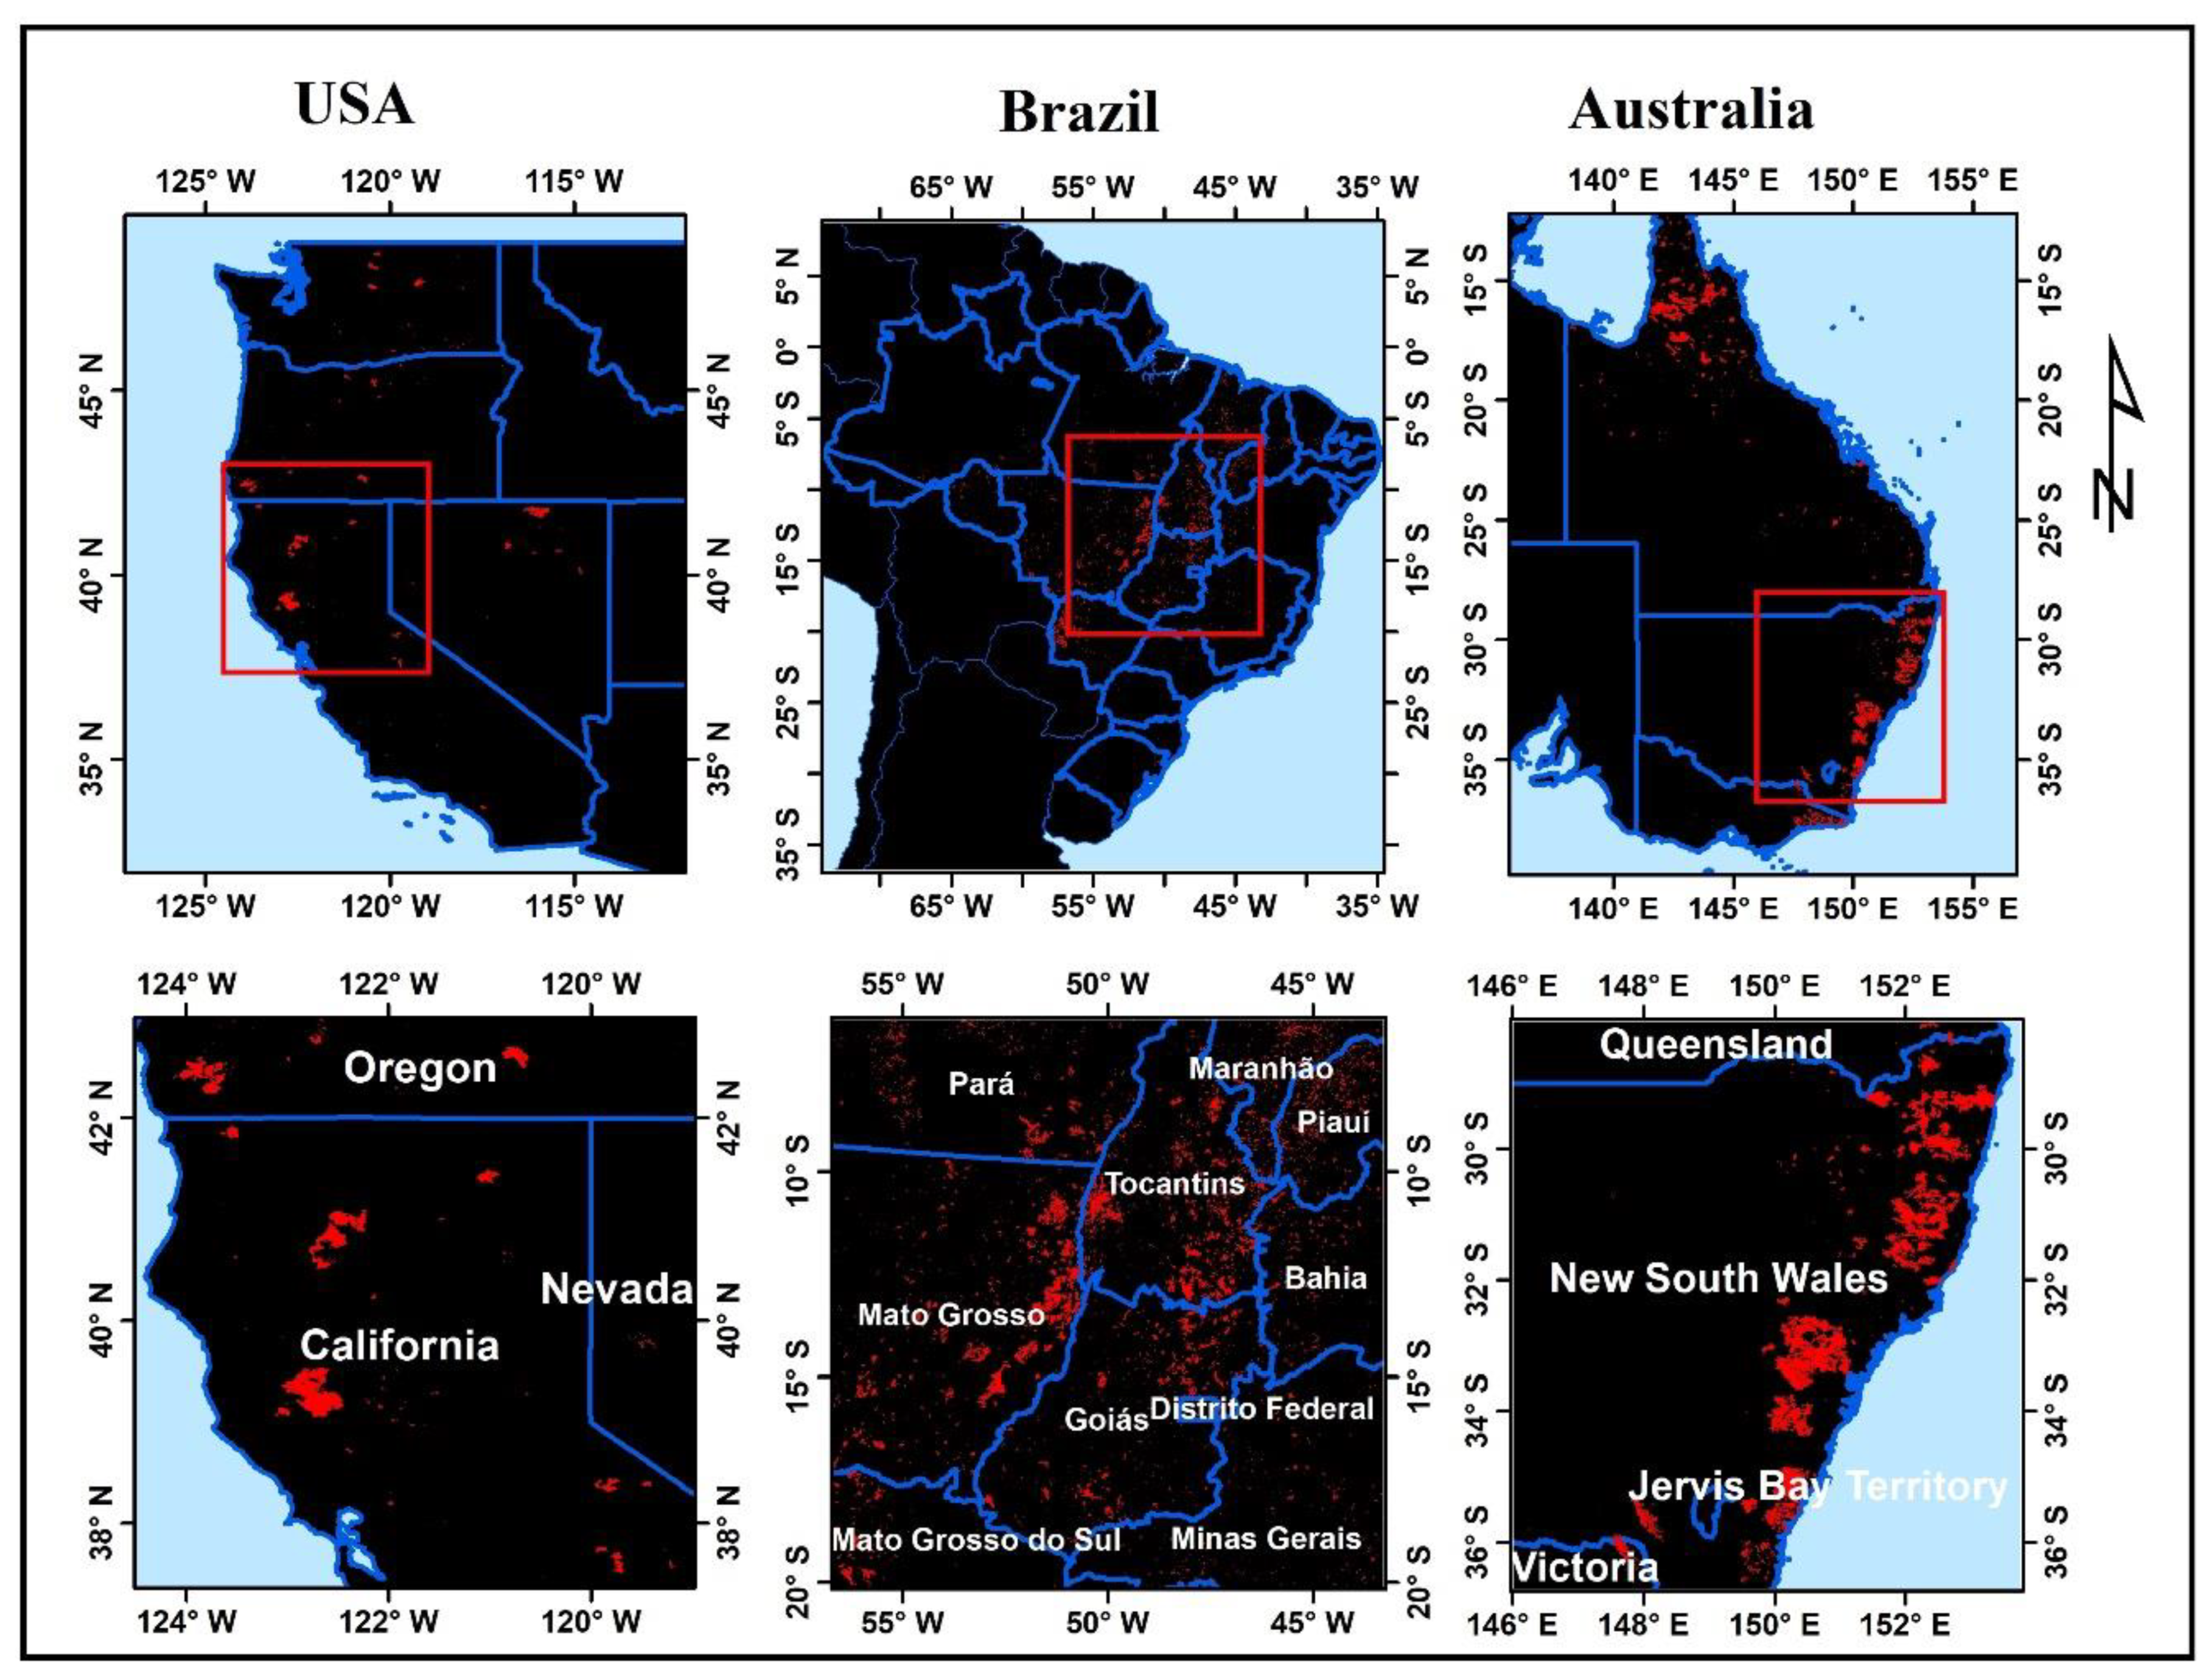
Consequently, the fire scars (see Figure 4) were also variable per site. In agreement with the results in Figure 3, the fire scars were vastly distributed in Brazil and eastern Australia. In contrast, the fire scars were the lowest and widely scattered in western USA. In Brazil, the fire scars correspond to areas characterised as Cerrado (i.e., Brazilian Savanna) and fire-sensitive ecosystems such as the Amazon and Atlantic rainforests [52]. This is expected since these biomes occupy the majority of Brazilian territory, i.e., more than 70%. This finding is consistent with Moreira de Araújo et al. [68], who found the largest proportion of burned areas within Brazilian Cerrado and Amazon Rainforest, i.e., 73% and 14%, respectively. While Cerrado vegetation is more adapted to regular fires, these wildfires may result in considerable damage and loss of the Amazon and Atlantic rainforests which are not tolerant to fires [52].
As can be observed in Figure 5, SL, characteristic of Brazilian Cerrado vegetation, burned extensively with a BA of ~28,000 km2, followed by FC with ~14,000 km2, which also had the highest number of AF, then CL with ~8000 km2 of BA. It is anticipated that the fires, commonly used for grassland management, hunting activities and ‘slash and burn’ agricultural practices in Brazil [52,73], spread into adjacent SL and FC, where they became difficult to control and widespread. However, the higher number AF in FC suggests relatively smaller and isolated fires that could not spread to more extensive areas due to constantly wet conditions in the Amazon rainforest. This is consistent with Lizundia-Loiola et al. [33], who found newly burned pixels in the Amazon tropical forest in the 2001–2019 period, linked to new policies supporting agricultural expansion. Therefore, relatively lower BA over FC in Brazil can be attributed to fuel availability rather than flammability, as the forests have a deeper root system to withstand dry conditions. Nevertheless, the amount of FC loss to wildfires, in Brazil, was marked and similar to that in eastern Australia, i.e., ~16,000 km2. This is alarming considering that the entire Brazilian territory was analysed, relative to only a portion, i.e., eastern Australia. Similarly, FC was the most extensively burned vegetation type in the western USA with ~1800 km2. However, it was markedly lower (i.e., six to seven times lower) than the burned FC in Brazil and Australia, respectively. In western USA and eastern Australia, the BA per vegetation type mostly corresponded to the high number of AF and higher fire intensity. It is expected that the antecedent higher Ts and Ws and low RH resulted in a rapid loss in canopy moisture and dry-up of the herbaceous plant components such as leaves, branches and grasses [74] (see Figure A2). At the time of the fires, higher Ts (i.e., 30 °C to 40 °C) coupled with lower Prec. (i.e., <0.4 mm hr−1), and availability of continuous fuel (Figure 1 and Figure 3) influenced the establishment of new fires, propagation and intensity of the fires in FC, SL and GL, as evidenced by the higher number and clustering of AF and fire intensity (Figure 2, Table 1), and extensive losses in vegetation cover (Figure 5). In fact, at the three sites, moderate to extreme dry (or drought) conditions were evident (Figure A2), causing drier leaves. This is consistent with Nolan et al. [45], who showed that the widespread fires in eastern Australia were driven by dry fuel conditions, caused by prolonged drought, i.e., before and during the fire. In another study, Turco et al. [75] show that fire occurrence is significantly related to drought conditions. Similarly, Moreira de Araújo et al. [68] found that the higher concentration of fires in 2007 and 2010 over Brazilian Cerrado and Amazon Rainforest was related to low rainfall resulting from La Niña climatic pattern. Contrarily, Kelley et al. [67] showed that the 2019 Brazilian fires had a low meteorological influence, i.e., <7%, and concluded that land management was the most probable driver of the increase in the burned area. Overall, the interaction of various factors, i.e., meteorological, vegetation availability and conditions and human activities influenced the ignition, flammability, combustion, spatial patterns and intensity of wildfires at the three sites.
Although not studied here, the influence of topography on wildfires is considerable. For example, topographic variables such as elevation influence the temperature, while aspect influences the availability of moisture and heat, and slope influences the vegetation types, intensity and rate of spread of fires [76]. Moreover, Estes et al. [76] showed that lower slope positions have a higher probability of experiencing lower flame lengths and lower rates of spread in a backing downhill fire. Future studies should integrate more variables including meteorological, vegetation conditions and topographic variables. Moreover, there is a possibility of exclusion of smaller fires MODIS (MCD64A1, 500 m) product [19,77,78]; therefore, the BA and associated burned vegetation types, in this study, may have been underestimated considering vast climatic regions studied. In fact, a recent study, i.e., Boschetti et al. [79] found the lowest errors in Boreal Forest, Tropical and Temperate Savanna, and the highest errors in the Tropical Forest, Temperate Forest and Mediterranean biomes. The highest errors in these biomes were attributed to small and temporally non-persistent burns. Therefore, research into operational methods for characterising BA from higher resolution data such as from Landsat 8 or Sentinel-2 should be prioritised to enable representative BA estimate to support fire management and recovery efforts. Moreover, higher resolution and detailed land cover products from sensors such as Landsat-8 OLI Sentinel-2 MSI should be considered in future to characterise burned vegetation types. In the future, we will study the longer periods to characterise meteorological, fuel and environmental parameters before, during and after the wildfires as well as multifactor correlation analysis incorporating topographic (i.e., slope, aspect and elevation). Due to vast fire regimes at the sites chosen for this study, conclusions about local drivers of these wildfires cannot be made; thus, further exploration in future studies is needed.

5. Conclusions

This study found that AFs were densely clustered alongside the coast in the western USA and eastern Australia, while they were widely spread across the Brazilian landmass. The western USA had relatively lower BA and short-term burning. In contrast, Brazilian and Australian AF were denser, the BA per day was relatively higher and the fire scars were widespread, attributable to various vegetation distributions, types and drought conditions as well as increased human activities. This is consistent with Nolan et al. [45], and Lizundia-Loiola et al. [33]. Moreover, the highest FRP, at all sites, emanated from areas characterised mainly by FC, and SL in the western USA and eastern Australia and FC, SL, GL and CL in Brazil. In fact, the study found that the FRP over FC was significantly different (p < 2.2 × 10¹⁶) from other vegetation cover types in all study sites. This finding is consistent with Vadrevu et al. [66]. Moreover, this finding implies a more significant loss of carbon stocks and forest ecosystems, which may take a more extended period to recover or result in permanent deforestation and loss of habits especially in fire-sensitive biomes such as Amazon and Atlantic Forests. This necessitates habitat-specific wildfire disaster management and efficient firefighting resource allocation, to safeguard the rare and endangered fauna and flora and ecosystem services. Consequently, the BA per vegetation cover type was the highest in Brazil, owing to its vast area, widespread fires and high number of AF, driven by human interference and influenced by changing policies that favours agricultural expansion. Overall, this study contributes to a better understanding of wildfire behaviour and underlying environmental and meteorological causal factors in various regions, towards better habitat-specific wildfire disaster management plans, for better disaster preparedness, mitigation and recovery.

Author Contributions

Conceptualisation, M.K. and L.S.; methodology, M.K. and L.S.; formal analysis, M.K. and L.S.; writing—original draft preparation, M.K. and L.S.; writing—review and editing, M.K. and L.S.; visualisation, M.K. and L.S. All authors have read and agreed to the published version of the manuscript.

Funding

The APC was funded by the South African National Space Agency.

Acknowledgments

The following organisations, individuals and resources are acknowledged: South African National Space Agency (SANSA), Copernicus Global Land Service (CGLS) for providing Global Land cover data at no cost, Google Earth Engine™ for providing big data cloud processing platform at no cost, National Aeronautical and Space Administration (NASA) for providing MODIS products at no cost, R-Statistics, Plotly and QGIS Development Teams, anonymous reviewers and the editor.

Conflicts of Interest

The authors declare no conflict of interest.

Appendix A

Table A1. Summary statistics indicating Minimum (Min), Maximum (Max), Mean and standard deviation (sd) for FRP and the number of AF (i.e., count) per vegetation type in USA (i.e., August–September 2018), Brazil (i.e., August–September 2019) and Australia (i.e., November–December 2019).
USABrazilAustralia
MinMaxMeansdAF CountMinMaxMeansdAF CountMinMaxMeansdAF count
CL6.2129874.31372520317560.712830,8270308891.6219655
FC3.814,37611533910,934069806215490,505074019324473,100
GL4.4.25551793491922.9248937.379.45462080857.486.1670
OV5.321551092011813.2419667.814862370358881.1239609
SL0718414436331230560654.610960,887040236212617,007
Figure A1. Average wind speed, Ws, and direction, Wd, in (a) the western USA, (b) Brazil and (c) eastern Australia.
Remotesensing 12 01803 g0a1
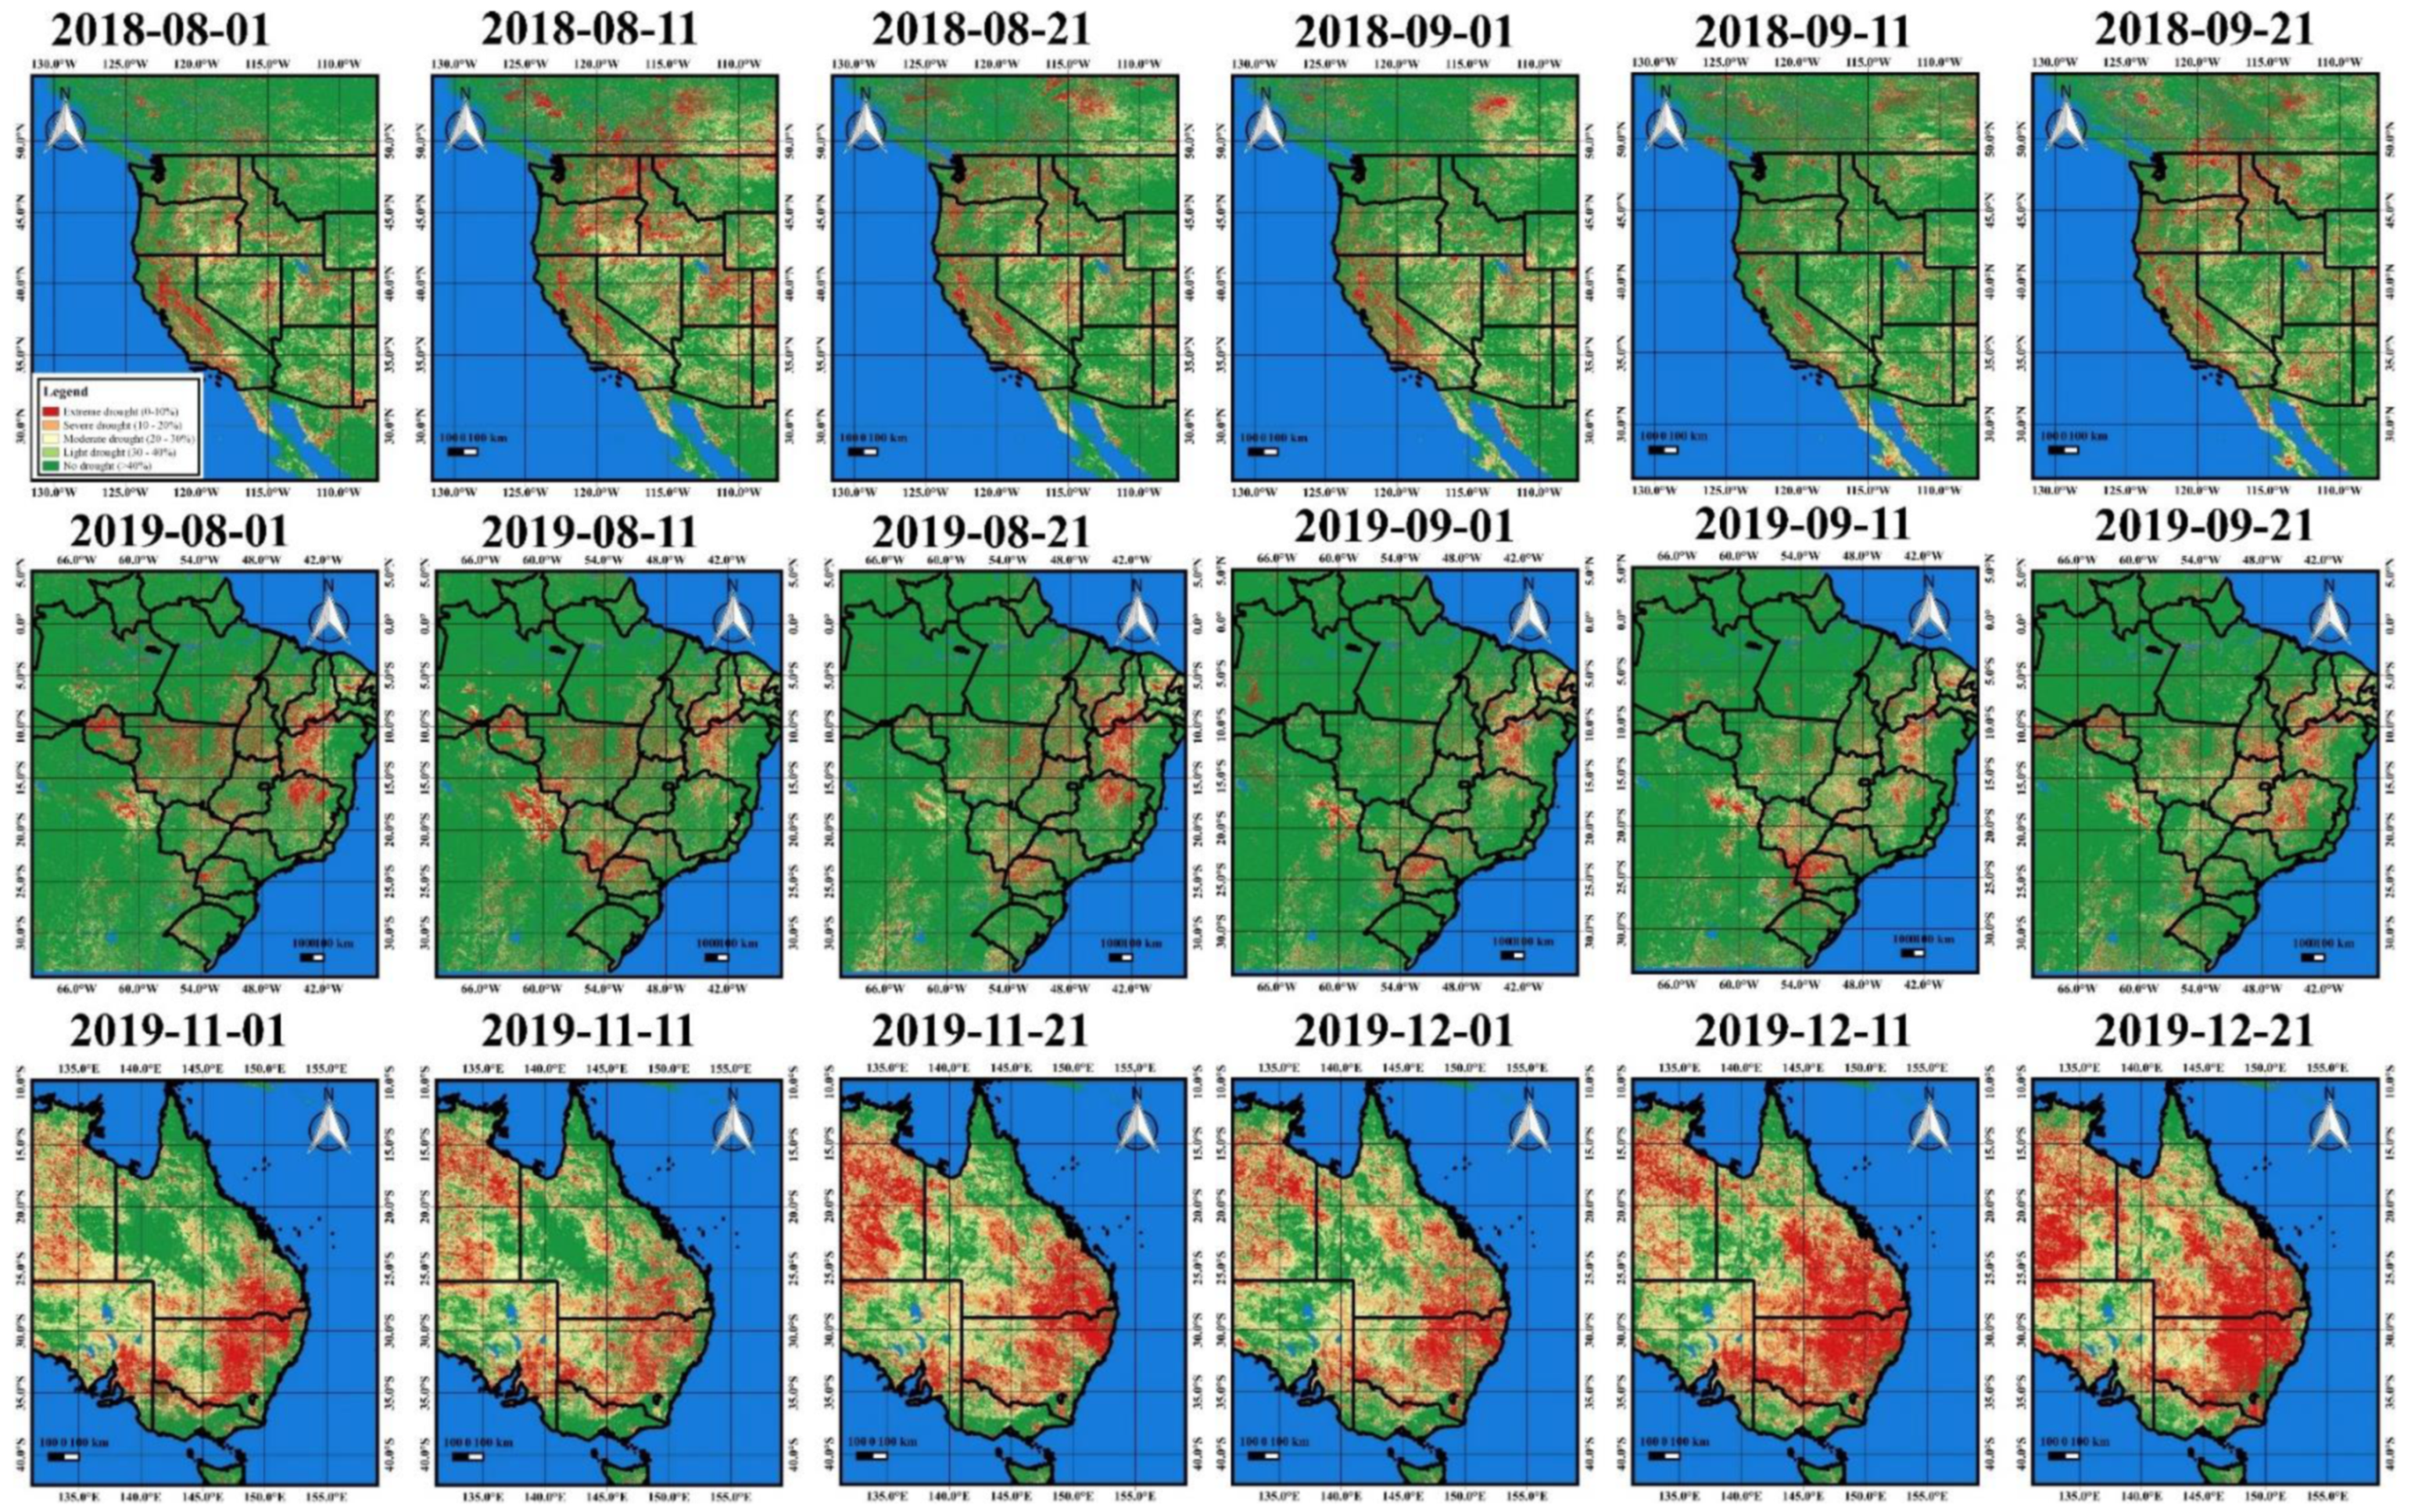
Figure A2. Vegetation conditions (represented by vegetation condition index, VCI) during the propagation of wildfires at the three study sites, i.e., USA (i.e., August–September 2018), Brazil (i.e., August–September 2019) and Australia (i.e., November–December).
Remotesensing 12 01803 g0a2

References

  1. Snyman, H. Short-term response of the encroacher shrub Seriphium plumosum to fire. Afr. J. Range Forage Sci. 2011, 28, 65–77. [Google Scholar] [CrossRef]
  2. Everson, C.S.; Everson, T. The long-term effects of fire regime on primary production of montane grasslands in South Africa. Afr. J. Range Forage Sci. 2016, 33, 1–9. [Google Scholar] [CrossRef]
  3. Adeyolanu, O.; Are, K.S.; Oluwatosin, G.A.; Ayoola, O.T.; Adelana, A. Evaluation of two methods of soil quality assessment as influenced by slash and burn in tropical rainforest ecology of Nigeria. Arch. Agron. Soil Sci. 2013, 59, 1725–1742. [Google Scholar] [CrossRef]
  4. Varma, A. The economics of slash and burn: A case study of the 1997–1998 Indonesian forest fires. Ecol. Econ. 2003, 46, 159–171. [Google Scholar] [CrossRef]
  5. Finlay, S.E.; Moffat, A.; Gazzard, R.; Baker, D.; Murray, V. Health Impacts of Wildfires. PLoS Curr. 2012, 4, 4. [Google Scholar] [CrossRef]
  6. Bowman, D.; Johnston, F. Wildfire Smoke, Fire Management, and Human Health. EcoHealth 2005, 2, 76–80. [Google Scholar] [CrossRef]
  7. Johnston, F.; Henderson, S.B.; Chen, Y.; Randerson, J.T.; Marlier, M.; DeFries, R.S.; Kinney, P.; Bowman, D.M.; Brauer, M. Estimated Global Mortality Attributable to Smoke from Landscape Fires. Environ. Health Perspect. 2012, 120, 695–701. [Google Scholar] [CrossRef]
  8. La Rosa, N.S.-D.; González-Cardoso, G.; Figueroa-Lara, J.D.J.; Gutiérrez-Arzaluz, M.; Octaviano-Villasana, C.; Ramírez-Hernández, I.F.; Mugica-Álvarez, V. Emission factors of atmospheric and climatic pollutants from crop residues burning. J. Air Waste Manag. Assoc. 2018, 68, 849–865. [Google Scholar] [CrossRef] [Green Version]
  9. Shikwambana, L.; Ncipha, X.; Malahlela, O.; Mbatha, N.; Sivakumar, V. Characterisation of aerosol constituents from wildfires using satellites and model data: A case study in Knysna, South Africa. Int. J. Remote Sens. 2019, 40, 4743–4761. [Google Scholar] [CrossRef]
  10. Shikwambana, L. Long-term observation of global black carbon, organic carbon and smoke using CALIPSO and MERRA-2 data. Remote Sens. Lett. 2019, 10, 373–380. [Google Scholar] [CrossRef]
  11. Sathaye, J.A.; Dale, L.L.; Larsen, P.H.; Fitts, G.A.; Koy, K.; Lewis, S.M.; Lucena, A.F. Rising Temps, Tides, and Wildfires: Assessing the Risk to California’s Energy Infrastructure from Projected Climate Change. IEEE Power Energy Mag. 2013, 11, 32–45. [Google Scholar] [CrossRef]
  12. Forzieri, G.; Bianchi, A.; e Silva, F.B.; Herrera, M.A.M.; Leblois, A.; LaValle, C.; Aerts, J.C.; Feyen, L. Escalating impacts of climate extremes on critical infrastructures in Europe. Glob. Environ. Chang. 2018, 48, 97–107. [Google Scholar] [CrossRef]
  13. Shakesby, R.; Coelho, C.; Ferreira, A.; Terry, J.; Walsh, R. Wildfire Impacts on Soil-Erosion and Hydrology in Wet Mediterranean Forest, Portugal. Int. J. Wildland Fire 1993, 3, 95–110. [Google Scholar] [CrossRef]
  14. Hunke, P.; Mueller, E.N.; Schroder, B.; Zeilhofer, P.; Müller, E.N. The Brazilian Cerrado: Assessment of water and soil degradation in catchments under intensive agricultural use. Ecohydrology 2014, 8, 1154–1180. [Google Scholar] [CrossRef]
  15. Pastro, L.A.; Dickman, C.R.; Letnic, M. Burning for biodiversity or burning biodiversity? Prescribed burn vs. wildfire impacts on plants, lizards, and mammals. Ecol. Appl. 2011, 21, 3238–3253. [Google Scholar] [CrossRef]
  16. Thom, D.; Seidl, R. Natural disturbance impacts on ecosystem services and biodiversity in temperate and boreal forests. Boil. Rev. 2015, 91, 760–781. [Google Scholar] [CrossRef] [PubMed]
  17. Snyman, H. Short-term response in productivity following an unplanned fire in a semi-arid rangeland of South Africa. J. Arid Environ. 2004, 56, 465–485. [Google Scholar] [CrossRef]
  18. Snyman, H. Estimating the short-term impact of fire on rangeland productivity in a semi-arid climate of South Africa. J. Arid Environ. 2004, 59, 685–697. [Google Scholar] [CrossRef]
  19. Pereira, A.A.; Pereira, J.M.C.; Libonati, R.; Oom, D.; Setzer, A.W.; Morelli, F.; Machado-Silva, F.; De Carvalho, L.M.T. Burned Area Mapping in the Brazilian Savanna Using a One-Class Support Vector Machine Trained by Active Fires. Remote Sens. 2017, 9, 1161. [Google Scholar] [CrossRef] [Green Version]
  20. Maffei, C.; Alfieri, S.M.; Menenti, M. Relating Spatiotemporal Patterns of Forest Fires Burned Area and Duration to Diurnal Land Surface Temperature Anomalies. Remote Sens. 2018, 10, 1777. [Google Scholar] [CrossRef] [Green Version]
  21. Kganyago, M.; Shikwambana, L. Assessing Spatio-Temporal Variability of Wildfires and their Impact on Sub-Saharan Ecosystems and Air Quality Using Multisource Remotely Sensed Data and Trend Analysis. Sustainability 2019, 11, 6811. [Google Scholar] [CrossRef] [Green Version]
  22. Filipponi, F. Exploitation of Sentinel-2 Time Series to Map Burned Areas at the National Level: A Case Study on the 2017 Italy Wildfires. Remote Sens. 2019, 11, 622. [Google Scholar] [CrossRef] [Green Version]
  23. Mallinis, G.; Galidaki, G.; Gitas, I.Z. A Comparative Analysis of EO-1 Hyperion, Quickbird and Landsat TM Imagery for Fuel Type Mapping of a Typical Mediterranean Landscape. Remote Sens. 2014, 6, 1684–1704. [Google Scholar] [CrossRef] [Green Version]
  24. García, M.; Saatchi, S.; Casas, A.; Koltunov, A.; Ustin, S.L.; Ramirez, C.; Balzter, H. Extrapolating Forest Canopy Fuel Properties in the California Rim Fire by Combining Airborne LiDAR and Landsat OLI Data. Remote Sens. 2017, 9, 394. [Google Scholar] [CrossRef] [Green Version]
  25. Engelbrecht, J.; Theron, A.; Vhengani, L.; Kemp, J. A Simple Normalized Difference Approach to Burnt Area Mapping Using Multi-Polarisation C-Band SAR. Remote Sens. 2017, 9, 764. [Google Scholar] [CrossRef] [Green Version]
  26. Huang, H.; Roy, D.P.; Boschetti, L.; Zhang, H.K.; Yan, L.; Kumar, S.S.; Gómez-Dans, J.; Li, J. Separability Analysis of Sentinel-2A Multi-Spectral Instrument (MSI) Data for Burned Area Discrimination. Remote Sens. 2016, 8, 873. [Google Scholar] [CrossRef] [Green Version]
  27. Long, T.; Zhang, Z.; He, G.; Jiao, W.; Tang, C.; Wu, B.; Zhang, X.; Wang, G.; Yin, R. 30 m Resolution Global Annual Burned Area Mapping Based on Landsat Images and Google Earth Engine. Remote Sens. 2019, 11, 489. [Google Scholar] [CrossRef] [Green Version]
  28. Wooster, M.J. Fire radiative energy for quantitative study of biomass burning: Derivation from the BIRD experimental satellite and comparison to MODIS fire products. Remote Sens. Environ. 2003, 86, 83–107. [Google Scholar] [CrossRef]
  29. Oliva, P.; Schroeder, W. Assessment of VIIRS 375m active fire detection product for direct burned area mapping. Remote Sens. Environ. 2015, 160, 144–155. [Google Scholar] [CrossRef]
  30. Zubkova, M.; Boschetti, L.; Abatzoglou, J.T. Recent changes in fire activity in Africa and their potential drivers. In Proceedings of the AGU Fall Meeting Abstracts, Washington, DC, USA, 10–14 December 2018. [Google Scholar]
  31. Stellmes, M. Fire frequency, fire seasonality and fire intensity within the Okavango region derived from MODIS fire products. Biodivers. Ecol. 2013, 5, 351. [Google Scholar] [CrossRef] [Green Version]
  32. Schroeder, W.; Oliva, P.; Giglio, L.; Csiszar, I. The New VIIRS 375m active fire detection data product: Algorithm description and initial assessment. Remote Sens. Environ. 2014, 143, 85–96. [Google Scholar] [CrossRef]
  33. Lizundia-Loiola, J.; Pettinari, M.L.; Chuvieco, E. Temporal Anomalies in Burned Area Trends: Satellite Estimations of the Amazonian 2019 Fire Crisis. Remote Sens. 2020, 12, 151. [Google Scholar] [CrossRef] [Green Version]
  34. BBC. Australia Fires: A Visual Guide to the Bushfire Crisis. Available online: https://www.bbc.com/news/world-australia-50951043 (accessed on 11 May 2020).
  35. Whiteside, P.G. Nathan Scorched Earth: How the Devastating Australia Fires Compare to Those in California and Brazil. Available online: https://news.sky.com/story/scorched-earth-how-the-australia-fires-compare-to-us-and-brazil-11904192 (accessed on 11 May 2020).
  36. Ichoku, C.; Giglio, L.; Wooster, M.J.; Remer, L.A. Global characterization of biomass-burning patterns using satellite measurements of fire radiative energy. Remote Sens. Environ. 2008, 112, 2950–2962. [Google Scholar] [CrossRef]
  37. Giglio, L.; Schroeder, W.; Justice, C. The collection 6 MODIS active fire detection algorithm and fire products. Remote Sens. Environ. 2016, 178, 31–41. [Google Scholar] [CrossRef] [PubMed] [Green Version]
  38. Alvares, C.A.; Stape, J.L.; Sentelhas, P.C.; de Moraes, G.; Leonardo, J.; Sparovek, G. Köppen’s climate classification map for Brazil. Meteorol. Z. 2013, 22, 711–728. [Google Scholar] [CrossRef]
  39. Ratter, J.A.; Ribeiro, J.F.; Bridgewater, S. The Brazilian Cerrado Vegetation and Threats to its Biodiversity. Ann. Bot. 1997, 80, 223–230. [Google Scholar] [CrossRef] [Green Version]
  40. Ramos-Neto, M.B.; Pivello, V.R. Lightning Fires in a Brazilian Savanna National Park: Rethinking Management Strategies. Environ. Manag. 2000, 26, 675–684. [Google Scholar] [CrossRef]
  41. Nepstad, D.; Stickler, C.M.; Filho, B.-S.; Merry, F. Interactions among Amazon land use, forests and climate: Prospects for a near-term forest tipping point. Philos. Trans. R. Soc. B Boil. Sci. 2008, 363, 1737–1746. [Google Scholar] [CrossRef] [Green Version]
  42. Petty, A.M.; Bowman, D.M.J.S. A Satellite Analysis of Contrasting Fire Patterns in Aboriginal- and Euro-Australian Lands in Tropical North Australia. Fire Ecol. 2007, 3, 32–47. [Google Scholar] [CrossRef]
  43. Russell-Smith, J.; Yates, C.; Edwards, A.; Allan, G.E.; Cook, G.D.; Cooke, P.; Craig, R.; Heath, B.; Smith, R. Contemporary fire regimes of northern Australia, 1997 - 2001: Change since Aboriginal occupancy, challenges for sustainable management. Int. J. Wildland Fire 2003, 12, 283–297. [Google Scholar] [CrossRef]
  44. Russell-Smith, J.; Yates, C.; Whitehead, P.J.; Smith, R.; Craig, R.; Allan, G.E.; Thackway, R.; Frakes, I.; Cridland, S.; Meyer, M.C.P.; et al. Bushfires ’down under’: Patterns and implications of contemporary Australian landscape burning. Int. J. Wildland Fire 2007, 16, 361–377. [Google Scholar] [CrossRef]
  45. Nolan, R.H.; Boer, M.M.; Collins, L.; Resco de Dios, V.; Clarke, H.; Jenkins, M.; Kenny, B.; Bradstock, R.A. Causes and consequences of eastern Australia’s 2019-20 season of mega-fires. Glob. Change Biol. 2020, 26, 1039–1041. [Google Scholar] [CrossRef] [PubMed] [Green Version]
  46. Giglio, L.; Justice, C.; Boschetti, L.; Roy, D. MCD64A1 MODIS/Terra+ Aqua Burned Area Monthly L3 Global 500 m SIN Grid V006 [Data Set]; NASA EOSDIS Land Processes DAAC: Sioux Falls, SD, USA, 2015.
  47. Giglio, L.; Boschetti, L.; Roy, D.P.; Humber, M.L.; Justice, C. The Collection 6 MODIS burned area mapping algorithm and product. Remote Sens. Environ. 2018, 217, 72–85. [Google Scholar] [CrossRef] [PubMed]
  48. Humber, M.L.; Boschetti, L.; Giglio, L.; Justice, C.O. Spatial and temporal intercomparison of four global burned area products. Int. J. Digit. Earth 2018, 12, 460–484. [Google Scholar] [CrossRef]
  49. Wooster, M.J.; Xu, W.; Nightingale, T. Sentinel-3 SLSTR active fire detection and FRP product: Pre-launch algorithm development and performance evaluation using MODIS and ASTER datasets. Remote Sens. Environ. 2012, 120, 236–254. [Google Scholar] [CrossRef]
  50. Schroeder, W.; Prins, E.; Giglio, L.; Csiszar, I.; Schmidt, C.; Morisette, J.; Morton, D. Validation of GOES and MODIS active fire detection products using ASTER and ETM+ data. Remote Sens. Environ. 2008, 112, 2711–2726. [Google Scholar] [CrossRef]
  51. Cheng, D.; Rogan, J.; Schneider, L.; Cochrane, M. Evaluating MODIS active fire products in subtropical Yucatán forest. Remote Sens. Lett. 2013, 4, 455–464. [Google Scholar] [CrossRef]
  52. Pivello, V.R. The Use of Fire in the Cerrado and Amazonian Rainforests of Brazil: Past and Present. Fire Ecol. 2011, 7, 24–39. [Google Scholar] [CrossRef]
  53. Defourny, P.; Brockmann, C.; Bontemps, S.; Lamarche, C.; Santoro, M.; Boettcher, M.; Wevers, J. CCI-LC PUGv2 Phase II. Land Cover Climate Change Initiative-Product User Guide. 2017. Available online: https://www.esa-landcover-cci.org/?q=webfm_send/84 (accessed on 25 January 2020).
  54. Li, W.; MacBean, N.; Ciais, P.; Defourny, P.; Lamarche, C.; Bontemps, S.; Houghton, R.A.; Peng, S. Gross and net land cover changes in the main plant functional types derived from the annual ESA CCI land cover maps (1992–2015). Earth Syst. Sci. Data 2018, 10, 219–234. [Google Scholar] [CrossRef] [Green Version]
  55. Bontemps, S.; Defourny, P.; Radoux, J.; Van Bogaert, E.; Lamarche, C.; Achard, F.; Mayaux, P.; Boettcher, M.; Brockmann, C.; Kirches, G. Consistent global land cover maps for climate modelling communities: Current achievements of the ESA’s land cover CCI. In Proceedings of the ESA Living Planet Symposium, Edinburgh, UK, 9–13 September 2013. [Google Scholar]
  56. Kogan, F. Application of vegetation index and brightness temperature for drought detection. Adv. Space Res. 1995, 15, 91–100. [Google Scholar] [CrossRef]
  57. Kogan, F. Remote sensing of weather impacts on vegetation in non-homogeneous areas. Int. J. Remote Sens. 1990, 11, 1405–1419. [Google Scholar] [CrossRef]
  58. Domenikiotis, C.; Spiliotopoulos, M.; Tsiros, E.; Dalezios, N.R. Early cotton yield assessment by the use of the NOAA/AVHRR derived Vegetation Condition Index (VCI) in Greece. Int. J. Remote Sens. 2004, 25, 2807–2819. [Google Scholar] [CrossRef]
  59. Kogan, F.N. Global Drought Watch from Space. Bull. Am. Meteorol. Soc. 1997, 78, 621–636. [Google Scholar] [CrossRef]
  60. Wang, L.; Zhang, L.; Chang, Q.; Fu, D.; Cen, Y.; Tong, Q. Evaluating an Enhanced Vegetation Condition Index (VCI) Based on VIUPD for Drought Monitoring in the Continental United States. Remote Sens. 2016, 8, 224. [Google Scholar] [CrossRef] [Green Version]
  61. Gelaro, R.; Mccarty, W.; Suárez, M.J.; Todling, R.; Molod, A.; Takacs, L.; Randles, C.; Darmenov, A.; Bosilovich, M.G.; Reichle, R.; et al. The Modern-Era Retrospective Analysis for Research and Applications, Version 2 (MERRA-2). J. Clim. 2017, 30, 5419–5454. [Google Scholar] [CrossRef] [PubMed]
  62. Wargan, K.; Labow, G.; Frith, S.; Pawson, S.; Livesey, N.; Partyka, G. Evaluation of the Ozone Fields in NASA’s MERRA-2 Reanalysis. J. Clim. 2017, 30, 2961–2988. [Google Scholar] [CrossRef] [PubMed] [Green Version]
  63. Buchard, V.; Randles, C.; Da Silva, A.M.; Darmenov, A.; Colarco, P.R.; Govindaraju, R.; Ferrare, R.; Hair, J.; Beyersdorf, A.J.; Ziemba, L.D.; et al. The MERRA-2 Aerosol Reanalysis, 1980 Onward. Part II: Evaluation and Case Studies. J. Clim. 2017, 30, 6851–6872. [Google Scholar] [CrossRef]
  64. Randles, C.; Da Silva, A.M.; Buchard, V.; Colarco, P.R.; Darmenov, A.; Govindaraju, R.; Smirnov, A.; Holben, B.; Ferrare, R.; Hair, J.; et al. The MERRA-2 Aerosol Reanalysis, 1980 Onward. Part I: System Description and Data Assimilation Evaluation. J. Clim. 2017, 30, 6823–6850. [Google Scholar] [CrossRef] [PubMed]
  65. Anselin, L. Local Indicators of Spatial Association-LISA. Geogr. Anal. 2010, 27, 93–115. [Google Scholar] [CrossRef]
  66. Vadrevu, K.; Csiszar, I.; Ellicott, E.A.; Giglio, L.; Badarinath, K.V.S.; Vermote, E.; Justice, C. Hotspot Analysis of Vegetation Fires and Intensity in the Indian Region. IEEE J. Sel. Top. Appl. Earth Obs. Remote Sens. 2013, 6, 224–238. [Google Scholar] [CrossRef]
  67. Kelley, D.I.; Burton, C.; Huntingford, C.; Brown, M.A.J.; Whitley, R.; Dong, N. Technical note: Low meteorological influence found in 2019 Amazonia fires. J. Geophys. Res. Biogeosci. 2020, 1–17. [Google Scholar] [CrossRef]
  68. De Araújo, F.M.; Ferreira, L.G.; Arantes, A.E. Distribution Patterns of Burned Areas in the Brazilian Biomes: An Analysis Based on Satellite Data for the 2002–2010 Period. Remote Sens. 2012, 4, 1929–1946. [Google Scholar] [CrossRef] [Green Version]
  69. Justice, C.; Giglio, L.; Korontzi, S.; Owens, J.; Morisette, J.; Roy, D.; Descloitres, J.; Alleaume, S.; Petitcolin, F.; Kaufman, Y. The MODIS fire products. Remote Sens. Environ. 2002, 83, 244–262. [Google Scholar] [CrossRef]
  70. Hyer, E.; Reid, J.S. Baseline uncertainties in biomass burning emission models resulting from spatial error in satellite active fire location data. Geophys. Res. Lett. 2009, 36, 36. [Google Scholar] [CrossRef]
  71. Schroeder, W.; Oliva, P.; Giglio, L.; Quayle, B.; Lorenz, E.; Morelli, F. Active fire detection using Landsat-8/OLI data. Remote Sens. Environ. 2016, 185, 210–220. [Google Scholar] [CrossRef] [Green Version]
  72. Di Bella, C.M.; Jobbágy, E.G.; Paruelo, J.; Pinnock, S. Continental fire density patterns in South America. Glob. Ecol. Biogeogr. 2006, 15, 192–199. [Google Scholar] [CrossRef]
  73. Morton, D. Conservation challenge at the agricultural frontier: Deforestation, fire, and land use dynamics in Mato Grosso. Ambient. e Agua - Interdiscip. J. Appl. Sci. 2007, 2, 5–20. [Google Scholar] [CrossRef]
  74. Jin, H. Drivers of Global Wildfires: Statistical Analyses. Master’s Thesis, Lund University, Lund, Sweden, 2010. [Google Scholar]
  75. Turco, M.; Levin, N.; Tessler, N.; Saaroni, H. Recent changes and relations among drought, vegetation and wildfires in the Eastern Mediterranean: The case of Israel. Glob. Planet. Chang. 2017, 151, 28–35. [Google Scholar] [CrossRef]
  76. Estes, B.L.; Knapp, E.E.; Skinner, C.N.; Miller, J.D.; Preisler, H.K. Factors influencing fire severity under moderate burning conditions in the Klamath Mountains, northern California, USA. Ecosphere 2017, 8, e01794. [Google Scholar] [CrossRef] [Green Version]
  77. Padilla, M.; Stehman, S.V.; Litago, J.; Chuvieco, E. Assessing the Temporal Stability of the Accuracy of a Time Series of Burned Area Products. Remote Sens. 2014, 6, 2050–2068. [Google Scholar] [CrossRef] [Green Version]
  78. Cardozo, F.D.S.; Pereira, G.; Shimabukuro, Y.E.; Moraes, E.C. Validation of MODIS MCD45A1 product to identify burned areas in Acre State - Amazon forest. In Proceedings of the 2012 IEEE International Geoscience and Remote Sensing Symposium, Munich, Germany, 22–27 July 2012; pp. 6741–6744. [Google Scholar] [CrossRef] [Green Version]
  79. Boschetti, L.; Roy, D.P.; Giglio, L.; Huang, H.; Zubkova, M.; Humber, M.L. Global validation of the collection 6 MODIS burned area product. Remote Sens. Environ. 2019, 235, 111490. [Google Scholar] [CrossRef] [PubMed]
Figure 1. A map of the study area showing three study sites: (a) the western USA, (b) Brazil and (c) eastern Australia. The broad land cover distributions for 2018 are shown based on European Space Agency (ESA) Climate Change Initiative-Land Cover (CCI-LC) (http://maps.elie.ucl.ac.be/CCI/viewer/download.php).
Remotesensing 12 01803 g001
Figure 2. The heat map (top panel) of Active Fires (AF) and corresponding Fire Radiative Power by vegetation cover type (FRP, bottom-panel) for western USA (i.e., August–September 2018), Brazil (i.e., August–September 2019) and eastern Australia fires (i.e., November–December 2019). Red regions in the heat map (top-panel) represent higher proximity and number of fires (i.e., more AF points) than yellow areas, which show more dispersed fires. CL, FC, GL, OVC and SL denote cultivated land, forest cover, grassland, other vegetation covers and shrubland, respectively.
Remotesensing 12 01803 g002
Figure 3. Changes, over time, in the daily Burned area (BA) and meteorological conditions (surface temperature (Ts), relative humidity (RH), precipitation (Prec.) and wind speed (Ws)) at various sites. The grey areas show periods when higher BA is observed.
Remotesensing 12 01803 g003
Figure 4. The spatial distribution of fire scars (red) in the western USA (i.e., August–September 2018), Brazil (i.e., August–September 2019) and eastern Australia (i.e., November–December 2019) study sites.
Remotesensing 12 01803 g004
Figure 5. Amount of lost or damaged vegetation cover (km2) and the corresponding number of active fires (AF). CL, FC, GL, OVC and SL denote cultivated land, forest cover, grassland, other vegetation covers and shrubland, respectively.
Remotesensing 12 01803 g005
Table 1. Local Moran’s I significant fire clusters and outliers at the three study sites: western USA, Brazil and eastern Australia. HH (LL) indicate statistically significant clusters with similar high (low) fire intensity (FRP, MW) values, while HL (LH) are spatial outliers with a high (low) fire intensity values surrounded by low (high) values.
USABrazilAustralia
No. of AFMean FRPNo. of AFMean FRPNo. of AFMean FRP
HH1098762.0714128356.775613494.37
HL328827.681202315.884093411.82
LH12513.17486114.521306521.22
LL2009559.279077.451158318.13
Table 2. Significance test using Kruskal-Wallis Test and class wise-comparisons of vegetation type-specific fire intensities (FRP, MW) using the Pairwise-Wilcox Test in western USA (i.e., August–September 2018), Brazil (i.e., August–September 2019) and eastern Australia (i.e., November–December 2019). Statistically significant p-values are shaded in grey. <p denotes p-value of <2 × 10¹⁶.
USABrazilAustralia
CLFCGLOVCCLFCGLOVCCLFCGLOVC
FC0.05 8.5 × 10⁵ 0.29
GL1 × 10−45.9 × 10⁴ <p<p 0.0032.0 × 109
OVC0.0010.0150.37 <p<p<p 0.0541.8 × 1050.29
SL4.7 × 107<p0.370.70.881.8 × 107<p<p0.03<p0.010.29
western USA: Kruskal-Wallis Chi-squared = 132.2; p-value < 2.2 × 10¹⁶; Brazil: Kruskal-Wallis Chi-squared = 793.74; p-value < 2.2 × 10¹⁶; eastern Australia: Kruskal-Wallis Chi-squared = 349.16; p-value <2.2 × 10¹⁶.