Article

Satellite-Based Monitoring and Modeling of Ground Movements Caused by Water Rebound

by
Agnieszka A. Malinowska
*,
Wojciech T. Witkowski
,
Artur Guzy
and
Ryszard Hejmanowski
Department of Mining Surveying and Environmental Engineering, AGH University of Science and Technology, 30-059 Kraków, Poland
*
Author to whom correspondence should be addressed.
Remote Sens. 2020, 12(11), 1786; https://doi.org/10.3390/rs12111786
Submission received: 25 April 2020 / Revised: 29 May 2020 / Accepted: 29 May 2020 / Published: 1 June 2020

Abstract

:
The presented research aimed to evaluate the spatio-temporal distribution of ground movements caused by groundwater head changes induced by mining. The research was carried out in the area of one of the copper ore and anhydrite mines in Poland. To determine ground movements, classical surveying results and the persistent scatter Satellite Radar Interferometry (PSInSAR) method were applied. The mining operation triggered significant subsidence, reaching 1.4 m in the years 1944–2015. However, subsidence caused by groundwater pumping was about 0.3 m. After mine closure, an ongoing groundwater rebound was observed. Hence, land uplift occurred, reaching no more than 29 mm/y. The main part of the investigation concerned developing a novel method for uplift prediction. Therefore, an attempt was made to comparatively analyze the dynamics of ground movements correlated with the mine life and hydrogeological condition. These analyses allowed the time factor for the modeling of land uplift to be determined. The investigation also revealed that in the next six years, the uplift will reach up to 12 mm/y. The developed methodology could be applied in any post-mining area where groundwater-rebound-related uplift is observed.

1. Introduction

The underground mining of mineral and ore deposits is widespread across the world. Currently, the most frequently mined minerals are hard coal, iron ores, bauxite, phosphate, and gypsum [1]. One of the side effects of mineral extraction is ground movements. There are two reasons for this. The first is the change in the distribution of the load in the rock masses above the mining works. That process causes successive propagation of the cracks and bending towards the ground surface [2,3]. The second reason for the ground movements is the dewatering of the aquifer. The groundwater pumping from underground excavations causes a decrease in hydrostatic pressure and an increase in the effective pressure in the rock mass within the limits of the depression cone. As a result of that process, the compaction of dewatered layers is observed [4,5,6,7,8,9]. The advance and ongoing drainage of rock masses is an essential activity that enables the mining of almost all types of mineral resources. Operating underground mines cause substantial subsidence that is significantly threatening buildings and infrastructure. However, the ground movements also occur on the terrain surface after mine closure. There is residual subsidence caused by the convergence of post-mining voids and land uplift caused by groundwater rebound to dewatered aquifers. The groundwater head in the rock masses aims to recover its original hydrodynamic balance. In such cases, an increase in hydrostatic pressure and a decrease in the effective pressure are observed in the rock mass. However, the rock mass volume change due to its dewatering and resaturation with groundwater is not balanced. Due to disintegration of the rock mass, its final volume is much smaller than the value noted before compaction [10,11,12]. Nevertheless, land uplift is especially dangerous for underground and surface infrastructure. This is because ground movements cause tensile forces, which have a significant negative impact on the strength of technical infrastructure and buildings. The uplift of the ground surface caused by the flooding of closed underground mines is currently mainly observed in areas of former hard coal mining, such as in Germany [13,14], Great Britain [15], France [16], Belgium [17], the Netherlands [12,14], and Poland [18]. In the majority of presented cases, the uplift of the ground surface did not exceed a dozen or so cm. Similar uplift is observed in areas where the extraction of freshwater from underground reservoirs has been stopped in the last few years, including Thessaloniki in Greece [19], Taiwan [20], and Bangkok in Thailand [21]. In all these areas, the phenomenon causes financial losses for the local government, which are related to the current monitoring of land uplift and repair of the destroyed infrastructure. Worldwide experience shows a significant influence of mining and geological factors on the temporal and spatial character of land uplift. The presence of tectonic discontinuities, as well as a significant volume of excavation void, may lead to regional groundwater migration disturbances [10,11].
The monitoring of land uplift is currently most often carried out with the use of traditional surveying methods, mainly precise leveling [10]. Unfortunately, classical measurement methods have some limitations, such as spatial range restrictions and a low frequency of measurement campaigns due to high costs. For this reason, the use of Radar Interferometry (InSAR) implementing satellite data has become a very effective solution for the observation of uplift. InSAR implementation provides continuous spatial measurements over a wide geographical area. It can be used to perform complex analyses of the deformation mechanism of the ground surface. Therefore, it is undoubtedly helpful in better identifying the causes, course, and effects of ground movements [22,23,24,25,26]. The conventional InSAR method, based on the determination of the value of ground surface movements in the Line-of-Sight (LOS) direction from two Synthetic Aperture Radar (SAR) scenes obtained at different times, has many limitations [27]. The most important limitation of the technique is the potentially low value of coherence in rural areas. This temporal decorrelation is due to the change of the backscattering values of the radar scene, which is a factor that also strongly depends on the land use of each area and the temporal time span between the two satellite acquisitions [28]. While the phenomena that cause strong signals (for example, major earthquake events occurring at large active faults) could be generally analyzed with Differential InSAR (DInSAR), phenomena that are slow and of a smaller magnitude (e.g., mm/y), such as the surface uplift due to groundwater recharge, are not possible to monitor with conventional InSAR. This need for a reduction of the decorrelation has led to the invention of advanced InSAR techniques, known as Multi-Temporal InSAR [29], which are suitable for studying slow phenomena that extend over significant periods (e.g., years and decades). These techniques use a series of interferograms, and the result is a velocity map of surface deformation. In Hooper’s method, persistent scatter (PS) detection is achieved by first applying a loose amplitude dispersion criterion, but the main criterion is based on the phase stability of each pixel. This also enables the possibility to obtain better results in nonurban areas than those that would be derived from a technique that only adopts an amplitude criterion alone [29,30,31].
The presented research aimed to analyze the dynamics of land uplift that takes place in the area of historical copper, gypsum, and anhydrite ore mining. This movement is related to underground water rebound after the cessation of the pumping of groundwater in 2001. The PSInSAR method from the StaMPS/MTI software tool [29], with the use of Sentinel-1 satellite data, was used to determine the value of the LOS ground movement. The vertical displacement was determined by the decomposition of LOS deformation. As a result of the conducted investigation, the spatio-temporal distribution of ground surface movements over four years, i.e., from November 2014 to July 2018, was obtained. One land uplift center was identified. The research was preceded by a detailed analysis of the geological and hydrogeological conditions and ground surface movements during the period of mining operations. This made it possible to model the decompression of rock mass, which is caused by an increase in hydrostatic pressure due to rising groundwater head.
The objectives comprise the following:
  • To analyze the time-dependent vertical ground movements related to the groundwater rebound after mine closure;
  • To estimate the termination of ground uplift due to groundwater rebound with the support of PSInSAR observation;
  • To develop an algorithm based on complex geological, hydrological, and PSInSAR observation data to assess residual groundwater-rebound-related vertical ground movements in post-mining areas.
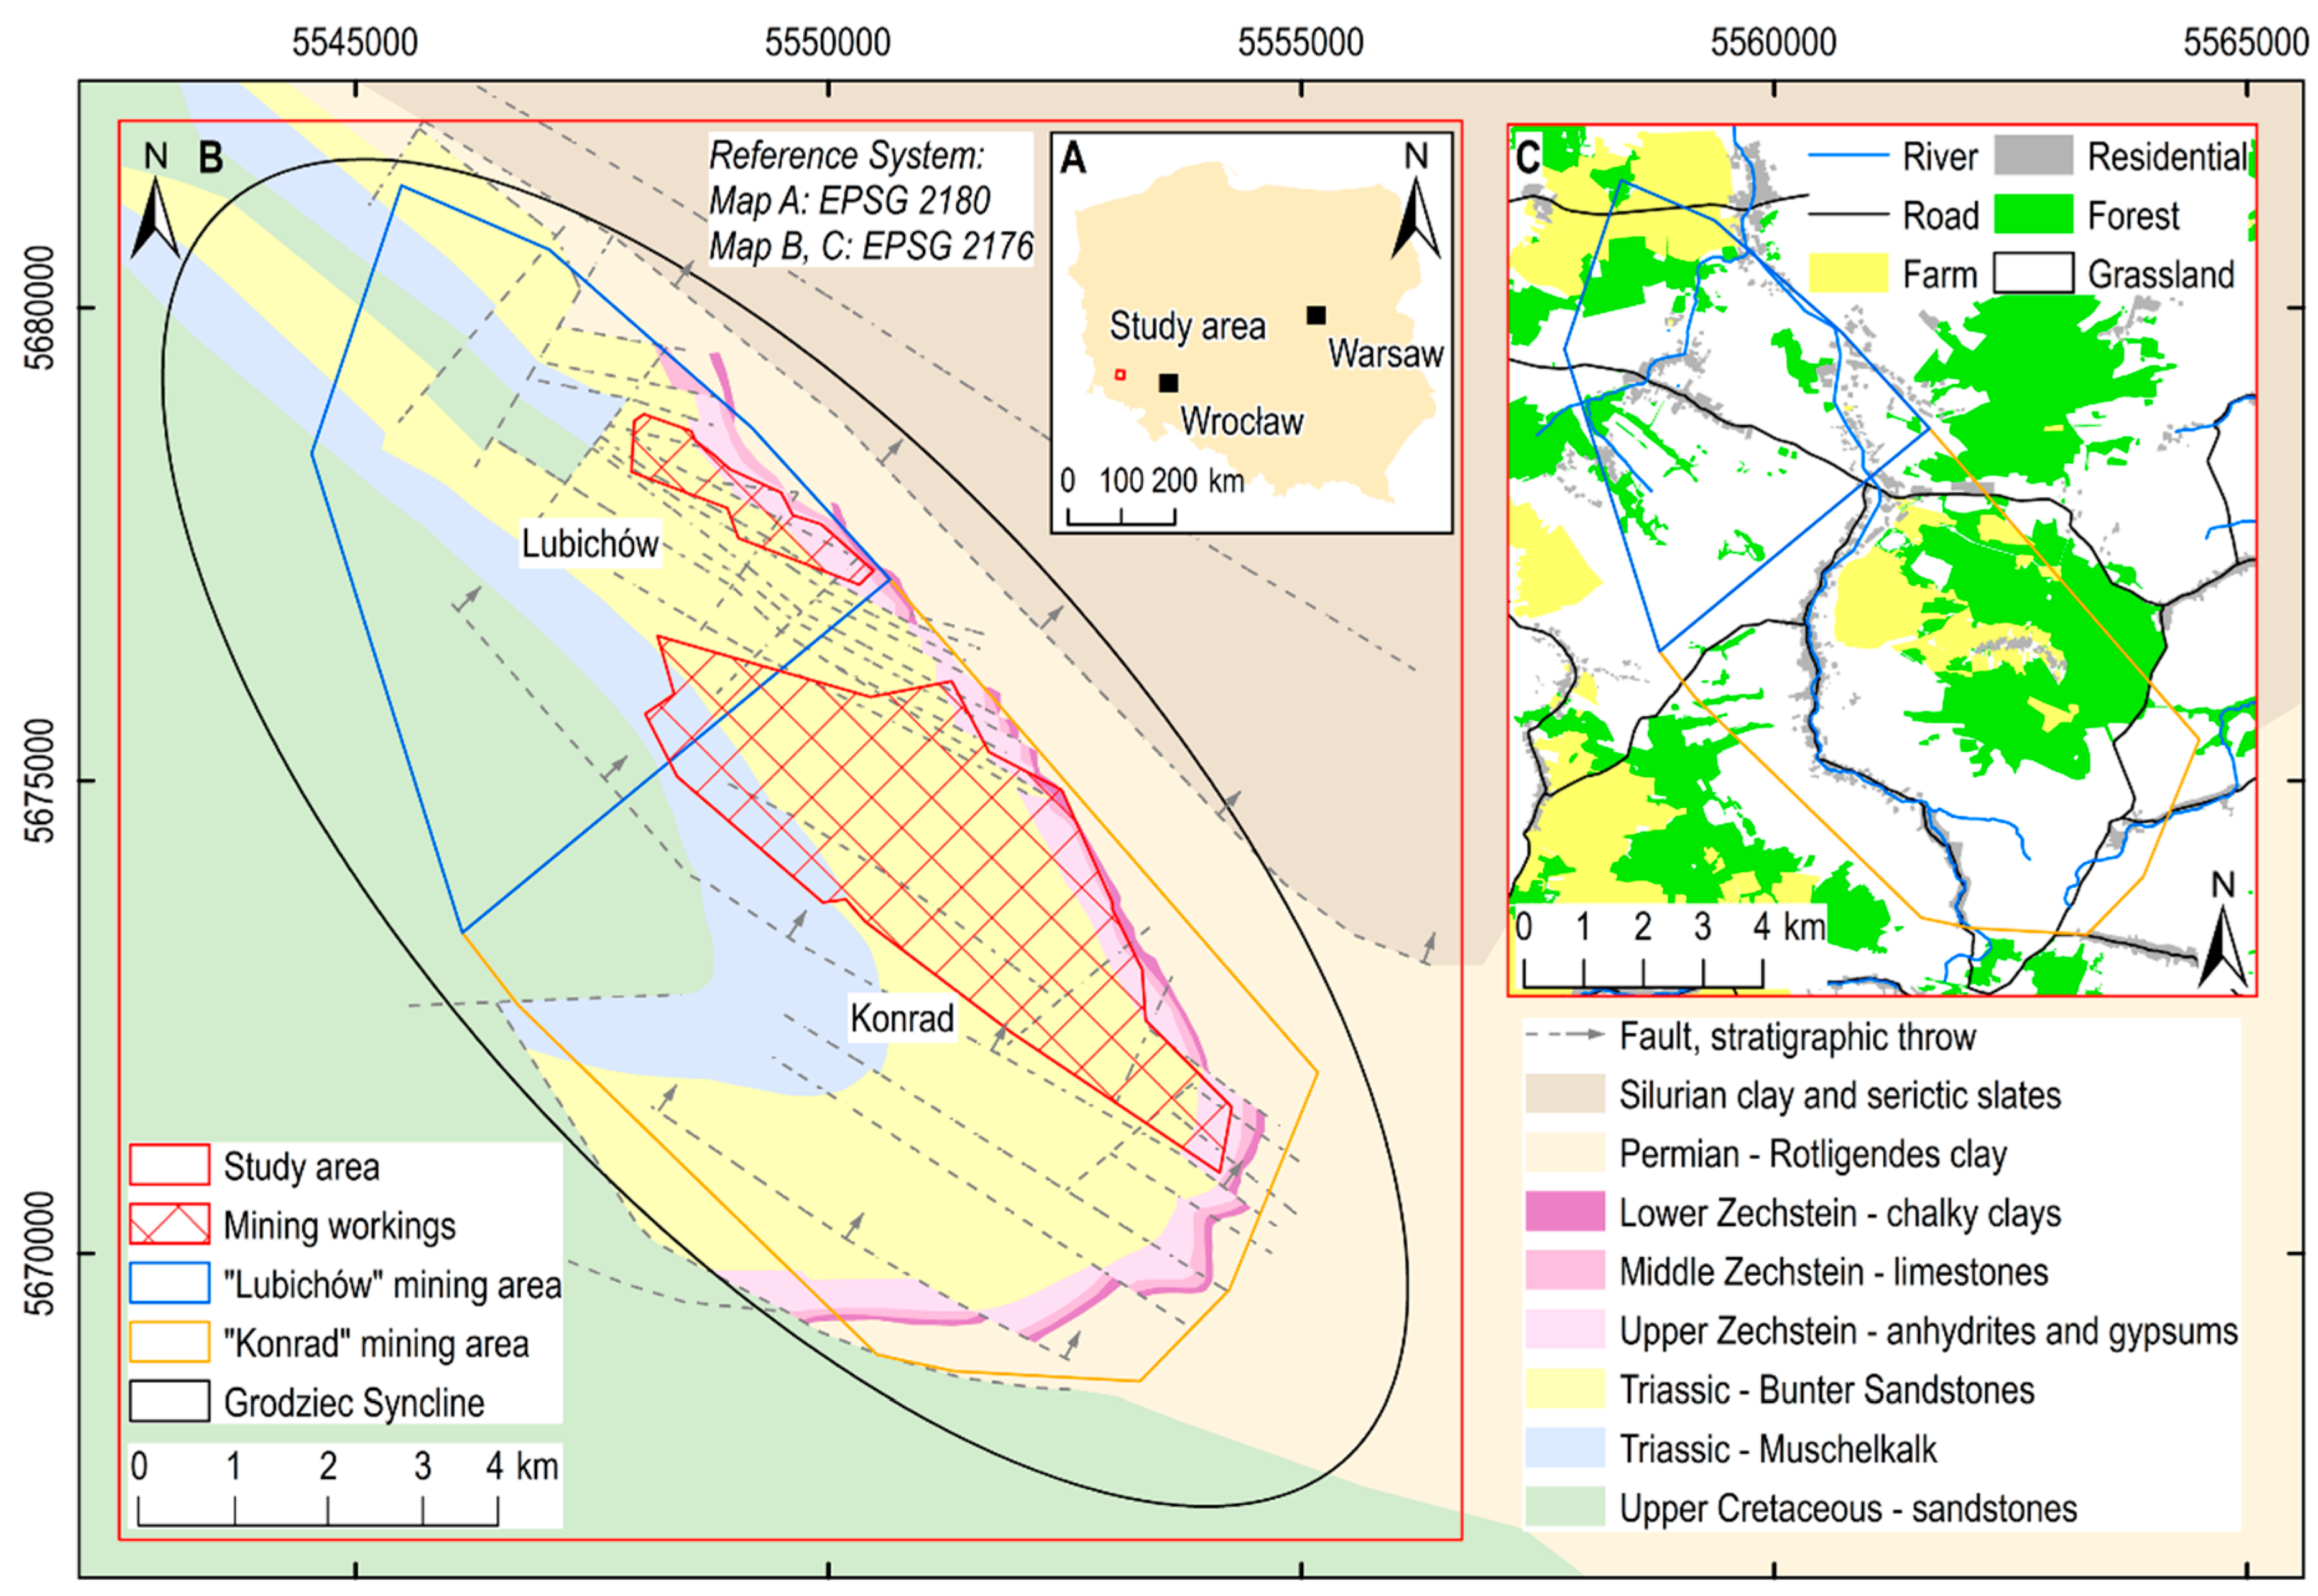
2. Study Area

The presented research was carried out on terrain above closed copper, gypsum, and anhydrite mines near the city of Bolesławiec in the southwestern part of Poland (Figure 1A). The investigation was carried out in an area of around 62 km2. The study area is mostly covered with forests and agricultural fields. Urban areas consist of small villages situated along the traffic routes (Figure 1C).

2.1. Geological and Hydrogeological Constraints

The Konrad and Lubichów mines are located in the north-west part of the North Sudetic Synclinorium, directly in the Grodziec Syncline. The base of this geological structure is made of crystalline Cambrian and early Carboniferous layers of the so-called Kaczawa complex. These include greenschist, sericite and quartz slates, quartzite, phyllite, and crystalline limestone. The crystalline layers of the Grodziec Syncline are filled with Permian, Triassic, and Upper Cretaceous sediments. Glacial and fluvioglacial Quaternary deposits cover Mesozoic and Permian deposits. The geological–tectonic conditions in the investigated area are complex. There are numerous displacement zones. The origin of displacement zones relates to various stages of sedimentation and rock mass movements. There are mainly thrust faults in this area, which have a northwestern to southeastern stratigraphic throw. The Grodziec Syncline takes the shape of a small basin of 15 km in length and 4 km in width, and its axis runs in the NE–SW direction, dipping at an angle of 1–5° under NE (Figure 1B; [33]). From a hydrogeological point of view, the Grodziec Syncline is a multilayered structure with a basin character, whose foundation forms a geologically closed form. There are three principal aquifers in this area: Quaternary, Mesozoic, and Permian [34]. The Quaternary floor comprises aquifer sands and gravels of the Pleistocene and Holocene, with a total thickness of up to 17 m, which lie directly on Mesozoic rocks. The Mesozoic aquifer is made up of three aquifers: late Cretaceous, Muschelkalk, and Buntsandstein. Due to the discontinuous spread and slight entry of groundwater, the late Cretaceous and Muschelkalk levels had practically no effect on the amount of groundwater inflow during the mining works. The water-bearing level of the Buntsandstein is made up of fine-grained sandstones of a continuous spread and significant thickness. It is the most abundant water-bearing reservoir in the Grodziec Syncline. The Permian aquifer is made up of the sandstone level of the Rotliegend and the aquifer levels of the late and middle Zechstein. The groundwater in the upper Zechstein is found in fine-grained sandstones and the Kaczawa dolomite. The central Zechstein, due to its good rock filtration properties and hydraulic connectivity to the Quaternary level, determined the groundwater entry into the mine works. It also had an impact on the recovery of the groundwater head in drainage aquifers after mine closure. This level was the source of most of the uncontrolled groundwater leaks in the underground mining works. Additionally, there are no impermeable formations of considerable thickness within the floor layers of the deposit series. Therefore, the aquifer recharge mainly depends on rainwater infiltration through Quaternary and Tertiary sediments [35].

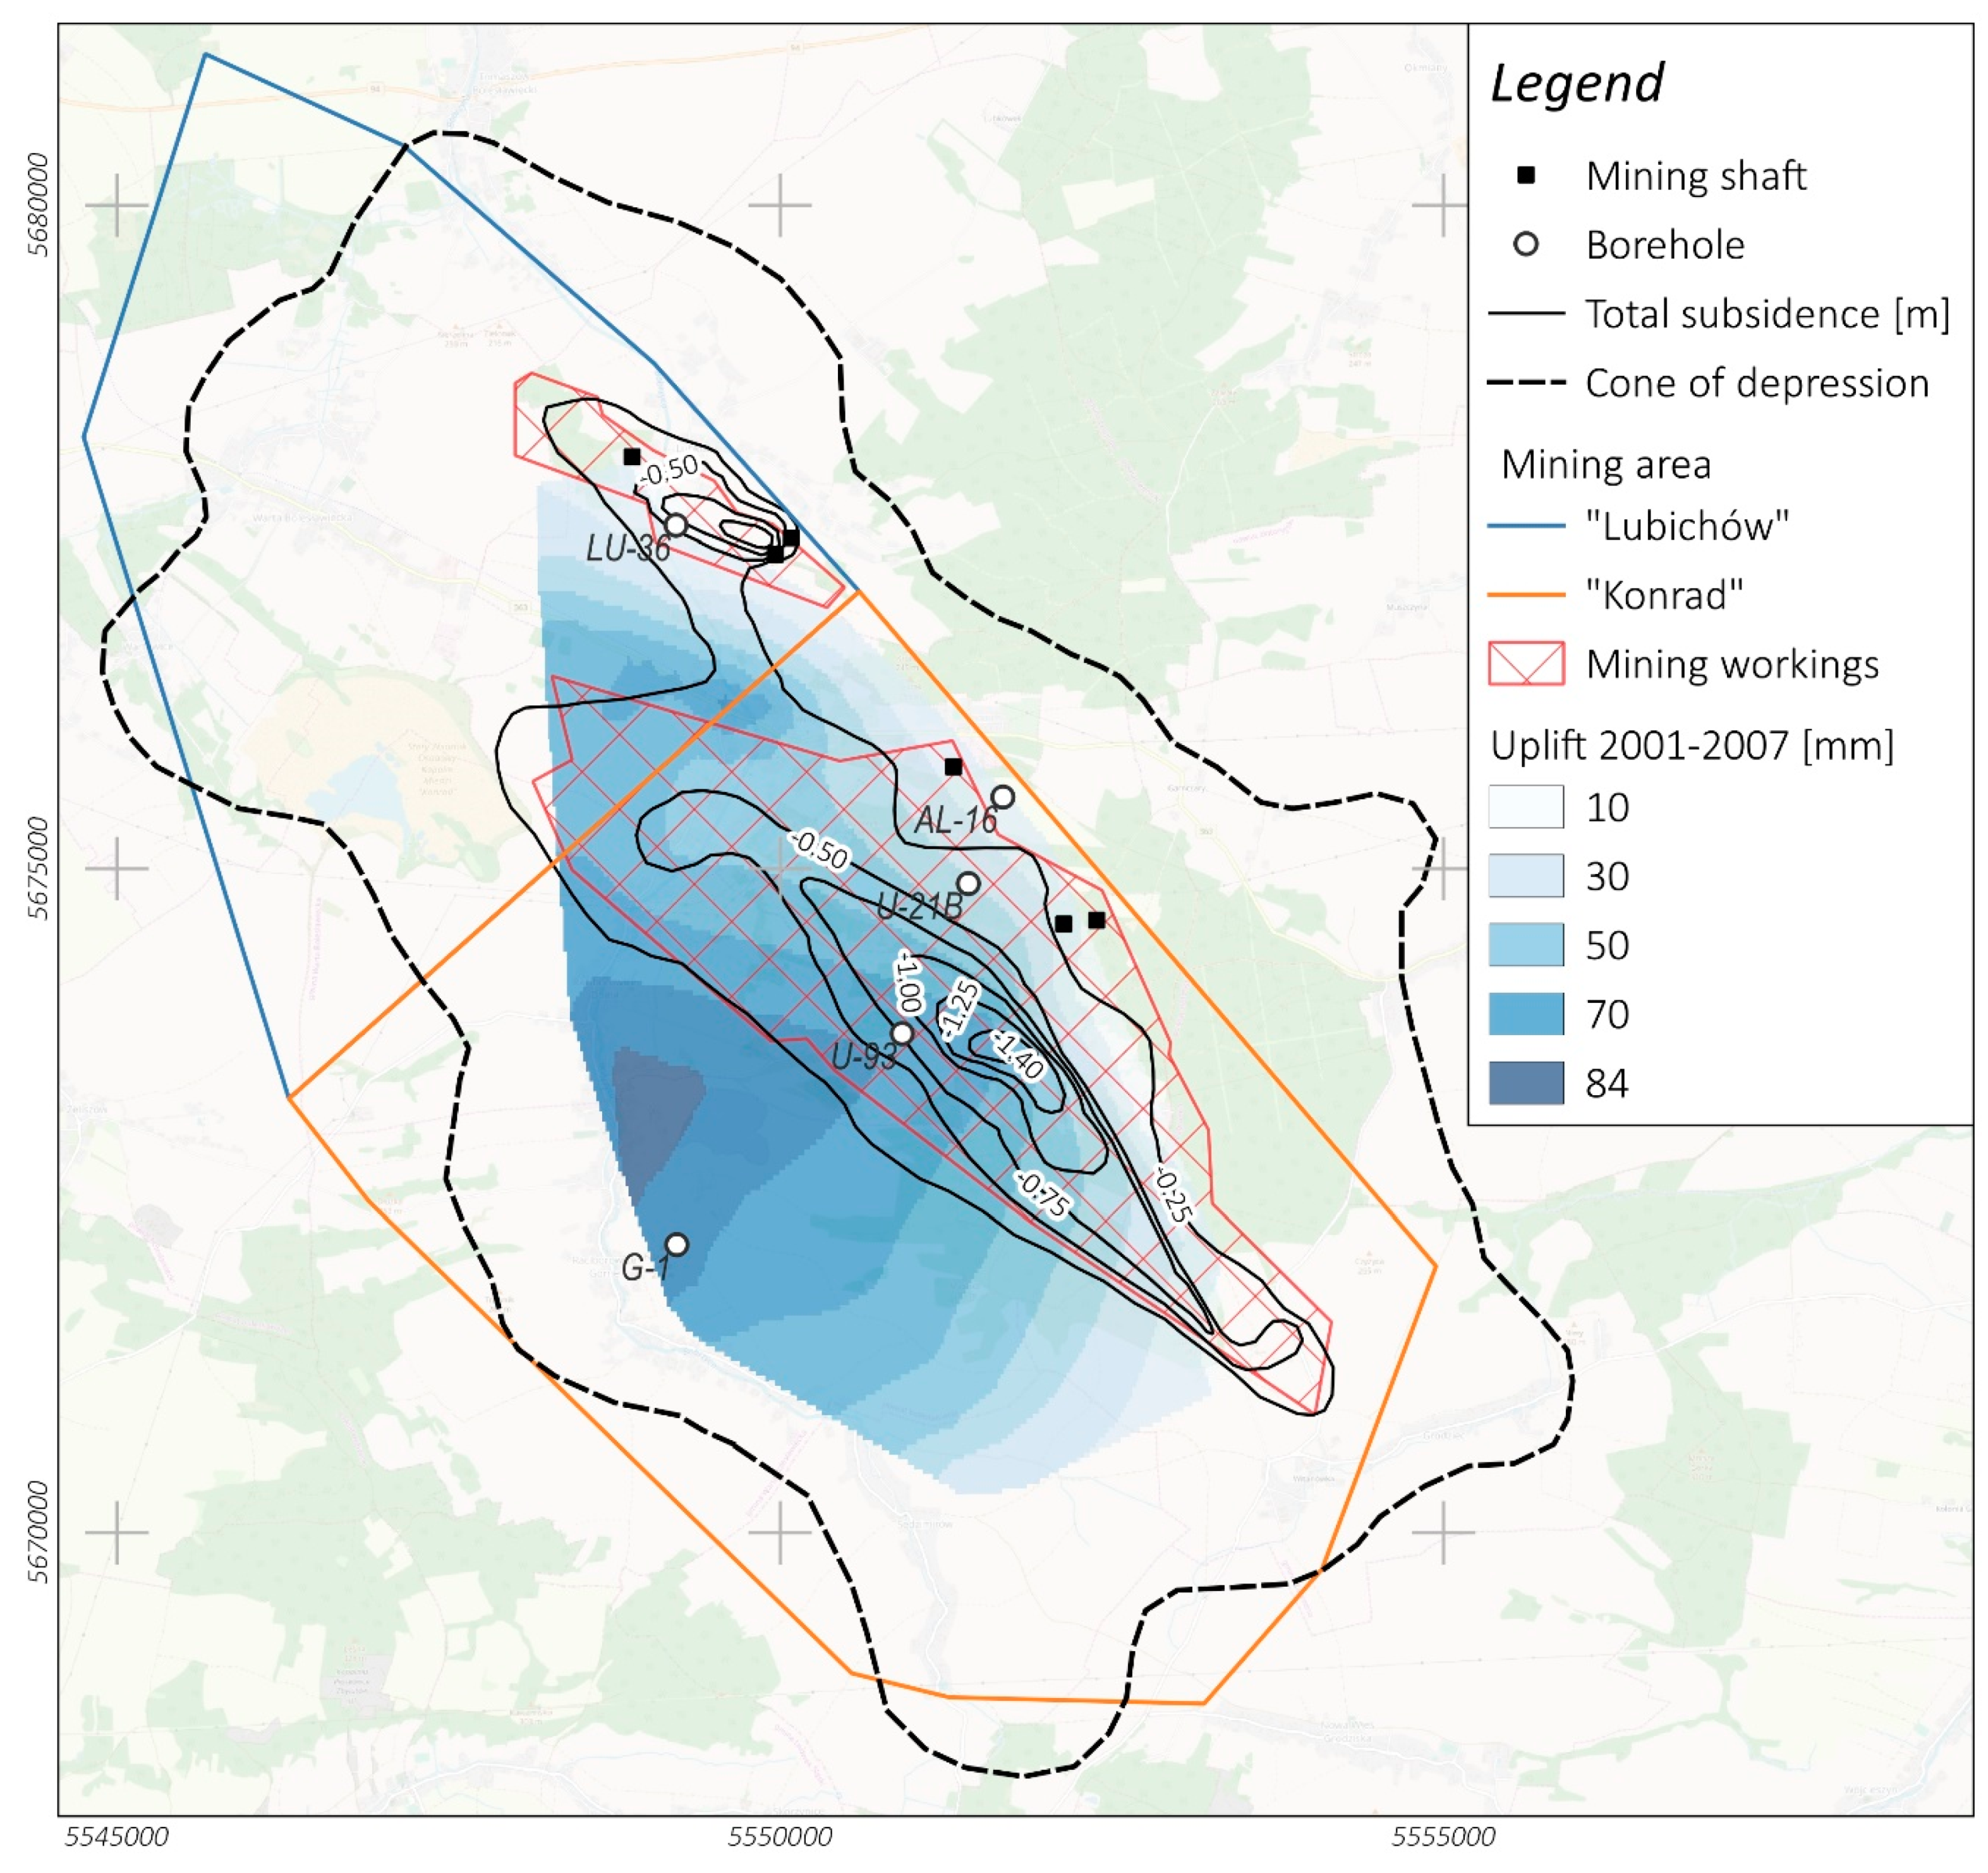
2.2. Impact of Mining Exploitation on the Terrain Surface

Underground exploitation of the copper ore deposit in the Grodziec Syncline began in 1944 in the two mines Iwiny and Lubichów [34]. The copper ore mining was carried out on several mining levels, at a depth of 156–830 m below ground level. In 1984, in the part of the mining area that belonged to the former Lubichów mine, the exploitation of gypsum and anhydrite also began. It was conducted at a depth of up to 550 m, until the beginning of 2015. The Konrad and Lubichów mines were closed by flooding. Underground excavations of the Konrad mine stopped so that it could be drained in March 2001, and the post-mining works of the Lubichów mine stopped in June 2015. Then, the mine shafts were buried, either fully or partially [36,37]. In the last years of mining operations in the Konrad mine, the groundwater head in the middle Zechstein reached the bottom of this aquifer. In 2001, the depression cone caused by copper ore, gypsum, and anhydrite mining had a total area of 70 km2 and crossed the boundaries of mining areas. The center of the depression cone was located along the outcrop of the middle Zechstein. It was estimated based on the groundwater head measurements carried out in mining shafts, boreholes, and partly in mining workings that have not yet been flooded [36,37].
Due to the mining of copper ore, gypsum, and anhydrite, the land in the study area subsided by approximately 1.4 m in the years 1944–2001 (Figure 2). The maximum surface subsidence is strongly correlated with the location of underground excavations—in the case of both the Konrad and Lubichów mines [36,37]. After the closure of the mines, terrain uplifting was observed. Land uplift was determined based on precise leveling measurements commissioned by local mining authorities. On the basis of the measurement results, it can be concluded that in the years 2001–2007, the maximum land uplift in this area was 84 mm [37]. The most substantial uplift occurred south-west of the area where the mining exploitation was carried out (Figure 2). As there are no additional measurement results available in this area, we assume that the uplift value presented was a complete one.
It is mainly the good geological, hydrogeological, and mining reconnaissance that plays an essential role in conducting the presented investigation. However, the results of measurements of ground movements and groundwater head of aquifers are the basis for the further cause and effect studies discussed in the following section.

3. Research Methodology

The research methodology was divided into three parts (Figure 3). In the first stage of work, the processing of PSInSAR images acquired above the study area was carried out (A.1). Based on satellite data, the vertical movements in the study area were estimated (A.2). Moreover, the acceleration of vertical movement was assessed (A.3). The second part of the investigation consisted of gathering data about the historical results of vertical movements (B.1). The information about ground movement and the thickness of drained rock formations (defined in selected geological boreholes (B.2)) supported the determination of the compressibility coefficient Cf of the rock mass (B.3). Finally, based on the results of the work carried out previously, an estimation of the future ground movements in the flooded Lubichów mine was made (C).

3.1. The PSInSAR Image Processing Methodology

InSAR is a technique of imaging the Earth’s surface using a side-looking radar instrument installed on satellites or airplanes [27]. Synthetic Aperture Radar (SAR) signal amplitude information can be interpreted concerning the reflective properties of objects on the ground surface. In turn, the phase is a value and represents the delay of the signal reflected from the elements of the ground surface. The interferogram is created from a pair of two acquisitions acquired at different times, but with a similar satellite position. A comparison of phase differences from the two acquisitions allows the displacement between the sensor and the ground surface to be determined, assuming invariable reflection characteristics. The observed radar signal phase ( φ ) is the sum of several components. It can be expressed by the formula (Formula (1); [27]):
φ = φ d e f + φ t o p o + φ a t m + φ o r b + φ n + 2 k π ,
where φ d e f is the deformation phase component, φ t o p o is the topographic phase component, φ a t m is the atmospheric phase component, φ o r b is the phase component due to the orbital errors of each image, φ n is the phase noise, and k is an integer value called phase ambiguity.
To determine the component associated with the deformation process, all components have to be retrieved from the observed radar signal phase. Therefore, the accuracy of the deformation phase component estimation is affected by the estimated accuracy of the other components which constitute the observed radar signal phase.
A review of existing algorithms allowing for estimation of the deformation component was presented by [31]. In general, analysis of the interferogram stack allows the deformation component ( ϕ d e f ) to be estimated through the InSAR time series. Technologies generally known as PSInSAR use spatial-temporal filtering to estimate the components from the radar signal assuming a spectral structure [38]. The obtained phase related to the deformation component is converted into metric values using radar wavelength (λ) information. In this way, the values of ground surface displacement in LOS are obtained. The method adopted here does not require a priori knowledge of a deformation model. Therefore, it allows the detection of nonlinear movements over time with millimeter accuracy [29,38]. For this reason, we consider the algorithm adopted to be an optimal tool for studying the Konrad mine area.
Sentinel-1 satellite data were used to analyze the surface movement in the study area. These were obtained during an imaging radar mission at the C-band with a wavelength of 5.6 cm and at 5 m with a 20 m spatial resolution (single look). Scientific papers [14,15] have confirmed the effectiveness of the use of this sensor in the analysis of ground surface movements caused by changes in the groundwater head. The constellation of two satellites, Sentinel-1A and Sentinel-1B, offers a six-day repeat cycle. This allows not only the scale of the phenomenon to be determined, but also the temporal and spatial changes of the deformation process. To obtain information about movements in the study area, it was necessary to analyze the same PS points in the differential geometry of satellite observations. By using the double geometry of satellite observations, it was possible to obtain two components of the ground displacement vector d . Such a solution is possible for the Sentinel-1 satellite, which operates in an ascending (asc) and descending (desc) orbit. Decomposition of the ground displacement vector d was carried out using the methodology presented in the paper [39], where the PS common points of calculations are acquired according to Formulas (2) and (3). In the research, the common points were determined by a maximum distance of 50 m value.
[ d L O S a s c d L O S d e s c ] = A [ d z d A L D ] ,
where d L O S a s c   and   d L O S d e s c represent the LOS displacement in ascending (asc) and descending (desc) geometry, respectively; d z is the vertical displacement; and d A L D is the displacement in the azimuth look direction.
Additionally, A is defined as shown in Formula (3):
A = [ c o s θ a s c s i n θ a s c c o s Δ α c o s θ d e s c s i n θ d e s c ] ,
where θ a s c   and   θ d e s c represent the incident angle of ascending (asc) and descending (desc) acquisitions, respectively, and Δα is the difference in satellite azimuth.
According to Formula (2), the equation for the value of vertical movements d z takes the following form (Formula (4)):
d z = d L O S a s c s i n θ d e s c d L O S d e s c s i n θ a s c c o s Δ α c o s θ a s c s i n θ d e s c + s i n θ a s c c o s Δ α c o s θ d e s c .
The investigation was carried out between 2014 and 2018. Images from both the descending and ascending track were processed (Tracks 73 and 22) using SNAP Software by the European Space Agency to generate interferograms [40] and the StaMPS/MTI software package to determine LOS ground surface displacement [29]. Finally, 299 interferograms for both geometries were generated based on selected master acquisition (Table 1). In total, 145 and 154 interferograms were analyzed for descending and ascending satellites, respectively. The dual geometry of the imaging was used to convert LOS motion into ground vertical movements [27,39]. The decomposition process of the displacement field vector was performed for common points from both geometries, taking the annual values of the movement velocity. As a result, information on the vertical displacement for each point selected in the analyzed area was obtained (Section 4.1). The analyses were deepened by the decomposition of time series in the area exhibiting the highest observed dynamics of the phenomenon. As a result, the dynamics of ground movements were obtained (Section 4.2).

3.2. PSInSAR Processing Accuracy

To determine the accuracy of the vertical movements, a time series analysis was performed for all PS points in Tracks 73 and 22. First of all, the first-degree polynomials were fitted to the observations for each PS point, producing the mean movement velocity. In stable regions, observations should only show an oscillation around 0, resulting from the noise component ( ϕ N ) of the radar signal. For the assumed linear deformation model, deviations from the trend in the time series of PS points with values within ±3.0 mm/y (98% of all PS points from Tracks 73 and 22) were determined. Therefore, it was possible to determine the standard deviation (σ) for these PS points (Figure 4A,B). The deviations ranged from ±1.8 to ±11.6 mm for the Track 73 observations and ±1.3 to ±12.1 mm for the Track 22 observations. These distributions are presented as a function of the signal coherence, which is related to the accuracy of the obtained movement values (Figure 4A,B). It can be said that the higher the value of coherence, the smaller the standard deviation of the determined total displacement. The determined values are accumulated in the initial parts of the graphs. Individual observations are found in the area of higher values of standard deviations. It was also essential to check whether the accuracy of the determined observations was affected by the scale of movements. The whole dataset had 4923 PS points for Track 73 and 13,314 PS points for Track 22. Movements of ±0.2 mm/y represent 25% of all observations in both tracks. The movements of ±3.0 mm/y accounted for 98% of all observations. Therefore, calculations were made for the narrowed PS point group (±0.2 mm/y) and the extended group (±3.0 mm/y, after removing the observations from the range ±0.2 mm/y). The analysis of the results shows no significant differences in the obtained distributions (Figure 4A,B). Dependence on the coherence in each group assumes similar characteristics. The mode values were calculated due to the skewness of the distributions of mean values. The modes in the first point group (±0.2 mm/y) and second point group (±3.0 mm/y) took the same values at σ = ±3.1 mm for Track 73 and σ = ±2.7 mm for Track 22. Therefore, the characteristics of observations concerning the linear model are constant for both stable points over time (±0.2 mm/y) and points with dynamics in range ±3.0 mm/y (Figure 4A,B).
Using the error propagation, the accuracy of vertical movements was determined according to Formula (5):
m d z = ( d z d l o s a s c ) 2 m d l o s a s c 2 + ( d z d l o s d e s c ) 2 m d l o s d e s c 2 ,
where m d l o s a s c is ±3.1 mm and m d l o s d e s c is ±2.7 mm.
For the Konrad mine region and the observation period of 2014–2018, m d z was ±4.4 mm.
The accuracy value is influenced not only by the adopted model of deformation, but also by the source of the movement of the ground surface itself. Additionally, an in-depth analysis of the time series of observations in the area of stable PS points was performed. The conclusions are discussed using the selected PS point (Point A), which can be considered stable concerning the determined value of m d z = ±4.4 mm (Figure 5).
By analyzing the time series of observations of Point A, both the trend and seasonality in the analyzed phenomenon become visible. The long-term trend indicates a total ground surface lowering value of −3 mm. At the same time, more than four years of observation is sufficient to separate trend and seasonality, even though the seasonal amplitude is high. The differences between the scale of movements during cold and warm periods are more significant than the total value of movements resulting from the trend of the phenomenon. These movements in cold periods indicated up direction displacement and in warm periods indicated down direction displacement, which is a natural phenomenon associated with, e.g., freezing and thawing of the ground medium.
Therefore, it should be noted that the determined value of m d z = ±4.4 mm may also contain a deterministic component related to subtle movements of the ground surface observed, e.g., for PS Point A. At the same time, there may be difficulties in interpreting movements in periods of less than one year, in areas that are theoretically stable. The fitted linear model is less resistant to outliers, in the period 2015–2016, where the imaging repeat cycle of Sentinel-1 is twice as low as in 2017–2018.

3.3. Modeling of the Rock Matrix Volume Change

The storage coefficient is considered to be one of the main parameters while determining the relationship between the change in groundwater head and the volume of rock mass [41]. This coefficient provides essential information on how the rock mass reacts to changes in hydrostatic pressure. Small changes in the effective pressure in the pores of the rock mass, which are induced by changes in groundwater head, lead to quasilinear movements of the ground surface [22]. Currently, many researchers argue that in the case of a compressible aquifer system, horizontal deformations are much smaller than vertical deformations (i.e., at least 2–3 orders of magnitude smaller). For this reason, they can be ignored and treated as irrelevant [42,43]. Therefore, the compression of rock mass caused by dewatering of the aquifer can be calculated based on the relation between the vertical movement of the terrain surface over time and the thickness of the dewatered rock mass (Formula (6)):
C f = d z Δ w
where C f is the compression coefficient of rock mass and Δ w is the thickness of the dewatered rock mass (m).
The proposed compression coefficient Cf of rock mass was determined considering the dynamics and fluctuation of groundwater inflows into underground mine excavations. A similar equation was used in models of prediction of ground surface vertical movements caused by the extraction of fluidized materials [44]. Calculation of the compression coefficient Cf of the rock mass was carried out in the closed Konrad mine. In this calculation, the observed ground surface uplift in the period 2001–2007 caused by groundwater rebound to the Zechstein aquifer was applied. The thickness of the aquifer was determined based on four geological boreholes (Figure 2).
Due to similar geological, hydrogeological, and mining conditions in the areas of the two analyzed mines, it was assumed that the value of the compression coefficient Cf of rock mass calculated for the Konrad mine is also relevant for the area of the Lubichów mine. Therefore, in the next stage of the research, this coefficient was used to estimate the degree of groundwater rebound for the Lubichów mine in previous years. These calculations were carried out based on the modified Formula (6). Moreover, an analysis of the temporal evolution of the degree of groundwater rebound in the Lubichów mine allowed for an estimation of the time of total flooding of the mine. This prediction was carried out by trend line extrapolation.
The approximate value of the change in groundwater head in the Lubichów mine was calculated for the borehole, which was located in the area of maximum observed uplift in the 2014–2018 period (borehole LU-36, please see Figure 2 for location). This point was also located in the place where the thickness of the Zechstein aquifer was the largest. Moreover, given the nonlinear nature of the observed land uplift in the studied area (see Section 4.1 and Section 4.2), the total value of the change in thickness of dewatered rock mass Δ w in the Lubichów mine area was determined by summing up the values of these changes, which were determined in the annual interval.
The analysis of groundwater head change in the Lubichów mine was carried out at one borehole owing to a lack of data for different boreholes (see Section 2).

4. Results and Discussion

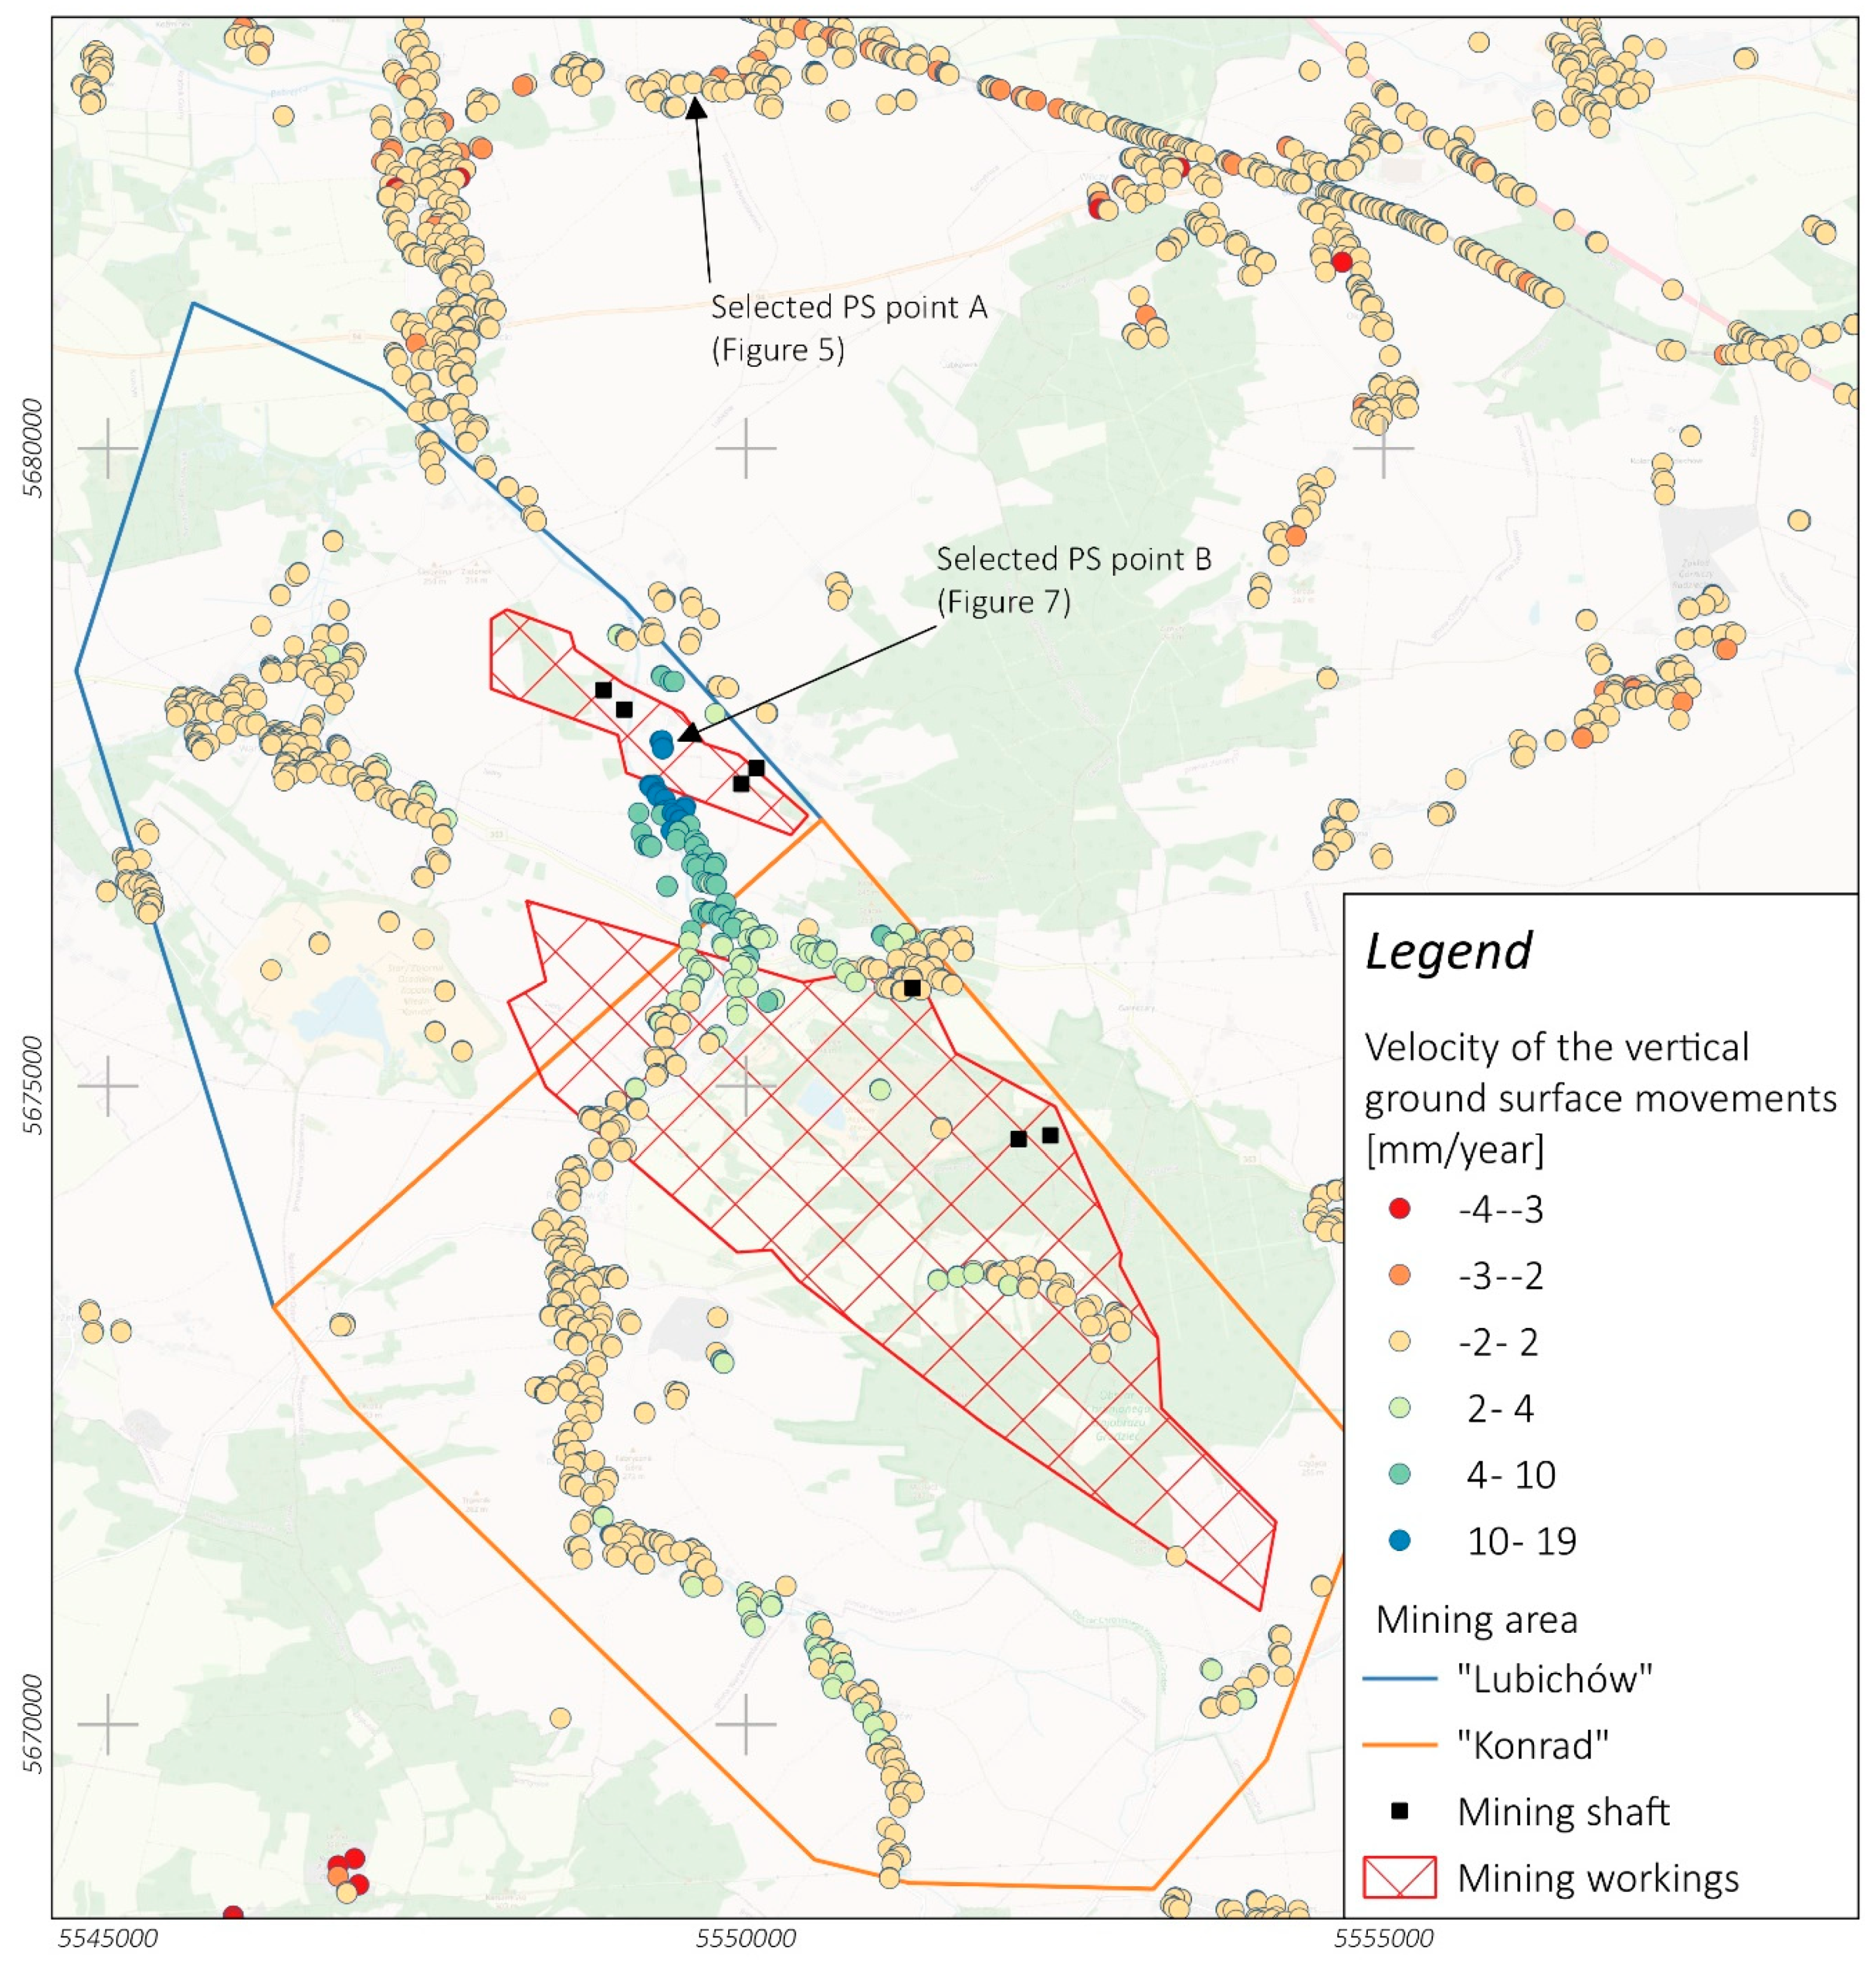
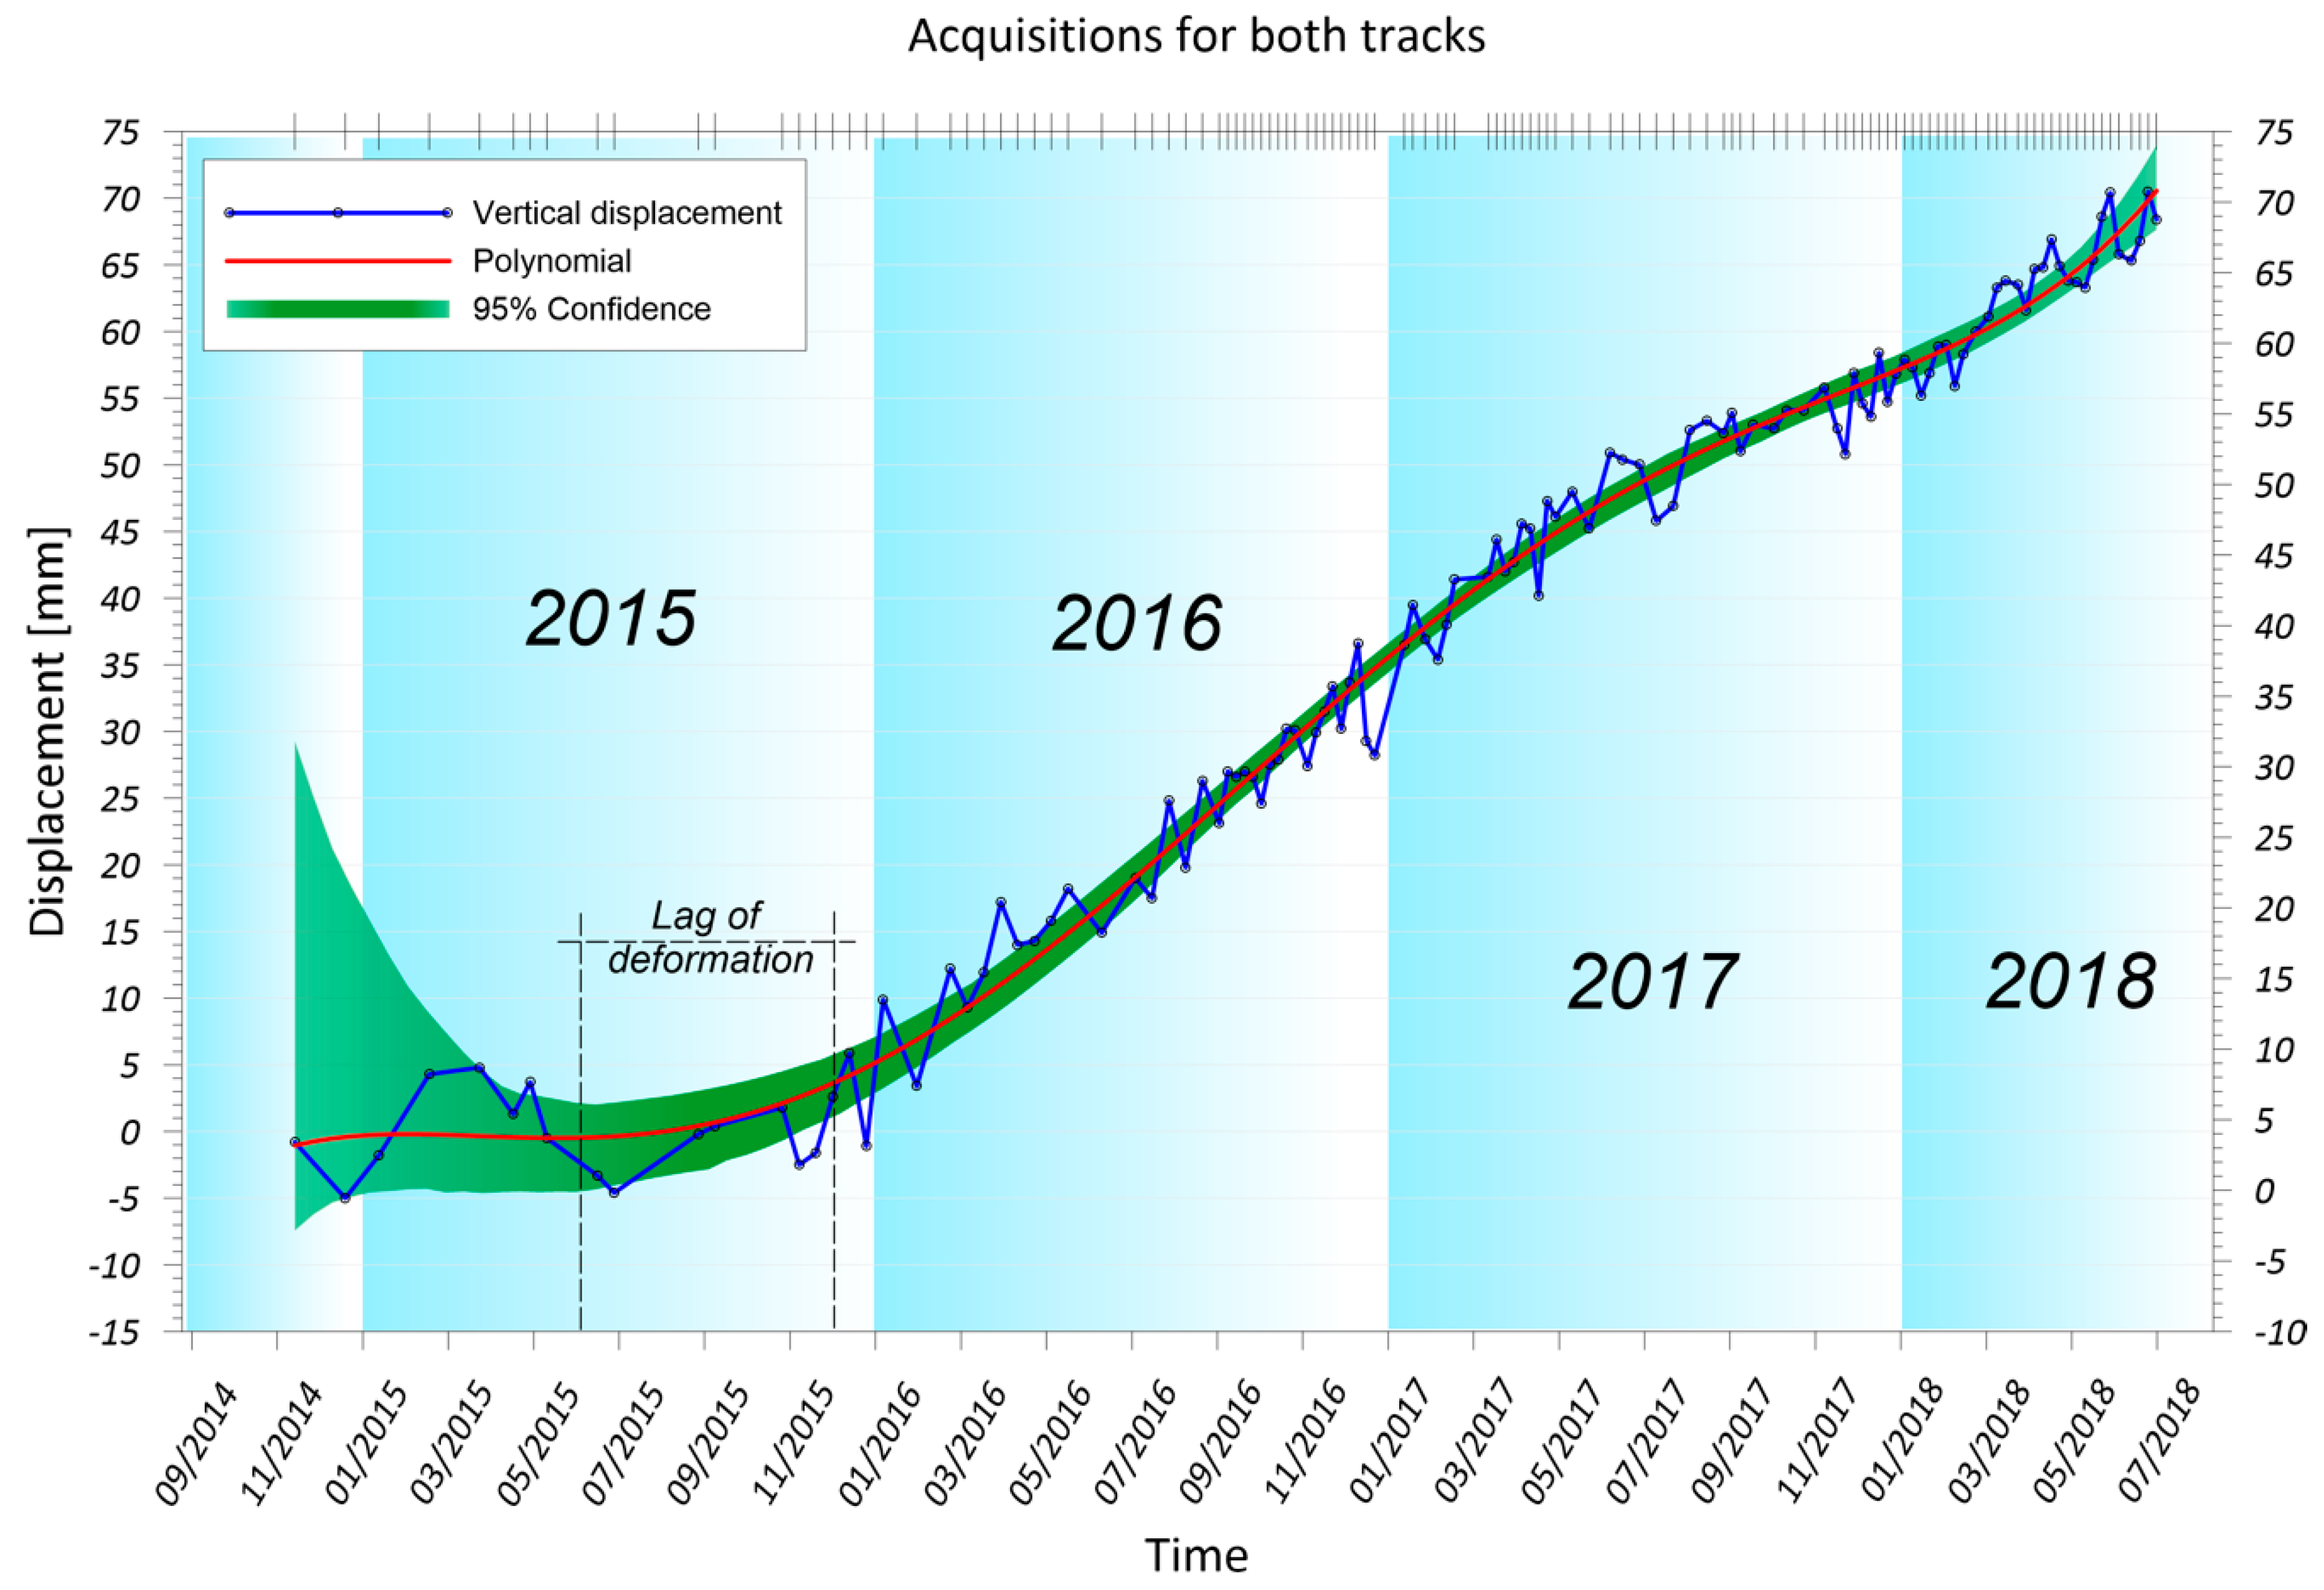
4.1. Vertical Ground Movement Velocity Observed by PSInSAR

The study area mostly consists of agricultural and forest areas, with few buildings. Full PS point coverage of the entire study area was not possible, mainly due to the time range of the calculation, which covered a total of four years. In the winter months, there was snow cover on the fields that lasted for several months. This resulted in the rejection of potential PS points due to their variable characteristics over time. Stable signal coverage was obtained in built-up areas, where the snow cover was systematically removed, whether from the road surface or the surrounding residential buildings. Therefore, the distribution of PS points reflects the network of road connections and clusters of residential and commercial buildings. The highest density of PS points was thus obtained in urbanized areas (see Supplementary Materials: Figures S1 and S2). Such results, despite the low density of PS points in rural areas, allowed for further analyses of the deformation process.
Outside mining areas, nearly 95% of the obtained PS points show vertical ground surface movements of ±2 mm/y. The accuracy of the PSInSAR method was determined by analyzing the time series of PS points located outside the mining area (see Section 3.2). All PS points show upward movement within the boundaries of the Konrad and Lubichów mining areas. Generally, there are two main areas of ground movement (Figure 6). The first, with a small scale of the phenomenon, can be distinguished in the Lubichów mining area, where the velocity of vertical movements does not exceed +4 mm/y. The movements of the ground surface, calculated over the four years under consideration, do not exceed +15 mm. The magnitude of movements confirms the assumption about the attenuation of the deformation process [37]. The highest values of vertical ground movements in the 2014–2018 period were observed in the eastern part of the Lubichów mining area. The deformation velocity in this area was up to +19 mm/y, which, on a scale of four years, allows for a cumulative value of +76 mm (Figure 6). In the analyzed area, there is a center of the basin in the area of old mining shafts, where, in the past, there was a drainage of aquifers. This is where the local center of the depression cone was located (borehole LU-36, please see Figure 2 for location). The nature of the observed vertical movements of the ground surface can be related to the recovery of groundwater head in aquifers. The uplift of the ground surface covers an area of 3.5 × 3.5 km.

4.2. Dynamics of the Ground Movements

The next stage of research was to determine the dynamics of the process of deformation of the ground surface. For this purpose, a pair of PS points for ascending and descending geometry was selected from the region with the highest vertical movements (Figure 6). Standard observation dates were set so that the decomposition of time series of LOS movements could be performed.
The dynamics of the deformation process change over time (Figure 7). In 2015, there was displacement in the range of the accuracy level of PSInSAR results. During this time, the uplift reached +5 mm. Only at the end of 2015 did the velocity of vertical ground movements increase significantly. In subsequent years, it remained at a similar level. The maximum vertical movements observed in less than three years (2016–2018) exceeded +70 mm. By calculating a derivative of the function fitted to the observations, information on the velocity of ground surface movements was obtained. The maximum value reached +28 mm/y at the turn of 2016 and 2017. Therefore, the movement values obtained from the classical interpretation of PS results (presented in Section 4.1) significantly differ from the analysis presented. This indicates an intensification of the phenomenon in the initial phase of the process. At the end of this period (second half of 2017), a slight decrease in the dynamics of the phenomenon is visible. The trend analysis indicates a possible further development of the displacement field and thus the necessary further observation of the dynamics of change.
What is also critical is the observed time delay that accompanied the process of flooding the mine and uplifting of the surface. In June 2015, the process of groundwater rebound in the Lubichów mine began. The process of uplifting the ground surface only became active after about half a year, i.e., at the end of 2015 (Figure 7). This allows a thesis about delaying the process of deformation of the ground surface concerning the moment of pressure change in aquifers to be put forward.

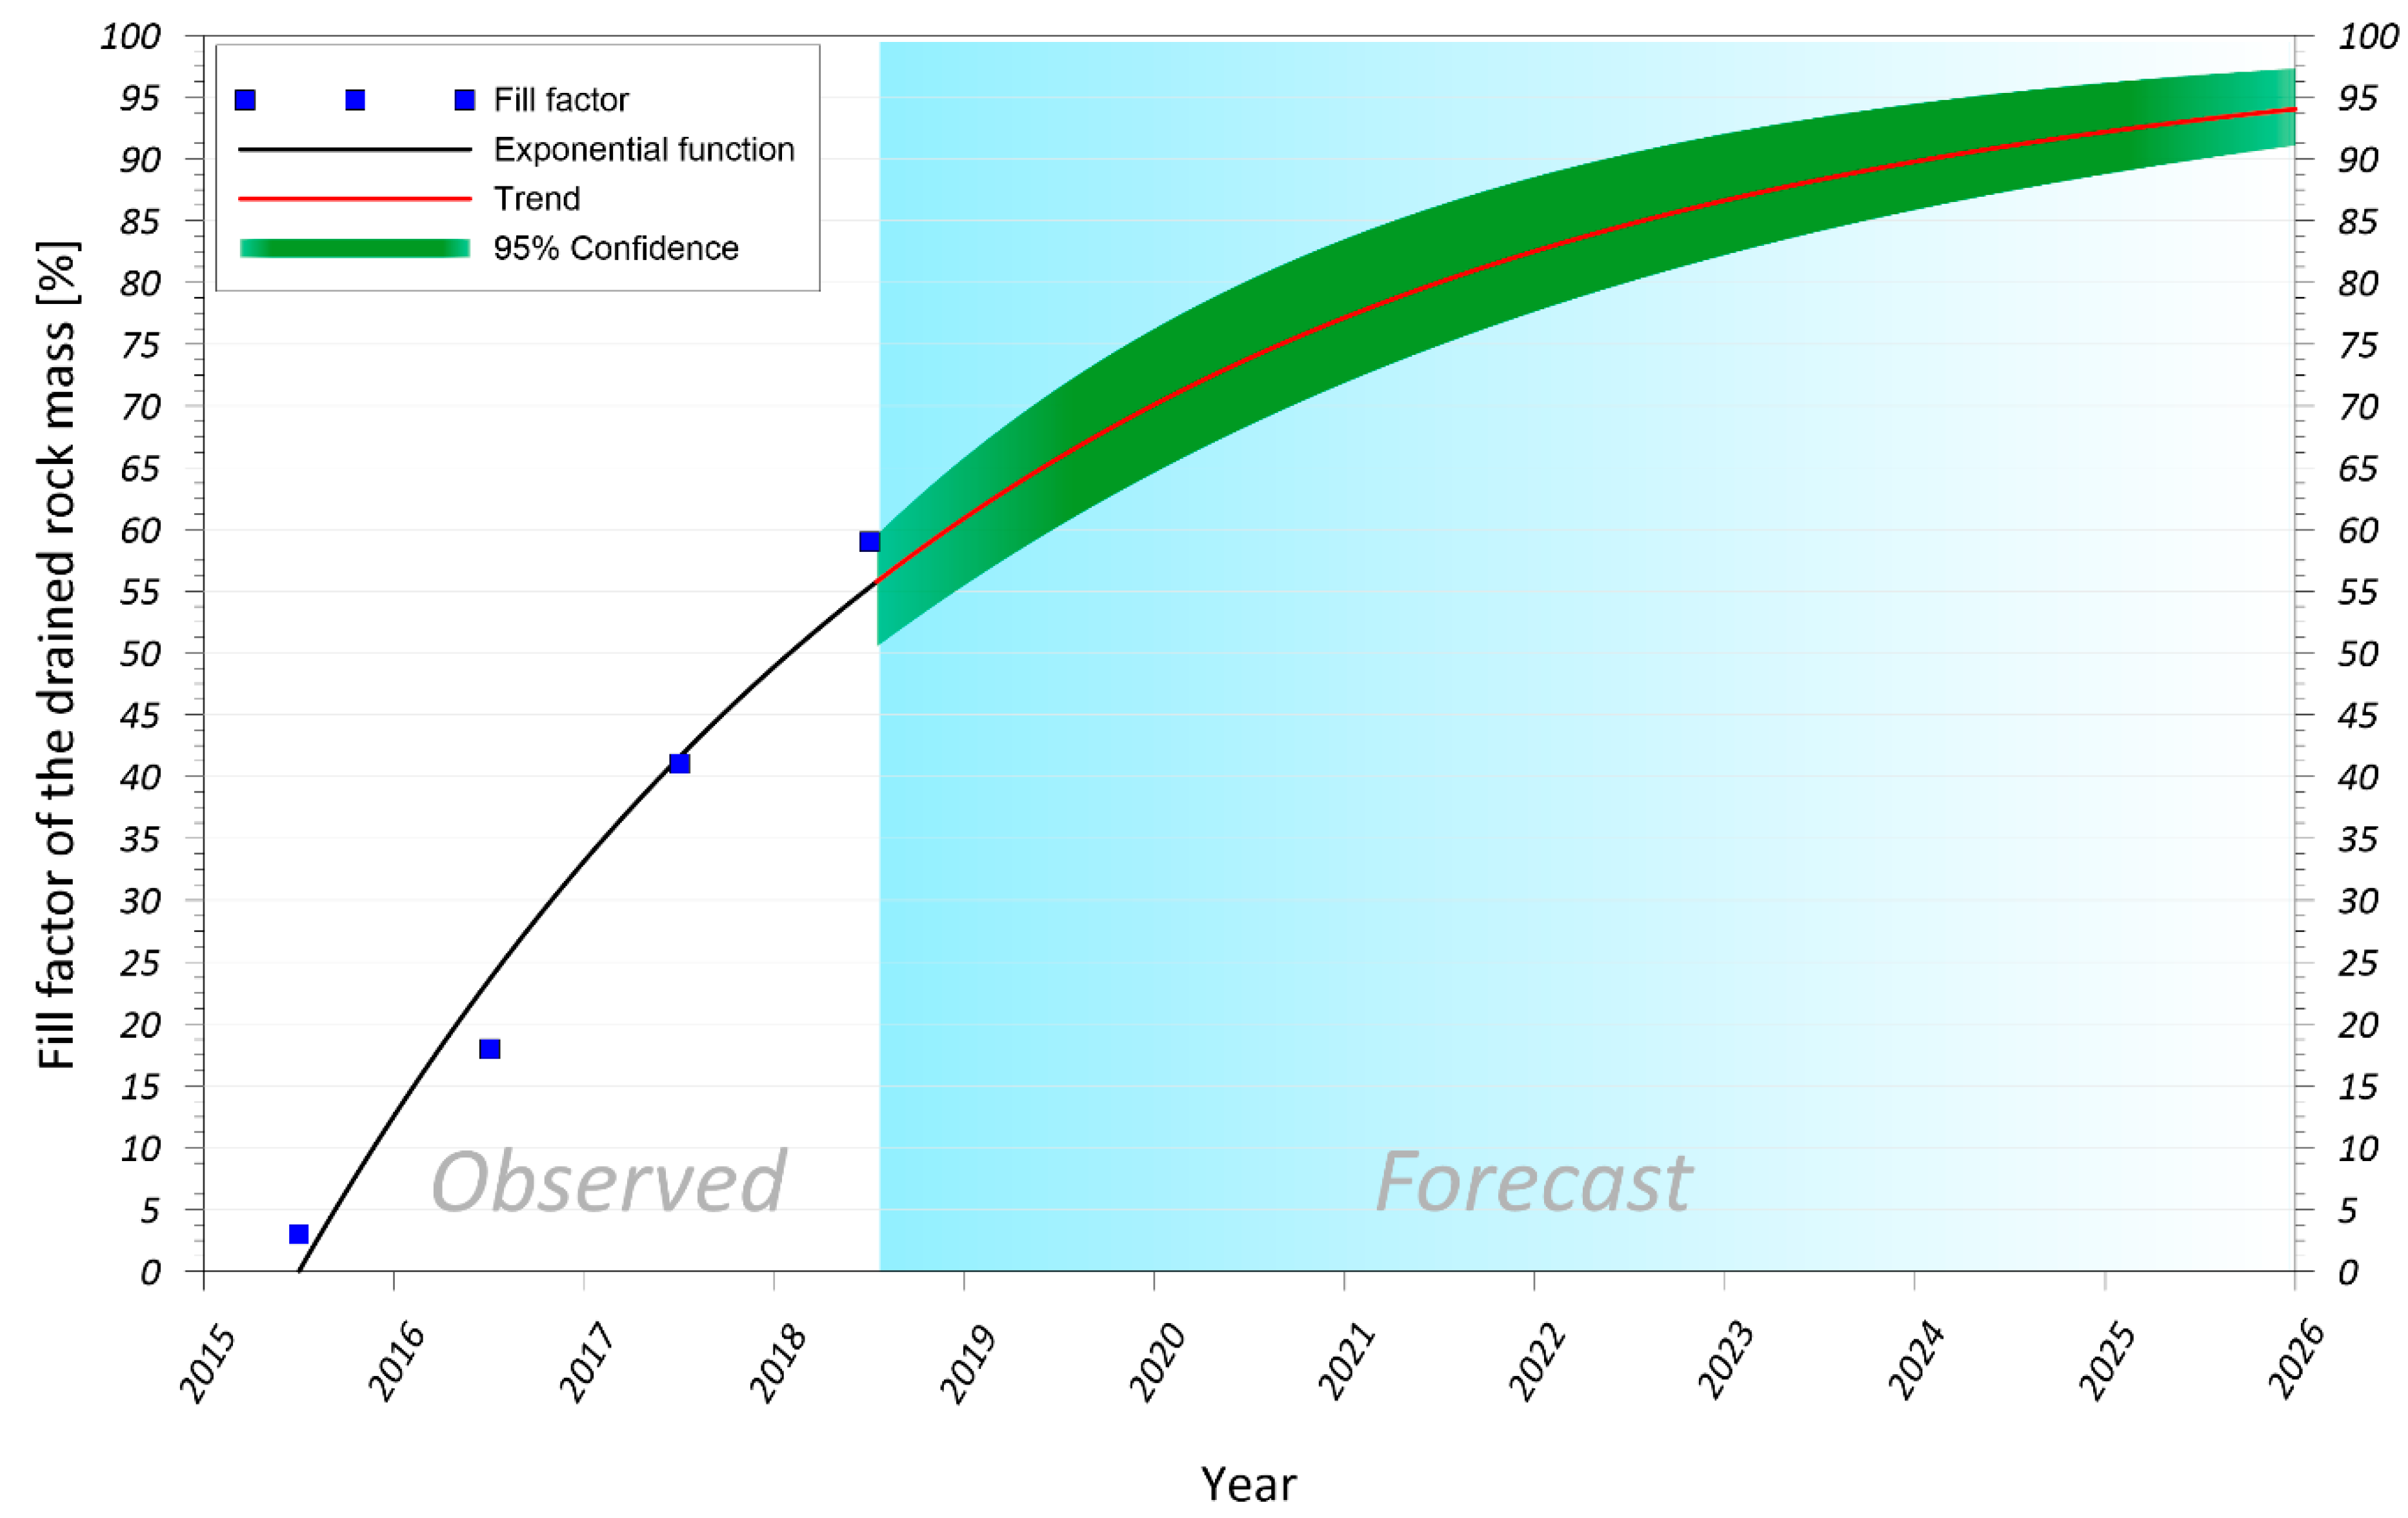
4.3. Spatio-Temporal Evolution of Groundwater Recharge from Vertical Ground Movements

The mean value of the calculated compression coefficient of the rock mass Cf was 5.55 × 10⁻⁴, with a standard deviation of 6.26 × 10⁻⁵ (Table 2). Although the estimated values of this coefficient are only indicative, the standard deviation of the average value of the analyzed parameter indicates that it is statistically significant. This suggests that there is a certain degree of correlation between the observed land uplift and the total thickness of dewatered rock mass. Considering the above, as well as the lack of availability of more extensive measurement data, the determined average value of the compression coefficient Cf of rock mass was used in the following part of the conducted research. This work aimed to determine the change in the groundwater head in the Zechstein aquifer of the Lubichów mine. Flooding of the mine began in 2015.
Based on the compression coefficient determined using data from the Konrad mine, the groundwater head at the point LU-36 located in the Lubichów mine (Figure 2) increased by 126 m in the Zechstein aquifer in the whole analyzed period. The highest dynamics of groundwater recovery occurred in the period from August 2016 to July 2017, when the groundwater head rose by 50 m (Table 3).
The change in the groundwater head for the Lubichów mine, combined with the thickness of the dewatered rock mass, allowed the groundwater rebound of the mine to be determined (Figure 8). In 2018, groundwater filling of the dewatered rock mass was approximately 59%. This means that, in about three years, the groundwater head reached more than half of its original value, i.e., before starting to drain the rock mass. Assuming an exponential trend with an asymptote 100% of the described phenomenon, full groundwater recovery on a 95% level will last to the end of 2026 (Figure 8). The decreasing trend of groundwater head rise as a function of time was expected, and is confirmed by the global experience related to the course of underground mine flooding and the recovery of groundwater [12,19]. In such a case, by the end of 2026, the groundwater rebound in the Zechstein aquifer in the Lubichów mine is estimated, with a 95% probability, to be approximately from 93% to 98%.
Based on the compression coefficient Cf of rock mass calculated, it can be concluded that in the analyzed area, the uplift of the ground surface of 1 mm is connected with the rise of the groundwater head by approximately 1.8 m. Therefore, it can be expected that with the probability of 95% and a decreasing trend of rising groundwater head, the uplift of the ground surface with values of up to several millimeters per year will occur for the next 6–8 years from the end of the time series. After this period, it should be expected that the groundwater resources will be fully restored, and that the land uplift in the analyzed area will thus be terminated.

5. Conclusions

The presented research allowed ground surface movements associated with the end of the exploitation of the underground mine to be determined. Uplift in the analyzed area was induced by groundwater head rise in the aquifer. An attempt was made to determine the impact of the change in hydrogeological conditions resulting from mining operations on ground surface movements. Among other things, it has been proved in the research that after the closure of a mine, in which the exploitation disturbed the balance in aquifers, uplifting occurs on the surface.
The investigation presented revealed that the PSInSAR method allows uplift for the observation period of 2014–2018 in the Konrad mine to be estimated. The added value of the conducted research was an attempt to model the time-dependent ground uplift caused by groundwater rebound in aquifers. Moreover, it has been shown that the uplifting of the ground surface in the studied area has an exponential characteristic. The determined average compression coefficient of the rock mass was the basis for estimating the time in which movements of the ground surface will continue. With a probability of 95% and a decreasing trend of rising groundwater head, the uplift of the ground surface with values of up to 12 mm/y will occur for the next 6–8 years in the study area (refill fraction on 10% levels). After this period, it should be expected that the groundwater resources will be fully restored, and that the land uplift in the analyzed area will thus cease.
The presented research methodology may constitute a universal approach based on PSInSAR measurements of surface movements combined with modeling, which may be used in other post-mining areas. This approach could help in estimating the end time of surface movements in areas of abandoned underground mines where the groundwater head stabilizes.

Supplementary Materials

The following are available online at https://www.mdpi.com/2072-4292/12/11/1786/s1, Figure S1: Line-of-Sight (LOS) displacements for ascending passes; Figure S2: LOS displacements for descending passes.

Author Contributions

Conceptualization, R.H., A.A.M., W.T.W., and A.G.; methodology, W.T.W. and A.G.; software, W.T.W.; validation, W.T.W. and A.G.; formal analysis, W.T.W. and A.G.; investigation, W.T.W. and A.G.; data curation, W.T.W. and A.G.; writing—original draft preparation, W.T.W. and A.G.; writing—review and editing, R.H., A.A.M., W.T.W., and A.G.; visualization, W.T.W. and A.G.; supervision, R.H. and A.A.M.; funding acquisition, A.G., R.H. and A.A.M. All authors have read and agreed to the published version of the manuscript.

Funding

The presented investigation is part of the research project “Modelling of land surface movements due to rock mass drainage” funded by the National Science Centre in Poland, PRELUDIUM-17 Grant No. 2019/33/N/ST10/00724.

Acknowledgments

The authors acknowledge the European Space Agency and Polish Geological Institute-National Research Institute for providing Sentinel-1 radar satellite images, as well as geological and hydrogeological data, respectively. All these data are freely and fully accessible to all users. Interested researchers can download these data directly from the European Space Agency and Polish Geological Institute-National Research Institute webpages. Detailed guidelines on data availability are accessible at the following websites: www.esa.int/ and www.pgi.gov.pl/. The authors would also like to thank the anonymous reviewers who helped to improve the original manuscript. This work is a contribution to the UNESCO Land Subsidence International Initiative (LaSII; https://www.landsubsidence-unesco.org/). This publication is listed on the webpage www.landsubsidence-unesco.org/publications/.

Conflicts of Interest

The authors declare no conflicts of interest. The funders had no role in the design of the study; in the collection, analyses, or interpretation of data; in the writing of the manuscript; or in the decision to publish the results.

References

  1. Brown, T.J.; Idoine, N.E.; Raycraft, E.R.; Shaw, R.A.; Hobbs, S.F.; Everett, P.; Deady, E.A.; Bide, T. World Mineral Production 2012–2016; British Geological Survey: Nottingham, UK, 2018. [Google Scholar] [CrossRef] [Green Version]
  2. Islam, M.; Hayashi, D.; Kamruzzaman, A. Finite Element Modeling of Stress Distributions and Problems for Multi-Slice Longwall Mining in Bangladesh, with Special Reference to the Barapukuria Coal Mine. Int. J. Coal Geol. 2009, 78, 91–109. [Google Scholar] [CrossRef]
  3. Whittaker, B.N.; Reddish, D.J. Subsidence: Occurrence, Prediction, and Control; Elsevier: Amsterdam, The Netherlands, 1989. [Google Scholar]
  4. Terzaghi, K.; Mesri, G.; Peck, R. Soil Mechanics in Engineering Practice/Karl Terzaghi, Ralph B Peck, Gholamreza Mesri, 3rd ed.; John Wiley & Sons: New York, NY, USA, 1996; ISBN 978-0-471-08658-1. [Google Scholar]
  5. Younger, P.; Adams, R. Predicting Mine Water Rebound: Progress Reports; Environment Agency R&D Technical Report W179: Bristol, UK, 1999; 108p. [Google Scholar]
  6. Bukowski, P. Water Hazard Assessment in Active Shafts in Upper Silesian Coal Basin Mines. Mine Water Environ. 2011, 30, 302–311. [Google Scholar] [CrossRef] [Green Version]
  7. Gui, H.; Song, X.; Lin, M. Water-Inrush Mechanism Research Mining above Karst Confined Aquifer and Applications in North China Coalmines. Arab. J. Geosci. 2017, 10, 1–9. [Google Scholar] [CrossRef]
  8. Fan, G.; Zhang, S.; Zhang, D.; Zhang, C.; Chen, M.; Li, Q. An Index of Aquiclude Destabilization for Mining-Induced Roof Water Inrush Forecasting: A Case Study. Water 2019, 11, 2170. [Google Scholar] [CrossRef] [Green Version]
  9. Yin, H.; Zhao, H.; Xie, D.; Sang, S.; Shi, Y.; Tian, M. Mechanism of Mine Water Inrush from Overlying Porous Aquifer in Quaternary: A Case Study in Xinhe Coal Mine of Shandong Province, China. Arab. J. Geosci. 2019, 12. [Google Scholar] [CrossRef]
  10. Wolkersdorfer, C. Water Management at Abandoned Flooded Underground Mines: Fundamentals, Tracer Tests, Modelling, Water Treatment; Springer: Berlin/Heidelberg, Germany, 2008. [Google Scholar] [CrossRef]
  11. Nichols, T.C. Rebound, Its Nature and Effect on Engineering Works. Q. J. Eng. Geol. 1980, 13, 133–152. [Google Scholar] [CrossRef]
  12. Bekendam, R.F.; Pottgens, J.J. Ground Movements over the Coal Mines of Southern Limburg, the Netherlands, and Their Relation to Rising Mine Waters. Subsid. Proc. Int. Symp. Hague 1995, 234, 3–12. [Google Scholar] [CrossRef]
  13. Caro Cuenca, M.; Hanssen, R.F. Subsidence and Uplift at Wassenberg, Germany Due to Coal Mining Using Persistent Scatterer Interferometry. In Proceedings of the 13th FIG International Symposium on Deformation Measurements and Analysis, Lisbon, Portugal, 12–15 May 2008; pp. 1–9. [Google Scholar]
  14. Caro Cuenca, M.; Hooper, A.J.; Hanssen, R.F. Surface Deformation Induced by Water Influx in the Abandoned Coal Mines in Limburg, The Netherlands Observed by Satellite Radar Interferometry. J. Appl. Geophys. 2013, 88, 1–11. [Google Scholar] [CrossRef]
  15. Bateson, L.; Cigna, F.; Boon, D.; Sowter, A. The Application of the Intermittent SBAS (ISBAS) InSAR Method to the South Wales Coalfield, UK. Int. J. Appl. Earth Obs. Geoinf. 2015, 34, 249–257. [Google Scholar] [CrossRef] [Green Version]
  16. Samsonov, S.; D’Oreye, N.; Smets, B. Ground Deformation Associated with Post-Mining Activity at the French-German Border Revealed by Novel InSAR Time Series Method. Int. J. Appl. Earth Obs. Geoinf. 2013, 23, 142–154. [Google Scholar] [CrossRef]
  17. Vervoort, A.; Declercq, P.Y. Surface Movement above Old Coal Longwalls after Mine Closure. Int. J. Min. Sci. Technol. 2017, 27, 481–490. [Google Scholar] [CrossRef]
  18. Blachowski, J.; Kopec, A.; Milczarek, W.; Owczarz, K. Evolution of Secondary Deformations Captured by Satellite Radar Interferometry: Case Study of an Abandoned Coal Basin in SW Poland. Sustainability 2019, 11, 884. [Google Scholar] [CrossRef] [Green Version]
  19. Svigkas, N.; Papoutsis, I.; Constantinos, L.; Tsangaratos, P.; Kiratzi, A.; Kontoes, C.H. Land Subsidence Rebound Detected via Multi-Temporal InSAR and Ground Truth Data in Kalochori and Sindos Regions, Northern Greece. Eng. Geol. 2016, 209, 175–186. [Google Scholar] [CrossRef]
  20. Chen, C.T.; Hu, J.C.; Lu, C.Y.; Lee, J.C.; Chan, Y.C. Thirty-Year Land Elevation Change from Subsidence to Uplift Following the Termination of Groundwater Pumping and Its Geological Implications in the Metropolitan Taipei Basin, Northern Taiwan. Eng. Geol. 2007, 95, 30–47. [Google Scholar] [CrossRef]
  21. Ishitsuka, K.; Fukushima, Y.; Tsuji, T.; Yamada, Y.; Matsuoka, T.; Giao, P.H. Natural Surface Rebound of the Bangkok Plain and Aquifer Characterization by Persistent Scatterer Interferometry. Geochem. Geophys. Geosyst. 2014, 15, 965–974. [Google Scholar] [CrossRef]
  22. Galloway, D.L.; Hoffmann, J. The Application of Satellite Differential SAR Interferometry-Derived Ground Displacements in Hydrogeology. Hydrogeol. J. 2007, 15, 133–154. [Google Scholar] [CrossRef] [Green Version]
  23. Strozzi, T.; Delaloye, R.; Poffet, D.; Hansmann, J.; Loew, S. Surface Subsidence and Uplift above a Headrace Tunnel in Metamorphic Basement Rocks of the Swiss Alps as Detected by Satellite SAR Interferometry. Remote Sens. Environ. 2011, 115, 1353–1360. [Google Scholar] [CrossRef] [Green Version]
  24. Zhao, C.; Liu, C.; Zhang, Q.; Lu, Z.; Yang, C. Deformation of Linfen-Yuncheng Basin (China) and Its Mechanisms Revealed by Π-RATE InSAR Technique. Remote Sens. Environ. 2018, 218, 221–230. [Google Scholar] [CrossRef]
  25. Malinowska, A.A.; Witkowski, W.T.; Hejmanowski, R.; Chang, L.; van Leijen, F.J.; Hanssen, R.F. Sinkhole Occurrence Monitoring Over Shallow Abandoned Coal Mines with Satellite-Based Persistent Scatterer Interferometry. Eng. Geol. 2019, 262, 105336. [Google Scholar] [CrossRef]
  26. Pawluszek-Filipiak, K.; Borkowski, A. Integration of DInSAR and SBAS Techniques to Determine Mining-Related Deformations Using Sentinel-1 Data: The Case Study of Rydultowy Mine in Poland. Remote Sens. 2020, 12, 242. [Google Scholar] [CrossRef] [Green Version]
  27. Hanssen, R.F. Radar Interferometry, Data Interpretation and Error Analysis; Kluwer Academic Publishers: Dordrecht, The Netherlands, 2001. [Google Scholar]
  28. Ferretti, A.; Prati, C.; Rocca, F. Permanent Scatterers in SAR Interferometry. IEEE Trans. Geosci. Remote Sens. 2001, 39, 8–20. [Google Scholar] [CrossRef]
  29. Hooper, A.; Bekaert, D.; Spaans, K.; Arikan, M. Recent Advances in SAR Interferometry Time Series Analysis for Measuring Crustal Deformation. In Tectonophysics; Elsevier: Amsterdam, The Netherlands, 2012; pp. 1–13. [Google Scholar] [CrossRef]
  30. Hooper, A.; Zebker, H.; Segall, P.; Kampes, B. A New Method for Measuring Deformation on Volcanoes and Other Natural Terrains Using InSAR Persistent Scatterers. Geophys. Res. Lett. 2004, 31, 1–5. [Google Scholar] [CrossRef]
  31. Crosetto, M.; Monserrat, O.; Cuevas-González, M.; Devanthéry, N.; Crippa, B. Persistent Scatterer Interferometry: A Review. ISPRS J. Photogramm. Remote Sens. 2016, 115, 78–89. [Google Scholar] [CrossRef] [Green Version]
  32. Kisielewski, F. Polish Geological Institute—National Research Institute. Available online: https://www.pgi.gov.pl/ (accessed on 14 March 2020).
  33. Oszczepalski, S.; Speczik, S.; Zieliński, K.; Chmielewski, A. The Kupferschiefer Deposits and Prospects in SW Poland: Past, Present and Future. Minerals 2019, 9, 592. [Google Scholar] [CrossRef] [Green Version]
  34. Wilk, Z.; Bocheńska, T. Hydrogeology of Polish Mineral Deposit and Mining Water Problems, 2nd ed.; AGH Uczelniane Wydawnictwa Naukowo-Dydaktyczne: Cracow, Poland, 2003. [Google Scholar]
  35. Downorowicz, S. Hydrogeological Problems of Copper Ore Mining, Mine Water Inflow Rates. Rudy Met. 2005, No. 3, 126–130. [Google Scholar]
  36. Głowacki, T. Prediction of Vertical Displacements on “KONRAD” Mining Ground in Iwiny (SW Poland). Min. Sci. 2010, 128, 50–51. [Google Scholar]
  37. Milczarek, W.; Głowacki, T. Secondary Surface Deformations of Former Mining Areas. Min. Sci. 2013, 20, 39–55. [Google Scholar] [CrossRef]
  38. Sousa, J.J.; Hooper, A.J.; Hanssen, R.F.; Bastos, L.C.; Ruiz, A.M. Persistent Scatterer InSAR: A Comparison of Methodologies Based on a Model of Temporal Deformation vs. Spatial Correlation Selection Criteria. Remote Sens. Environ. 2011, 115, 2652–2663. [Google Scholar] [CrossRef]
  39. Samieie-Esfahany, S.; Hanssen, R.F.; Thienen-visser, K.; Muntendam-bos, A. On the Effect of Horizontal Deformation on InSAR Subsidence Estimates. Proc. Fringe Work. 2010, 2009, 1–7. [Google Scholar]
  40. Foumelis, M.; Blasco, J.M.D.; Desnos, Y.L.; Engdahl, M.; Fernández, D.; Veci, L.; Lu, J.; Wong, C. ESA SNAP—Stamps Integrated Processing for Sentinel-1 Persistent Scatterer Interferometry. In Proceedings of the IEEE International Geoscience and Remote Sensing Symposium (IGARSS), Valencia, Spain, 22–27 July 2018; pp. 1364–1367. [Google Scholar] [CrossRef]
  41. Freeze, R.A.; Cherry, A.J. Groundwater; Prentice-Hall: Englewood Cliffs, NJ, USA, 1979. [Google Scholar]
  42. Bonì, R.; Cigna, F.; Bricker, S.; Meisina, C.; McCormack, H. Characterisation of Hydraulic Head Changes and Aquifer Properties in the London Basin Using Persistent Scatterer Interferometry Ground Motion Data. J. Hydrol. 2016, 540, 835–849. [Google Scholar] [CrossRef] [Green Version]
  43. Bonì, R.; Meisina, C.; Cigna, F.; Herrera, G.; Notti, D.; Bricker, S.; McCormack, H.; Tomás, R.; Béjar-Pizarro, M.; Mulas, J.; et al. Exploitation of Satellite A-DInSAR Time Series for Detection, Characterization and Modelling of Land Subsidence. Geosciences 2017, 7, 25. [Google Scholar] [CrossRef] [Green Version]
  44. Sroka, A.; Hejmanowski, R. Subsidence Prediction Caused by the Oil and Gas Development. In Proceedings of the 3rd IAG/12th FIG Symposium, Baden, Germany, 22–24 May 2006. [Google Scholar]
Figure 1. The location of the study area on a map of Poland (A), geological and tectonic settings (B), and land use (C), modified after [32].
Remotesensing 12 01786 g001
Figure 2. Impact of mining exploitation on the surface area, total land subsidence, and land uplift observed from 2001 to 2007; modified after [37].
Remotesensing 12 01786 g002
Figure 3. Scheme of the methodology chain.
Remotesensing 12 01786 g003
Figure 4. Relationship between coherence and the standard deviation between the observations and the linear model of vertical movement for Track 73 (A) and Track 22 (B).
Remotesensing 12 01786 g004
Figure 5. Trend and seasonality accompanying the ground surface movements for the example of the time series of observations of the selected persistent scatter (PS; Point A), see Figure 6 for location.
Remotesensing 12 01786 g005
Figure 6. Estimated vertical movements of the ground surface due to groundwater recharge in the period 2014–2018.
Remotesensing 12 01786 g006
Figure 7. Time series of selected PS points. The blue line represents the time series for the selected PS (Point B) with the highest cumulative displacement value, see Figure 6 for location.
Remotesensing 12 01786 g007
Figure 8. Time function of the fill factor of the drained rock mass in the flooded Lubichów mine.
Remotesensing 12 01786 g008
Table 1. Sentinel-1 data used in the research.
GeometryTrackMaster AcquisitionTimespanPerpendicular Baseline (m)No. of Interferograms
Ascending7322/03/201715/11/2014–27/07/2018−101–+113145
Descending2225/03/201706/12/2014–30/07/2018−148–+89154
Table 2. Determination of the compression coefficient Cf of rock mass for the Konrad mine area. The thickness of the drained rock mass in particular boreholes was obtained from [32]. Note that there are no additional measurement results available in this area, we, therefore, assume that the uplift value presented was a complete one.
BoreholeThickness of the Drained Rock Mass (m)Observed Land Uplift (mm)Compressibility Factor Cf (Dimensionless)
G-1111.5736.55 × 10−4
U-93131.0665.04 × 10−4
U-21B56.8325.63 × 10−4
Al-1624.0125.00 × 10−4
Table 3. Determination of the change in the groundwater head in the Zechstein aquifer for the Lubichów mine area. The thickness of the drained rock mass in the analyzed borehole was obtained from [32].
BoreholeThickness of the Drained Rock Mass (m)Observed Land Uplift (mm)Refill Fraction of the Drained Rock Mass (m)
20152016201720182015201620172018
LU-362153182821705325038126

