Article

Mapping the Groundwater Potentiality of West Qena Area, Egypt, Using Integrated Remote Sensing and Hydro-Geophysical Techniques

1
Geology Department, Faculty of Science, Port-Said University, Port-Said 42522, Egypt
2
Geology Department, Faculty of Science, Mansoura University, Mansoura 35516, Egypt
3
Geology Department, South Valley University, Qena 83523, Egypt
4
Center for Remote Sensing, Boston University, Boston, MA 02215, USA
*
Author to whom correspondence should be addressed.
Remote Sens. 2020, 12(10), 1559; https://doi.org/10.3390/rs12101559
Submission received: 16 April 2020 / Revised: 11 May 2020 / Accepted: 11 May 2020 / Published: 14 May 2020
(This article belongs to the Special Issue Remote Sensing in Applied Geophysics)

Abstract

:
The integrated use of remote sensing imagery and hydro-geophysical field surveys is a well-established approach to map the hydrogeological framework, and thus explore and evaluate the groundwater potentiality of desert lands, where groundwater is considered as the main source of freshwater. This study uses such integrated approach to map the groundwater potentiality of the desert alluvial floodplain of the Nile Valley west of Qena, Egypt, as alternative water source to the River Nile. Typically ground gradient, faults and their stress field, lateral variation of rock permeability, drainage patterns, watersheds, rainfall, lithology, and soil types are the main factors believed to affect the groundwater recharge and storage from the infiltration of present-time and paleo-runoff. Following this generally accepted approach, different remote sensing data sets (SRTM DEM, Landsat-8, ALOS/PALSAR-1, Sentinel-1, and TRMM) as well as auxiliary maps (geological and soil maps) were used to identify and map these factors and prepare thematic maps portraying the different influences they exert on the groundwater recharge. These thematic maps were overlaid and integrated using weights in a GIS framework to generate the groundwater potentiality map which categorizes the different recharge capabilities into five zones. Moreover, the aeromagnetic data were processed to map the deep-seated structures and estimate the depth to basement rocks that may control the groundwater occurrence. In addition, the vertical electrical sounding (VES) measurements were applied and calibrated with the available borehole data to delineate the subsurface geological and hydrogeological setting as well as the groundwater aquifers. Different geoelectric cross-sections and hydro-geophysical maps were constructed using the borehole information and VES interpretation results to show the lateral extension of the different lithological units, groundwater-bearing zones, water table, and the saturated thickness of the aquifer. The GIS model and geophysical results show that the southwest part of Nag’a Hammadi-El-Ghoneimia stretch has very high recharge and storage potentiality and is characterized by the presence of two groundwater-bearing zones. The shallow groundwater aquifer is located at a depth of 30 m with a saturation thickness of more than 43 m. However, there are NW–SE faults crossing the study area and most likely serve as recharge conduits by connecting the shallow aquifer with the deeper ones. Such aquifers connection has been confirmed by investigating the chemical and isotopic composition of their groundwater.

Graphical Abstract

1. Introduction

Water is the most important natural resource for human life; it is the basis for enabling developments (agricultural, industrial, and urban). Meanwhile, Egypt lies within an arid desert zone in the northeastern corner of Africa, where rainfall is very low and irregular. Surface freshwater resources are scarce and limited to the River Nile crossing from south to north. Most of the cultivated lands are located surrounding the Nile and its Delta, while the majority of the country is desert lands. The total cultivated area covers about 4% of Egypt and is overpopulated with about 95% of the people [1]. Since ancient times, the Nile covers all the water needs for all developmental activities. However, with the rapid and continuous increase in population, the demand for water, food, and housing is increasing. Consequently, the water of the River Nile became insufficient causing a significant fresh-water shortage. Thus, in order to maintain the current flow in the River Nile new groundwater resources need to be discovered and explored. This will allow establishing new agriculture land, industrial and urban communities to accommodate the demands of a growing population.
The old alluvial floodplain of the Nile Valley west of Qena Governorate represents one of the promising desert areas for land reclamation based on its groundwater resources. It is a part of a land reclamation mega project called “1.5 Million Acres” that has been proposed by the Egyptian Government to create new urban-agricultural communities away from the River Nile. The study area is located at the southern stretch of Qena-Nag’a Hammadi-El-Ghoneimia and extends between latitudes 25°47′N and 26°9′N and longitudes 31°51′E and 32°44′E (Figure 1). It covers a vast area of about 1432 km2. It is bounded from the north and east by the cultivated young alluvial floodplain of the Nile and from the west and south by the elevated limestone plateau of the Western Desert. There are no surface water resources in the study area and the groundwater represents the only freshwater resource. The study area is characterized by a hot arid desert climate with a total annual rainfall of about 3.2 mm/year [2]. Therefore, the contribution of recent rainfall events to groundwater recharge is very low and most of the groundwater stored in the subsurface aquifers are attributed to the paleo-torrential rains and flash floods that took place during the past pluvial periods [3].
Satellite remote sensing is considered an effective tool for mapping the Earth’s surface features. Although it does not directly observe the subsurface, it has been effectively used in groundwater exploration [4]. Analysis and interpretation of the remote sensing images enable mapping and studying the surface factors that control runoff infiltration such as geological settings, soil cover, drainage networks, and climate. These features indirectly reflect the hidden hydrogeological characteristics of the subsurface, such as the capability to recharge, accumulate, and store groundwater. Studying the influences of these factors on water infiltration capacity in an integrated manner using the Geographic Information System (GIS) facilitates a more effective delineation of zones with different groundwater potentialities [5,6,7]. Subsequent field geophysical surveys can this way be targeted to promising zones with high groundwater potentiality. Many studies have been attempted to integrate the groundwater controlling parameters derived from remote sensing data using GIS, such as Shaban et al., 2006; Amarsaikhan et al., 2009; Abdalla, 2012; Madani and Niyazi, 2015 [8,9,10,11].
Since satellite remote sensing observes mainly at surface (optical sensors) and near surface (radar sensors) features, its integration with other complementary data sources such as elevation data and field geophysical measurements is considered a very effective tool to characterize the hydrogeological setting of any area and particularly poorly mapped arid areas. In this context, the magnetic method is one of the oldest and widely used geophysical techniques for exploring the Earth’s subsurface [12]. The magnetic method is used in hydrogeological studies to delineate the thick sedimentary basins suitable for groundwater accumulation, map the tectonic structures, and estimate the depth to basement rocks [13,14].
Moreover, over the last decades geoelectric resistivity measurements using the vertical electrical sounding (VES) technique have proven their efficiency in groundwater exploration, providing useful information about the subsurface hydrogeological framework [15]. The VES aims to measure the resistivity variation with depth. It is used to delineate and estimate the thickness and depth of the groundwater-bearing zones [16,17].
Finally, a strategy for sustainable development in arid lands requires intensive scientific studies to assess the groundwater storage and availability in order to predict the long-term impact of abstraction to decide the proper developmental plans that should be considered. The present study employs an integrated methodology based on a combination of remote sensing and geophysical techniques (aeromagnetics and VES) to explore the groundwater potentiality and subsurface hydrogeological setting of West Qena area in Egypt to support decision makers in their future developmental plans.

2. The Study Area

The study area is a part of the Nile Valley in Qena region and follows the Nile’s tectonic, geological, and hydrogeological setting. The Nile Valley cuts its course through the Early Eocene limestone rocks and divides Egypt into the Eastern Desert and the Western Desert. Many authors consider the valley of tectonic origin [3,18,19,20,21]. According to these studies, the Nile Valley developed from a number of successive rivers along a path determined by structural features formed in response to the Oligo-Miocene tectonic activities in the Gulf of Suez and Red Sea region. This is supported by the fault scarps bordering the cliffs of the valley and the numerous faults observed along the valley flanks [22]. The valley north of the study area (Nag’a Hammadi) is oriented in NW–SE direction parallel to the Gulf of Suez, whereas its trend changes to NE–SW east of Nag’a Hammadi and intersects from the east with the Qena-Safaga Shear Zone. These trends were observed on the surface of the limestone plateau [23] and also recorded in the subsurface by geophysical data [24].
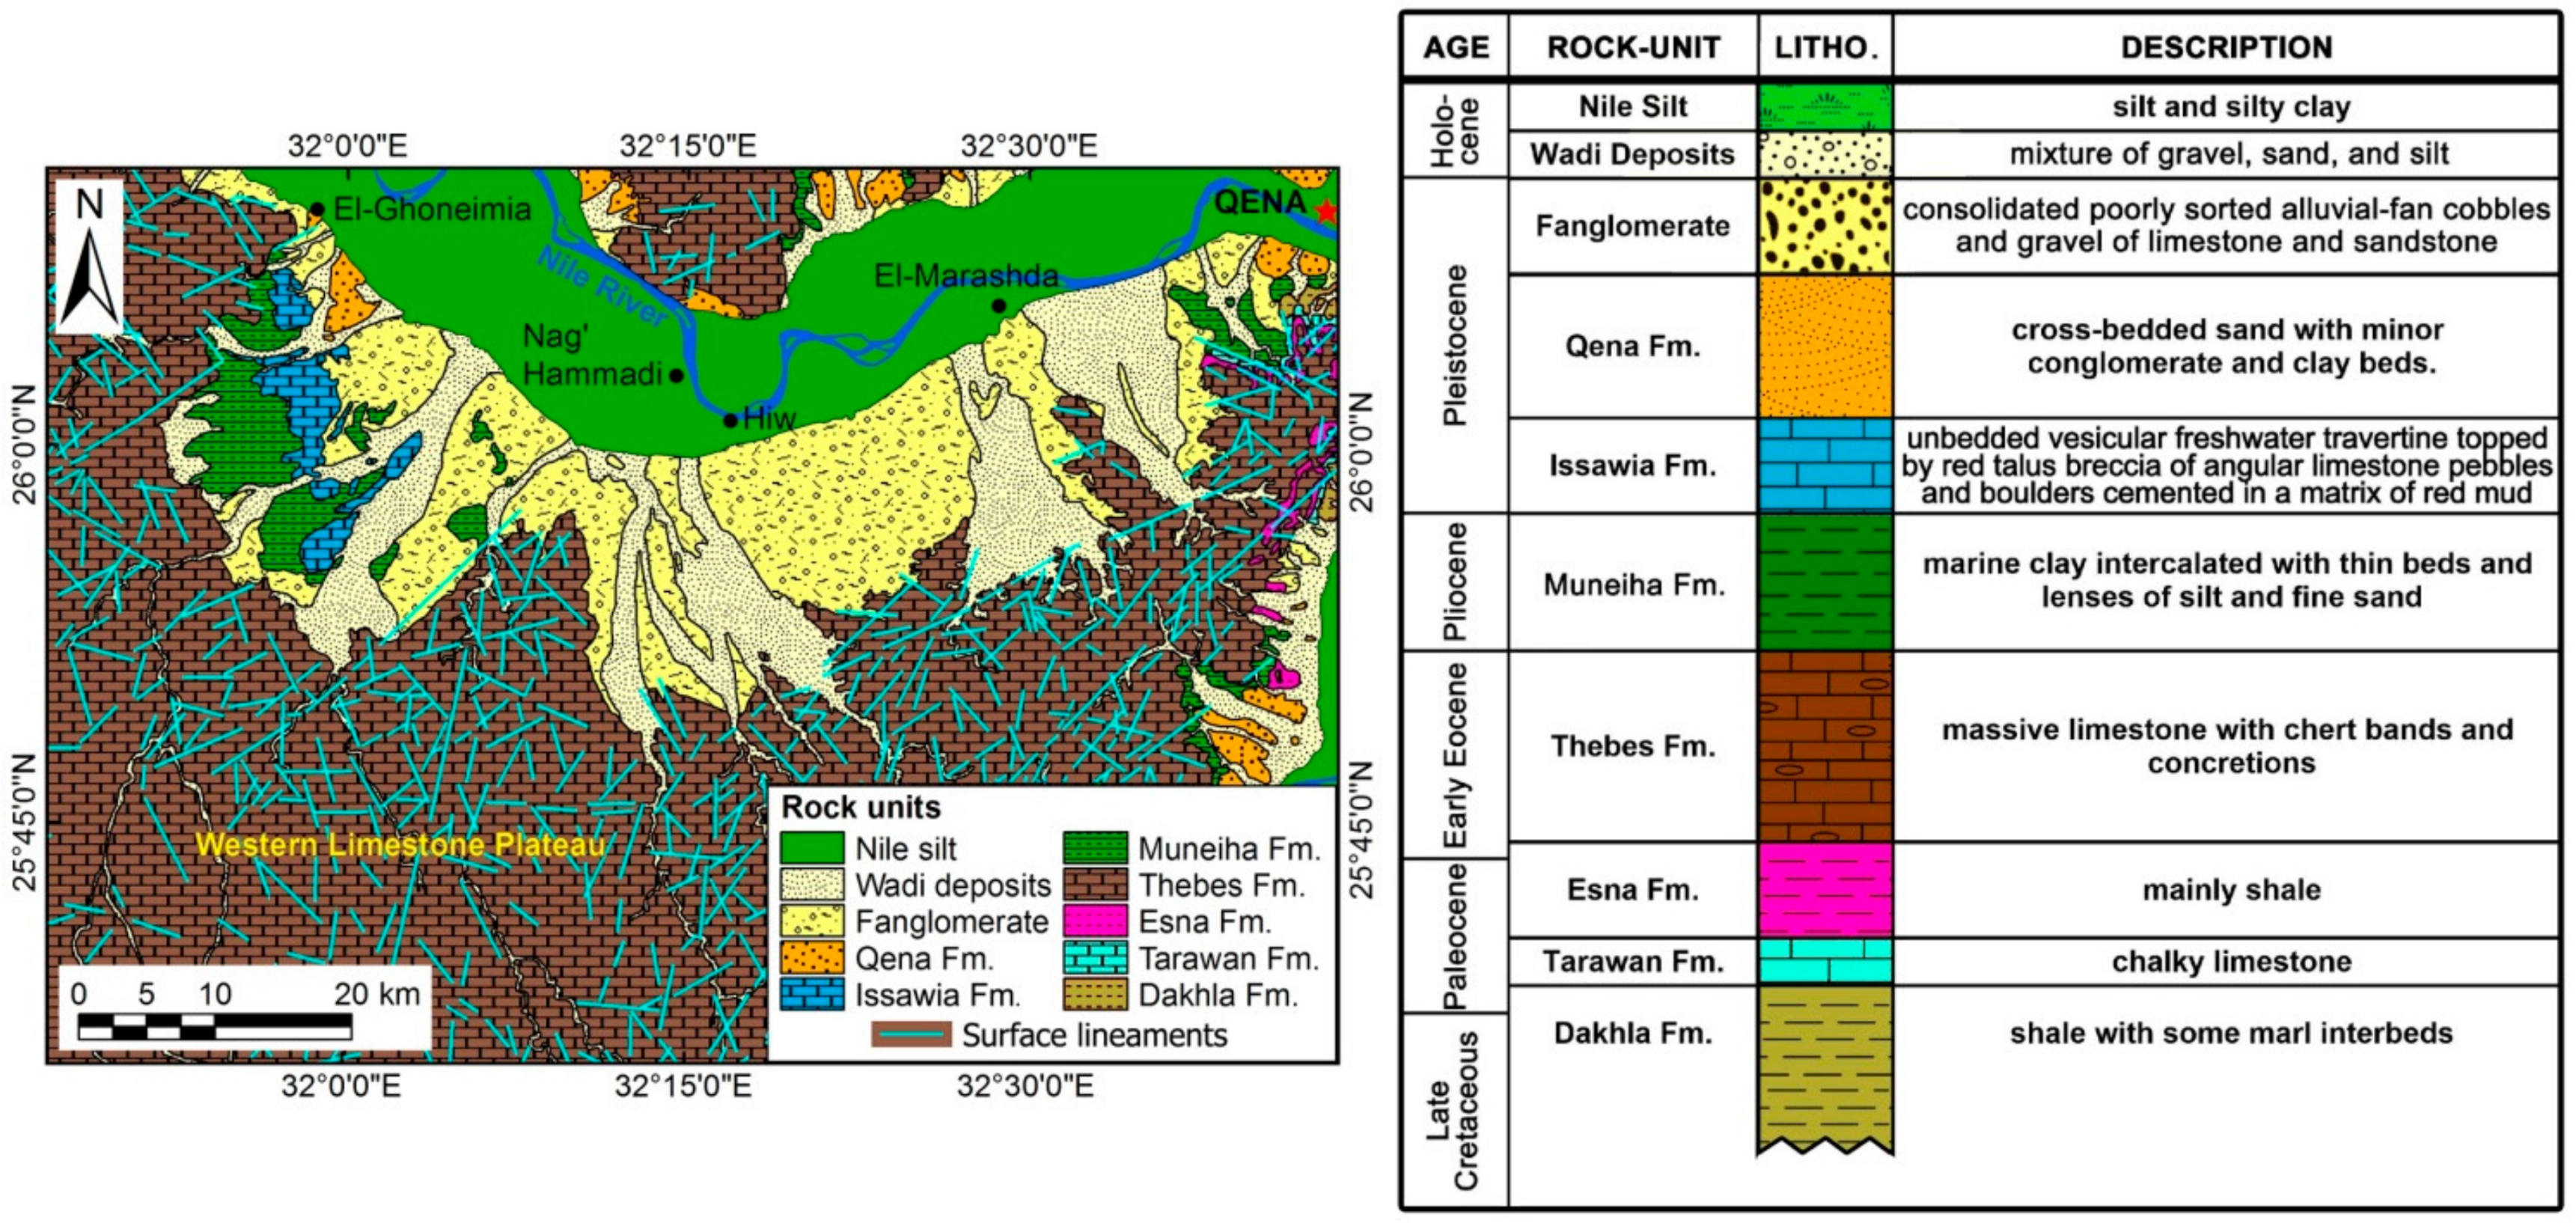
Geologically, the surface of the study area is covered by different alluvial sediments ranging in age from Pliocene to Quaternary [23]. These sediments were studied by Said (1981) and Omer (1996) [3,25], who divided them into a number of stratigraphic units, which are from older to younger: Muneiha Formation, Armant Formation (older fanglomerates), Issawia Formation, Qena Formation, fanglomerates, and Wadi deposits (Figure 2). The bounding plateau represents the oldest exposed rocks and consists of a succession ranging in age from Late Cretaceous to Early Eocene. The exposed rocks of the plateau were studied by Faris et al. (1985) and Issawi et al. (2009) [26,27], who divided it into four units, which are from older to younger: Dakhla Formation, Tarawan Formation, Esna Formation, and Thebes Formation.
Hydrogeologically, the Quaternary aquifer represents the main groundwater resource in the Nile Valley. It consists mainly of the Pleistocene graded sand and gravel intercalated with clay lenses (i.e., Qena Formation). It is underlain by an impermeable layer of Pliocene clays (i.e., Muneiha Formation) that prevents its connection with the deeper aquifers. It is covered by a permeable layer of Wadi deposits at the old alluvial floodplain, which means that groundwater occurs under unconfined conditions. On the other hand, it occurs under semi-confined conditions at the cultivated lands where it is capped by the agricultural silt-clay layer. The thickness of the aquifer varies from about 200 m at the center of the cultivated floodplain to about 80 m at the desert fringes. It is recharged continuously from the excess irrigation water and occasionally from infrequent rainfalls [28,29,30,31].

3. Data and Methods

3.1. Remote Sensing Data

Remote sensing images and GIS analysis techniques were used to delineate the different groundwater potential zones in the old alluvial floodplain of the Nile Valley west of Qena City. The performed steps were (1) identifying and mapping the different surface factors that are believed to control the infiltration of the surface runoff to recharge the underlying unconfined aquifers; (2) reclassification of each factor with respect to its influence on infiltration/recharge (thematic layers); (3) giving each thematic layer a rank and weight based on assessing its relative importance to groundwater recharge; and finally (4) integrating all the thematic maps in a GIS model using the weighted overlay method to generate the groundwater potentiality map of the study area.
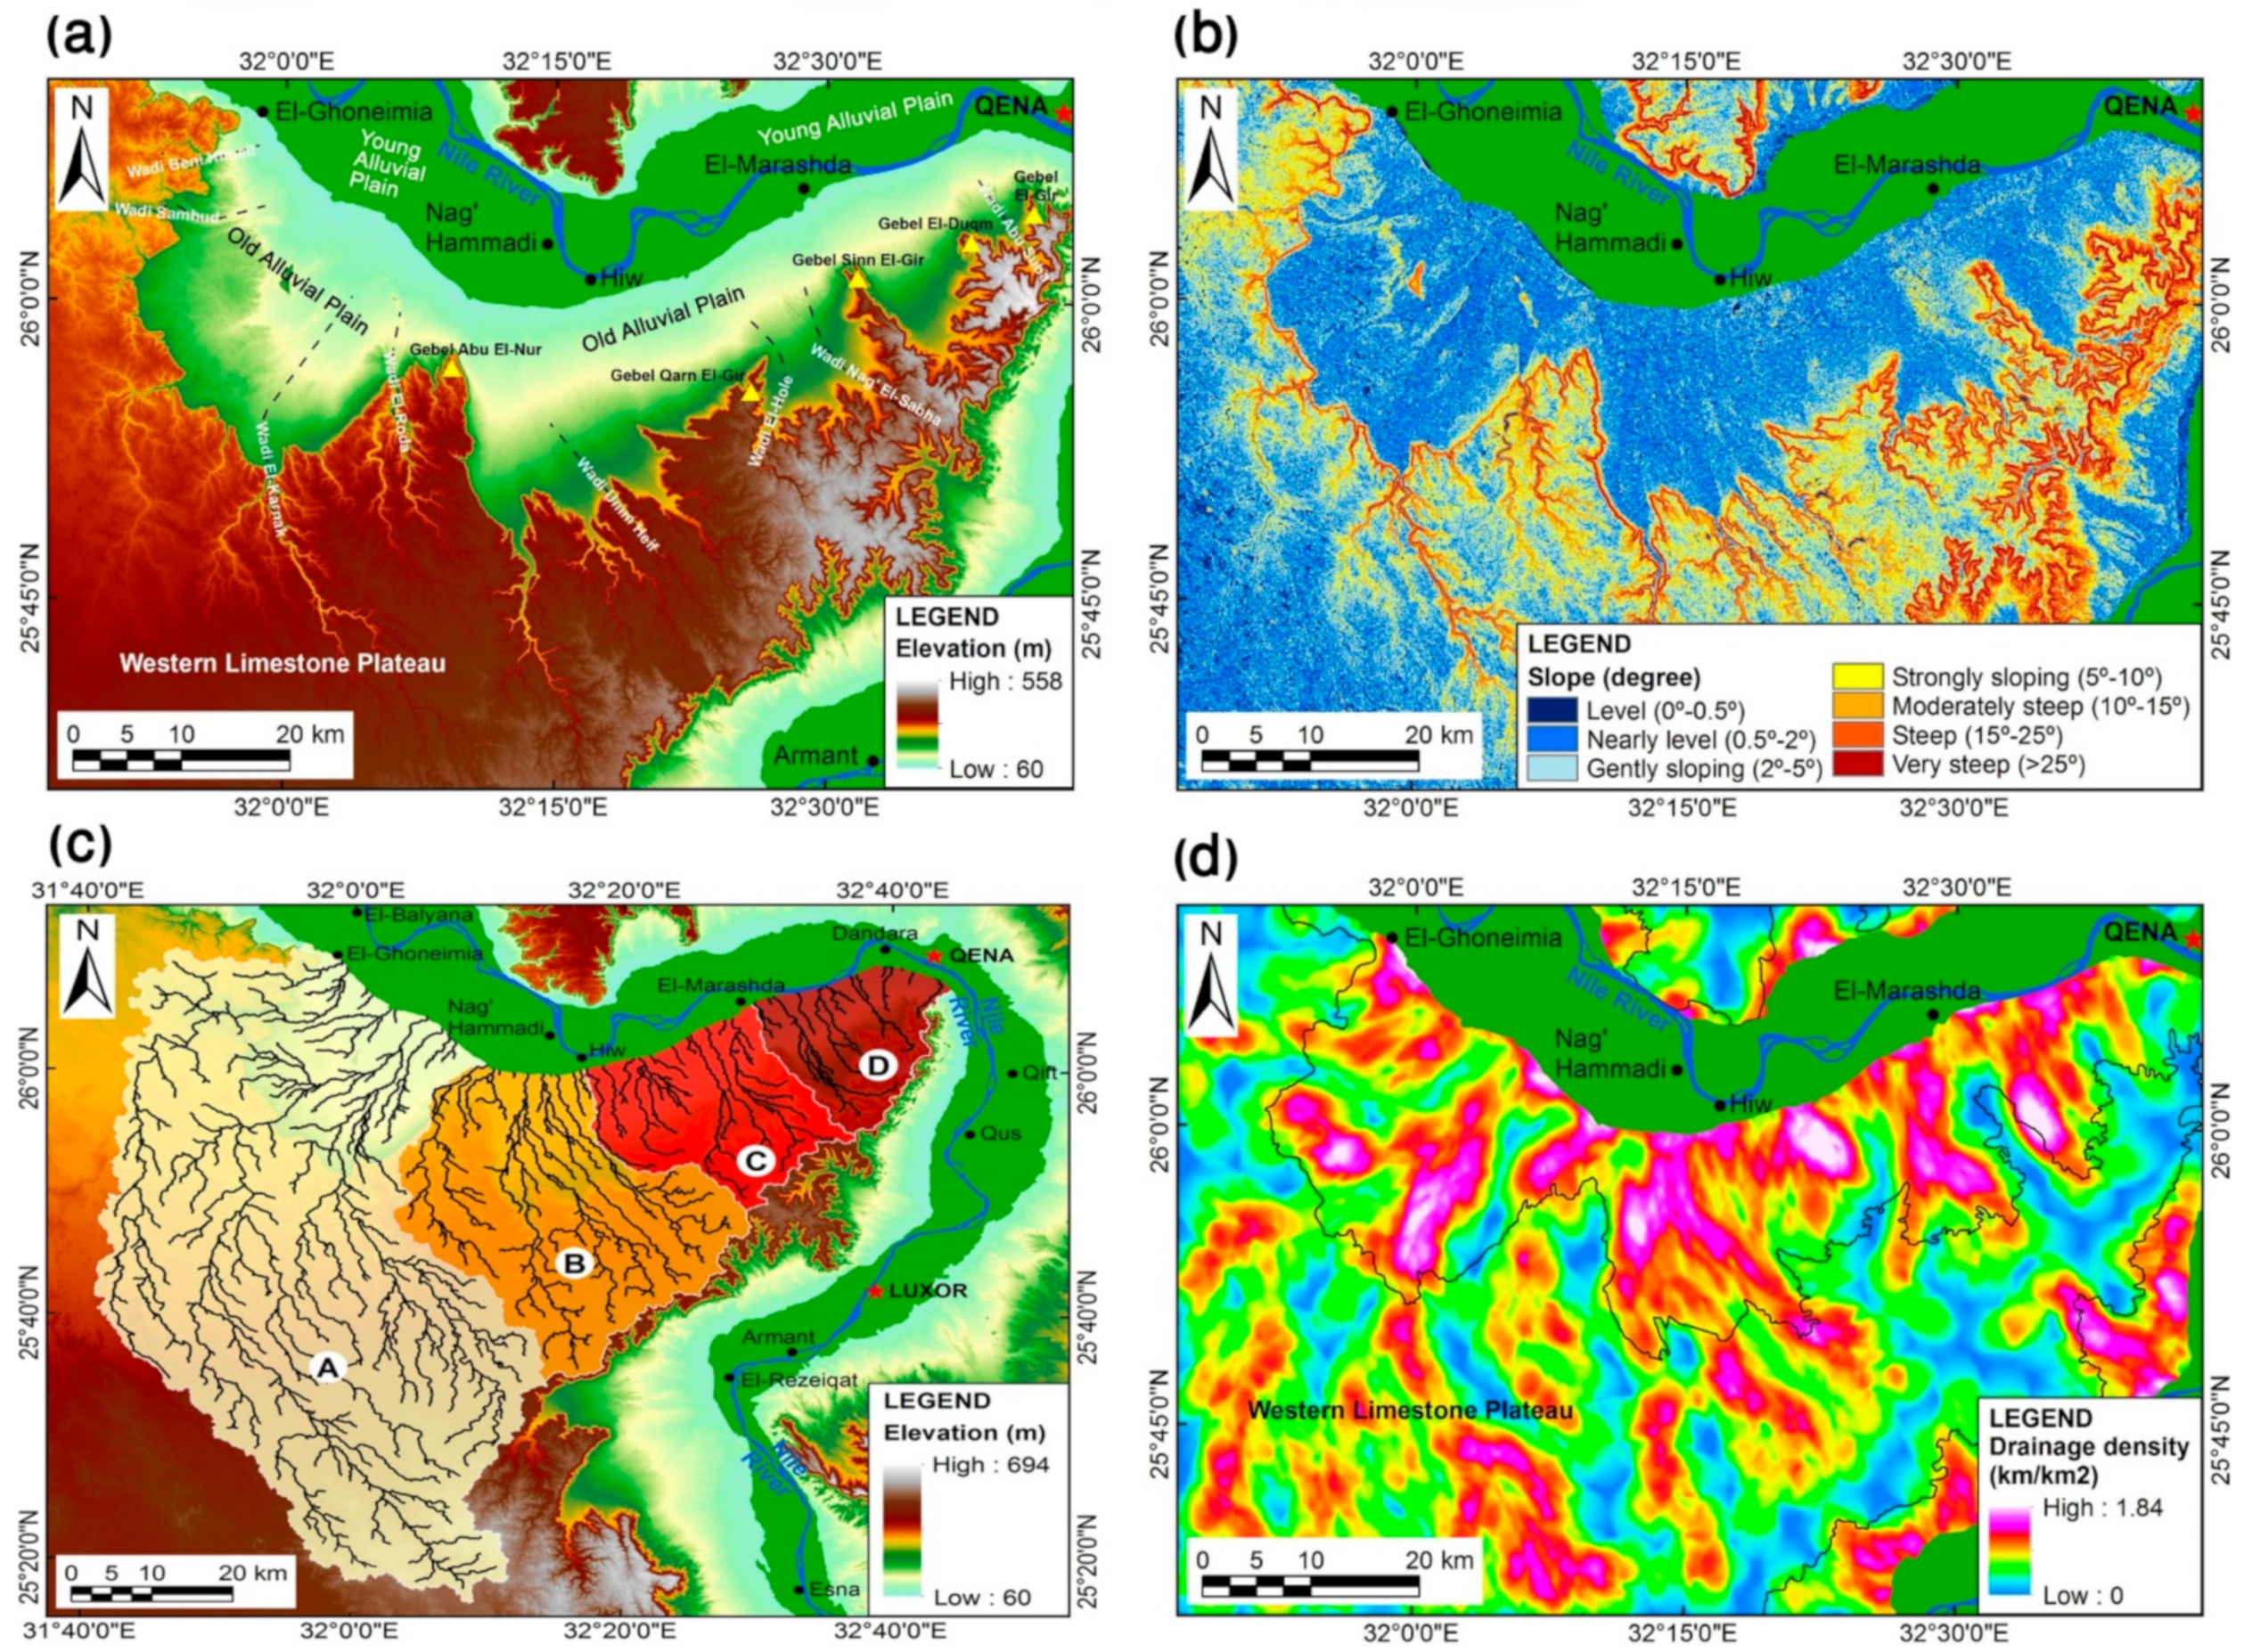
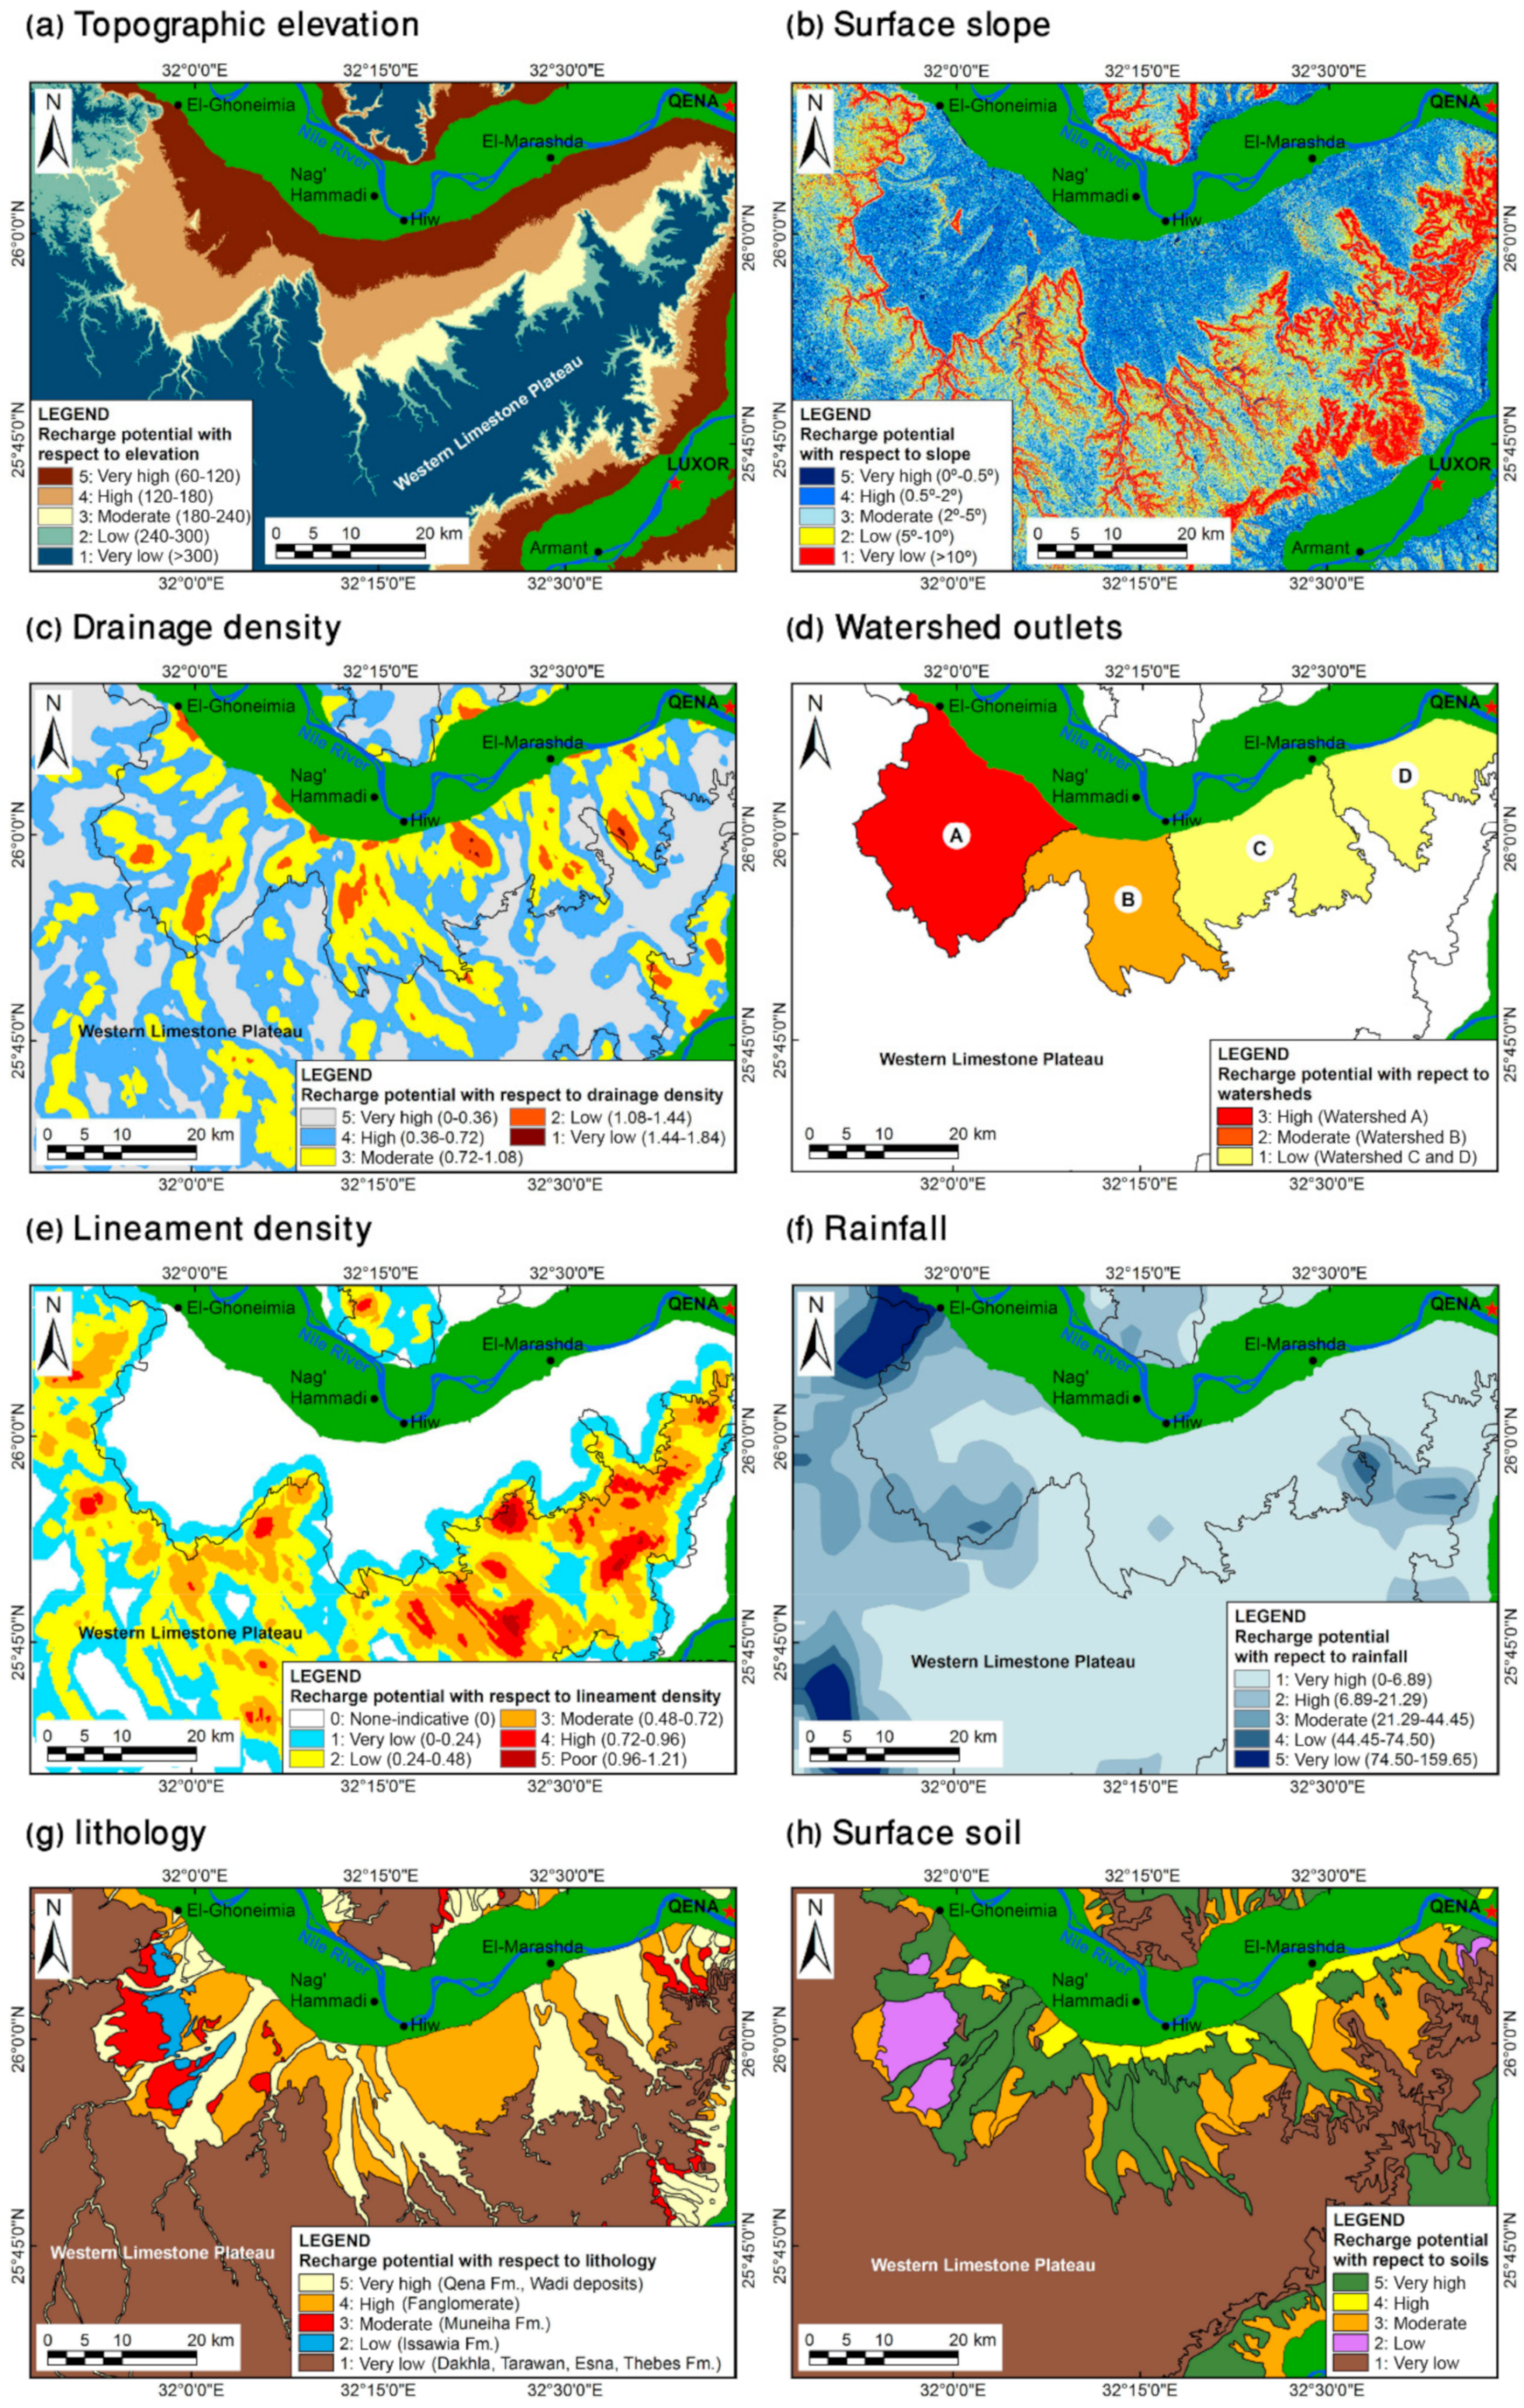
In this study, eight factors were mapped from a combination of optical, radar, and DEM data, as well as geological and soil maps. These factors include the surface topographic elevation, slope, lineament density, watershed areas, drainage density, rainfall, lithology, and soil cover. The SRTM DEM data with 30 m spatial resolution was used to represent the surface elevation and generate the slope, and delineate the different watersheds and their associated drainage networks using the ArcMap software of ESRI (2016) [32]. The drainage and lineaments densities were calculated using the spatial analyst tool in ArcGIS (Figure 3). Drainage networks were extracted using the D-8 algorithm [33,34] and applying a thresholds value of 1000 of the calculated flow accumulations. The relation between the extracted drainage patterns and the substrate soil textures was interpreted based on Ayele et al., 2017 [35]. Whereas, the lineament densities were extracted using the ordinary kriging of ArcGIS to show the spatial distribution of lineaments and highlight areas where they concentrate [36].
The surface geological lineaments were manually extracted from different optical and radar images that included Landsat-8 OLI (https://earthexplorer.usgs.gov/) [37], ALOS/PALSAR-1 (JAXA), and Sentinel-1 (https://scihub.copernicus.eu/) [38] with the aid of the several generated hillshades with different illumination angles and geologic map. The process of lineament extraction begins with image enhancement and filtering to highlight the linear features of interest to facilitate identifying and tracing them [39]. In this context, several shaded relief maps were derived from the DEM by applying the hillshade algorithm in ArcMap using different light azimuth angles (45°, 90°, 135°, 180°, 225°, 270°, 315°, 360°) (Figure 4a). The Sobel filter [40] was applied to the Landsat-8 panchromatic band with 15 m spatial resolution to increase the contrast of edges or linear features to make them stand out from the background (Figure 4b) using the ENVI software [41]. The Sobel filter effectively enhances directional linear features by convolving a 3 × 3 window size over the image in the four principle directions: N–S, NE–SW, E–W, and NW–SE [42,43]. In this research work, the lineaments are considered as geological structures, i.e., faults, fractures, and joints that might serve as passage ways for groundwater flow along the study area [44,45]. In addition, a high spatial resolution Google Earth image overlay was used to avoid tracing any of the non-geological or man-made linear features, which are not related to structural lineaments, such as roads, tracks, and field boundaries.
Synthetic aperture radar (SAR) sensors operate with longer electromagnetic waves than optical sensors, thus they have the capability to penetrate the dry and loose sand cover to image any hidden or buried linear features [46]. In this work, both the ALOS/PALSAR L-band radar image (24 cm wavelength) and the Sentinel-1 C-band radar images (5.6 cm wavelength) were processed to map any hidden lineaments that were not revealed by the optical images along the flat alluvium floodplain of the study area. The full-polarimetric ALOS/PALSAR-1 image was processed by applying the Pauli RGB classification (Figure 4c) using SNAP software of ESA (2017) [47]. Two Sentinel-1 radar images acquired on 7 August 2015 and 13 August 2016 with Vertical-Vertical (VV) polarization were used to produce the interferometric synthetic aperture radar (InSAR) coherence image of the study area using SNAP software (Figure 4c). The InSAR coherence image represents the difference in the phase and intensity of the pixels of two radar images acquired at different times. It enables the detection of the movement and changes of mobile sands that are controlled by subsurface structures as well as the land surface erosion due to the aeolian and fluvial activities, especially in arid deserts. Such dynamic processes cause changes in their respective radar intensity and backscattered response as shown in a study by Gaber et al., 2018 [48]. The coherence intensity ranges from 0 to 1. The high coherence reflects little or no changes in the surface whereas the low coherence is indicative of major changes in the surface. Figure 5a shows the extracted surface lineaments. The lineament density map was calculated using the line density tool in ArcMap to show the spatial distribution pattern of lineaments along the study area (Figure 5b).
The mean annual rainfall (mm/year) in the study area was obtained from the Tropical Rainfall Measuring Mission (TRMM) rainfall data covering the period from 1998 to 2009. No rainfall has been recorded in the study area between 2009 and 2015 when the TRMM instruments were turned off in 2015 after 17 years (https://gpm.nasa.gov/trmm). The distribution of the different lithological units in the study area were obtained from the geological map of CONOCO and EGPC (1987) [23]. The surface soils were identified from the soil map produced by FAO (Figure 6) [49,50].

3.2. Aeromagnetic Data

The present study uses the aeromagnetic data that have been collected by Aero-Service (1984) for the Egyptian General Petroleum Cooperation (EGPC) (Figure 7a) [51]. The total magnetic intensity (TMI) data have been acquired at a barometric altitude of about 914.4 m. The TMI data were corrected for the diurnal variations in the Earth’s magnetic field; a constant background value of 41,400 nT was subtracted for simplification; and were gridded with a cell size of 500 m using the minimum curvature algorithm. The values of the IGRF inclination (I) and declination (D) of the Earth’s magnetic field in the study area during the survey period are about 36.7° and 1.9°, respectively.
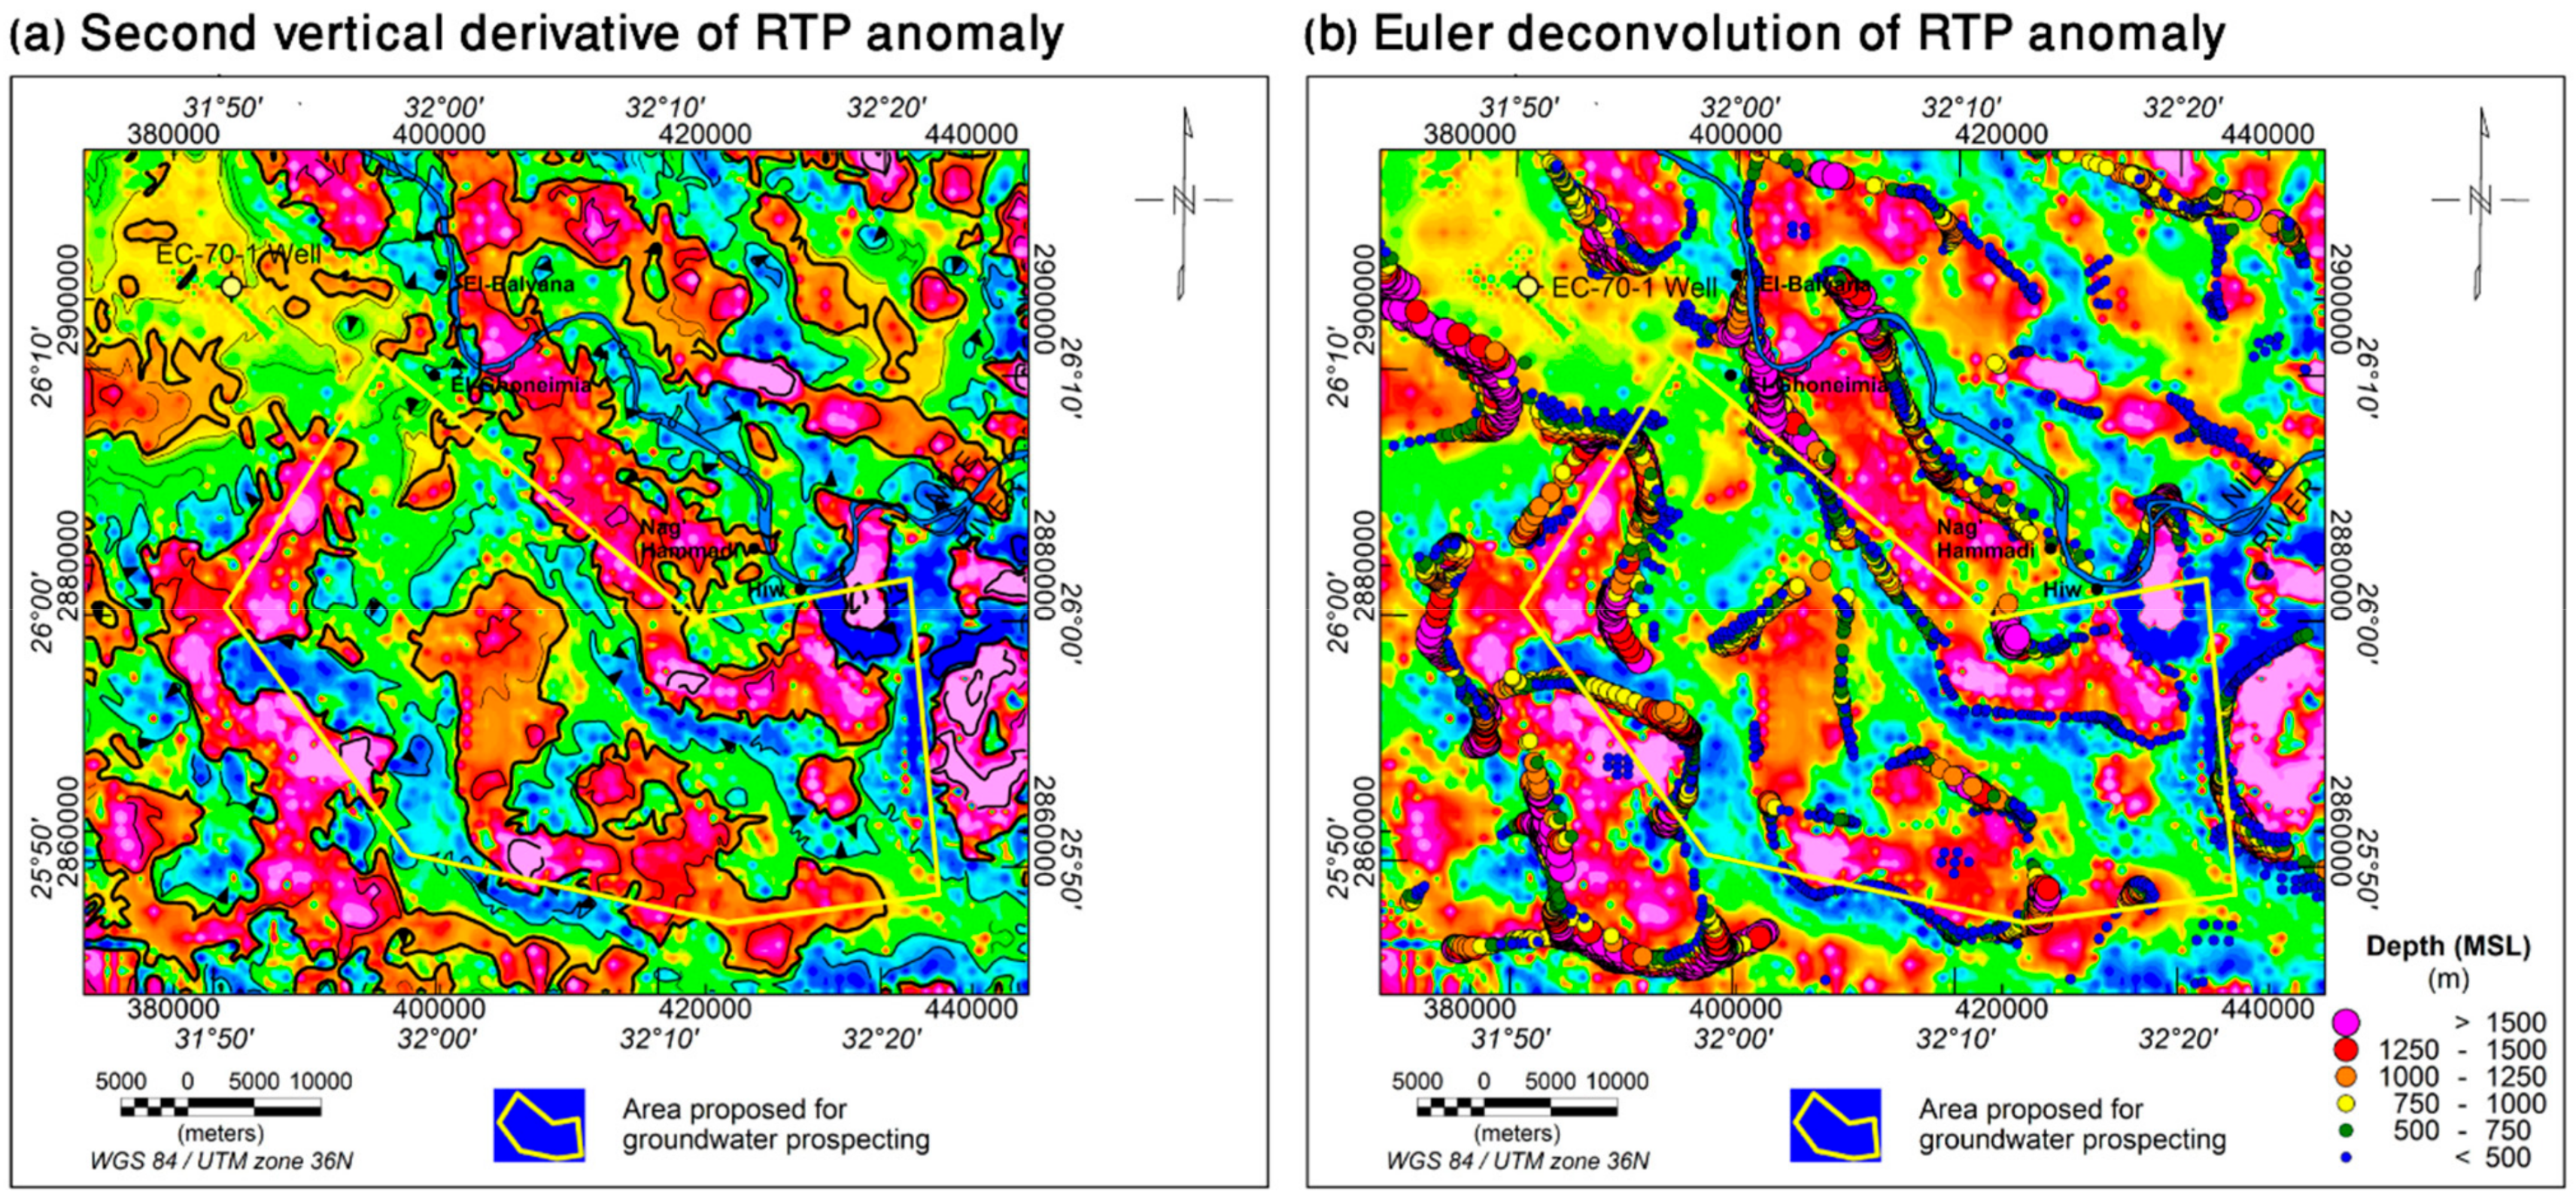
The TMI data were processed in the wavenumber domain using the Oasis Montaj software to enhance the magnetic anomalies and aid their qualitative and quantitative interpretation [12,52]. The reduction-to-pole (RTP) filter was applied to the TMI data to reduce the distortion in shape and shift in location of the magnetic anomalies relative to their subsurface basement sources due to the dipolar nature of the Earth’s magnetic field and inclined magnetization (Figure 7b). The second vertical derivative (SVD) filter was applied to the RTP anomaly to enhance the short-wavelength anomalies derived from shallow sources (Figure 8a). The SVD is usually used to delineate the location of the rock contacts and faults by relating these boundaries to the inflection point of the anomaly marginal gradient. On the SVD contour map, the position of the boundaries can be identified by zero contours [53].
The Euler deconvolution method was applied on the RTP aeromagnetic anomaly using a structural index (N = 0) to estimate the locations and depths of contacts and faults [54,55]. Figure 8b shows a plot of Euler deconvolution solutions on the SVD map. The solutions show tight linear clusters along the zero SVD contours that correspond to the position of contacts. The estimated Euler depths range from less than 500 m to more than 1500 m.

3.3. Vertical Electrical Sounding (VES)

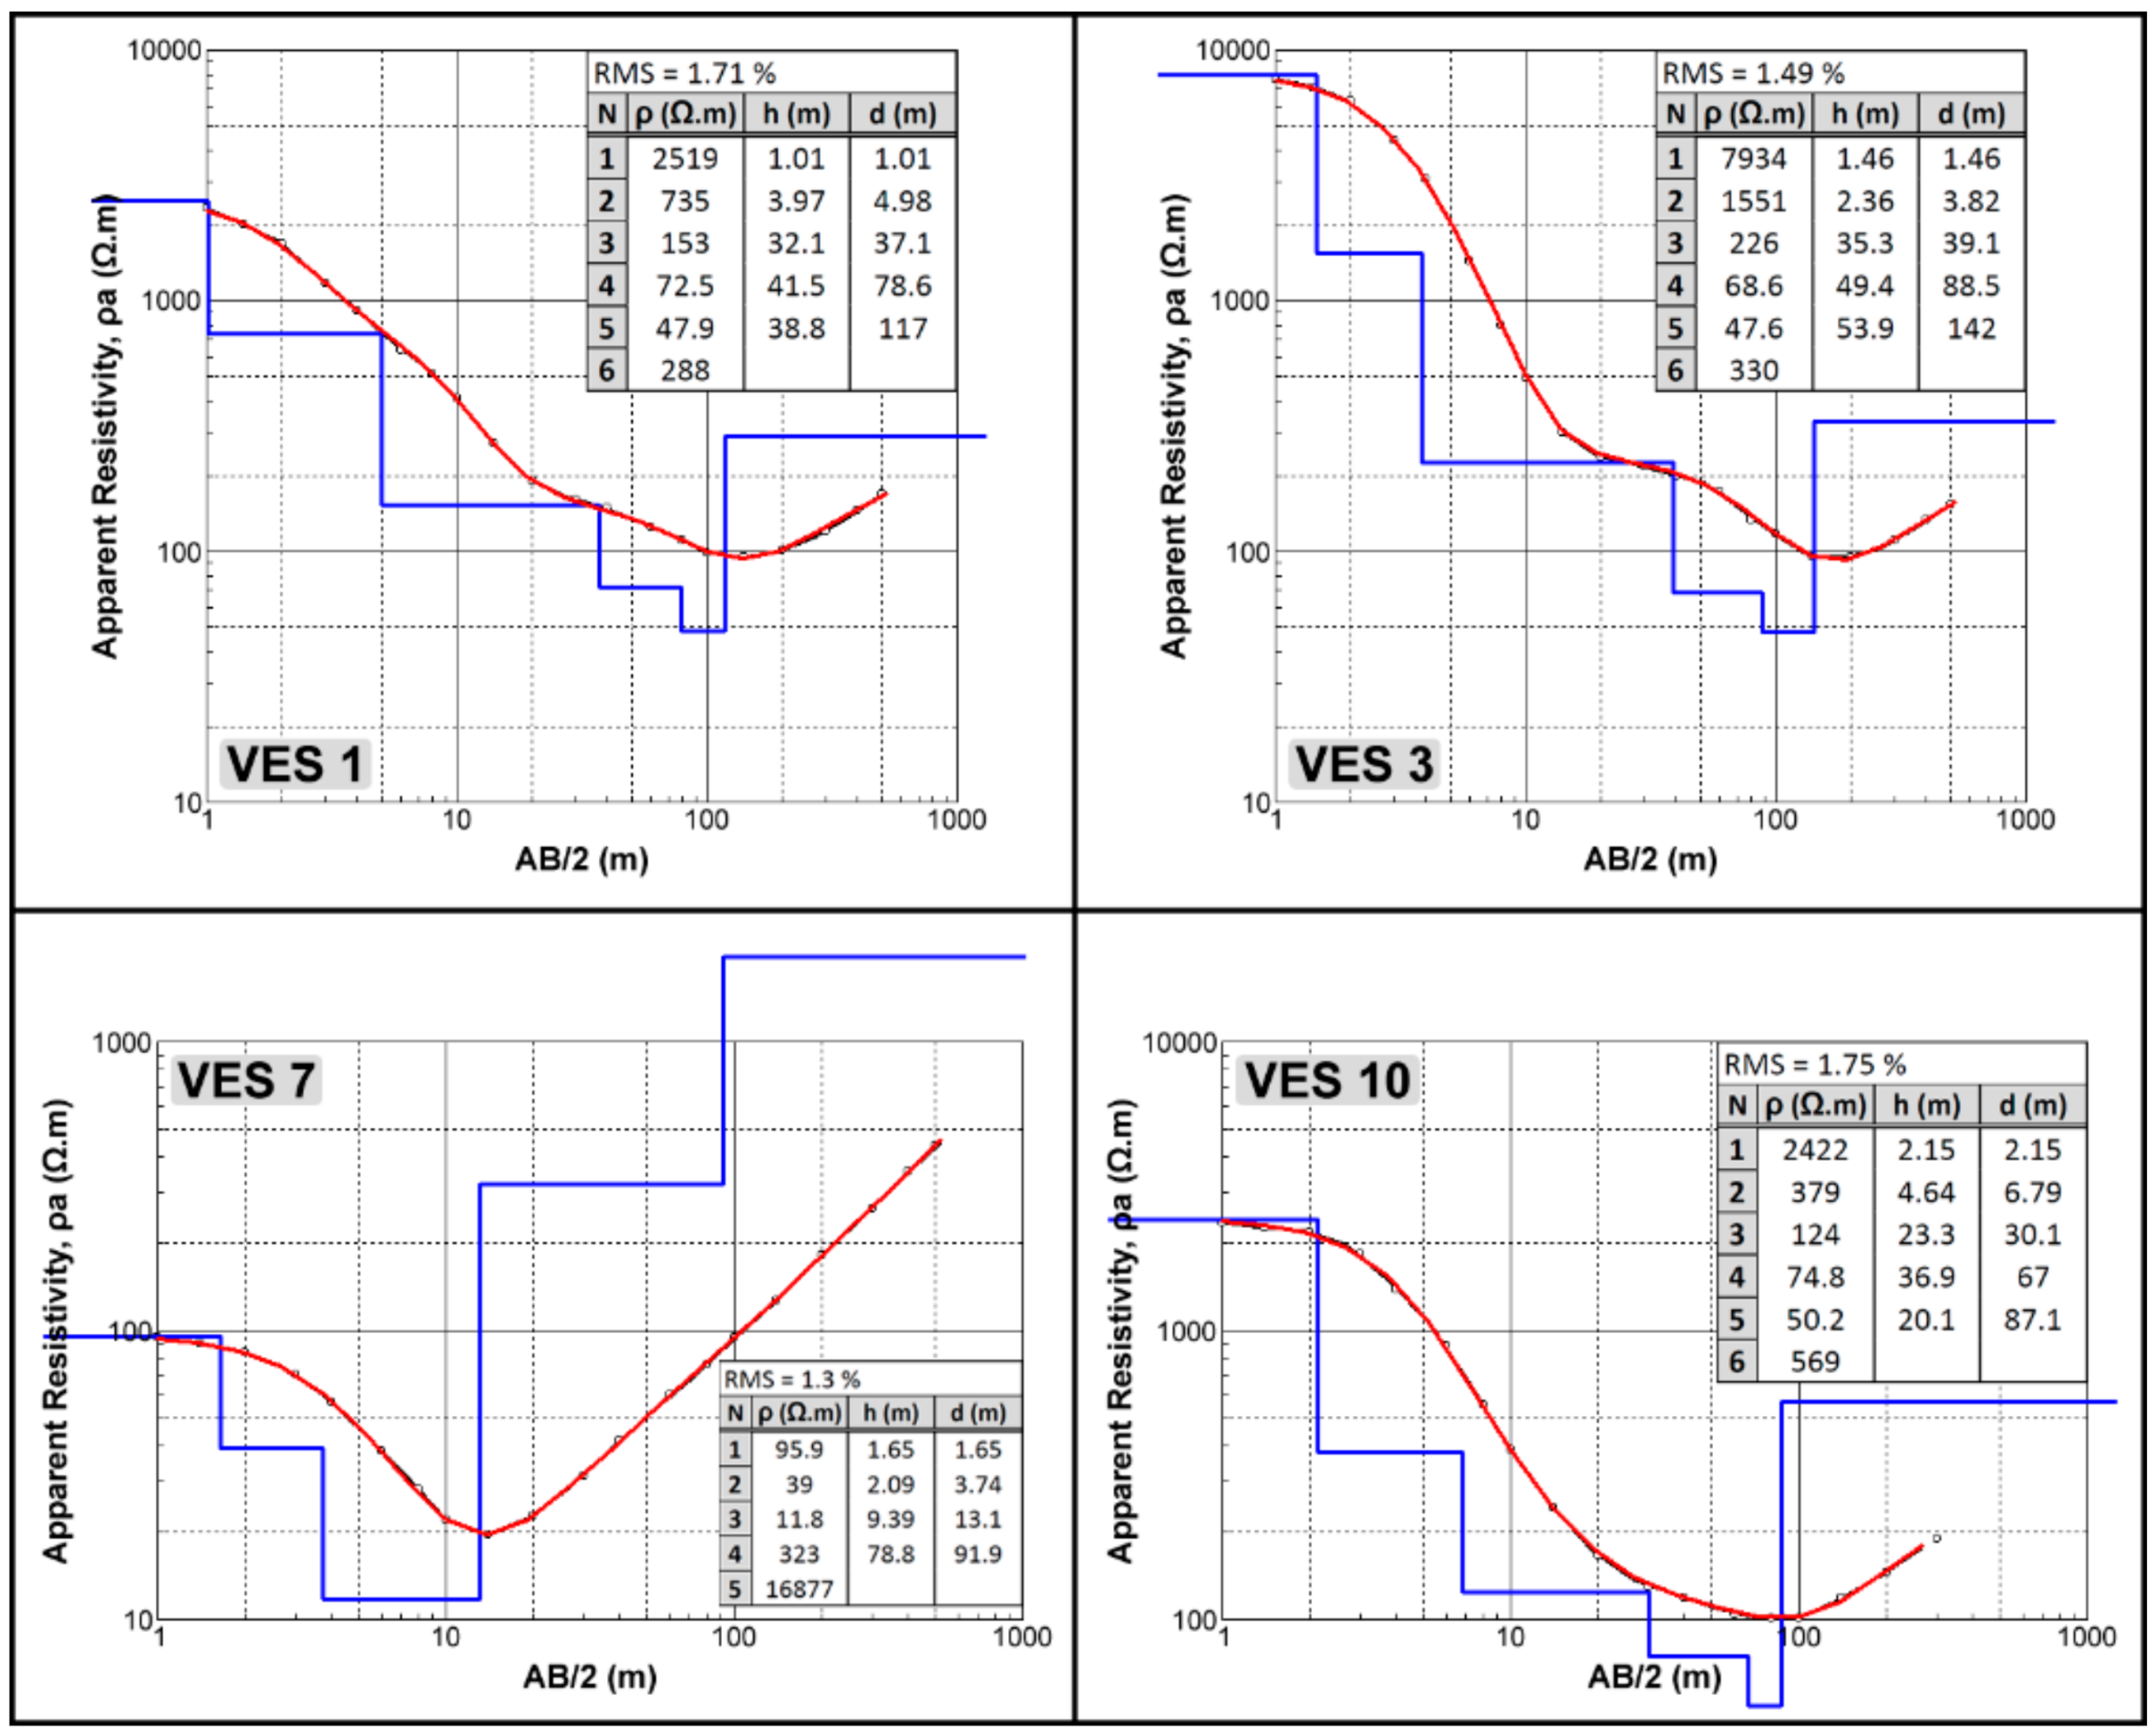
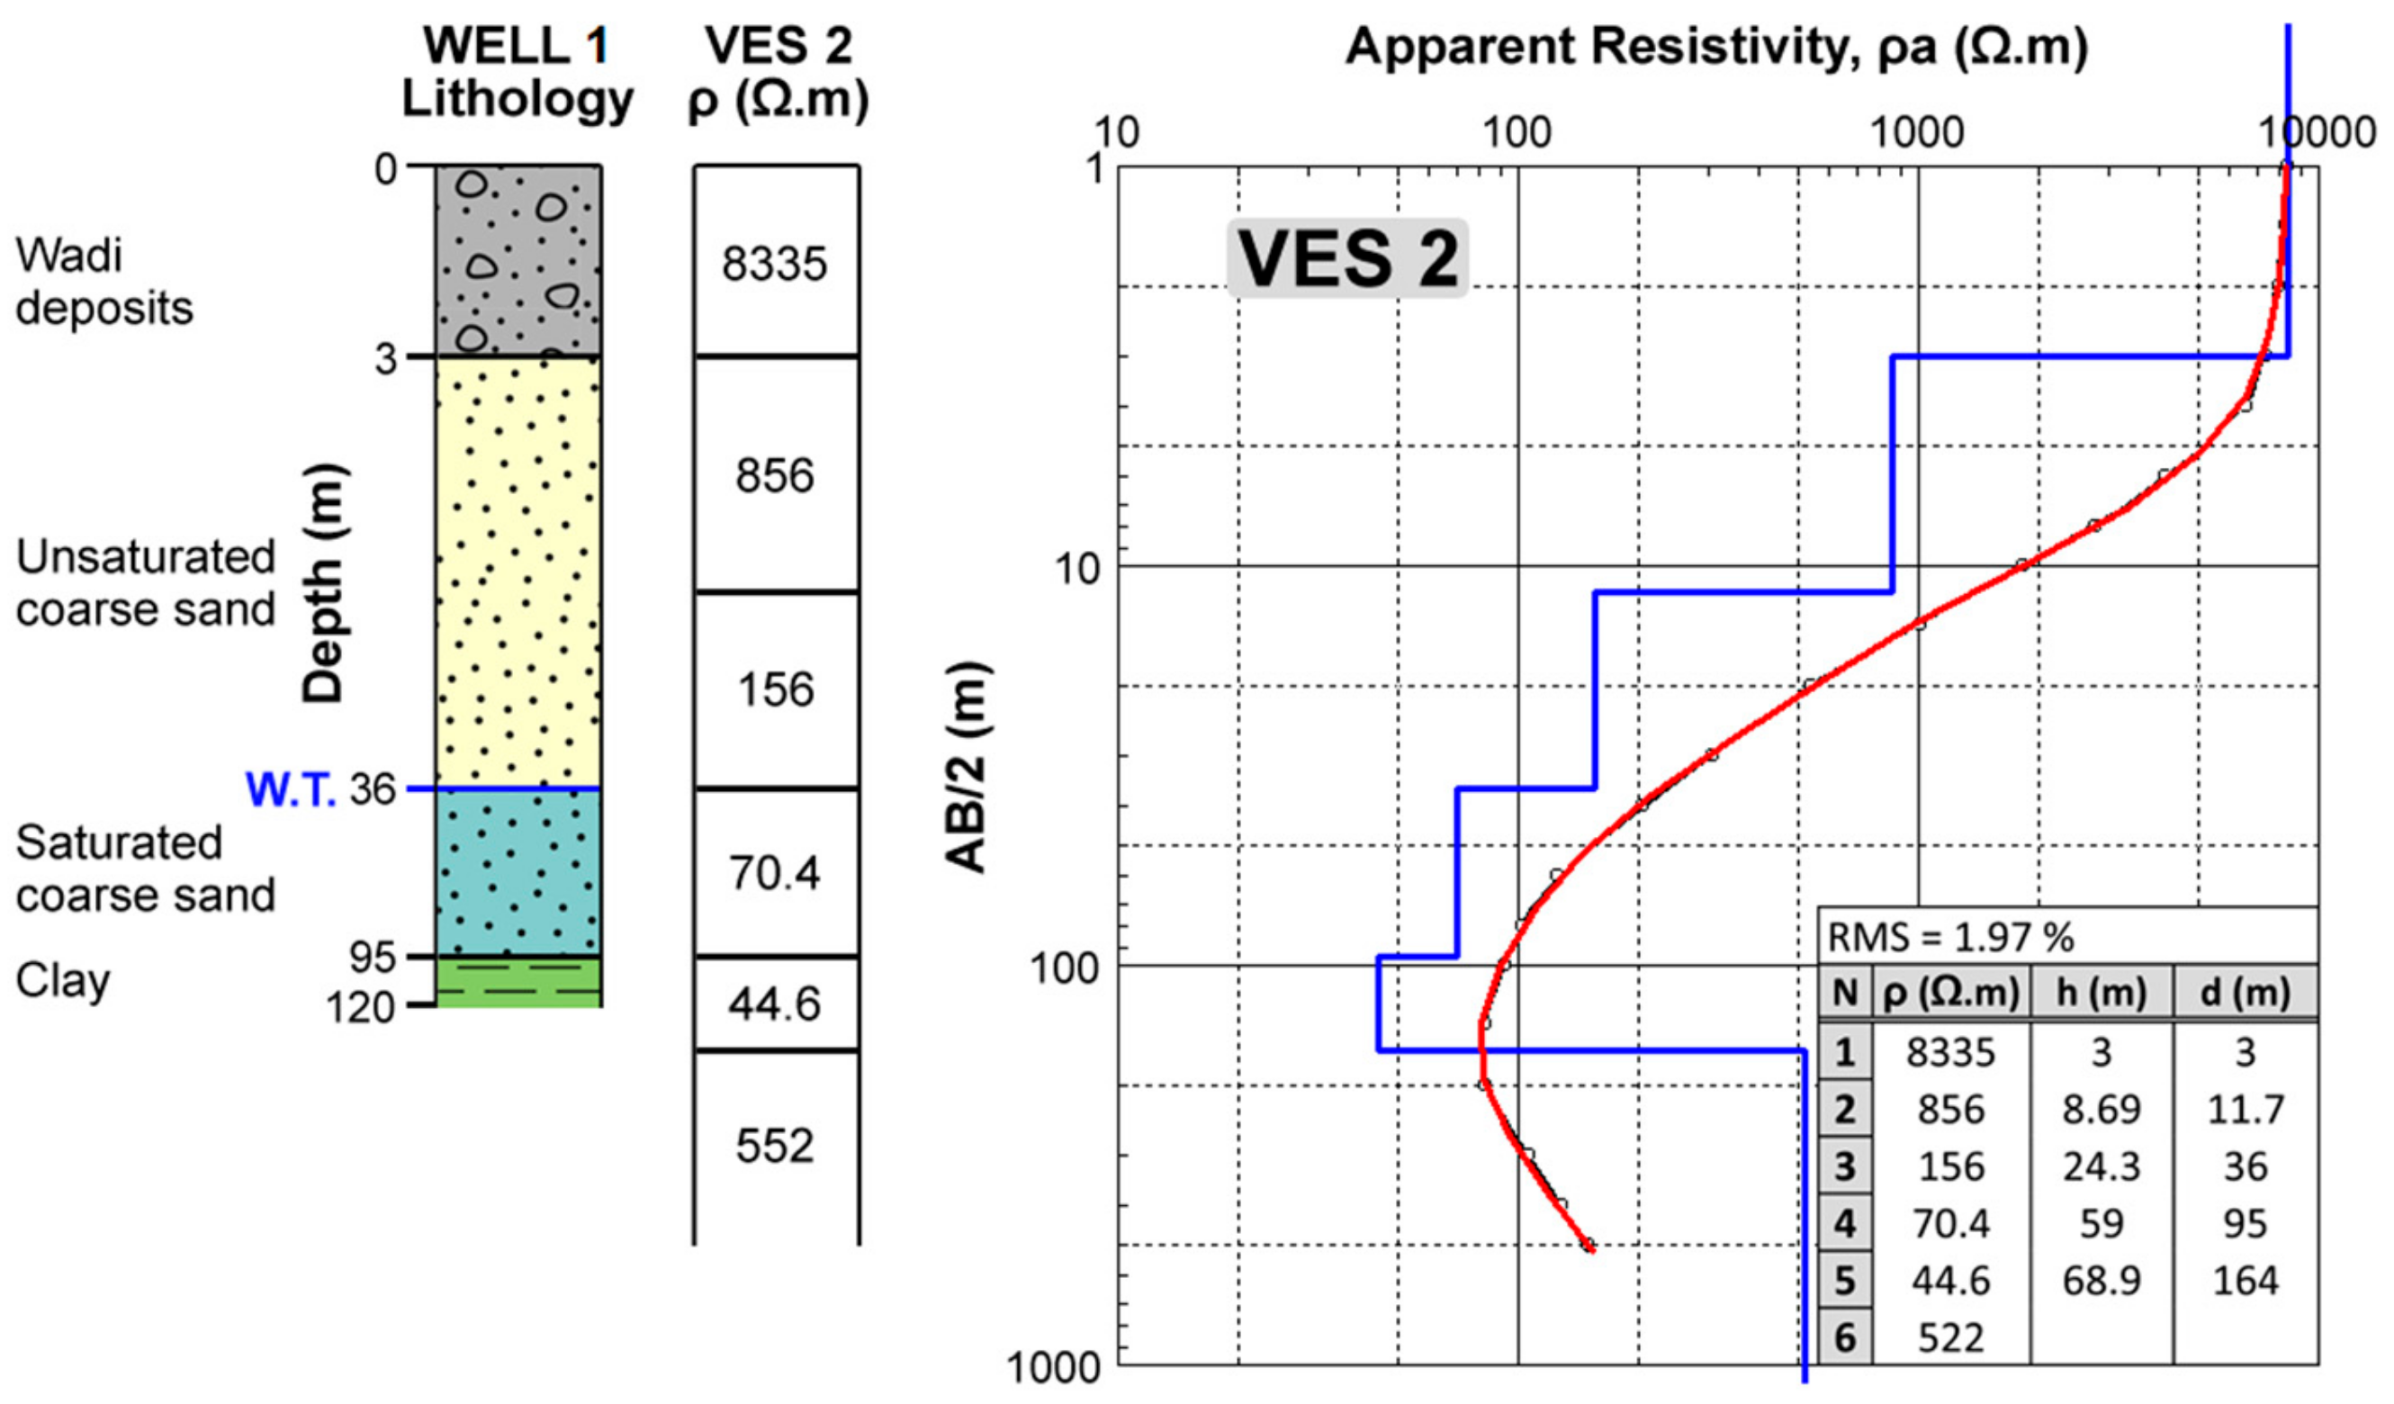
A total of 13 vertical electrical sounding (VES) were carried out at pre-selected stations from remote sensing and aeromagnetic data using the Schlumberger electrode configuration with a maximum half-current electrode spacing (AB/2) of about 300–500 m depending on the availability (Figure 9). The vertical lithological successions of six productive groundwater wells distributed along the study area were obtained from Barsom (2016) [17], in order to calibrate the field collected VES and generate geological cross sections to map the structures and lateral variation in lithology along the study area (Figure 9). Some of these electrical soundings were acquired near productive groundwater wells with known lithology to calibrate the data. The IRIS Syscal Pro instrument was used to measure the apparent resistivity of the ground. The IPI2Win software of Bobachev (2002) was used to display, process, and interpret the measured VES field curves [56]. The curves were carefully processed for discontinuities, cusps, and sharp peaks to produce continuous smooth curves that can be compared with theoretical ones for 1D modeling [57]. Figure 10 shows selective examples of the processed field curves.

4. Results and Discussion

4.1. Groundwater Recharge Potentiality Mapping

The DEM shows that the elevation decreases from 558 m at the plateau to reach about 60 m at the old alluvial floodplain (Figure 3a). This variation in land surface helps in directing the runoff from the elevated plateau toward the floodplain and makes the floodplain more favorable for groundwater recharge. In addition, the floodplain is characterized by gentle slopes (Figure 3b), which slow down the runoff and hold the rainfall allowing high infiltration rates aided by the structural settings and sediment characteristics [58].
There are four delineated watersheds (A, B, C, and D) of different sizes occupied by a large network of channels and wadis that drain from the plateau toward their outlets at the alluvial floodplain (Figure 3c). Watershed (A) covers a large area of the plateau running southwards into the desert floodplain southwest of Nag’a Hammadi-El Ghoneimia stretch before reaching the Nile. Watershed (B) covers a smaller area toward the desert plain south of Hiw and Nag’a Hammadi. Watersheds (C) and (D) both cover small areas running toward the desert plain south of Qena-Hiw stretch and most of their drainages are presently reaching the Nile. Thus, it is expected that the outlet of watershed (A) receives a plausible amount of precipitation during the sporadic rainfalls on the plateau compared to the other outlets of watersheds (B), (C), and (D).
The delineated stream-networks in the study area show a dendritic pattern, which is usually developed on top of homogeneous substrate with gentle slopes [59]. On top of the plateau, the drainage channels are sub-parallel, linear, very long with several kilometers in length, and oriented along the NW–SE structural trend. The drainage density ranges from 0 to 1.84 km/km2 (Figure 3d). The drainage density is inversely proportional to the infiltration rate that depends on the bedrock permeability. The permeable deposits are characterized by high infiltration rates causing low runoff unable of flowing for long distances or cutting further channels, which in turn show low drainage density contrary to the impermeable deposits [39].
On the other hand, all the extracted visible surface lineaments are restricted to the plateau area, which consists of hard limestone resistant to erosion, while the alluvium floodplain deposits hide all surface expression of the lineaments and no outcrops exist that would allow mapping such structures (Figure 5a). This is the reason why neither the geologic map nor the remote sensing data show any structures in the alluvial floodplain area. Consequently, several ground penetrating radar (GPR) profiles were acquired using the 100 MHz shielded antennas in an effort to map any hidden near-surface structures (shallow lineaments) along the alluvial floodplain (Figure 11). However, the GPR profiles do not reveal any near-surface geological structures. Thus, the magnetic results were the main source of mapping the structural settings along the features-less floodplain area. A total of 249 lineaments were extracted from the processed satellite images. The coordinates of the start and end of the lineaments were used to compute their lengths and bearing azimuths (0–360°), which are statistically analyzed using the RockWorks software [60] in the form of a rose diagram to determine the dominant trends in the study area. They have a total length of about 1259 km. The generated rose diagram reveals the dominance of the NW–SE trend that is parallel to the main channel of the Nile River between Qena and Asyut Governorates. Such trend is clearly consistent with the formation of the Nile Valley as a result of the tectonically uplifted Gulf of Suez-Red Sea Hills. The NE–SW trend that is parallel to the Qena Bend and Qena-Safaga Shear Zone is less prevalent. The lineament density ranges from 0 to 1.21 km/km2 (Figure 5b). The zones where the lineaments intersect and occur with high density show the highest infiltration rates [45,61]. The lineament density is high on the eastern part of the plateau and decreases toward the west. Therefore, the old floodplain south of Qena-Hiw stretch probably receives less amount of surface water than the floodplain southwest of Hiw-El-Ghoneimia stretch, due to the possible high loss in drainage water through the dense fractures on the eastern part of the plateau. This is because lineaments may control the infiltration process of surface water and may serve as conduits of the Nile water to the plain and also help the movements of groundwater to surface through fractures and faults [62,63].
In addition, the mean annual rainfall in the available period (1998–2009) ranges between 0 and 159.65 mm/year (Figure 6a). It is high on the far west and very low in the remaining study area. The recharge increases as the rainfall increases [64]. However, the contribution of the recent rainfall in the recharge is assumed to be very low and most of the stored water in the subsurface aquifers is attributed to the past pluvial periods and the sporadic flashfloods. According to Said (1981) [3], the study area witnessed strong torrential rainfalls during the Pleistocene pluvial intervals that led to the deposition of the freshwater-travertine rocks opposite Nag’a Hammadi and the fanglomerates that cover the surface. This is also confirmed by the chemical and isotopic composition of the Nile Valley aquifer system [28]. In addition, the study area is classified as a high-risk flashflood zone in cases of sporadic showers during scarce storms [65].
Moreover, lithology plays an important role in groundwater storage (Figure 6b). The capability to infiltrate water is based on the type of rock-unit, clay content, stratigraphic facies and relationships, and the role of the secondary porosity and permeability, which might be generated due to tectonic or weathering processes. The sandy formations are characterized by high infiltration rates and good groundwater storage capacity compared to the clayey formations. The infiltration is also a function of the soil texture. The fine-grained soils of low permeability permit less infiltration rate and more runoff, while the coarse-grained soils of high permeability allow high infiltration rate [58]. The surface of the study area is covered by soils of different textures. They include gravel soils, gritty and sandy soils, gritty and gravelly soils, sandy soils, gravelly sandy soils, gravelly stony soils, stony debris soils, and un-dissected to weakly dissected travertine rocks (Figure 6). Noteworthy, the study area is covered by thick intercalation of sand and gravel deposits, which reach up to 10 m thickness based on well-logging data [17,66]. These deposit characteristics promote the high infiltration capacity to the underneath aquifers.
Accordingly, the different maps obtained from the remote sensing and auxiliary data (elevation, slope, lineament density, drainage density, watershed outlets, rainfall, aeromagnetic, lithology, and soil cover) were reclassified with respect to their influence on recharge capability and converted to thematic layers (Figure 12). Each thematic layer consists of five classes of different recharge potentiality (very high, high – moderate – low – very low) ranked on a numerical scale ranging from 5 to 1, respectively. The very high class (5) is the most preferable location for groundwater recharge contrary to the very low class (1).

GIS Integration and Modeling

Since each factor has only a partial effect on the water infiltration, it is necessary to integrate the influences of the different factors together using the GIS technique in order to get a complete picture of the groundwater recharge potentiality. This is performed by overlaying all the thematic layers using the weighted overlay method [67,68]. In this context, the thematic maps are ranked on a scale of 1–5 based on assessing the relative influences of the factors on the infiltration. Their weighted percentages (%) are then determined by dividing each map rank by the total summation of all map ranks and then multiplying by 100. Finally, the thematic maps were multiplied by their weighted percentages, and the results were added together (overlaid) using the weighted overlay analysis tool in ArcMap to produce the groundwater recharge potentiality map.
The final groundwater recharge potentiality map of the study area is classified into five zones of different recharge capabilities (Figure 13). The old alluvial floodplain is characterized by moderate to very high recharge potentialities. The desert zone located south and southwest of Hiw-El-Ghoneimia stretch shows very high recharge potentiality, whereas the area lying south of Qena-Hiw stretch shows high recharge potentiality. The plateau is characterized by low and very low recharge potentialities. Accordingly, the desert area lying south and southwest of Hiw-El-Ghoneimia stretch was identified for groundwater exploration and verifying the GIS model using the VES.

4.2. The Structural Framework of the Study Area

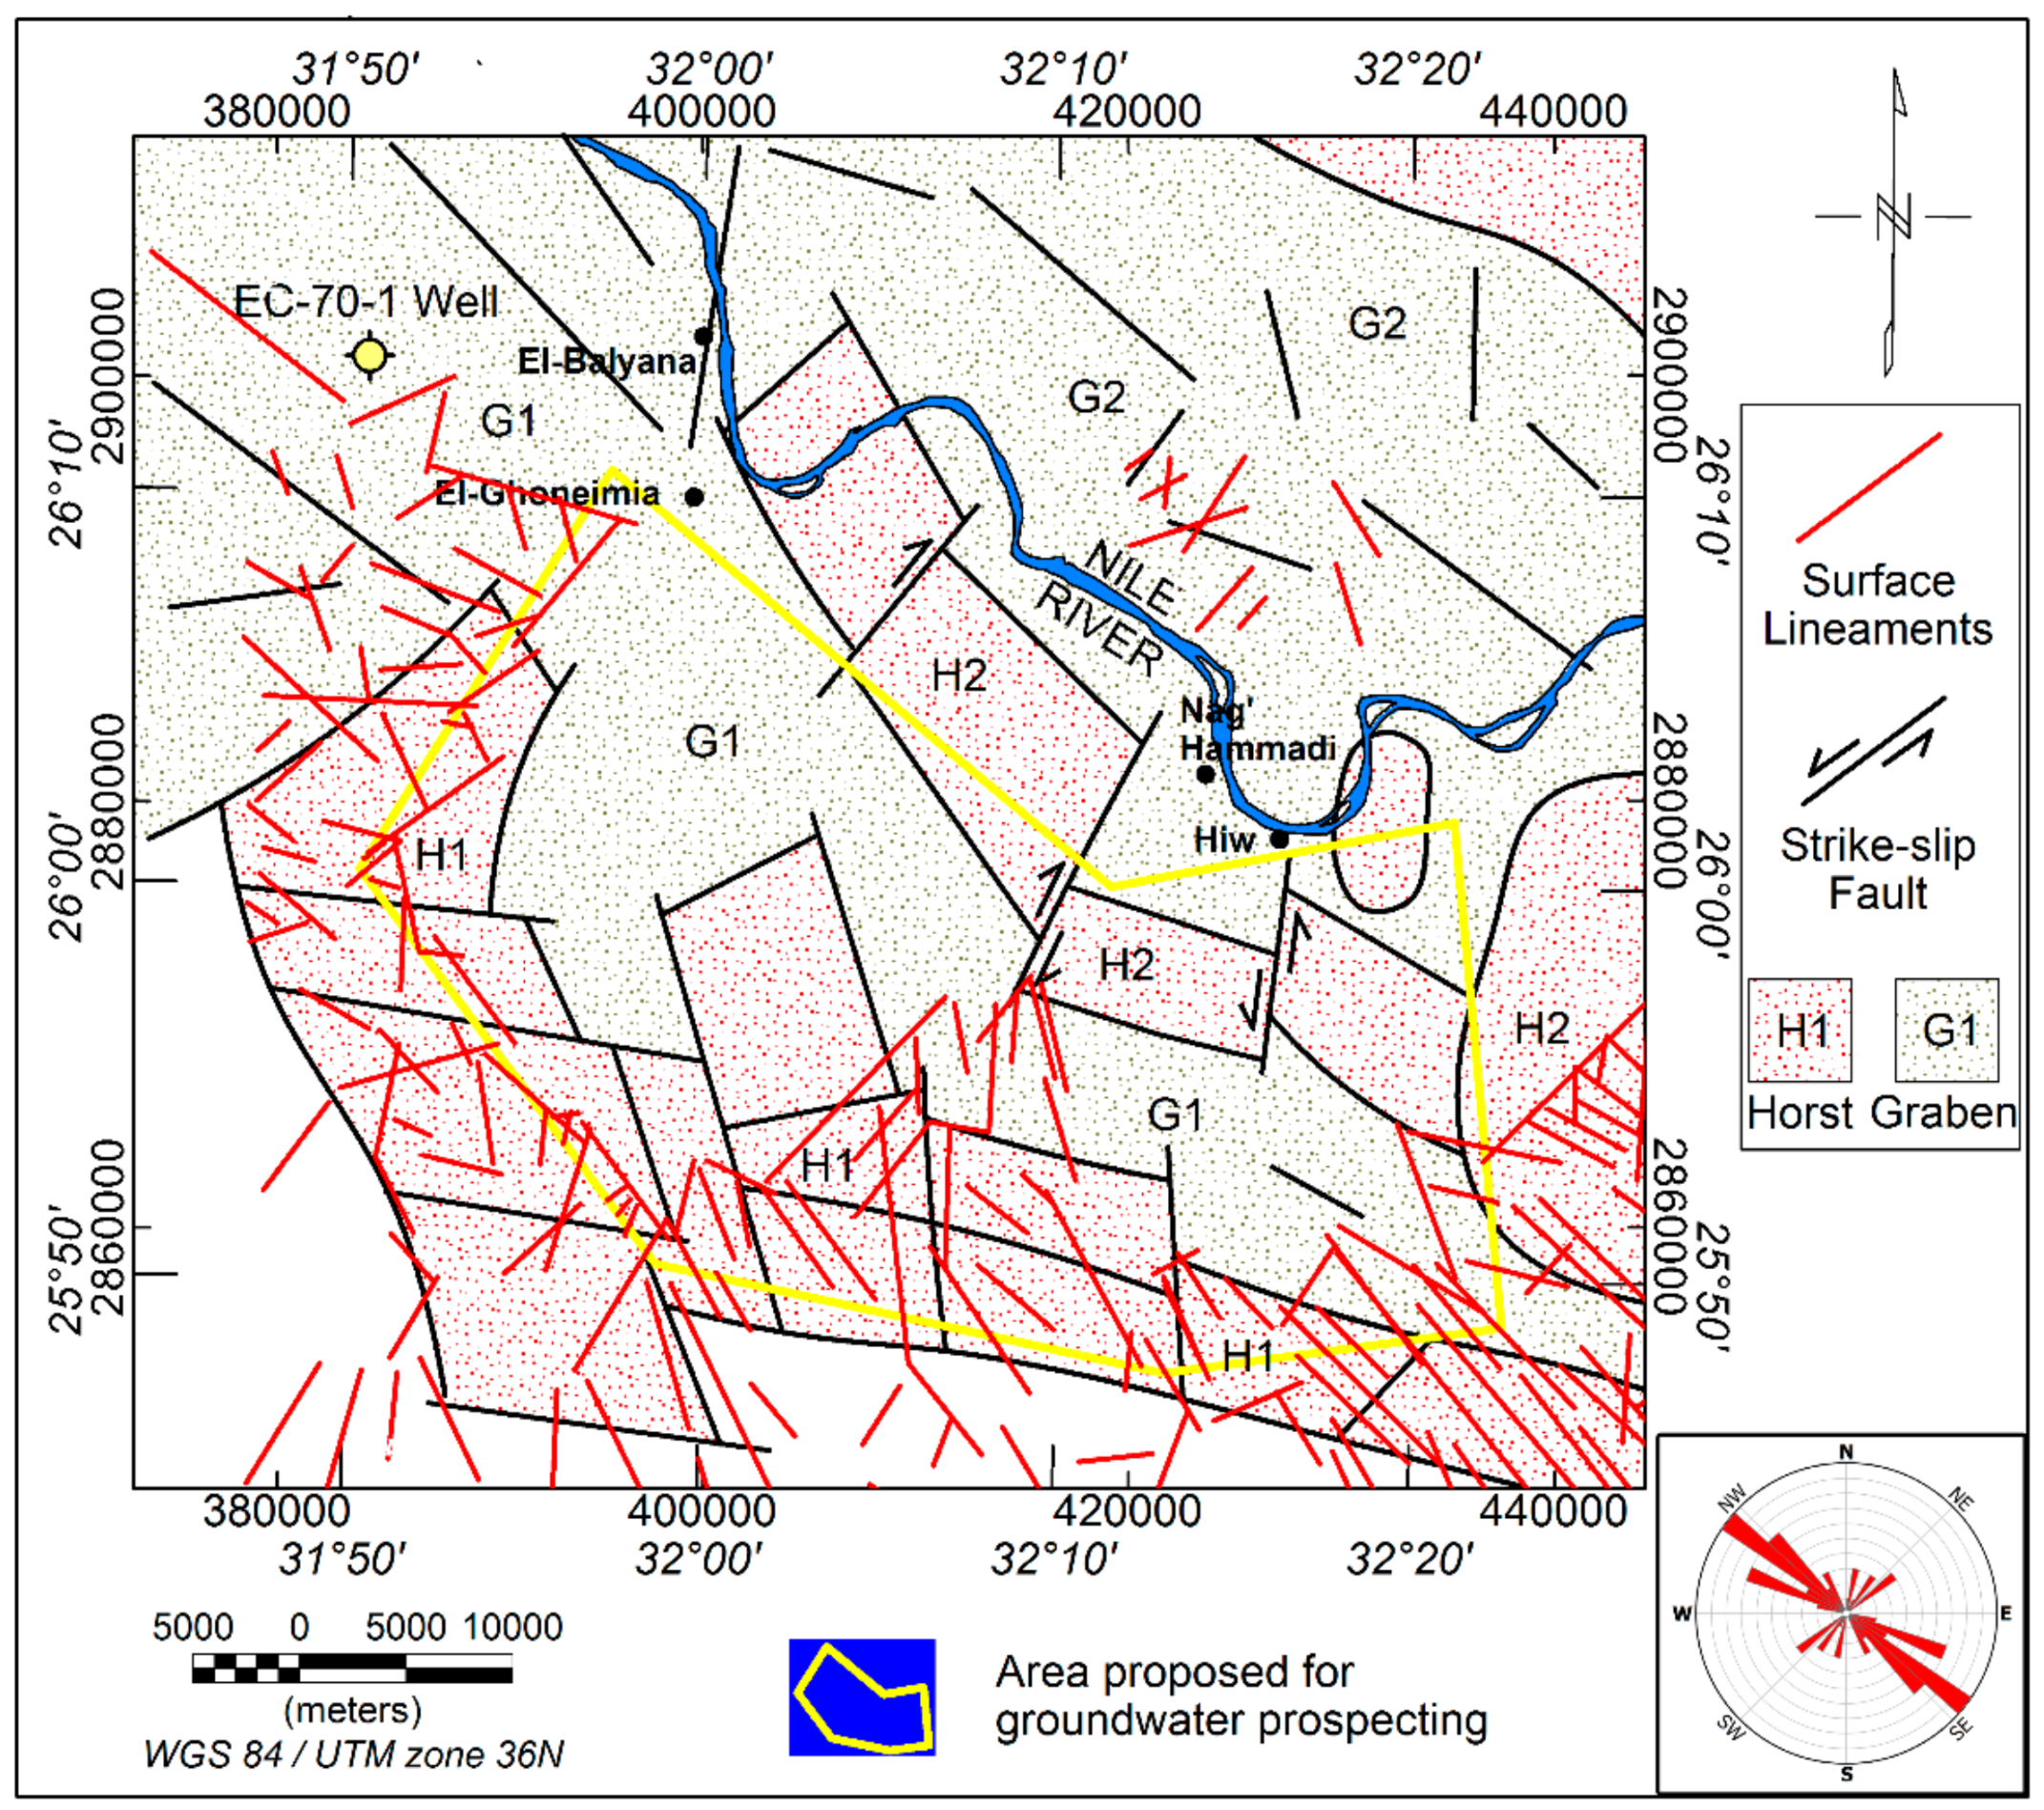
The deep-seated structures affecting the basement rocks along the study area were inferred from the RTP, SVD, and Euler deconvolution maps (Figure 14). These basement rocks are dissected by faults trending NW–SE and NE–SW. The corresponding rose diagram reveals the dominance of the NW–SE trend of the Gulf of Suez-Red Sea, while the NE–SW trend that is parallel to the Qena-Safaga Shear Zone is less prevalent. According to the crosscutting relationship of extracted faults from the processed aeromagnetic maps and supported by the previous works [3,69], the NW–SE trend is older than the NE–SW trend. These faults divide the basement into parallel basins (G1 and G2) bounded by basement uplifts (H1 and H2) oriented generally in the NW–SE direction. The studied old alluvial floodplain occupies the basin (G1) that takes approximately the shape and orientation of the valley, supporting that the Nile Valley has been developed on a tectonically controlled basement alignment. In addition, the surface lineaments extracted from the remote sensing data and plateau cliffs are superimposed on the basement structures and uplift at the southern and western parts, which reflects that the deep-seated faults might extend upwards to affect the overlying sedimentary succession and form vertical conduits between the deep and shallow aquifers. Studies of the chemical and isotopic composition of the groundwater of the Nile Valley aquifer system show that the shallow aquifer is recharged from the water leakage from the adjacent fractured limestone aquifer and the deep Nubian sandstone aquifer through faults, especially near the plateau [28]. The Euler deconvolution solutions show that the fault depths are shallow (less than 500 m) at the southeast and increase to more than 1500 m at the northwest.
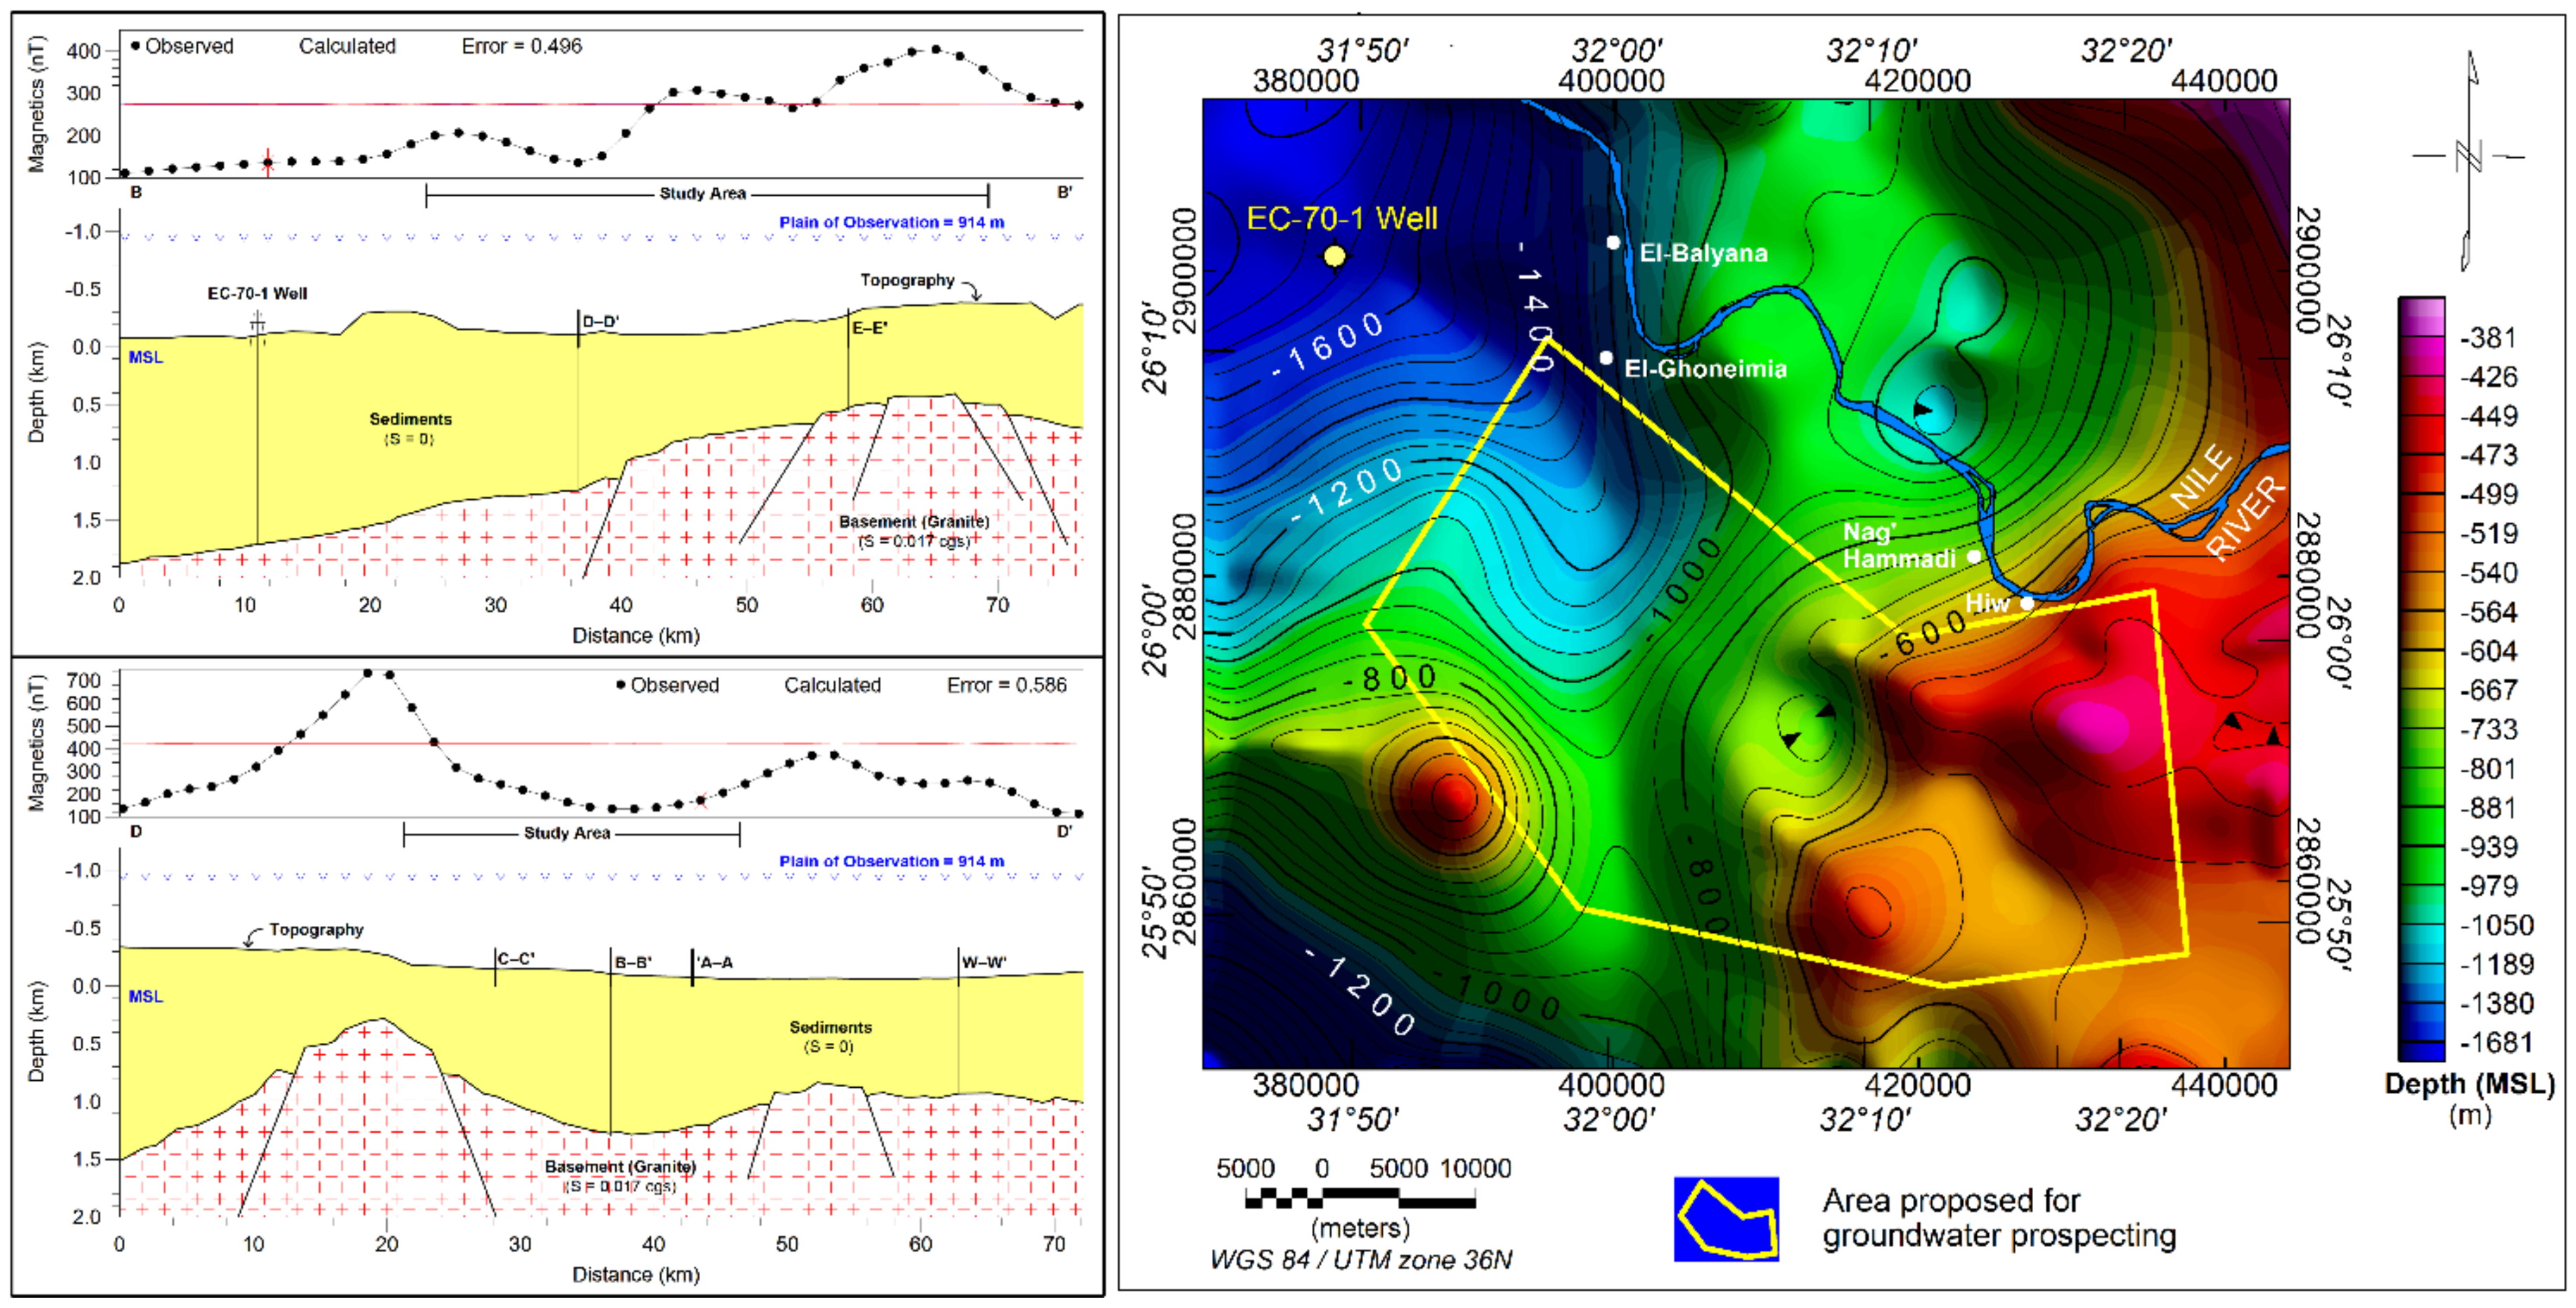
Seven 2D magnetic models (W-W’, A-A’, B-B’, C-C’, D-D’, E-E’, and F-F’) were constructed along profiles dissecting the study area in the NW–SE and NE–SW directions in order to display the basement topography using the GM-SYS software of NGA (2004) (Figure 7b) [70]. The basement surface was calibrated by the basement depth in El-Balyana (EC-70-1) borehole (1.737 km) at the northwest and Qena-1 borehole (0.54 km) at the northeast near the study area [71,72]. The basement rocks were considered of granitic composition and the sedimentary cover was assumed to have a minimum magnetic susceptibility of about 0.000041 cgs according to the boreholes and geophysical studies at adjacent areas (e.g., ElGalladi, 2007) [24]. The estimated average magnetic susceptibility of the basement rocks from the modeling is 0.017 cgs. This value agrees with the reported range for granitic rocks in Telford et al. (1990) [73]. Lateral heterogeneity in the basement granitic composition may cause a slight difference in the magnetic susceptibility. Figure 15 shows selective examples of the 2D magnetic models of the basement. Moreover, the basement surface was digitized from the models to construct a depth-to-basement map of the study area, which reflects the lateral variation in the thickness of the sedimentary cover (Figure 15).
The eastern part of the basin (south of Nag’a Hammadi and Hiw village) is affected by a major uplift, where the basement occurs at a shallow depth of about 0.5 km. The basin dips and increases in width toward the northwest to about 1.3 km southwest of Nag’a Hammadi-El-Ghoneimia stretch and extends further northwestwards with a large increase in width and depth to more than 1.8 km west of El-Balyana, Sohag. The increase in basement depth reflects the increase in groundwater potentiality due to the probable increase in the thickness of the groundwater-bearing sediment (e.g., the sands of Nubia Formation and Qena Formation). In general, the uplift of the basement complex of the Eastern Desert during the Oligo-Miocene induced a tensile stress in the surrounding crust, creating the NW–SE fractures and cracks along which the valley was subsequently developed by the fluvial activities [18,63]. Such tensile stress has produced secondary porosity and increased the hydraulic conductivity of the study area.

4.3. Analysis and Interpretation of VES Data

The interpretation of VES data aims at calculating the number, resistivity, and thickness of the geoelectric layers (sedimentary layers) occurring directly under each VES. The VES data are usually correlated with the borehole data to give them a geological and hydrogeological meaning. In this context, the lithology log of Well-1 was used to calibrate the 1D model of VES-2 (Figure 16). The calibration revealed that VES-2 location consists of six geoelectric layers. The results of the calibration were used as a guide in the quantitative modeling of the other VES field curves taking into consideration geological and geophysical information from previous works. The geoelectric succession was therefore categorized into five principle layers (A, B, C, D, and E) equivalent to a stratigraphic sequence ranging in age from Eocene to Quaternary (Table 1).
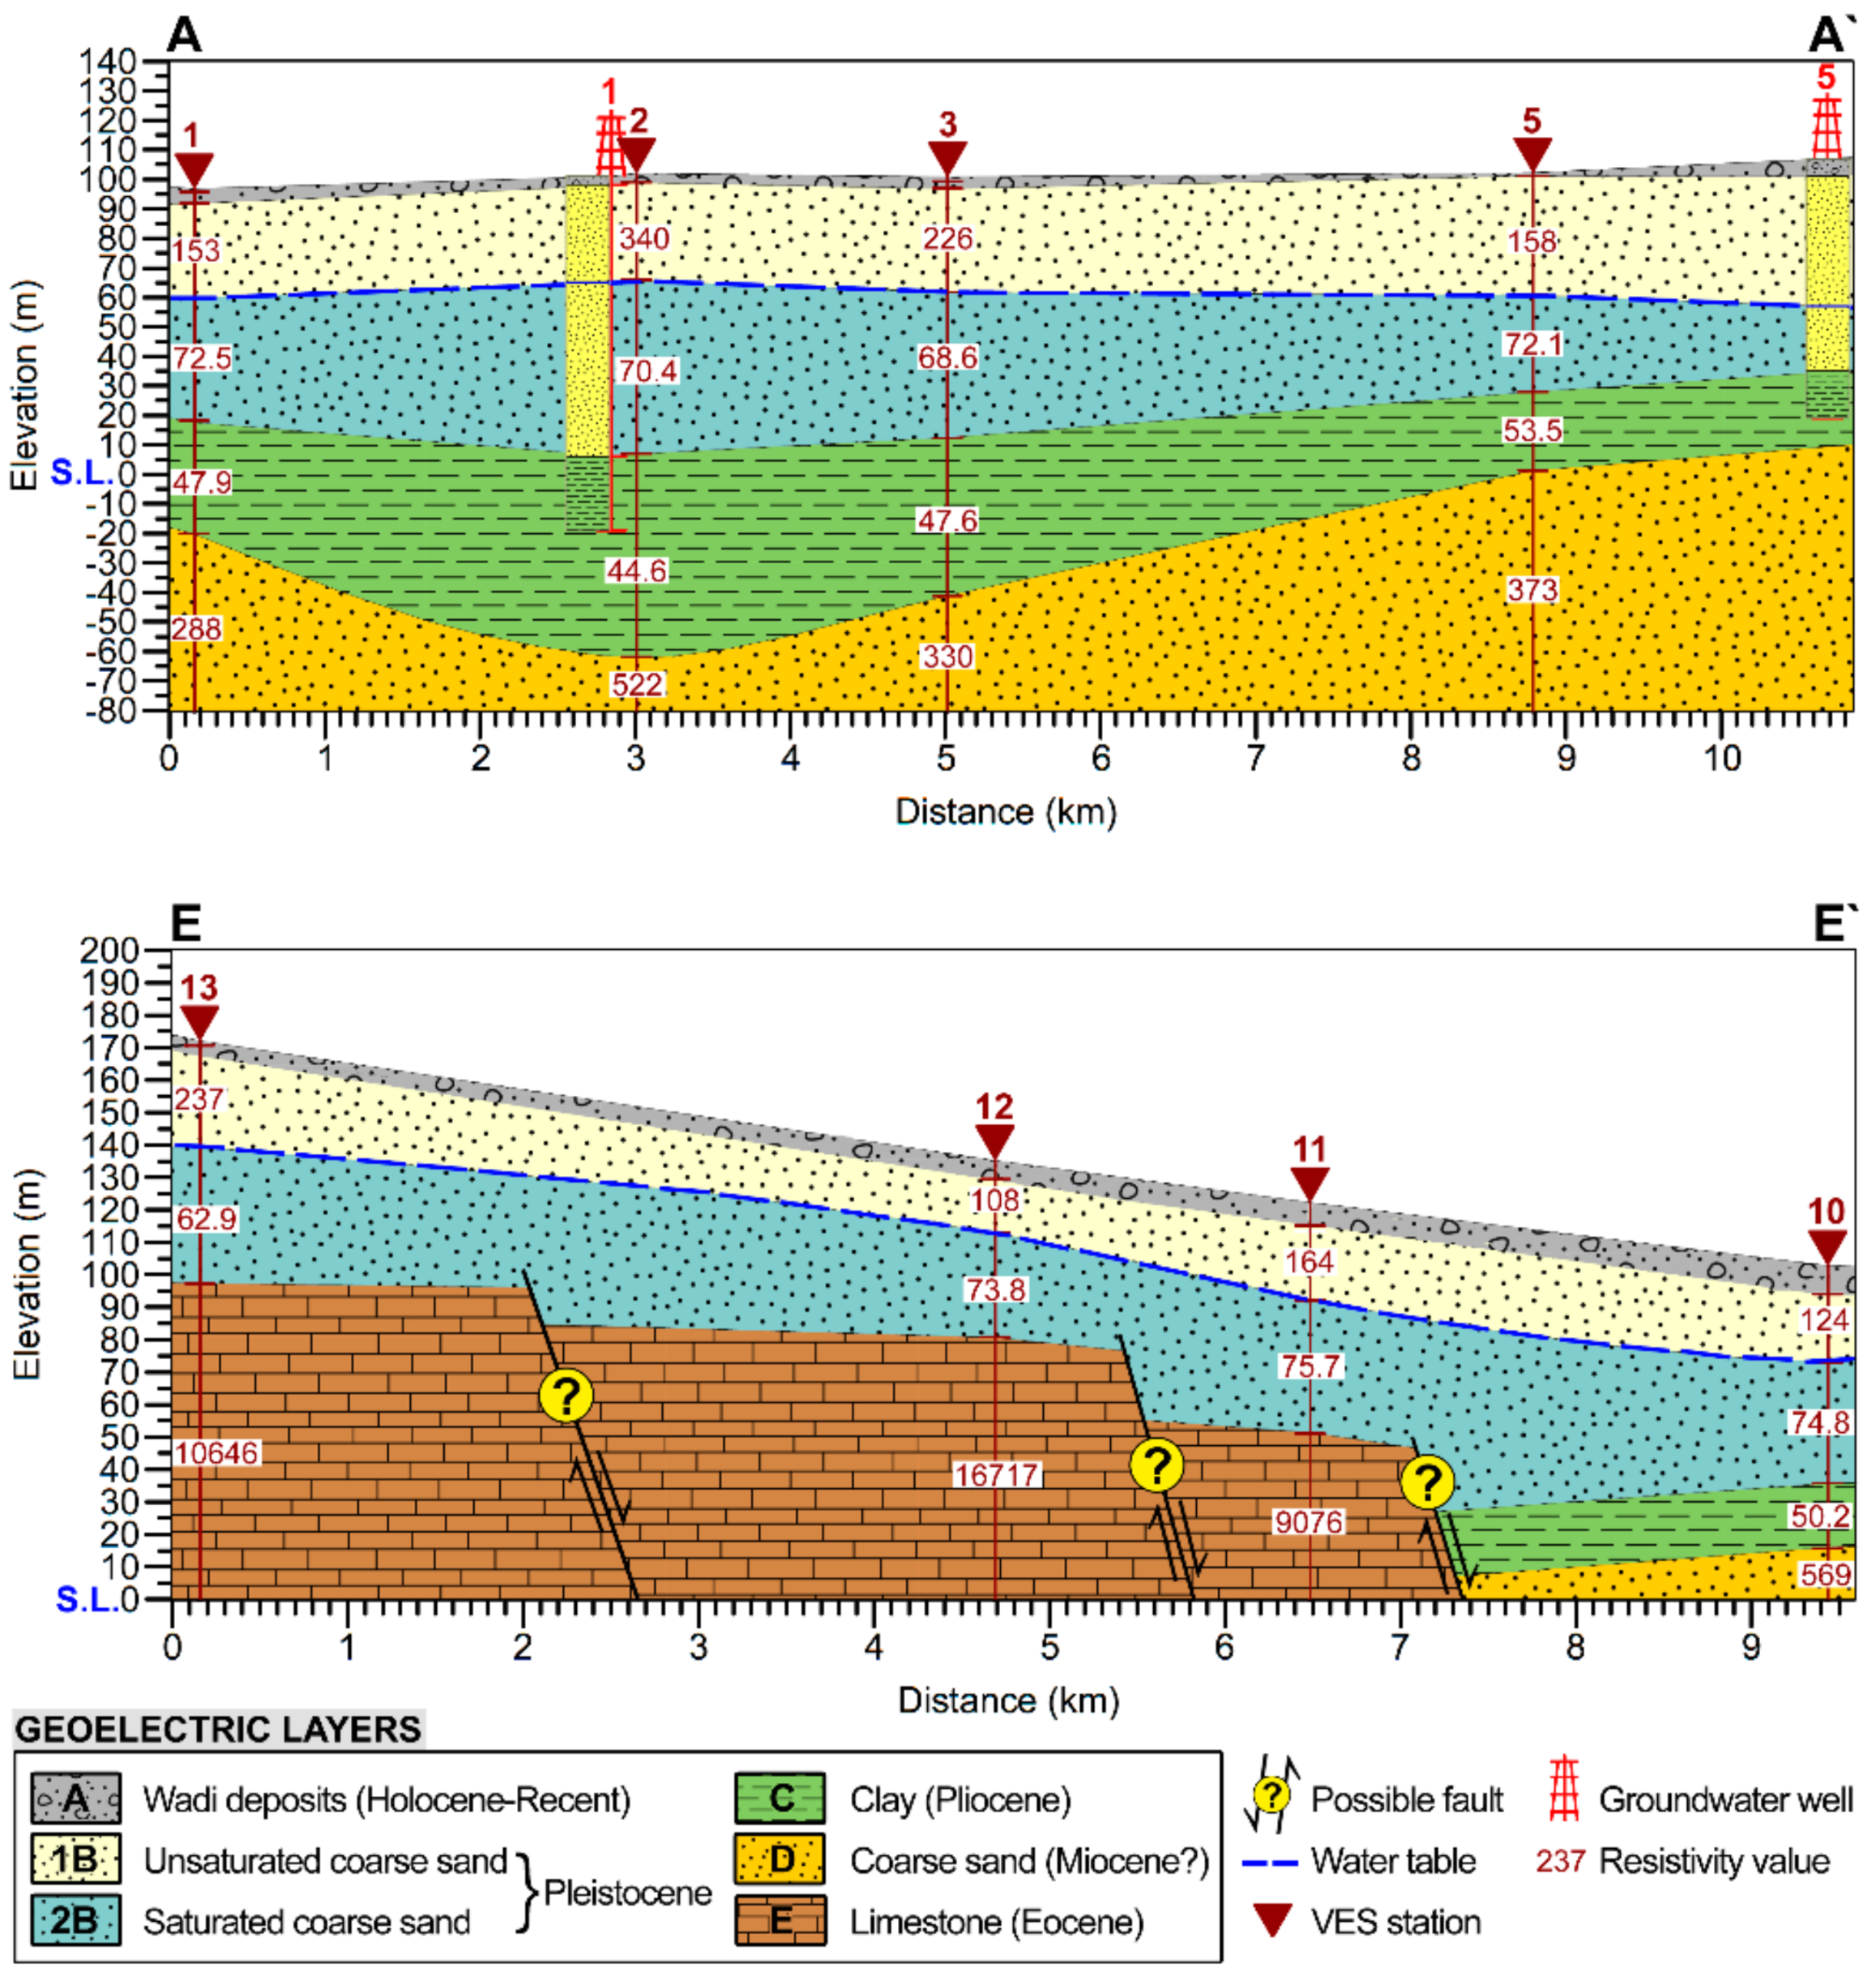
Five geoelectric cross-sections (A-A`, B-B`, C-C`, D-D`, and E-E`) (Figure 9) were constructed along profiles oriented in NW–SE and NE–SW directions by combining the geoelectric succession at each VES with the lithological units from the field collected groundwater wells in order to delineate the lateral and vertical extensions of the different geological and hydrogeological units. Figure 17 illustrates selective examples of the geoelectric cross-sections. The geoelectric layers (A, B, C, D) have a large lateral extension with varying thickness, especially near the cultivated floodplain. Some of the geoelectric layers were missed toward the plateau due to the possible effect of normal faulting and the presence of the faulted Eocene limestone blocks (layer E) that has unusual high resistivity values varying from 8967 to 16,877 Ω.m (e.g., Mahmoud and Tawfik, 2015) [74].
Importantly, the geoelectric layer (B) is interpreted as coarse sand equivalent to the shallow Quaternary aquifer that forms the main water-bearing unit in the Nile Valley. This layer is divided according to hydrogeological importance into two sub-layers: 1B and 2B. The upper sub-layer (1B) forms the dry aeration zone above the water table with resistivity values ranging from 108 Ω.m at VES-12 to 321 Ω.m at VES-8 and a thickness ranging from 15.6 m at VES-8 to 40.5 m at VES-5. The lower sub-layer (2B) is correlated to the saturation zone with low resistivity values varying slightly between 62.9 Ω.m at VES-13 and 78.6 Ω.m at VES-4 and VES-8 and its thickness ranges from 6.23 m at VES-6 to 59 m at VES-2. It occurs under unconfined condition due to its permeable cover of Wadi deposits (layer A). Moreover, the Quaternary aquifer is confined from the base by a layer of Pliocene clays (layer C) that is characterized by low resistivity values ranging from 16.7 Ω.m at VES-7 to 53.5 Ω.m at VES-5 and its thickness ranges between 11.5 m at VES-7 to 58.9 m at VES-2.
The geoelectric layer (D) has resistivity values ranging between 288 Ω.m at VES-1 and 863 Ω.m at VES-4. It is inferred as dry coarse sands, which refers to the possible existence of a second, deep sandy aquifer. A similar thick sand section dated to the Miocene is recorded below the Pliocene clays in the boreholes drilled for oil exploration in the Nile Valley at El-Balyana and Kom-Ombo [27,75]. The thickness is not detected at all in the soundings except at VES-6 and VES-7, where its thickness reaches about 97.4 and 78.8 m, respectively. It is separated from the overlying Quaternary aquifer by the Pliocene clays (layer C).

4.4. Hydro-Geophysical Maps and GIS Model Validation

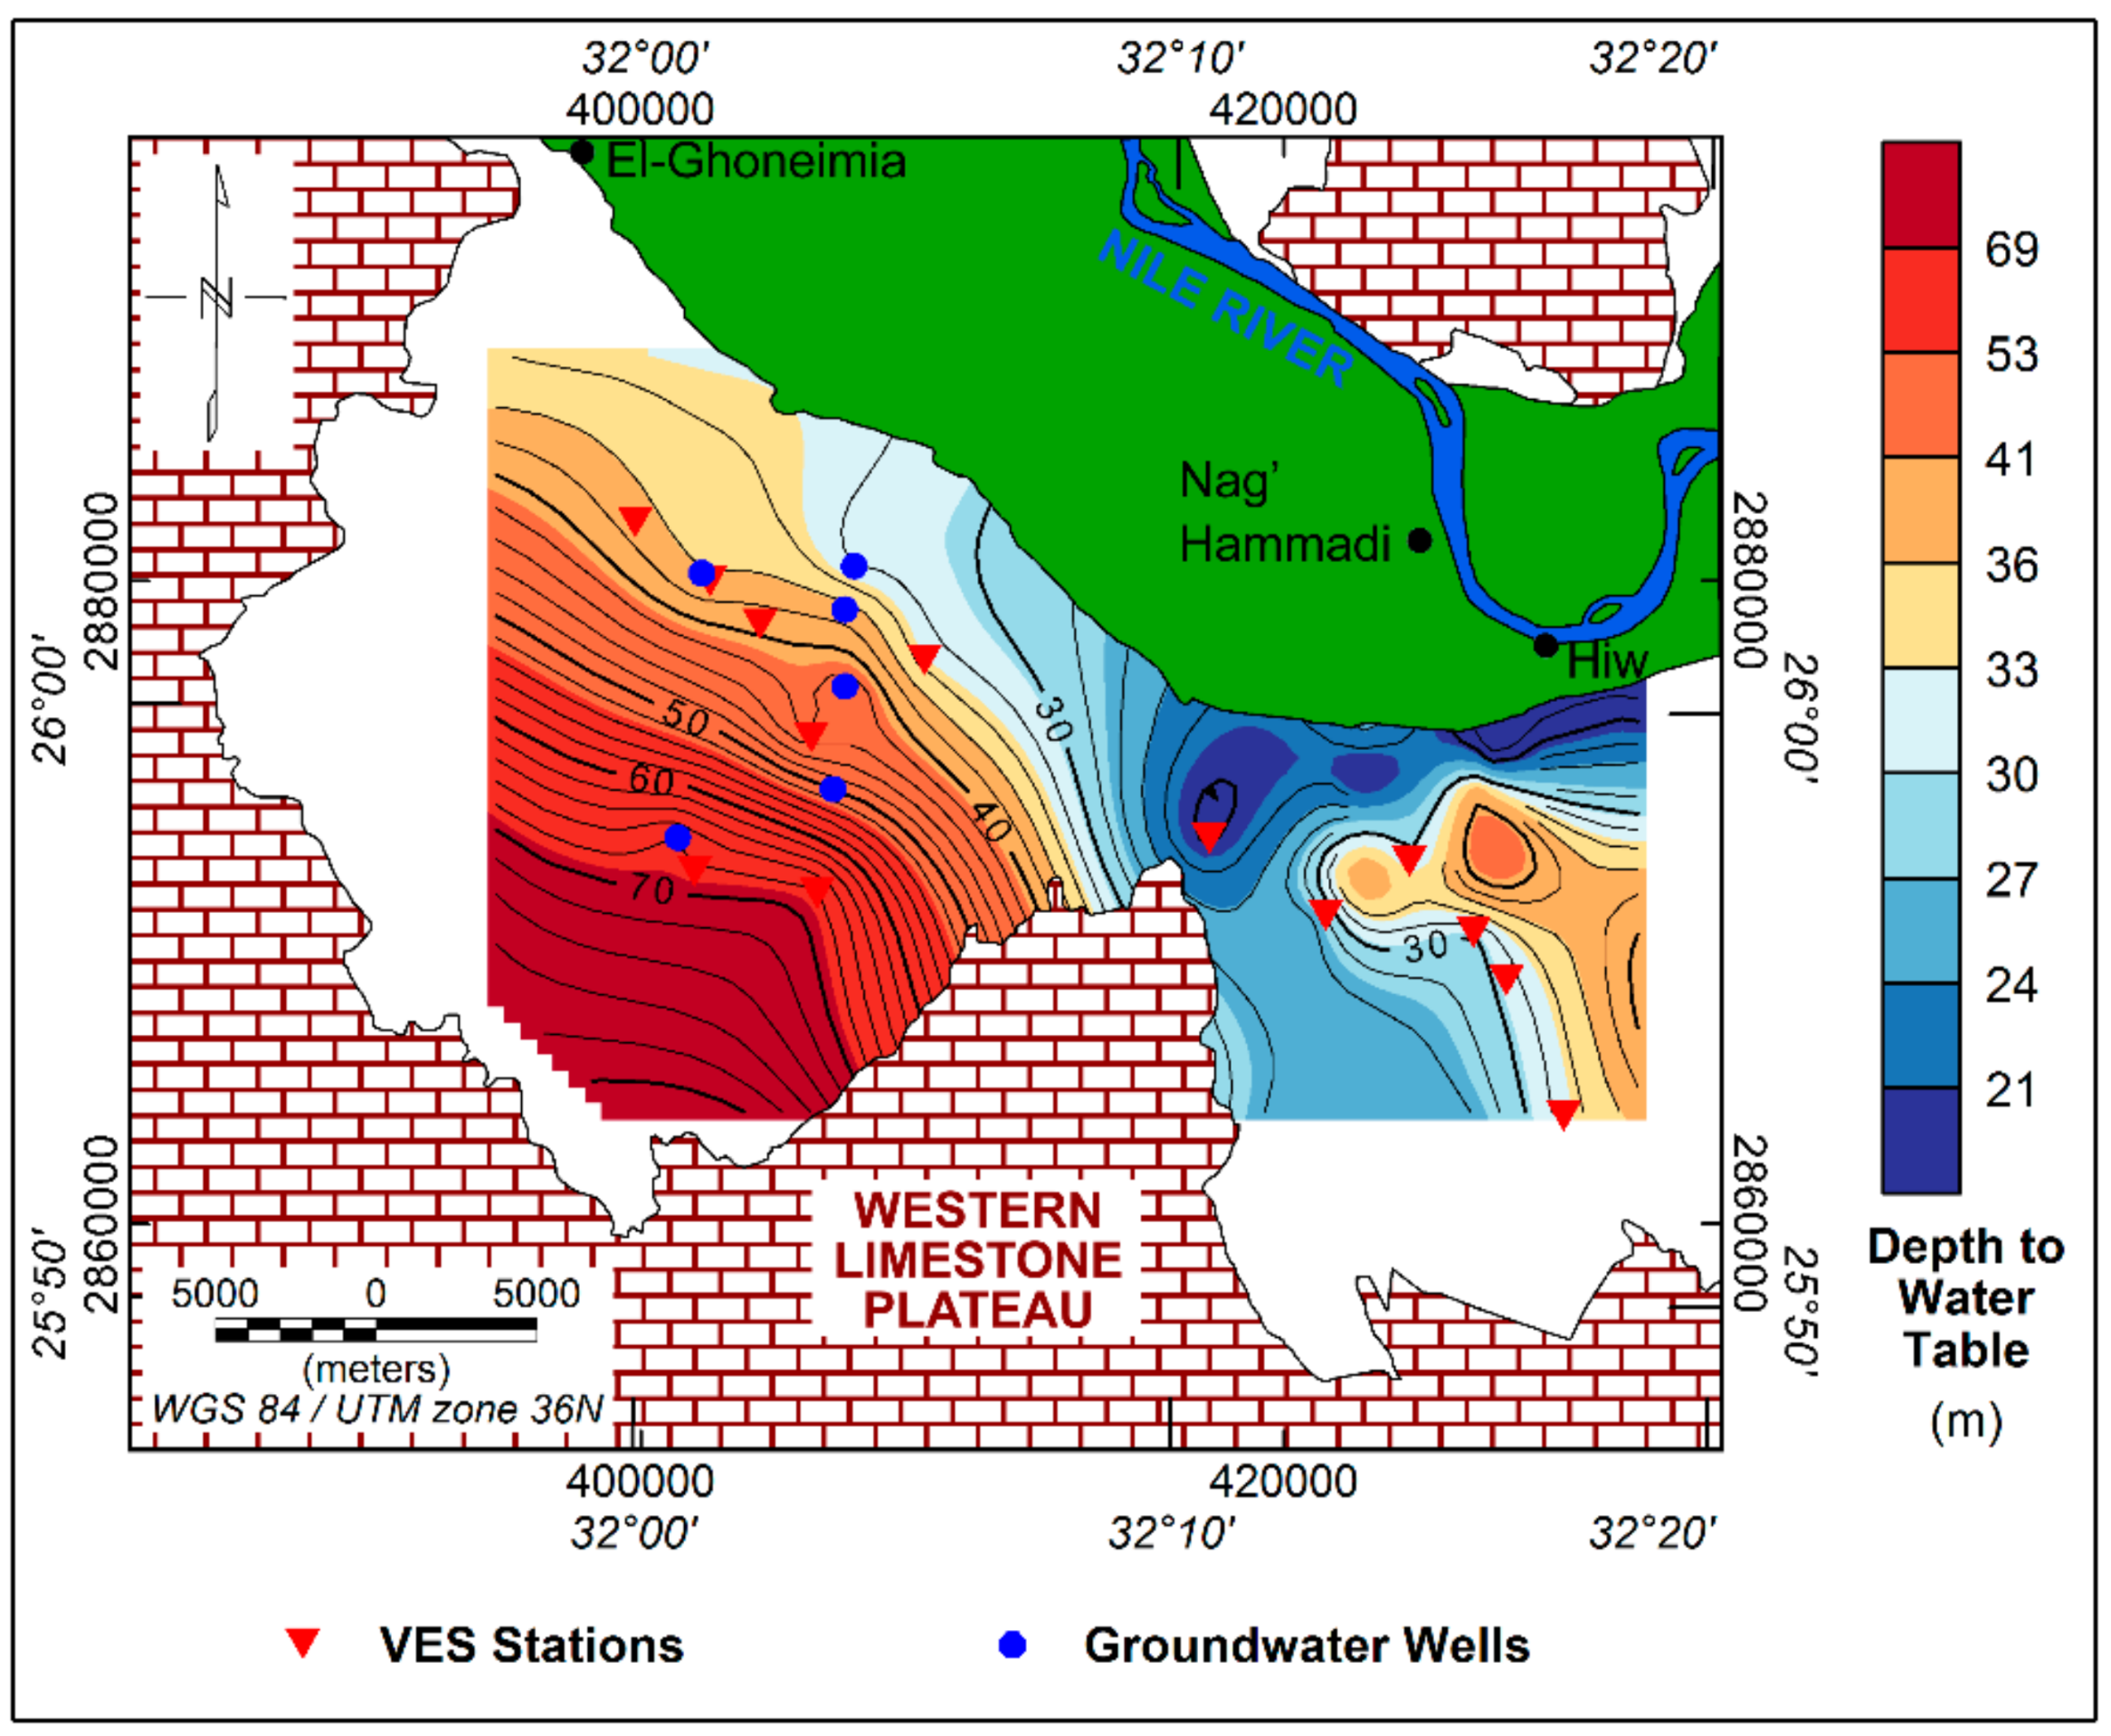
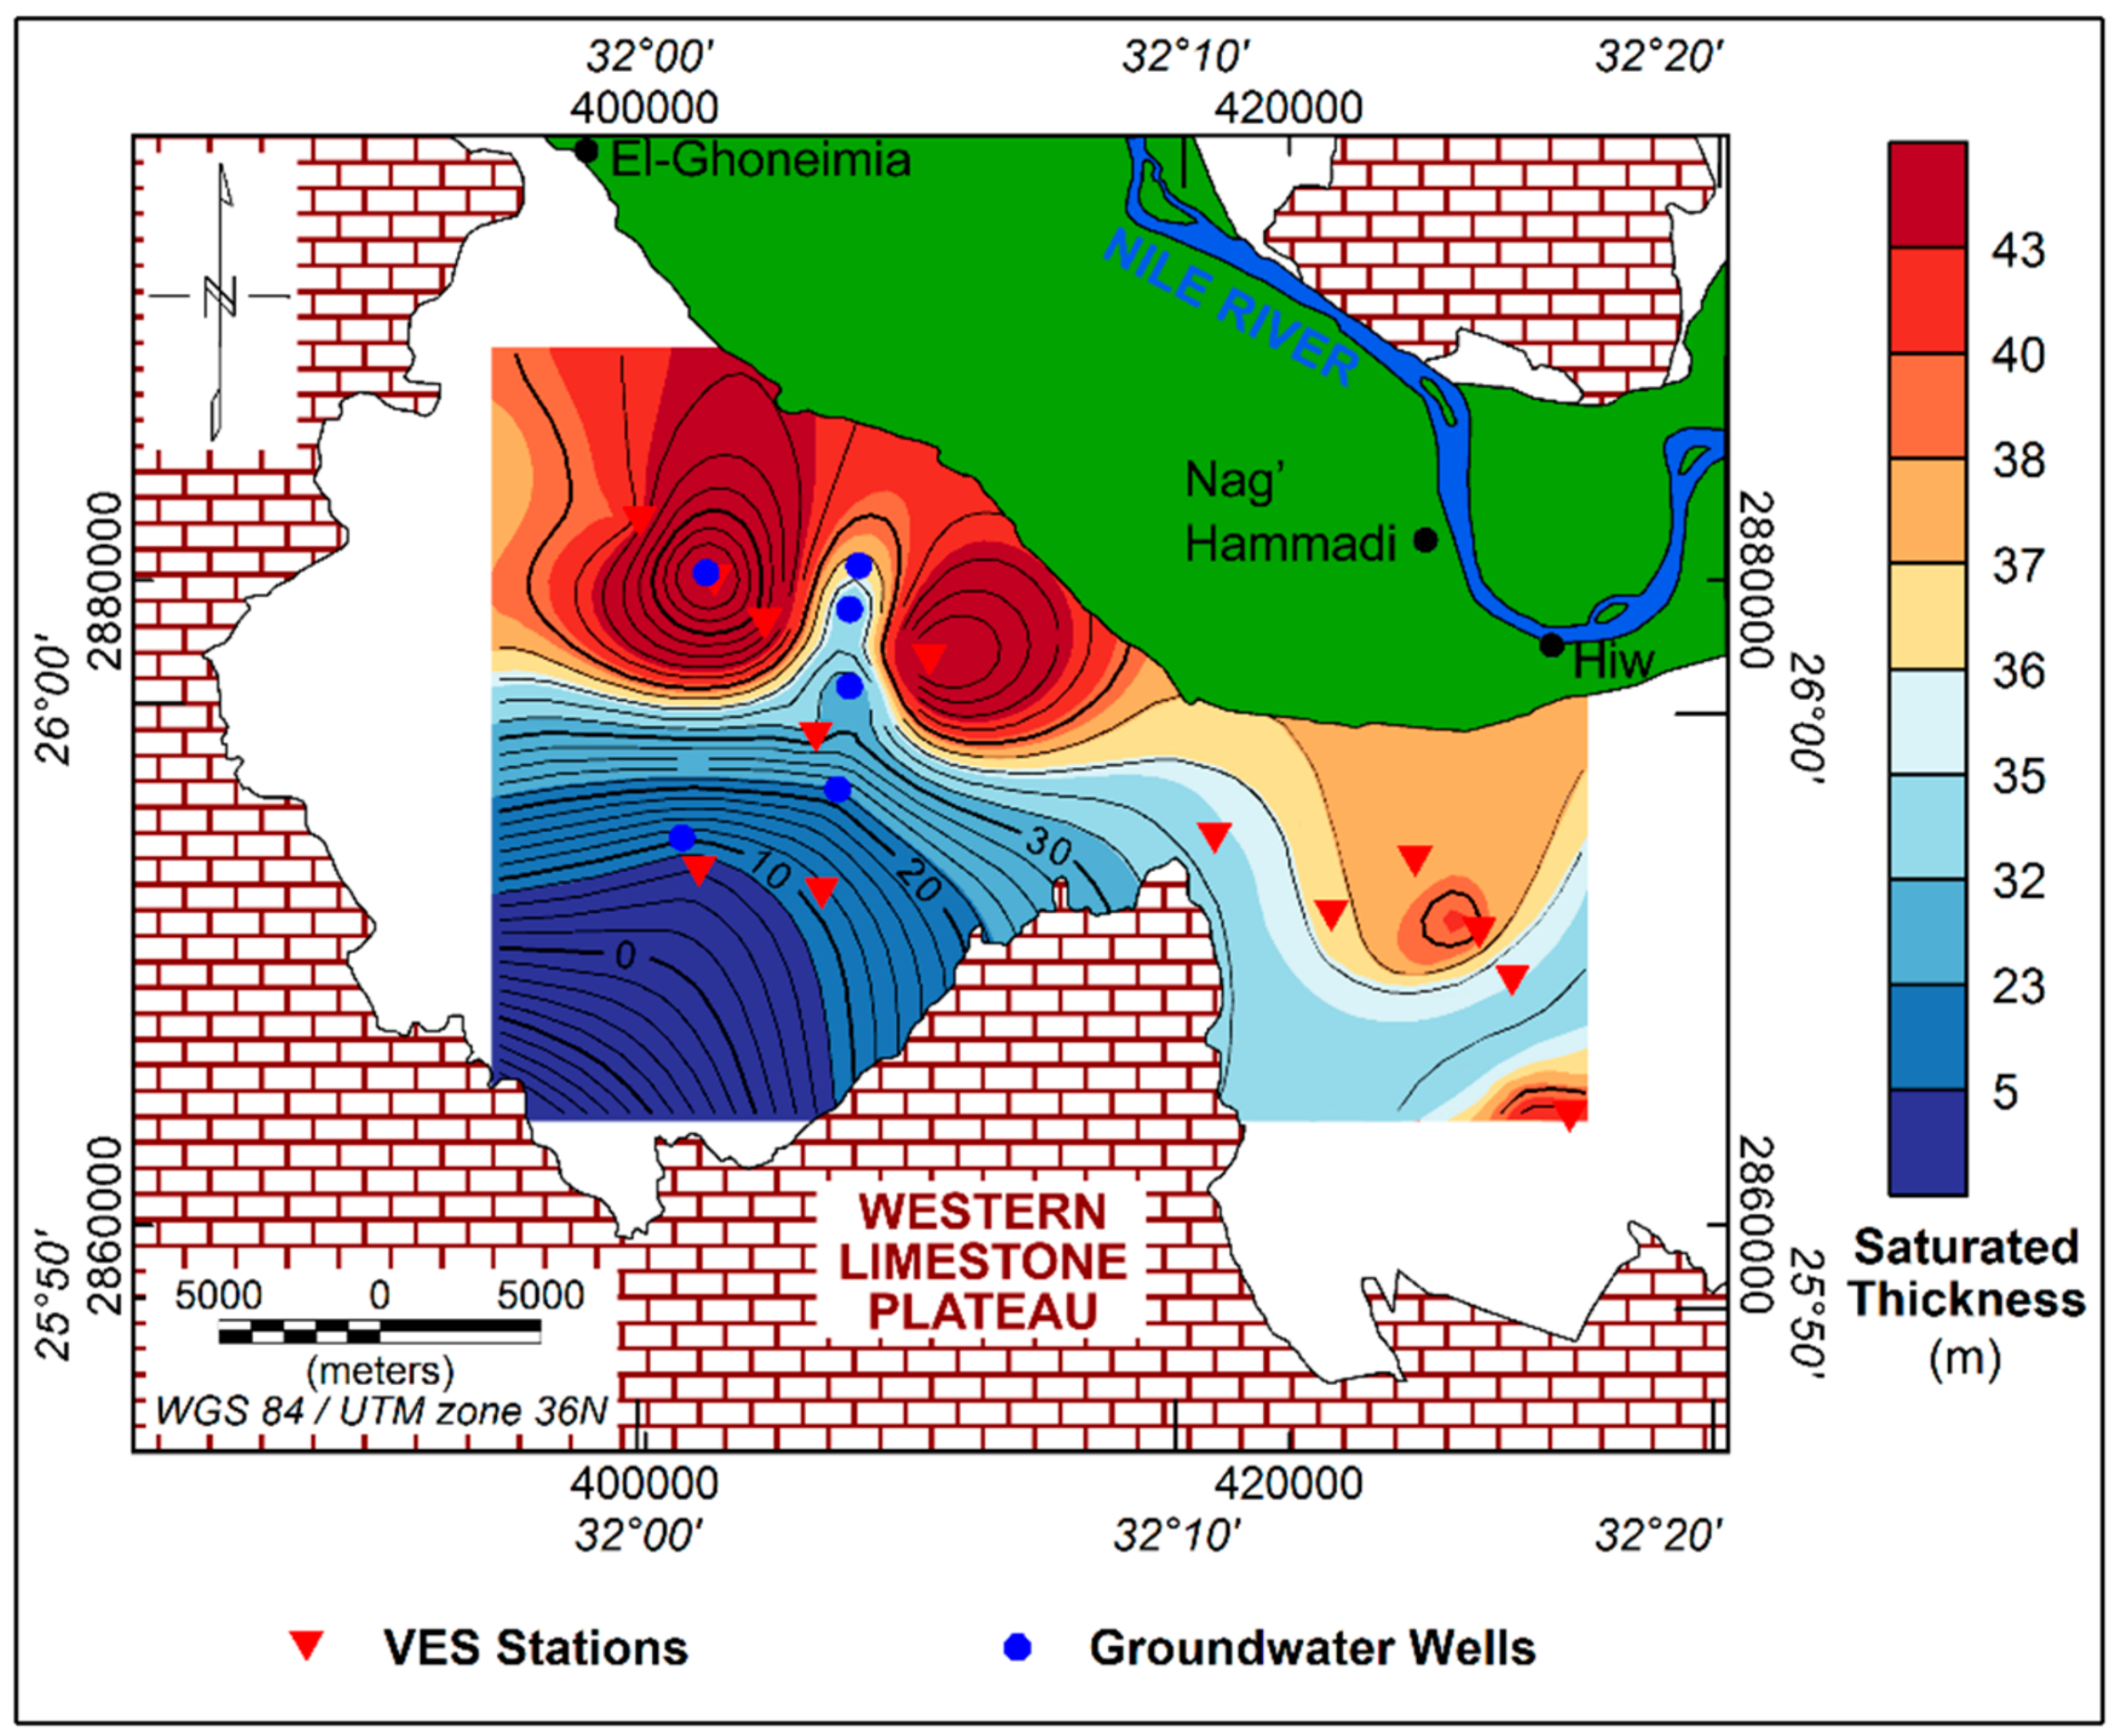
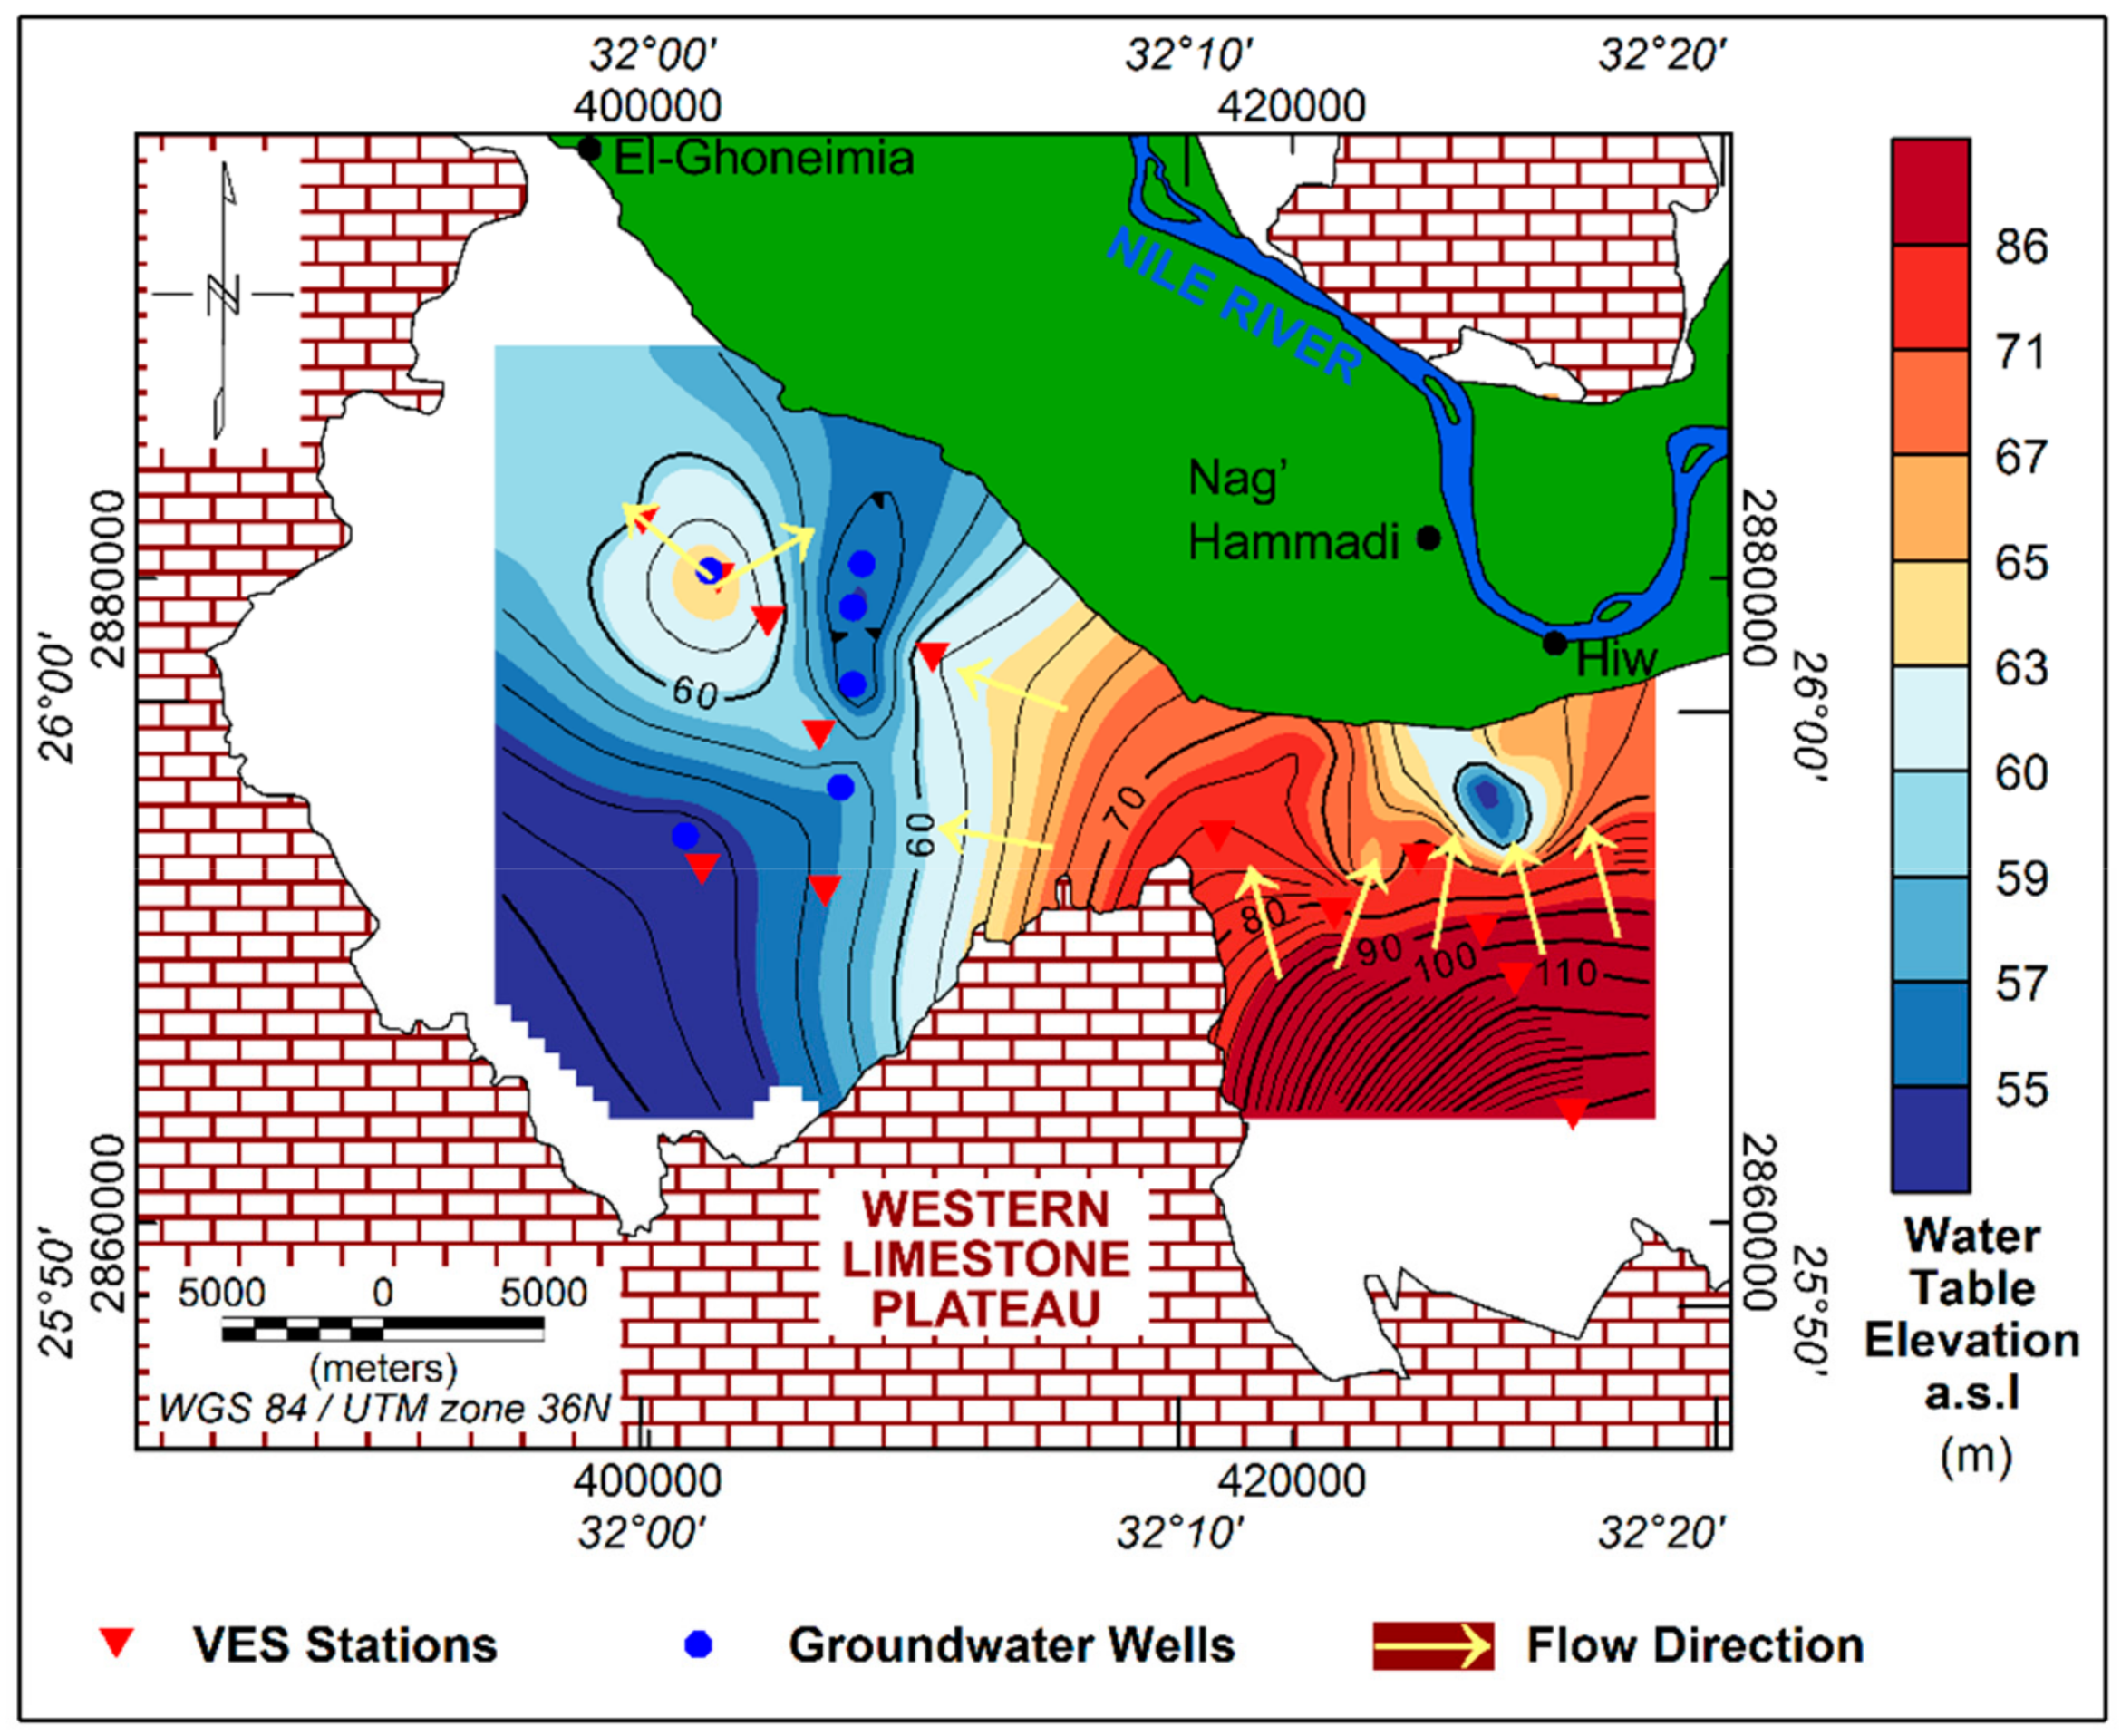
Based on the above VES results, three hydro-geophysical maps were generated using the most common ordinary kriging algorithm [76]. These maps show the variation in the water-table depth, saturated thickness, and water-table elevation of the Quaternary aquifer. The groundwater occurs at shallow depth about 20 m close to the cultivated lands and the depth increases toward the plateau to reach more than 70 m (Figure 18). The saturated thickness of the aquifer increases toward the cultivated lands to reach about 35–40 m in the eastern part and more than 43 m in the western part (Figure 19). The aquifer becomes thinner toward the plateau until it disappears. The water-table elevation decreases toward the north and west from more than 85 m to less than 55 m (Figure 20). This indicates that groundwater flows toward the Nile River following the land slope. Such obtained result is consistent with Barsom (2016) [17].
The desert zone located southwest of Nag’a Hammadi-El-Ghoneimia is the most promising for groundwater occurrence. It is characterized by very high groundwater recharge potentiality. Its potentiality is confirmed by the presence of a large saturated thickness of the Quaternary aquifer (more than 43 m), shallow water table (nearly 30 m), and this zone occupies a basin with a thick sedimentary succession (1.3 km).

5. Conclusions

The present study demonstrates the integration of remote sensing with the geoelectric resistivity and the aeromagnetic techniques as effective tools for exploring the groundwater potentiality of west Qena area. The study reveals that the old alluvial floodplain of the Nile Valley west of Qena is characterized by moderate to very high groundwater recharge potentiality from present-day and paleo-runoff in contrast to the plateau that shows poor and very poor potentialities. The alluvial desert plain zone located south and southwest of Hiw-El-Ghoneimia is characterized by very high potentiality. The old alluvial floodplain occupies a basin trending in the NW–SE direction and bounded by basement uplifts and plateau scarp. The eastern part of the basin south of Hiw Village is characterized by a major basement uplift at a depth of 0.5 km, whereas the basement depth increases toward the northwest to reach about 1.3 km west of Nag’a Hammadi and reaches more than 1.8 km west of Sohag. This reflects the increase in the groundwater potentiality toward the northwest due to the possible increase in the thickness of the groundwater-bearing sediments. The subsurface basement and surface of the plateau are affected by faults trending mainly in NW–SE direction parallel to the Nile Valley section between Qena and Asyut and the trend of the Gulf of Suez-Red Sea. The NE–SW trend, which is consistent with the Qena-Safaga Shear Zone, is less prevalent. These fault and fracture systems serve as preferential conduits for groundwater movement, recharge, and discharge. Based on the results of remote sensing together with the geoelectric resistivity and the aeromagnetic techniques, there is a good correlation between the surface and subsurface faults, especially near the plateau cliffs. They probably form conduits for groundwater movement and recharge.
There are two sandy aquifers in the study area: the shallow Quaternary and the deeper Miocene aquifer. The two aquifers are separated by a thick layer of Pliocene clays reaching about 59 m. The Quaternary aquifer is the main aquifer and has a large lateral extension throughout the study area. Its water table occurs at shallow depth about 20–30 m close to the cultivated lands and the depth increases toward the plateau to reach more than 70 m. The saturated thickness is more than 43 m near the cultivated lands and thins toward the plateau. The groundwater flow direction is toward the Nile as the water level of the Nile River is lower than the groundwater table of the Quaternary aquifer. Moreover, the aquifer occurs under unconfined condition due to its permeable Wadi deposits cover.
The desert zone located southwest of Nag’a Hammadi-El-Ghoneimia stretch is the most promising area for drilling groundwater wells. It is characterized by very high recharge potentiality and occupies a thick basin of about 1.3 km. In addition, it is characterized by a shallow water table at about 30 m depth and a saturated thickness of more than 43 m. Such zone is clearly controlled by fault systems and works as a trap for porous sediments accumulation and thus makes it a promising zone in terms of groundwater potentiality.

Author Contributions

Methodology, A.G. and A.E.; Resources, M.A.; Software, A.M.B.; Supervision, A.K.M.; Writing—review and editing, M.K. All authors have read and agreed to the published version of the manuscript.

Funding

This research received no external funding.

Acknowledgments

The authors would like to thank the USGS, JAXA, and ESA for providing the Landsat-8, ALOS/PALSAR-1 (through ALOS-2 6th RA PI-3131 agreement) and Sentinel-1 satellite images as well as SNAP software, respectively, free of charge. Finally, the authors are very grateful for the very helpful suggestions made by the three reviewers.

Conflicts of Interest

The authors declare no conflict of interest.

References

  1. FAO. Egypt AQUASTAT-FAO’s Information System on Water and Agriculture. 2016. Available online: http://www.fao.org/nr/water/aquastat/countries_regions/EGY/index.stm (accessed on 1 August 2019).
  2. El-Khawaga, A. Promoting irrigation water utilization efficiency in superior vineyards. Asian J. Crop. Sci. 2013, 5, 125–138. [Google Scholar] [CrossRef]
  3. Said, R. The Geological Evolution of the River Nile; Springer: New York, NY, USA, 1981. [Google Scholar]
  4. Patra, H.P.; Adhikari, S.K.; Kunar, S. Groundwater Prospecting and Management; Springer: Singapore, 2016. [Google Scholar]
  5. Saraf, A.K.; Choudhury, P.R. Integrated remote sensing and GIS for groundwater exploration and identifcation of artifcial recharge sites. Int. J. Remote Sens. 1998, 19, 1825–1841. [Google Scholar] [CrossRef]
  6. Shahid, S.; Nath, S.; Roy, J. Groundwater potential modelling in a sof rock area using a GIS. Int. J. Remote Sens. 2000, 21, 1919–1924. [Google Scholar] [CrossRef]
  7. Lee, S.; Kim, Y.-S.; Oh, H.-J. Application of a weights-of-evidence method and GIS to regional groundwater productivity potential mapping. J. Environ. Manag. 2012, 96, 91–105. [Google Scholar] [CrossRef] [PubMed]
  8. Shaban, A.; Khawlie, M.; Abdallah, C. Use of remote sensing and GIS to determine recharge potential zones: The case of Occidental Lebanon. Hydrogeol. J. 2006, 14, 433–443. [Google Scholar] [CrossRef]
  9. Amarsaikhan, D.; Blotevogel, H.H.; Ganzorig, M.; Moon, T.-H. Applications of remote sensing and geographic information systems for urban land-cover change studies in Mongolia. Geocarto Int. 2009, 24, 257–271. [Google Scholar] [CrossRef]
  10. Abdalla, F. Mapping of groundwater prospective zones using remote sensing and GIS techniques: A case study from the Central Eastern Desert, Egypt. J. Afr. Earth Sci. 2012, 70, 8–17. [Google Scholar] [CrossRef]
  11. Madani, A.; Niyazi, B. Groundwater potential mapping using remote sensing techniques and weights of evidence GIS model: A case study from Wadi Yalamlam basin, Makkah Province, Western Saudi Arabia. Environ. Earth Sci. 2015, 74, 5129–5142. [Google Scholar] [CrossRef]
  12. Hinze, W.J.; Frese, R.R.B.V.; Saad, A.H. Gravity and Magnetic Exploration: Principles, Practices, and Applications; Cambridge University Press: New York, NY, USA, 2013. [Google Scholar]
  13. Helaly, A.S. Assessment of groundwater potentiality using geophysical techniques in Wadi Allaqi basin, Eastern Desert, Egypt–Case study. NRIAG J. Astron. Geophys. 2017, 6, 408–421. [Google Scholar] [CrossRef] [Green Version]
  14. Ibrahim, E.; Ghazala, H.; Elawadi, E.; Alfaifi, H.; Abdelrahman, K. Structural depocenters control the Nubian sandstone aquifer, Southwestern Desert, Egypt: Inferences from aeromagnetic data. Arab. J. Geosci. 2019, 12, 335. [Google Scholar] [CrossRef]
  15. Mohamed, A.K. Application of DC resistivity method for groundwater investigation, case study at West Nile Delta, Egypt. Arab. J. Geosci. 2015, 9, 11. [Google Scholar] [CrossRef]
  16. Reynolds, J.M. An Introduction to Applied and Environmental Geophysics, 2nd ed.; Wiley-Blackwell: Hoboken, NJ, USA, 2011. [Google Scholar]
  17. Barsom, N. Remote sensing and groundwater data investigation in plain west of Nile, Qena Governorate, Egypt. In Geoelectric Methods: Theory and Applications; Bhattacharya, B., Shalivahan, S., Eds.; McGraw Hill Education: New Delhi, India, 2016; p. 147. [Google Scholar]
  18. Issawi, B.; McCauley, J. The Cenozoic rivers of Egypt: The Nile problem. In The Followers of Horus: Studies Dedicated to Michael Allen Hoffman; Egyptian Studies Association Publication, no. 2, Oxbow Monograph 20; Friedman, R., Adams, B., Eds.; Oxbow Books, Park End Place: Oxford, England, 1992; pp. 121–146. [Google Scholar]
  19. Youssef, M. Structural setting of central and south Egypt: An overview. Micropaleontology 2003, 49 (Suppl. 1), 1–13. [Google Scholar] [CrossRef]
  20. Abdelkareem, M.; El-Baz, F. Mode of formation of the Nile Gorge in northern Egypt: A study by DEM-SRTM data and GIS analysis. Geol. J. 2016, 51, 760–778. [Google Scholar] [CrossRef]
  21. Hamimi, Z.; El-Barkooky, A.; Martínez Frías, J.; Fritz, H.; Abd El-Rahman, Y. The Geology of Egypt; Springer: Berlin/Heidelberg, Germany, 2020; p. 711. ISBN 978-3-030-15265-9. [Google Scholar]
  22. El-Gamili, M.M. A geological interpretation of a part of the Nile Valley based on gravity data. Egypt J. Geol. Spec. Vol. Part 1982, 2, 101–120. [Google Scholar]
  23. Conoco. Geological Map of Egypt, Scale 1:500,000, Sheet NG36NE Quseir, NG36NW Asyut, NG36SE Gebel Hamata, and NG36SW Luxor, Egypt; The Egyptian General Petroleum Corporation: Cairo, Egypt, 1987. [Google Scholar]
  24. ElGalladi, A. Magneto-tectonic studies of the area west of Luxor, Upper Egypt. Mansoura J. Geol. Geophys. 2007, 34, 57–83. [Google Scholar]
  25. Omer, A.A. Geological, Mineralogical and Geochemical Studies on the Neogene and Quaternary Nile Basin Deposits, Qena-Assiut Stretch, Egypt. Ph.D. Thesis, South Valley University, Sohag, Egypt, 1996. [Google Scholar]
  26. Faris, M.; Allam, A.; Marzuk, A.M. Biostratigraphy of the Late Cretaceous-Early Tertiary rocks in the Nile Valley (Qena region), Egypt. Ann. Geol. Surv. Egypt. 1985, XV, 287–300. [Google Scholar]
  27. Issawi, B.; Francis, M.H.; Youssef, E.-S.A.A.; Osman, R.A. The Phanerozoic Geology of Egypt: A Geodynamic Approach, 2nd ed.; Egyptian Mineral Resources Authority (EMRA): Cairo, Egypt, 2009.
  28. Awad, M.A.; El Arabi, N.E.; Hamza, M.S. Use of solute chemistry and isotopes to identify sources of ground-water recharge in the Nile aquifer system, Upper Egypt. Groundwater 1997, 35, 223–228. [Google Scholar] [CrossRef]
  29. RIGW (Cartographer). Hydrogeological Map of Egypt (Luxor Sheet). Scale 1:500,000; ASRT: Cairo, Egypt, 1997. [Google Scholar]
  30. RIGW (Cartographer). Hydrogeological Map of Egypt (Asyut Sheet). Scale 1:500,000; ASRT: Cairo, Egypt, 1997. [Google Scholar]
  31. El Tahlawi, M.R.; Farrag, A.A.; Ahmed, S.S. Groundwater of Egypt: “an environmental overview”. Environ. Geol. 2008, 55, 639–652. [Google Scholar] [CrossRef]
  32. ESRI. ArcGIS Desktop 10.5 Help (Includes ArcMap, ArcCatalog, ArcGlobe, and ArcScene Softwares). 2016. Available online: https://www.arcgis.com/ (accessed on 1 June 2018).
  33. O’Callaghan, J.; Mark, D. The extraction of drainage networks from digital elevation data. Comput. Vis. Graph. Image Process. 1984, 28, 323–344. [Google Scholar] [CrossRef]
  34. Jenson, S.; Domingue, J. Extracting topographic structure from digital elevation data for geographic information system analysis. Photogram. Engng Remote Sens. 1988, 54, 1593–1600. [Google Scholar]
  35. Fenta, A.A.; Yasuda, H.; Shimizu, K.; Haregeweyn, N.; Woldearegay, K. Quantitative analysis and implications of drainage morphometry of the Agula watershed in the semi-arid northern Ethiopia. Appl. Water Sci. 2017, 7, 3825–3840. [Google Scholar] [CrossRef] [Green Version]
  36. Hardcastle, K.C. Photolineament Factor: A New Computer—Aided Method for Remotely Sensing the Degree to Which Bedrock Is Fractured. Photogramm. Eng. Remote Sens. 1995, 61, 739–747. [Google Scholar]
  37. ESA. Copernicus Website for Downloading Free Sentinel Data. 2019. Available online: https://scihub.copernicus.eu/dhus/#/home (accessed on 9 January 2019).
  38. USGS. EarthExplorer Website for Downloading Satellite Remote Sensing Data. 2019. Available online: https://earthexplorer.usgs.gov/ (accessed on 9 January 2019).
  39. Meijerink, A.M.J.; Bannert, D.; Batelaan, O.; Lubczynski, M.; Pointet, T. Remote Sensing Applications to Groundwater; IHP-VI Series on Groundwater; United Nations Educational Scientific and Cultural Organization (UNESCO): Paris, France, 2007; Volume 16. [Google Scholar]
  40. Deng, G.; Pinoli, J.-C. Differentiation-Based Edge Detection Using the Logarithmic Image Processing Model. J. Math. Imaging Vis. 1998, 8, 161–180. [Google Scholar] [CrossRef]
  41. Exelis. ENVI Classic 5.3 Help. 2015. Available online: https://www.harrisgeospatial.com/ (accessed on 1 January 2019).
  42. Suzen, M.L.; Toprak, V. Filtering of satellite images in geological lineament analyses: An application to a fault zone in Central Turkey. Int. J. Remote. Sens. 1998, 19, 1101–1114. [Google Scholar] [CrossRef]
  43. Chang, N.-B.; Bai, K. Multisensor Data Fusion and Machine Learning for Environmental Remote Sensing; CRC Press: Boca Raton, FL, USA, 2018. [Google Scholar]
  44. Wise, D.U.; Funiciello, R.; Parotto, M.; Salvini, F. Topographic lineament swarms: Clues to their origin from domain analysis of Italy. GSA Bull. 1985, 96, 952. [Google Scholar] [CrossRef]
  45. Sander, P. Lineaments in groundwater exploration: A review of applications and limitations. Hydrogeol. J. 2007, 15, 71–74. [Google Scholar] [CrossRef]
  46. Gaber, A.; Koch, M.; Griesh, M.H.; Sato, M. SAR Remote Sensing of Buried Faults: Implications for Groundwater Exploration in the Western Desert of Egypt. Sens. Imaging: Int. J. 2011, 12, 133–151. [Google Scholar] [CrossRef]
  47. ESA. SNAP Software (Version 5.0): Sentinel Application Platform. 2017. Available online: http://step.esa.int/main/toolboxes/snap/ (accessed on 1 May 2018).
  48. Gaber, A.; Abdelkareem, M.; Abdelsadek, I.S.; Koch, M.; El-Baz, F. Using InSAR Coherence for Investigating the Interplay of Fluvial and Aeolian Features in Arid Lands: Implications for Groundwater Potential in Egypt. Remote. Sens. 2018, 10, 832. [Google Scholar] [CrossRef] [Green Version]
  49. FAO (Cartographer). Reconnaissance soil map of the Isna-Nag Hammadi area, Egypt. Scale 1:200,000. 1961. ESDAC. Available online: https://esdac.jrc.ec.europa.eu (accessed on 13 May 2020).
  50. FAO (Cartographer). Reconnaissance soil map of the Nag Hammadi-Abu Tig area, Egypt. Scale 1:200,000. 1962; ESDAC. Available online: https://esdac.jrc.ec.europa.eu(accessed on 13 May 2020).
  51. Aero-Service. Final operational report of airborne magnetic/radiometric survey in the Eastern Desert, Egypt. In Aero-Service Division; Western Atlas International Inc.: Houston, TX, USA, 1984. [Google Scholar]
  52. Geosoft. Oasis Montaj (Version 8.4): Software for Processing and Interpretation of Potential-Field Data; Geosoft Inc.: Toronto, ON, Canada, 2015; Available online: http://www.geosoft.com (accessed on 1 October 2018).
  53. Vacquier, V.; Steenland, N.C.; Henderson, R.G.; Zietz, I. Interpretation of aeromagnetic maps. In Geological Society of America Memoirs; Geological Society of America: New York, NY, USA, 1951; Volume 47, pp. 1–150. [Google Scholar]
  54. Thompson, D.T. EULDPH: A new technique for making computer-assisted depth estimates from magnetic data. Geophysics 1982, 47, 31–37. [Google Scholar] [CrossRef]
  55. Reid, A.; Allsop, J.M.; Granser, H.; Millett, A.J.; Somerton, I.W. Magnetic interpretation in three dimensions using Euler deconvolution. Geophysics 1990, 55, 80–91. [Google Scholar] [CrossRef] [Green Version]
  56. Bobachev, A.A. IPI2Win: A Windows Software for an Automatic Interpretation of Resistivity Sounding Data. Ph.D. Thesis, Moscow State University, Moscow, Russia, 2002. [Google Scholar]
  57. Zohdy AA, R.; Eaton, G.P.; Mabey, D.R. Application of surface geophysics to ground-water investigations. In Techniques of Water-Resources Investigations; John W. Powell National Center, USGS: Reston, VA, USA, 1990; Volume 02-D1. [Google Scholar]
  58. Healy, R.W.; Scanlon, B.R. Estimating Groundwater Recharge; Cambridge University Press: New York, NY, USA, 2010. [Google Scholar]
  59. Singhal, B.B.S.; Gupta, R.P. Applied Hydrogeology of Fractured Rocks, 2nd ed.; Springer: Dordrecht, The Netherlands, 2010. [Google Scholar]
  60. RockWare. RockWorks16 Help. 2018. Available online: https://www.rockware.com/ (accessed on 1 June 2019).
  61. Waters, P.; Greenbaum, D.; Smart, P.L.; Osmaston, H. Applications of remote sensing to groundwater hydrology. Remote. Sens. Rev. 1990, 4, 223–264. [Google Scholar] [CrossRef]
  62. Ganapuram, S.; Kumar, G.V.; Krishna, I.M.; Kahya, E.; Demirel, M.C. Mapping of groundwater potential zones in the Musi basin using remote sensing data and GIS. Adv. Eng. Softw. 2009, 40, 506–518. [Google Scholar] [CrossRef]
  63. Abdelkareem, M.; El-Baz, F. Analyses of optical images and radar data reveal structural features and predict groundwater accumulations in the central Eastern Desert of Egypt. Geoscience 2015, 8, 2653–2666. [Google Scholar] [CrossRef]
  64. Moubark, K.; Abdelkareem, M.; Fakhry, M.; Barsom, N. Integration of remote sensing and hydrogeological data in the west of Qena Governorate, Egypt. In Second Young Researchers Egyptian Universities Conference (YREUC-2); South Valley University: Qena, Egypt, 2015; p. 77. [Google Scholar]
  65. Hefny, K.; Shata, A. Underground Water in Egypt; Ministry of Water Supplies and Irrigation: Cairo, Egypt, 2004; p. 295.
  66. Abdalla, F.; Moubark, K. Assessment of well performance criteria and aquifer characteristics using step-drawdown tests and hydrogeochemical data, west of Qena area, Egypt. J. Afr. Earth Sci. 2018, 138, 336–347. [Google Scholar] [CrossRef]
  67. Voogd, H. Multicriteria Evaluation for Urban and Regional Planning; Pion: London, UK, 1983. [Google Scholar]
  68. NGA. GM-SYS (Version 4.9): Gravity/Magnetic Modeling Software; Northwest Geophysical Associates Inc.: Corvallis, OR, USA, 2004; Available online: https://www.nga.com/ (accessed on 1 June 2019).
  69. Sikdar, P.K.; Chakraborty, S.; Enakshi, A.; Paul, P.K. Land use/land cover changes and groundwater potential zoning in and around Raniganj coal mining area, Bardhaman District, West Bengal–a GIS and remote sensing approach. J. Spat. Hydrol. 2004, 4, 1–24. [Google Scholar]
  70. El-Soghier, M. Gravity and Remote Sensing Investigations in the Basin West of Asyut; Egypt MSc. South Valley University: Qena Governorate, Egypt, 2017. [Google Scholar]
  71. Hussien, H.M.; Kehew, A.E.; Aggour, T.; Korany, E.; Abotalib, A.Z.; Hassanein, A.; Morsy, S. An integrated approach for identification of potential aquifer zones in structurally controlled terrain: Wadi Qena basin, Egypt. Catena 2017, 149, 73–85. [Google Scholar] [CrossRef]
  72. Ghazala, H.H.; Ibraheem, I.; Haggag, M.; Lamees, M. An integrated approach to evaluate the possibility of urban development around Sohag Governorate, Egypt, using potential field data. Arab. J. Geosci. 2018, 11, 194. [Google Scholar] [CrossRef]
  73. Telford, W.M.; Geldart, L.P.; Sheriff, R.E. Applied Geophysics, 2nd ed.; Cambridge University Press: New York, NY, USA, 1990. [Google Scholar]
  74. Mahmoud, H.; Tawfik, M.Z. Impact of the geologic setting on the groundwater using geoelectrical sounding in the area southwest of Sohag–Upper Egypt. J. Afr. Earth Sci. 2015, 104, 6–18. [Google Scholar] [CrossRef]
  75. Issawi, B.; Sallam, E.; Zaki, S.R. Lithostratigraphic and sedimentary evolution of the Kom Ombo (Garara) sub-basin, southern Egypt. Arab. J. Geosci. 2016, 9, 420. [Google Scholar] [CrossRef]
  76. Webster, R.; Oliver, M.A. Geostatistics for Environmental Scientists, 2nd ed.; John Wiley & Sons, Ltd.: Hoboken, NJ, USA, 2007; Volume 1. [Google Scholar] [CrossRef]
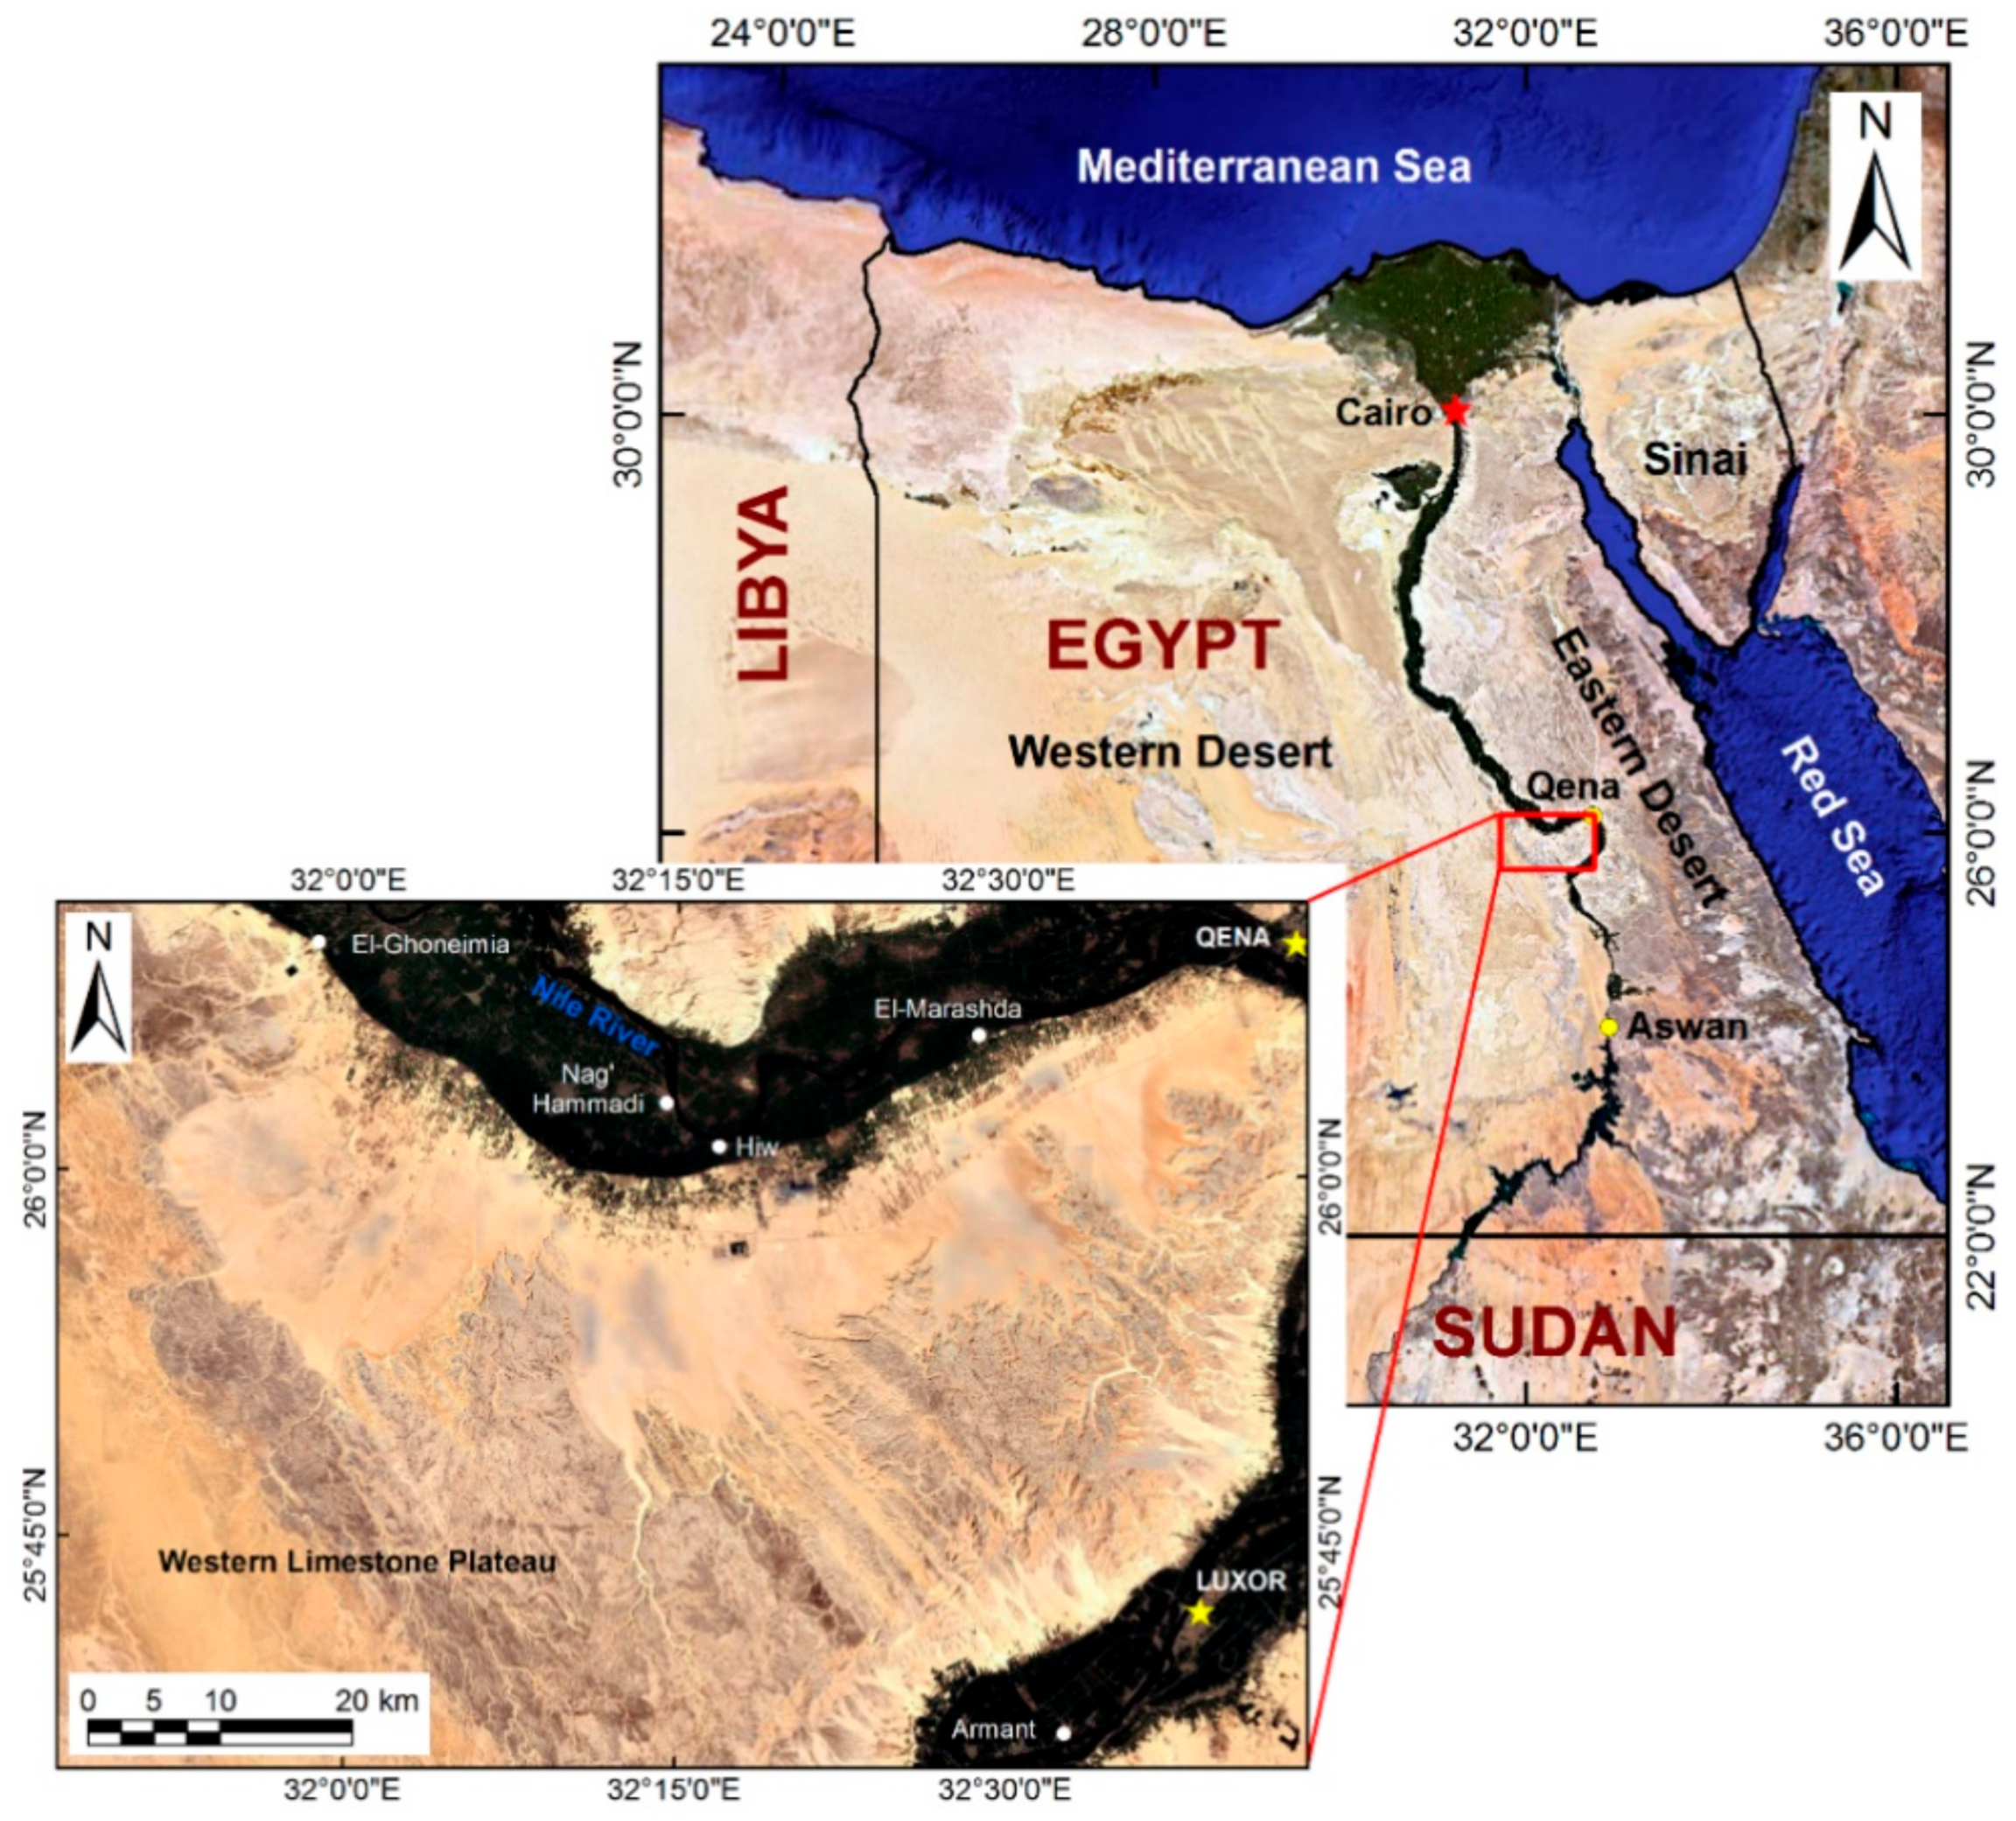
Figure 1. Location map of Egypt and West Qena area.
Remotesensing 12 01559 g001
Figure 2. Geological map of the study area (modified after CONOCO and EGPC, 1987) and a composite stratigraphic column of the Nile Valley (Said, 1981; Omer, 1996; Issawi et al., 2009). The solid green color surrounding the River Nile represents the vegetation cover.
Remotesensing 12 01559 g002
Figure 3. (a) SRTM digital elevation model (DEM); (b) surface slope; (c) watersheds and drainage channels; (d) drainage density. The solid green color surrounding the River Nile represents the vegetation cover.
Remotesensing 12 01559 g003
Figure 4. (a) Hillshaded DEM with an illumination angle of 270°; (b) Sobel-filtered Landsat-8 panchromatic band highlighting the NW–SE direction; (c) Pauli RGB image of the full-polarimetric ALOS/PALSAR-1 image; (d) Sentinel-1 InSAR coherence image.
Remotesensing 12 01559 g004
Figure 5. (a) Extracted surface lineaments from remote sensing data; (b) lineament density. The solid green color surrounding the River Nile represents the vegetation cover.
Remotesensing 12 01559 g005
Figure 6. (a) TRMM rainfall in the period (1998–2009); (b) surface soils. The solid green color surrounding the River Nile represents the vegetation cover.
Remotesensing 12 01559 g006
Figure 7. (a) Total magnetic intensity (TMI) anomaly map; (b) reduced-to-pole (RTP) anomaly map.
Remotesensing 12 01559 g007
Figure 8. (a) Second vertical derivative (SVD) of the RTP anomaly; (b) Euler deconvolution solutions plotted on the SVD map.
Remotesensing 12 01559 g008
Figure 9. Location map of the vertical electrical sounding (VES) measurements and some groundwater wells in the study area.
Remotesensing 12 01559 g009
Figure 10. Selective examples of the processed VES field curves.
Remotesensing 12 01559 g010
Figure 11. GPR profiles collected in the alluvial floodplain of the study area to confirm the remote sensing results and mapping any shallow lineaments if present. No lineaments were detected.
Remotesensing 12 01559 g011
Figure 12. Thematic layers of the different factors influencing groundwater recharge potentiality.
Remotesensing 12 01559 g012
Figure 13. Groundwater recharge potentiality map of the study area (red boundary) inferred from remote sensing data and GIS modeling.
Remotesensing 12 01559 g013
Figure 14. Basement structural map inferred from the interpretation of aeromagnetic data.
Remotesensing 12 01559 g014
Figure 15. Selective examples of the basement 2D models (left) and depth-to-basement map of the study area (right).
Remotesensing 12 01559 g015
Figure 16. Calibration of the 1D model at VES-2 with the lithological log of Well-1.
Remotesensing 12 01559 g016
Figure 17. Selective cross-sections show the lateral distribution of the different geoelectric layers.
Remotesensing 12 01559 g017
Figure 18. Depth to water contour map inferred from VES data.
Remotesensing 12 01559 g018
Figure 19. Saturated thickness of the Quaternary aquifer (Layer B) inferred from VES data.
Remotesensing 12 01559 g019
Figure 20. Water-table elevation inferred from VES data.
Remotesensing 12 01559 g020
Table 1. Summary of geoelectric layers and their inferred lithology and hydrogeology.
LayerResistivity, ρ (Ω.m)Thickness, h (m)Equivalent Lithology and Hydrogeology
A95.9–98801.07–7.25Surface wadi deposits made up mainly of sand and gravel (dry);
The low values attribute to agricultural soil that made up of a mixture of moist sand, silt, and clay.
B1108–32115.6–40.5Coarse sand (dry)
262.9–78.66.23–59Coarse sand (water-bearing)
C16.7–5411.5–58.9Clay
D288–863UnknownCoarse sand (dry)
E8967–16,877UnknownMassive limestone