Abstract
Understanding trends in vegetation phenology and growing season productivity at a regional scale is important for global change studies, particularly as linkages can be made between climate shifts and the vegetation’s potential to sequester or release carbon into the atmosphere. Trends and geographic patterns of change in vegetation growth and phenology from the MODerate resolution Imaging Spectroradiometer (MODIS) satellite data sets were analyzed for the state of Alaska over the period 2000 to 2018. Phenology metrics derived from the MODIS Normalized Difference Vegetation Index (NDVI) time-series at 250 m resolution tracked changes in the total integrated greenness cover (TIN), maximum annual NDVI (MAXN), and start of the season timing (SOST) date over the past two decades. SOST trends showed significantly earlier seasonal vegetation greening (at more than one day per year) across the northeastern Brooks Range Mountains, on the Yukon-Kuskokwim coastal plain, and in the southern coastal areas of Alaska. TIN and MAXN have increased significantly across the western Arctic Coastal Plain and within the perimeters of most large wildfires of the Interior boreal region that burned since the year 2000, whereas TIN and MAXN have decreased notably in watersheds of Bristol Bay and in the Cook Inlet lowlands of southwestern Alaska, in the same regions where earlier-trending SOST was also detected. Mapping results from this MODIS time-series analysis have identified a new database of localized study locations across Alaska where vegetation phenology has recently shifted notably, and where land cover types and ecosystem processes could be changing rapidly.
1. Introduction
Recent studies have shown that many regions of Alaska are experiencing a high level of inter-annual variability in the seasonality of vegetation growth [1,2,3]. For example, the northern and interior Brooks Range Mountains have experienced the greatest year-to-year variation in snowmelt timing dates of any sub-region of Alaska over the past 20 years [4]. Farther north, the date of spring ground thaw occurred eight days earlier and the length of the vegetation growing season was shown to be 11 days longer on the Arctic Coastal Plain in 2013 compared to the 1970s [5].
High magnitudes of inter-annual variability in springtime snow-free conditions may be having strong impacts on many aspects of ecosystem functioning [6], including the dynamics of Alaskan wildlife populations [7] and on the area of tundra severely burned each year by wildfires [8]. Over the past 30 years, the expansion of woody shrub cover in northern Alaska has been reported from both remote sensing and field studies [9,10,11,12,13]. In some boreal forest sub-regions of the state, evergreen tree cover has decreased, while deciduous tree cover has increased, along with the expansion of shrub and herbaceous vegetation above tree lines [13], patterns which have been confirmed by field measurements of shrub encroachment and greening trends [12].
Satellite remote sensing of land-surface phenology can be used to characterize large-scale variations in the vegetation growing season from one year to the next [14,15]. Across Alaska, integrated monthly “greening”, observed as positive trends in the satellite-derived normalized difference vegetation index (NDVI), can indicate increased ecosystem productivity and/or higher seasonal density of vegetation cover, while negative integrated NDVI trends or “browning” have been construed as reduced productivity in vegetation cover due to wildfire, insect damage, drought stress, and/or thawing permafrost [8,16,17,18,19,20,21].
The time-integrated NDVI (TIN) phenology metric [22] can be treated as a measure of seasonal plant growth because it represents the daily interpolation of green cover detected by the MODIS satellite sensors above the baseline for the entire duration of the growing season. As such, shifts in TIN can serve as proxies for change in annual primary productivity of an ecosystem from year to year [23,24,25,26]. Moreover, tundra vegetation biomass (shrubs, forbs, graminoids, lichens, and mosses) in northern Alaska has been found to correlate closely (R2 = 0.8) and increase exponentially with maximum summer NDVI (MAXN) [27]. Comparison of TIN to the MAXN level can reveal important attributes of a seasonal growth curve.
The start of the season timing (SOST) date can serve as a proxy for the early-season initiation of vegetation growth in relation to snow-free conditions and thawing of rooting zone active layers [28]. Satellite data analyses have shown significant and widespread advances of SOST over the northern hemisphere during the 1980s and 1990s, trends which were associated with strong springtime air temperature warming over these decades [29,30]. The ongoing advance in SOST in Alaska has been among the highest in the northern latitude zones, averaging greater than three days per decade [31].
In this study, we combined time-series analysis results for the SOST, TIN, and MAXN metrics from the full 19 year Moderate Resolution Imaging Spectroradiometer (MODIS) NDVI phenology record [22] to test the hypothesis that recent vegetation responses to inter-annual variability in springtime snowmelt dynamics and growing season temperatures in Alaska are highly dependent on regional land cover types. Specifically, such responses may be related to different physiological adjustments to local climate and to elevation in boreal forests versus tundra shrub/tussock communities. Digital maps of large wildfire perimeters for Alaska [32] were overlaid on the MODIS time-series results to separate the effects of vegetation burning from all other factors of change in the NDVI metrics.
2. Methods
2.1. MODIS Vegetation Index and Phenology Metrics
NASA’s MODIS (Moderate Resolution Imaging Spectroradiometer) satellite sensors Terra and Aqua have been used to generate a 250 m resolution NDVI (MOD13) global product on 16 day intervals since the year 2000 [33,34]. The MODIS Collection 6 [35] NDVI data set provides consistent spatial and temporal profiles of vegetation canopy greenness according to the equation:
where NIR is the near-infrared reflectance of wavelengths from 841–876 nm and Red is the reflectance from 620–670 nm, with values scaled to between −1.0 and 1.0 units. Low values of NDVI (near 0.1) indicate barren land cover, whereas high values of NDVI (above 0.8) indicate dense canopy greenness cover. The MOD13 250 m vegetation indices (VIs) have been retrieved from daily, atmosphere-corrected, bidirectional surface reflectance (available at modis.gsfc.nasa.gov/data/dataprod/mod13.php).
NDVI = (NIR – Red) / (NIR + Red)
For this study, we used the data set from Zhu et al. [22] who produced numerous phenology metric products for the state of Alaska from MOD13 NDVI data sets, spanning the years 2000 to 2018. Zhu et al. [22] used the seven-day interval eMODIS data set developed by Reed et al. [36] and the MODIS Quality Layer for calculation of NDVI phenology metrics. In the time series of the pixels, only “good” (cloud free) = 0 and “snow” = 4 data are retained; all other values are interpolated or replaced. The phenology metric algorithms then stack these quality-checked layers into a multiple-band data set, then interpolate and smooth the data using a weighted-least-square algorithm on the interpolated time series.
In areas where relatively low levels of annual TIN have been consistently associated with relatively high levels of MAXN, there is a high probability that vegetation cover has experienced growth limitations or stresses of some kind during a considerable portion of the growing season [37]. Under this assumption, a relatively low ratio value (less than 50:1) of annual TIN to annual MAXN results would indicate greater overall growth stress for the vegetation at a given location.
2.2. Sub-Regions, Land Cover, and Elevation Map Layers
The MLRA (Major Land Resource Areas; [38]) product was used to delineate major sub-regions of the Brooks Range Mountains in northern Alaska. Digital elevation (in vertical meters) was derived from United States Geologic Survey (USGS) mapping at 300 m ground resolution. Vegetation cover types were mapped for the state at 30 m ground resolution from the 2011 National Land Cover Dataset (NLCD) of Alaska [39,40] (available at www.mrlc.gov/nlcd11_leg.php). Large river basin boundaries and sub-basin names for the study area were obtained from the USGS hydrologic unit database [41].
2.3. Statistical Analysis Methods
Time-series analysis of MODIS annual NDVI phenology metrics over the period 2000 to 2018 was carried out using TrendRaster algorithms developed by Forkel et al. [42]. The significance level (p value) and slope of the trend for each MODIS NDVI time series was estimated by the Mann–Kendall (M-K) nonparametric test [43] using the TrendRaster function of the “green-brown” R software package [44]. The M-K test analyzes the difference in signs between earlier and later data values in a time series. If a trend is present, the sign values will tend to consistently increase or decrease. Every data value is compared to every value preceding it in the time series, which gives a total of n × (n–1) / 2 pairs of data, where “n” is the number of observations in the set. This nonparametric test is applicable for data sets that do not meet the assumption of normality.
For localized correlation analysis between annual SOST and TIN values, we applied a 7 × 7 MODIS pixel (3 km2) moving window linear regression model. This was justified as the smallest local area over which an adequate number of MODIS pixels (N = 49) would be included in the correlation coefficient determination. For regional-scale linear regressions of SOST or TIN values with elevation or forest cover, we expanded the moving window to a 51 × 51 MODIS pixel (162 km2) area in order to realistically capture the scale of mountainous topography and natural variations in vegetation classes in Alaska.
3. Results
3.1. Start of the Growing Season Date
We found that trends in the SOST over the period of 2000 to 2018 showed significantly (p < 0.05) earlier seasonal vegetation greening (at more than one day per year) across sections of the northeastern region of the Brooks Range Mountains into the Richardson Mountains and Mackenzie River Delta of Canada, on the Yukon-Kuskokwim coastal plain, and most notably in the Ahklun Mountains across to Bristol Bay and the Cook Inlet lowlands in the southern coastal areas (Figure 1a,b). Conversely, a trend of significantly later vegetation greening (at more than one day per year) was detected mainly within areas burned by wildfires since 1999 in the Yukon-Kuskokwim and Interior Alaska Highlands. Notable areas outside of fire boundaries that showed significantly later vegetation greening since the year 2000 were detected in the Porcupine River, Tanana River, and Lower Kuskokwim River valleys.
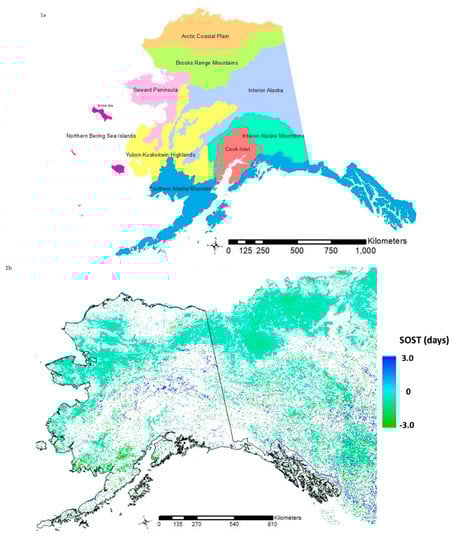
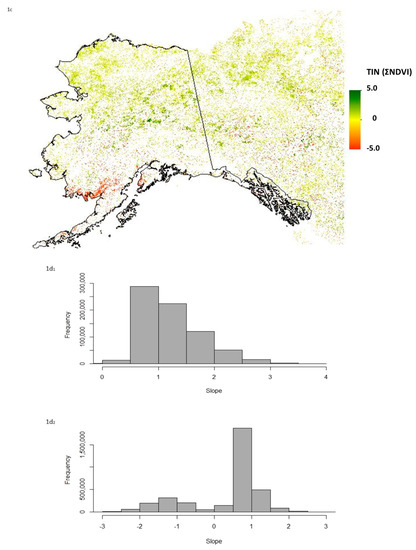
Figure 1.
Trends in Normalized Difference Vegetation Index (NDVI) phenology metrics indicate greening in boreal and arctic regions of Alaska. (a) Major land regions of the state (after Kautz, 2004); (b) trends in start of the season timing (SOST) date over the years 2000 to 2018, filtered to show significant (p < 0.1) increases or decreases; (c) trends in time-integrated NDVI (TIN) over the years 2000 to 2018, filtered to show significantly (p < 0.1) increasing or decreasing greenness cover; (d) two histograms of significant TIN trends from 2000 to 2018, separated for burned (since 2000) and unburned locations: (d1) Within fire boundaries and (d2) outside of fire boundaries.
3.2. Growing Season Green Vegetation Cover
Trends in both TIN (Figure 1c) and MAXN (map not shown) over the period of 2000 to 2018 were similar, and both showed the same significantly (p < 0.05) increasing summer vegetation greening in nearly all boreal forest areas burned by wildfires in the Interior Alaska and Yukon-Kuskokwim Highlands (Figure 1d), commonly at rates of greater than TIN = +0.5 units per year. Outside of wildfire boundaries, equivalent vegetation greening rates and distribution were detected in unburned lowland areas of the Seward Peninsula, the Noatak, Colville, Kobuk, Chandalar, and Sheenjek River valleys, and across much of the Arctic Coastal Plain.
In contrast, there was a notable collection of unburned locations (as indicated in Figure 1d) with significantly (p < 0.05) decreasing TIN and MAXN trends over the period of 2000 to 2018, mainly detected in the Ahklun Mountains, from the watersheds of Bristol Bay southward along the Alaska Peninsula, and in the Cook Inlet lowlands of southwestern Alaska, in the same regions where earlier-trending SOST was also detected. There were also isolated areas of decreasing TIN and MAXN detected in the Yukon Flats and the Koyukuk Flats of the Interior Alaska Lowlands that showed no recent (since 1999) records of large wildfires.
We found that a high negative correlation between SOST and TIN in any given year was most frequently detected on the Arctic Coastal Plain, in the southern Brooks Range Mountains, the Interior Alaska Mountain Range, and the Ahklun Mountains, commonly below 1500 m elevation (Figure 2a), indicating that an earlier start of the growing season resulted in higher seasonal green cover and plant production. Conversely, locations where a relatively late start of the growing season resulted in higher integrated green cover were most frequently detected in the northern Brooks Range Mountains above 1500 m elevation, in the Tanana River valley, the Yukon-Kuskokwim highlands, the Cook Inlet lowlands, on the Alaska Peninsula, and along the Gulf of Alaska Coast. The variability from year to year in the correlation between SOST and TIN was lowest across the Brooks Range Mountains and other mountainous areas above elevations of 1500 m (Figure 2b). Elevation explained more than half of the geographic variation (based on a 162 km2 moving window) in the mean correlation between annual SOST and TIN over just 5.1% of the Alaskan vegetated land area (Figure 2c), whereas forest cover explained more than half of the geographic variation in the mean correlation between annual SOST and TIN over only 2.4% of the Alaskan vegetated land area (Figure 2d). Any positive associations shown in Figure 2c,d indicated that the higher the elevation or forest cover, the stronger the correlation between annual SOST and TIN in this area, whereas any negative associations shown in Figure 2c,d indicated that the higher the elevation or forest cover, the weaker the correlation between annual SOST and TIN in this area.
Figure 2.
Correlations between the start of the season date and integrated summer green cover show differing regional patterns. (a) Map of the mean localized correlation value of annual SOST and TIN over the years 2000 to 2018, showing areas in red shades where an earlier start of the growing season resulted in higher seasonal green cover. This localized correlation result was based on a 7 × 7 Moderate Resolution Imaging Spectroradiometer (MODIS) pixel (3 km2) moving window linear regression model; (b) map of the standard deviation of the mean localized correlation of annual SOST and TIN, showing areas in blue shades with the highest interannual variation in this relationship over the years 2000 to 2018; (c) locations where elevation and (d) where forest cover (respectively) accounted for greater than 50% of the geographic variation in the mean correlation between SOST and TIN over the years 2000 to 2018, based on a regional-scale (51 × 51 MODIS pixels; 162 km2) moving window linear regression. Blue pixels indicated areas where either elevation or forest cover positively accounted for geographic variation (at spatial R2 > 0.5), whereas red pixels indicated areas where either elevation or forest cover negatively accounted for a high fraction (> 50%) of the geographic variation in the association between annual SOST and TIN.
3.3. Vegetation Growth Stress Index
Regions where the MODIS phenology stress index was pronounced (annual TIN:MAXN ratio was consistently lowest at less than 35:1) were identified in the northern Brooks Range Mountains, on the Arctic Coastal Plain, and from the central Yukon-Kuskokwim Highlands southward to the Bristol Bay drainages and along the Alaska Peninsula (Figure 3a). The locations where this stress index was less pronounced (annual TIN:MAXN ratio was relatively high at greater than or equal to 70:1) were most frequently detected in the Seward Peninsula and the Kobuk River Valley. Regions detected with the lowest year-to-year variability in the TIN:MAXN ratio included the lowlands of the Yukon Flats and the Cook Inlet, whereas the Nushagak River drainages into Bristol Bay showed the highest year-to-year variability in the TIN:MAXN ratio (Figure 3b). Elevation explained more than half of the geographic variation in the annual TIN:MAXN ratio in areas of the Seward Peninsula highlands, the southern Brooks Range Mountains, and the Cook Inlet Mountains (Figure 3c), whereas forest cover explained a negligible portion of the geographic variation in the annual TIN:MAXN ratio statewide.
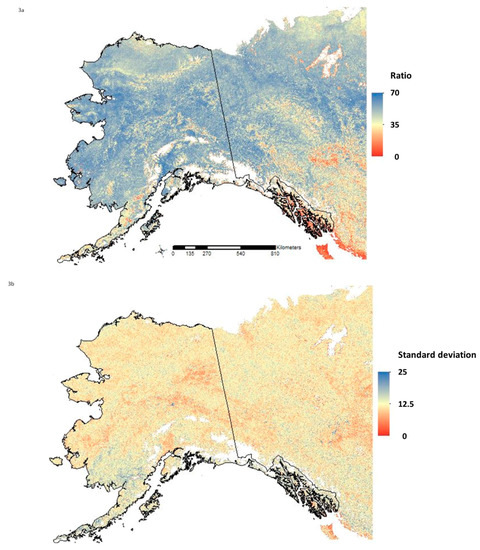
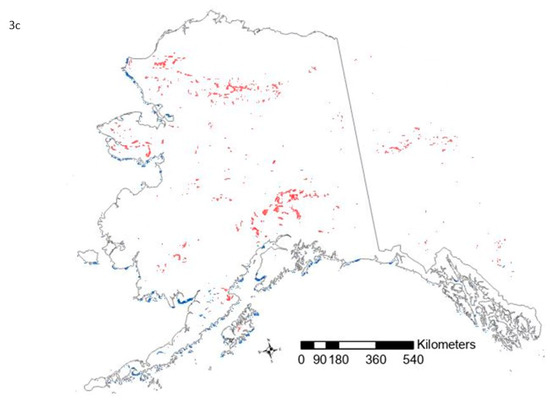
Figure 3.
The ratio of integrated summer green cover and maximum seasonal greenness show differing regional patterns in plant growth limitations. (a) Map of the mean ratio of annual TIN and maximum annual NDVI (MAXN) metrics over the years 2000 to 2018; (b) map of the standard deviation of the mean ratio of annual TIN and MAXN metrics, showing areas in blue shades with the highest interannual variation in this relationship over the years 2000 to 2018; (c) locations where elevation accounted for greater than 50% of the geographic variation in the mean ratio of annual TIN and MAXN metrics over the years 2000 to 2018, based on a regional-scale (51 × 51 MODIS pixel; 162 km2) moving window linear regression (at spatial R2 > 0.5). Blue pixels indicated areas where elevation positively accounted for geographic variation (the lower the elevation, the lower the TIN:MAXN ratio), whereas red pixels indicated areas where elevation negatively accounted for a high fraction (> 50%) of the geographic variation in the ratio of annual TIN and MAXN.
3.4. Regional Case Study Locations
Surface air temperatures in northern Alaska have increased rapidly during the past several decades, according to recent field studies in the Colville and Chandler River basins of the Arctic Coastal Plain [45,46], and have resulted in site measurements of increased of plant productivity and expansion of arctic shrub cover. Consequently, areas of the Colville River around Kikak Creek (69.76°N, −151.52°W) extending south into the Lower Chandler River basin were examined more closely here as a case study of tundra greening trends (increasing TIN) in this region (Figure 4a). Patterns of recent vegetation greening across this landscape were highest in tundra shrubland and mixed herbaceous wetland cover along the western banks of the Colville River. The trend in vegetation greening at a representative tundra shrubland location in the Colville River drainage showed the strongest increases in TIN between 2008 and 2017, and predominantly in years with the earliest SOST date, namely 2011, 2015, and 2016 (Figure 5a). After 2012, monthly air temperatures recorded at the closest weather station in the region have showed steady increases in the winter minima of +10 °C and in the summer maxima of around + 5 °C by 2017. Monthly precipitation totals in the region have been trending above the long-term average since 2013.
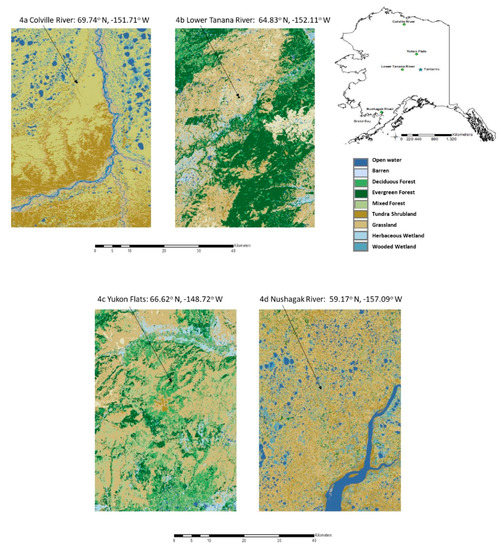
Figure 4.
Land cover maps for four different regions where significant greening or browning trends from MODIS TIN were detected since the year 2000. (a) Tundra greening near Colville River on the Arctic Coastal Plain; (b) woody wetland greening in the Lower Tanana River drainage; (c) woody wetland browning in the Yukon Flats sub-region; (d) shrubland and herbaceous wetland browning in the Nushagak River drainage.
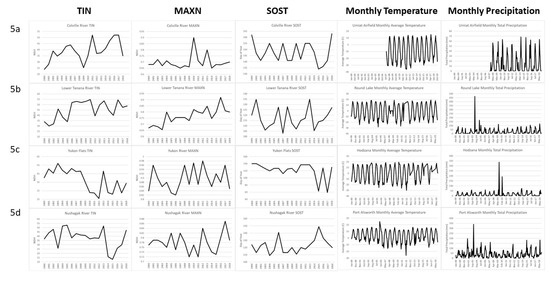
Figure 5.
Time-series plots of annual MODIS phenology metrics and monthly climate variations show strong greening or browning trends since the year 2000. (a) Tundra greening near Colville River with monthly average temperature and total precipitation records from the Umiat Airfield station (69.37°, −152.13°); (b) woody wetland greening in the Lower Tanana River drainage with monthly average climate records from the Round Lake station (64.68°, −153.93°); (c) woody wetland browning in the Yukon Flats sub-region with monthly average climate records from the Hodzana station (66.73°, −148.66°); (d) shrubland and herbaceous wetland browning in the Nushagak River drainage with monthly average climate records from the Port Alsworth station (60.18°, −154.32°); all climate station data were downloaded in February 2020 from the Western Regional Climate Center online data lister, available at https://wrcc.dri.edu/.
Vegetation greening trends in the boreal region of interior Alaska were also detected in unburned (since the year 2000) mixed woodland and herbaceous wetland covered landscapes of the Lower Tanana River basin (Figure 4b). Both TIN and MAXN have shown steady increases over the past two decades at the representative location shown in Figure 5b, and monthly air temperatures recorded at the closest weather station have showed steady increases in the winter minima, from around −23 °C prior to 2012 to winter minima commonly above −20 °C since 2013. As in the Colville River example, precipitation totals have been trending at or above the long-term average since 2013.
Conversely, significant vegetation browning trends in the Yukon Flats sub-region outside of any recently burned areas were detected in boreal forest stands of the Hodzana River drainage (Figure 4c). The TIN at this representative browning location declined rapidly starting in 2009 and has not recovered to early 2000s TIN levels, despite periodic increases in MAXN (Figure 5c). Several recent years (2015 and 2017) of extremely early SOST dates have occurred in this area, which were accompanied by increases in winter minima air temperatures, from lower than −25 °C prior to 2012 to winter minima commonly warmer than −20 °C since 2013. There have been repeated extremely dry seasons over the years 2010 to 2018 in the Yukon Flats sub-region as well, which may have contributed to declining surface moisture conditions over the past decade.
Because of the extensive NDVI phenology trends toward significantly lower TIN levels and an earlier SOST across the largest watersheds of Bristol Bay (Figure 1), the Nushagak River basin was examined further as a vegetation browning case study. Along with the Kvichak River, the Nushagak River is one of the most productive sockeye salmon (Oncorhynchus nerka) systems in the world and supports the third largest king salmon (Oncorhynchus tshawytscha) run in the world [47]. These drainages are covered by mixed forests, tundra, lakes, and marshlands. White spruce (Picea glauca) and mixed spruce–birch (Betula papyrifera) forests, as well as muskeg and willow-alder (Salix and Alnus spp.) thickets, grow up to 300 m in elevation. At lower elevations, wet tundra or marshland is common (as shown in Figure 4d), and a large tidal marsh exists at the mouth of the Nushagak River.
Starting in 2014, significant vegetation browning trends (in both TIN and MAXN) were detected at a representative mixed tundra–wetland location in the Kvichak sub-basin of the Nushagak River drainage, outside of any recently burned areas (Figure 5d). After 2011, monthly air temperatures recorded at the closest weather station showed an abrupt increase in winter minima temperatures of up to +10 °C and in summer maxima of around +4 °C. Monthly precipitation totals in the region have been trending slightly above the long-term average since 2014.
4. Discussion
Our results from new time-series analysis of nearly 20 years of MODIS phenology metrics can be best interpreted in light of published field studies of vegetation change across all of Alaska. For instance, patterns of localized SOST–TIN correlations revealed in this study were shown to be broadly consistent with the findings of Raynolds et al. [48], who reported that lowland locations of the Brooks Range Mountains showed significant positive TIN trends, despite a delayed start to the yearly green-up period in some years, while more upland locations were detected with a significant negative TIN trend. These relationships were supported by observations that increasing green vegetation cover in this region of Alaska’s arctic tundra was due mainly to changes in hydrology and nutrient availability, namely as a result of thawing of ice-rich permafrost in the greening areas. The causes for decreases in seasonal NDVI in small patches have been linked to localized disturbance events, such as erosion and thermokarst (Raynolds et al., [48]).
Warming and snow drift manipulation experiments at Toolik Lake (Alaska) in the lowland (900 m elevation) Kuparuk River basin of the northern Brooks Range foothills have shown that growth of many arctic plants has increased with both temperature warming and snow cover [49]. This relationship may be the result of deeper snow packs that can provide additional soil moisture during the warm summer months and the effect of later snow melt, pushing rapid plant growth into warmer periods. At the same study sites, Wahren et al. [50] found that snow additions had an important effect on microclimate by insulating vegetation from winter wind and temperature extremes, modifying winter soil temperatures and increasing spring run-off. The MODIS NDVI phenology–climate associations taken together from our current study results likewise imply that tundra greening in northern Alaska has been enhanced by longer, warmer growing seasons and sustained surface moisture conditions over the past decade (2008 to 2018). Gonsamo et al. [51] examined several satellite datasets (MODIS NDVI included) to study the influence of spring plant growth on summer soil moisture content at a northern Canada tundra–taiga interface. Their results suggested that higher vegetation growth in spring leads to deceased summer soil moisture and greenness. It is not yet clear whether the observations of NDVI variations in this more easterly part of North America are indicative of those in the tundra ecoregions of Alaska as well.
Across Yukon River sub-basins of interior Alaska, Potter [52] has reported significant vegetation greening trends outside of recent burned areas from MODIS NDVI monthly time-series analysis, most notably in the Yukon Flats National Wildlife Refuge and in the Susulanta Hills sub-basin of the Nowitna River drainages. These NDVI slope lines had significant (p < 0.05) deseasonalized greening trends over the period 2000 to 2018. Greening land cover for both of these sub-regions was predominantly shrubland with scattered coverage of wooded wetlands. It was hypothesized in this study that temperature warming has generally enhanced the rates of shrubland and young woodland vegetation growth across most of interior Alaska over the past 20 years. In support of this hypothesis, evidence of shrub (alder, birch, and willow) expansion over the last half century has been documented through repeat photography of the past 50 years in Alaska (Tape et al. [10]).
The results from the remote sensing studies by Potter [52,53] for large areas burned by wildfires across all of Alaska clearly showed that the NDVI will commonly recover to pre-burn levels in less than 10 years, based on trends for deseasonalized greening from MODIS 250 m resolution data sets. Findings from these studies of greenness recovery in Alaska following high-severity burns support the supposition that vegetation cover density in these ecosystems, albeit possibly with a higher fraction of annual herbaceous cover than was present before the fire, will make a nearly complete recovery often within five years post-fire. Later (SOST) seasonal greening in severely burned areas could be due to a shift to sparser coverage of evergreen forest vegetation types in the boreal ecoregion, but that is not yet widely verified with recent field observations.
Putting our notable MODIS vegetation browning results reported for the first time for the Southern Alaska Mountains region into a broader eco-geographic field context, the region around Bristol Bay has experienced warming winters and more rain than snow over the past years, leading to rising water tables [54]. In watersheds like the Nushagak River basin that drain into Bristol Bay, erosion is accelerating and occurs primarily through “slump blocking,” in which unconsolidated sediments from windblown glacial deposits are carried by runoff cutting into riverbanks [52]. More extreme freeze–thaw cycles and accelerated surface runoff can promote landslides, which further erode the soils and sediments.
Spruce beetle outbreaks have become widespread across southwestern Alaska and Cook Inlet forests, and have been linked to the development of warmer, longer summers, compared to historic average conditions [55,56]. Warmer winters can increase the survival rate of spruce beetle populations, particularly in ecosystems located above the snow line [57]. These insect outbreaks may be an associated indicator of increasing stress on many diverse vegetation communities in southwestern Alaska and the Cook Inlet region, especially during the warmest periods of the year. In the lowlands of the western Kenai Peninsula on the Cook Inlet, Berg et al. [58] have reported accelerating invasion of woody vegetation into wetlands. Historical aerial photography for 11 wetland sites showed that herbaceous areas have contracted significantly. Peatlands in this ecoregion have become dry enough to host black spruce only since the 1850s, and abundant shrubs only since the 1970s.
In studies at the western end of the Chugach–St. Elias Mountains ecoregion near Anchorage, Dial et al. [59] reported that tall shrub cover has increased substantially above 600 m elevation to about 750 m, mostly due to the recruitment of tall willows that were absent in 1972. These authors further postulated that rapid upward advance of woody vegetation may be contributing to regional declines in Dall’s sheep (Ovis dalli) populations. Taller shrubs may have shifted upward into formerly wet meadows, reducing abundance of food plants for sheep.
For future remote sensing studies of greening trends, it is worth noting that, in a review of high-latitude NDVI studies, Myers-Smith et al. [60] have cautioned that trends in NDVI data produced from different satellite sensors or using different composting methods do not always correspond at a given location. Therefore, it remains challenging in some regions of the Arctic to distinguish between true ecological change and differences due to satellite sensor and platform-related issues when interpreting localized greening or browning trends. More to this point for arctic Alaska, Pattison et al. [61] have postulated that Advanced Very-High-Resolution Radiometer (AVHRR) satellite data (at 1 km to several-kilometer resolution) may be demonstrating increasing trends in NDVI that are not occurring on the ground in tundra ecosystems of northeastern Alaska. We have used MODIS phenology metrics instead for this study, for which similar biases to those found in AVHRR data sets have yet to be reported widely.
There has been a recognition of uncertainties in estimation of the SOST index from satellite image data in arctic and boreal ecoregions of the world as well. These sources of uncertainty are mainly due to the presence of snow that can significantly affect the NDVI signal (Sekhon et al. [62]) and to difficulties in capturing seasonal variation in canopy greenness of evergreen vegetation cover (Jin et al. [63]). Using an improved physically-based plant phenology index (PPI) with a nearly linear relationship to green leaf area index (LAI), it was reported by Karkauskaite et al. [64] that PPI SOST preceded NDVI SOST by several days in most high-latitude shrublands and herbaceous cover, where the strongest trends in earlier SOST for Alaska were detected in the MODIS data we have presented in this study (Figure 1b). For boreal (needleleaf) forest cover areas, Karkauskaite et al. [64] reported that PPI SOST was generally detected later than NDVI SOST by 7–16 days, suggesting that the trends toward later SOST shown in our Figure 1b across Interior Alaska boreal cover may be underestimating this change in the onset of the growing season over the past two decades.
5. Conclusions
The evidence presented in this study supported our hypothesis that recent vegetation responses to inter-annual variability in springtime snowmelt dynamics and growing season temperatures in Alaska are, in certain ways, dependent on regional land cover types. Strong trends in SOST and TIN were associated with localized climate variations, such as rising winter temperature minima, in both northern and southern tundra regions of Alaska, but not as strongly related to merely elevation gradients or to forest versus tundra cover types. The findings in this study will help guide future research plans aimed at explaining localized changes in land cover and vegetation community responses to changing climate conditions in Alaska. At the statewide scale, regions were identified with extensive trends in earlier seasonal vegetation greening, such as the northeastern Brooks Range Mountains and in the southern coastal areas of Alaska, and with increasing growing season integrated production, such as across the western Arctic Coastal Plain and within the perimeters of most large wildfires of the Interior boreal region that burned since the year 2000. In other regions, growing season integrated production has decreased notably, particularly in watersheds of Bristol Bay and in the Cook Inlet lowlands of southwestern Alaska, in most of the same areas where an earlier-trending start of the growing season was also detected. If changes in vegetation cover types (from forest to shrubland or from wetland to grassland) have been occurring in the areas where the strongest trends in MODIS phenology metrics coincide with air temperature warming patterns, then imagery from higher-resolution remote sensing can be used to document these cover changes. There may be numerous cryptic impacts on the arctic and boreal landscapes of Alaska indicated by abrupt decreases in NDVI phenology metrics, such as insect damage, drought stress, thawing permafrost, erosion, and thermokarst events. The trend maps provided from the time-series analysis of this study can narrow the vast expanses of the Alaskan wilderness to a manageable set of local study locations where phenology has already recently shifted most notably.
Author Contributions
C.P. designed the study. C.P. and O.A. processed the data, analyzed the results, prepared display items, and wrote the manuscript. All authors have read and agreed to the published version of the manuscript.
Funding
This research received no external funding
Acknowledgments
This work was supported by the Ames Research Center and the NASA Terrestrial Ecology program as a contribution to NASA ABoVE (Arctic Boreal Vulnerability Experiment) project of NASA’s Earth Science Program. The authors gratefully acknowledge the following scientists who reviewed and commented on portions of the MODIS phenology trend results presented in this study: Edward Berg, Roman Dial, Dawn Magness, Todd Radenbaugh, and Patrick Sullivan.
Conflicts of Interest
The authors declare no conflict of interests.
References
- Jia, G.; Epstein, H.; Walker, D. Greening of Arctic Alaska, 1981–2001. Geophys. Res. Lett. 2003, 30, 2067. [Google Scholar] [CrossRef]
- Ju, J.; Masek, J. The vegetation greenness trend in Canada and US Alaska from 1984–2012 Landsat data. Remote Sens. Environ. 2016, 176, 1–16. [Google Scholar] [CrossRef]
- Swanson, D. Trends in greenness and snow cover in Alaska’s arctic national parks, 2000-2016. Remote Sens. 2017, 9, 514. [Google Scholar] [CrossRef]
- Verbyla, D.; Hegel, T.; Nolin, A.; van de Kerk, M.; Kurkowski, T.; Prugh, L. Remote sensing of 2000–2016 alpine spring snowline elevation in Dall sheep mountain ranges of Alaska and western Canada. Remote Sens. 2017, 9, 1157. [Google Scholar] [CrossRef]
- Gustine, D.; Barboza, P.; Adams, L.; Griffith, B.; Cameron, R.; Whitten, K. Advancing the match-mismatch framework for large herbivores in the Arctic: Evaluating the evidence for a trophic mismatch in caribou. PLoS ONE 2017, 12, e0171807. [Google Scholar] [CrossRef] [PubMed]
- Rattenbury, K.L.; Schmidt, J.H.; Swanson, D.K.; Borg, B.L.; Mangipane, B.A.; Sousanes, P.J. Delayed spring onset drives declines in abundance and recruitment in a mountain ungulate. Ecosphere 2018, 9, e02513. [Google Scholar] [CrossRef]
- Boelman, N.T.; Liston, G.E.; Gurarie, E.; Meddens, A.J.; Mahoney, P.J.; Kirchner, P.B.; Bohrer, G.; Brinkman, T.J.; Cosgrove, C.L.; Eitel, J.U.; et al. Integrating snow science and wildlife ecology in Arctic-boreal North America. Environ. Res. Lett. 2019, 14, 010401. [Google Scholar] [CrossRef]
- Potter, C.S.; Alexander, O. Changes in vegetation cover and snowmelt timing in the Noatak National Preserve of Northwestern Alaska estimated from MODIS and Landsat satellite image analysis. Eur. J. Remote Sens. 2019, 52, 542–556. [Google Scholar] [CrossRef]
- Overpeck, J.; Hughen, K.; Hardy, D.; Bradley, R.; Case, R.; Douglas, M.; Finney, B.; Gajewski, K.; Jacoby, G.; Jennings, A.; et al. Arctic environmental change of the last four centuries. Science 1997, 278, 1251–1256. [Google Scholar] [CrossRef]
- Tape, K.; Sturm, M.; Racine, C. The evidence for shrub expansion in Northern Alaska and the Pan-Arctic. Glob. Change Biol. 2006, 12, 686–702. [Google Scholar] [CrossRef]
- Myers-Smith, I.H.; Forbes, B.C.; Wilmking, M.; Hallinger, M.; Lantz, T.; Blok, D.; Hik, D. Shrub expansion in tundra ecosystems: Dynamics, impacts and research priorities. Environ. Res. Lett. 2011, 6, 045509. [Google Scholar] [CrossRef]
- Elmendorf, S.C.; Henry, G.H.R.; Hollister, R.D.; Björk, R.G.; Boulanger-Lapointe, N.; Cooper, E.P.; Wipf, S. Plot-scale evidence of tundra vegetation change and links to recent summer warming. Nat. Clim. Chang. 2012, 2, 453–457. [Google Scholar] [CrossRef]
- Wang, J.; Sulla-Menashe, D.; Woodcock, C.; Sonnentag, O.; Keeling, R.; Friedl, M. Extensive land cover change across Arctic–Boreal Northwestern North America from disturbance and climate forcing. Glob. Change Biol. 2019. [Google Scholar] [CrossRef] [PubMed]
- Potter, C.S.; Brooks, V. Global analysis of empirical relations between annual climate and seasonality of NDVI. Int. J. Remote Sens. 1998, 19, 2921–2948. [Google Scholar] [CrossRef]
- Meier, G.; Brown, J.; Evelsizer, R.; Vogelmann, J. Phenology and climate relationships in aspen (Populus tremuloides Michx.) forest and woodland communities of southwestern Colorado. Ecol. Indic. 2015, 48, 189–197. [Google Scholar] [CrossRef]
- Parent, M.B.; Verbyla, D. The browning of Alaska’s boreal forest. Remote Sens. 2010, 2, 2729–2747. [Google Scholar] [CrossRef]
- Beck, P.S.; Goetz, S.J. Satellite observations of high northern latitude vegetation productivity changes between 1982 and 2008: Ecological variability and regional differences. Environ. Res. Lett. 2011, 6, 045501. [Google Scholar] [CrossRef]
- Rogers, B.M.; Solvik, K.; Hogg, E.; Ju, J.; Masek, J.G.; Michaelian, M.; Berner, L.; Goetz, S. Detecting early warning signals of tree mortality in boreal North America using multiscale satellite data. Glob. Change Biol. 2018, 24, 2284–2304. [Google Scholar] [CrossRef]
- Potter, C.; Li, S.; Crabtree, R. Changes in Alaskan tundra ecosystems estimated from MODIS greenness trends, 2000 to 2010. J. Geophys. Remote Sens. 2013, 2, 107. [Google Scholar]
- Potter, C.S. Regional analysis of MODIS satellite greenness trends for ecosystems of interior Alaska. GIScience Remote Sens. 2014. [Google Scholar] [CrossRef]
- Potter, C.S. Changes in vegetation cover of the Arctic National Wildlife Refuge estimated from MODIS greenness trends. Earth Interact. 2019, 23, 1–18. [Google Scholar] [CrossRef]
- Zhu, J.; Miller, A.; Lindsay, C.; Broderson, D.; Heinrichs, T.; Martyn, P. MODIS NDVI Products and Metrics User Manual, Version 1.0; Geographic Information Network of Alaska, University of Alaska: Fairbanks, Alaska, 2013; p. 18. Available online: http://static.gina.alaska.eud (accessed on 9 January 2020).
- Potter, C.S.; Randerson, J.T.; Field, C.B.; Matson, P.A.; Vitousek, P.M.; Mooney, H.A.; Klooster, S.A. Terrestrial ecosystem production: A process model based on global satellite and surface data. Glob. Biogeochem. Cycles 1993, 7, 811–841. [Google Scholar] [CrossRef]
- Wang, J.; Rich, P.; Price, K.; Kettle, W. Relations between NDVI, grassland production, and crop yield in the central Great Plains. Geocarto Int. 2005, 20, 5–11. [Google Scholar] [CrossRef]
- Campbell, J.; Wynne, R. Introduction to Remote Sensing; The Guilford Press: New York, NY, USA, 2011; p. 662. [Google Scholar]
- Olsen, J.; Miehe, S.; Ceccato, P.; Fensholt, R. Does EO NDVI seasonal metrics capture variations in species composition and biomass due to grazing in semi-arid grassland savannas? Biogeosciences 2015, 12, 4407–4419. [Google Scholar] [CrossRef]
- Berner, L.T.; Jantz, P.; Tape, K.D.; Goetz, S.J. Tundra plant above-ground biomass and shrub dominance mapped across the North Slope of Alaska. Environ. Res. Lett. 2018, 13, 035002. [Google Scholar] [CrossRef]
- Haibo, L.; Wang, C.; Zhang, L.; Li, X.; Zang, S. Satellite monitoring of boreal forest phenology and its climatic responses in Eurasia. Int. J. Remote Sens. 2017, 38, 5446–5546. [Google Scholar]
- Jeong, S.-J.; Ho, C.-H.; Gim, H.-J.; Brown, M.E. Phenology shifts at start vs. end of growing season in temperate vegetation over the Northern Hemisphere for the period,1982–2008. Glob. Change Biol. 2011, 17, 2385–2399. [Google Scholar] [CrossRef]
- Shen, M.; Tang, Y.; Chen, J.; Yang, X.; Wang, C. Earlier-season vegetation has greater temperature sensitivity of spring phenology in Northern Hemisphere. PLoS ONE 2014, 9, e88178. [Google Scholar] [CrossRef]
- Wang, X.; Piao, S.; Xu, X.; Ciais, P.; MacBean, N.; Myneni, R.; Li, L. Has the advancing onset of spring vegetation green-up slowed down or changed abruptly over the last three decades? Glob. Ecol. Biogeogr. 2015, 24, 621–631. [Google Scholar] [CrossRef]
- Monitoring Trends in Burn Severity (MTBS). Fire Level Geospatial Data, MTBS Project, U. S. Department of Agriculture Forest Service/U.S. Geological Survey. 2017. Available online: http://mtbs.gov/direct-download (accessed on 9 January 2020).
- Huete, A.; Didan, K.; Miura, T.; Rodriquez, E.; Gao, X.; Ferreira, L. Overview of the radiometric and biophysical performance of the MODIS vegetation indices. Remote Sens. Environ. 2002, 83, 195–213. [Google Scholar] [CrossRef]
- Shao, Y.; Lunetta, R.S.; Wheeler, B.; Iiames, J.S.; Campbell, J.B. An evaluation of time-series smoothing algorithms for land-cover classifications using MODIS NDVI multi-temporal data. Remote Sens. Environ. 2016, 174, 258–265. [Google Scholar] [CrossRef]
- LP-DACC: NASA Land Processes Distributed Active Archive Center. MODIS/Terra Vegetation Indices Monthly L3 Global 0.05Deg CMG (MOD13C2), Version 005; USGS/Earth Resource s Observation and Science (EROS) Center: Sioux Falls, South Dakota, 2007. [Google Scholar]
- Reed, B.; Budde, M.; Spencer, P.; Miller, A. Satellite-Derived Measures of Landscape Processes: Draft Monitoring Protocol for the Southwest Alaska I&M Network, Version 1.0; National Park Service, Inventory & Monitoring Program, Southwest Alaska Network: Anchorage, Alaska, 2006; p. 30. [Google Scholar]
- Wang, P.; Huang, F.; Kang, S.; Zhao, L.; Sun, N.; Han, Y. Evaluate rice phenological differences under heavy metal stress using NDVI time-series by blending MODIS and Landsat data. In Proceedings of the SPIE 10780, Multispectral, Hyperspectral, and Ultraspectral Remote Sensing Technology, Techniques and Applications VII, Honolulu, HI, USA, 23 October 2018; p. 107800. [Google Scholar] [CrossRef]
- Kautz, D. Land Resource Regions and Major Land Resource Areas of Alaska; United States Department of Agriculture, Natural Resources Conservation Service: Washington, DC, USA, 2004. Available online: http://www.ak.nrcs.usda.gov/technical/lrr.html (accessed on 31 January 2020).
- Homer, C.; Dewitz, J.; Yang, L.; Jin, S.; Danielson, P.; Xian, G.; Coulston, J.; Herold, N.; Wickham, J.; Megown, K. Completion of the 2011 National Land Cover Database for the conterminous United States—Representing a decade of land cover change information. Photogramm. Eng. Remote Sens. 2015, 81, 345–354. [Google Scholar]
- Selkowitz, D.; Stehman, S. Thematic accuracy of the National Land Cover Database (NLCD) 2001 land cover for Alaska. Remote Sens. Environ. 2011, 115, 1401–1407. [Google Scholar] [CrossRef]
- Seaber, P.R.; Kapinos, F.P.; Knapp, G.L. Hydrologic Unit Maps: U.S. Geological Survey Water-Supply Paper 2294; ASCE Press: Reston, Virginia, 1987; p. 63. [Google Scholar]
- Forkel, M.; Carvalhais, N.; Verbesselt, J.; Mahecha, M.; Neigh, C.; Reichstein, M. Trend change detection in NDVI time series: Effects of inter-annual variability and methodology. Remote Sens. 2013, 5, 2113–2144. [Google Scholar] [CrossRef]
- Mann, H.B. Nonparametric tests against trend. Econometrica 1945, 13, 245–259. [Google Scholar] [CrossRef]
- Forkel, M.; Wutzler, T. Green-brown—Land surface phenology and trend analysis. A package for the R software. Version 2.2. 2015-04-15. 2015. Available online: http://greenbrown.r-forge.r-project.org/ (accessed on 9 January 2020).
- Naito, A.T.; Cairns, D.M. Patterns of shrub expansion in Alaskan arctic river corridors suggest phase transition. Ecol. Evol. 2015, 5, 87–101. [Google Scholar] [CrossRef]
- Tape, K.D.; Gustine, D.D.; Ruess, R.W.; Adams, L.G.; Clark, J.A. Range expansion of moose in Arctic Alaska linked to warming and increased shrub habitat. PLoS ONE 2016, 11, e015263. [Google Scholar] [CrossRef]
- Tillotson, M.D.; Quinn, T.P. Beyond correlation in the detection of climate change impacts: Testing a mechanistic hypothesis for climatic influence on Sockeye salmon (Oncorhynchus nerka) productivity. PLoS ONE 2016, 11, e0154356. [Google Scholar] [CrossRef]
- Raynolds, M.; Walker, D.; Verbyla, D.; Munger, C. Patterns of change within a tundra landscape: 22-year Landsat NDVI trends in anArea of the northern foothills of the Brooks Range, Alaska. Arct. Antarct. Alp. Res. 2013, 45, 249–260. [Google Scholar] [CrossRef]
- Walker, M.; Walker, D.; Welker, J.; Arft, A.; Bardsley, T.; Brooks, P.; Fahnestock, T.; Jones, M.; Losleben, M.; Parsons, A.; et al. Long-term experimental manipulation of winter snow regime and summer temperature in Arctic and alpine tundra. Hydrol. Process. 1999, 13, 2315–2330. [Google Scholar] [CrossRef]
- Wahren CH, A.; Walker, W.D.; Bret-Harte, M.S. Vegetation responses in Alaskan Arctic tundra after 8 years of a summer warming winter snow manipulation experiment. Glob. Change Biol. 2005, 11, 537–552. [Google Scholar] [CrossRef]
- Gonsamo, A.; Ter-Mikaelian, M.T.; Chen, J.M.; Chen, J. Does earlier and increased spring plant growth lead to reduced summer soil moisture and plant growth on landscapes typical of tundra-taiga interface? Remote. Sens. 2019, 11, 1989. [Google Scholar] [CrossRef]
- Potter, C.S. Changes in vegetation cover of Yukon River drainages in Interior Alaska estimated from MODIS greenness trends, 2000 to 2018. Northwest Sci. 2020, in press. [Google Scholar]
- Potter, C.S. Recovery rates of wetland vegetation greenness in severely burned ecosystems of Alaska derived from satellite image analysis. Remote. Sens. 2018, 10, 1456. [Google Scholar] [CrossRef]
- The Nature Conservancy (TNC). Alaska Peninsula and Bristol Bay Basin Ecoregional Assessment; Anchorage, Alaska. 2004. Available online: https://www.conservationgateway.org/ConservationPlanning/SettingPriorities/EcoregionalReports/Documents/Alaska_Peninsula_and_Bristol_Bay_Basin_Ecoregional_Assessment.pdf (accessed on 31 January 2020).
- Pletnikoff, K.; Poe, A.; Murphy, K.; Heffner, L. Promoting Resilience and Adaptation in Coastal Arctic Alaska, Workshop Synthesis; Alaska Landscape Conservation Cooperatives and Aleutian Pribilof Islands Association: Nome, Alaska, 2016; p. 80. Available online: https://adaptalaska.org/wp-content/uploads/2017/10/ak-adaptation-workshop.pdf (accessed on 31 January 2020).
- Berg, E.; Henry, J.; Fastie, C.; de Volder, A.; Matsuoka, S. Spruce beetle outbreaks on the Kenai Peninsula, Alaska, and Kluane National Park and Reserve, Yukon Territory: Relationship to summer temperatures and regional differences in disturbance regimes. For. Ecol. Manag. 2006, 227, 219–232. [Google Scholar] [CrossRef]
- Trammell, E.J.; Boucher, T.; Carlson, M.L.; Fresco, N.; Fulkerson, J.R.; McTeague, M.L.; Reimer, J.; Schmidt, J. (Eds.) Central Yukon Rapid Ecoregional Assessment; Bureau of Land Management, U.S. Department of the Interior: Anchorage, Alaska, 2016; p. 879.
- Berg, E.; Hillman, K.M.; Dial, R.; DeRuwe, A. Recent woody invasion of wetlands on the Kenai Peninsula Lowlands, south-central Alaska: A major regime shift after 18000 years of wet Sphagnum–sedge peat recruitment. Can. J. For. Res. 2009, 39, 2033–2046. [Google Scholar] [CrossRef]
- Dial, R.J.; Smeltz, T.S.; Sullivan, P.; Rinas, C.; Timm, K.; Geck, J.; Tobin, C.; Golden, T.; Berg, E. Shrubline but not treeline advance matches climate velocity in montane ecosystems of south-central Alaska. Glob. Change Biol. 2016, 22, 1841–1856. [Google Scholar] [CrossRef]
- Myers-Smith, I.H.; Kerby, J.T.; Phoenix, G.K.; Bjerke, J.W.; Epstein, H.E.; Assmann, J.J.; John, C.; Andreu-Hayles, L.; Angers-Blondin, S.; Beck, P.S.; et al. Complexity revealed in the greening of the Arctic. Nat. Clim. Change 2020, 10, 106–117. [Google Scholar] [CrossRef]
- Pattison, R.R.; Jorgenson, J.C.; Raynolds, M.K.; Welker, J.M. Trends in NDVI and tundra community composition in the Arctic of NE Alaska between 1984 and 2009. Ecosystems 2015, 18, 707–719. [Google Scholar] [CrossRef]
- Sekhon, N.S.; Hassan, Q.; Sleep, R. Evaluating potential of MODIS-based indices in determining “snow gone” stage over forest-dominant regions. Remote Sens. 2010, 2, 1348–1363. [Google Scholar] [CrossRef]
- Jin, H.; Jönsson, A.; Bolmgren, K.; Langvall, O.; Eklundh, L. Disentangling remotely-sensed plant phenology and snow seasonality at northern Europe using MODIS and the plant phenology index. Remote Sens. Environ. 2017, 198, 203–212. [Google Scholar] [CrossRef]
- Karkauskaite, P.; Tagesson, T.; Fensholt, R. Evaluation of the plant phenology index (PPI), NDVI and EVI for start-of-season trend analysis of the Northern Hemisphere boreal zone. Remote. Sens. 2017, 9, 485. [Google Scholar] [CrossRef]


© 2020 by the authors. Licensee MDPI, Basel, Switzerland. This article is an open access article distributed under the terms and conditions of the Creative Commons Attribution (CC BY) license (http://creativecommons.org/licenses/by/4.0/).