Article

Fire Frequency and Related Land-Use and Land-Cover Changes in Indonesia’s Peatlands

1
Geospatial Sciences Center of Excellence, South Dakota State University, Brookings, SD 57007, USA
2
Indonesian National Institute of Aeronautics and Space (LAPAN), Jakarta 13710, Indonesia
3
Appalachian Laboratory, University of Maryland Center for Environmental Science, Frostburg, MD 21532, USA
*
Author to whom correspondence should be addressed.
Remote Sens. 2020, 12(1), 5; https://doi.org/10.3390/rs12010005
Submission received: 20 October 2019 / Revised: 24 November 2019 / Accepted: 16 December 2019 / Published: 18 December 2019
(This article belongs to the Special Issue Remote Sensing and Pyrogeography)

Abstract

:
Indonesia’s converted peatland areas have a well-established fire problem, but limited studies have examined the frequency with which they are burning. Here, we quantify fire frequency in Indonesia’s two largest peatland regions, Sumatra and Kalimantan, during 2001–2018. We report, annual areas burned, total peatland area affected by fires, amount of recurrent burning and associations with land-use and land-cover (LULC) change. We based these analyses on Moderate Resolution Imaging Spectroradiometer (MODIS) Terra/Aqua combined burned area and three Landsat-derived LULC maps (1990, 2007, and 2015) and explored relationships between burning and land-cover types. Cumulative areas burned amounted nearly half of the surface areas of Sumatra and Kalimantan but were concentrated in only ~25% of the land areas. Although peatlands cover only 13% of Sumatra and Kalimantan, annual percentage of area burning in these areas was almost five times greater than in non-peatlands (2.8% vs. 0.6%) from 2001 to 2018. Recurrent burning was more prominent in Kalimantan than Sumatra. Average fire-return intervals (FRI) in peatlands of both regions were short, 28 and 45 years for Kalimantan and Sumatra, respectively. On average, forest FRI were less than 50 years. In non-forest areas, Kalimantan had shorter average FRI than Sumatra (13 years vs. 40 years), with ferns/low shrub areas burning most frequently. Our findings highlight the significant influence of LULC change in altering fire regimes. If prevalent rates of burning in Indonesia’s peatlands are not greatly reduced, peat swamp forest will disappear from Sumatra and Kalimantan in the coming decades.

Graphical Abstract

1. Introduction

Indonesia has committed to reducing its greenhouse gases emissions by 29% (potentially up to 41% with international assistance) by 2030. Achieving those targets requires many initiatives but controlling the fire problem is central to these efforts, since burning in Indonesia’s peatlands is currently seen as being unlikely to diminish in the coming decades [1]. The peatland fires of 2015, which lasted for three months, were shocking, being referred to as the worst fire event on record since 1997 [2]. The 2015 peatland fires burned more than 2.6 million hectares (Mha) of forest, peat, and other lands. The fires contributed CO2 emissions equivalent to 5% of global fossil fuel emissions in 2015 [3], causing economic losses of at least US $16 billion in Indonesia alone, and resulting in roughly 100,300 excess deaths [4]. Indonesia contains approximately 3.5% of global peatlands that store at least 30 gigatons of carbon [5,6,7,8]. Monitoring carbon fluxes from these peatlands is critical for both national and global carbon accounting.
Intact peatlands are wetlands that rarely burn. However, since peatlands have been drained for uses other than natural forest, peatlands have become flammable and progressively more degraded. Over the last two decades, fire events have become common. Several authors have investigated this fire activity and the underlying causes from social and political perspectives [9,10,11], but the effects of physical constraints on the spatial and temporal patterns of fire occurrence have been less studied [12], including the analysis of fire frequency itself.
Fire frequency, one of the key components characterizing a fire regime, is mostly described in publications using fire-affected area or fire density (for e.g., [13,14], fire accumulation or occurrences [15], or annual mean frequency of fire [16]). The common landscape approach for quantifying fire frequency is to quantify how many times fire affects a given amount of area over a defined time period, instead of the probability of burning across the entire landscape. We investigated fire frequency in Indonesia’s peatlands, for the 2001–2018 period, to define how burning, and specifically recurrent fire, is associated with land-use and land-cover (LULC) types.
Understanding fire regimes is critical, not only to identify fire pattern changes in ecosystems but also to generate related assessments of forest regeneration potential [17], fire management [18], human impacts [19], and fire-related emissions associated with the extent and depth of peat burned. A recent study suggests that fire frequency needs to be accounted for in fire-derived emissions calculations from peatlands since recurrent fires have lower emission levels and different compositions than the initial fires [20]. This finding increases uncertainty about emissions from peat fires and illustrates how critical it is to know the fire history.
Various studies have linked recurring fire events [13,21,22] to positive feedback of increasing fire susceptibility in degraded forests [23,24] and increasing human land-use activities [1,10]. However, to our knowledge, studies emphasizing the spatiotemporal patterns of recurrent fires and their relationship to the land cover change are scarce for this region. Earlier, Hoscillo et al. [25] analyzed fire frequency in a small part of Kalimantan using time series data (1978 to 2005). Langner and Siegert [13] also explored fire-affected areas and its relationship to the land-cover types (1997–2006) in Kalimantan. The studies excluded estimates of the time needed to burn the entirety of a specified area, with the consideration that some areas may not burn while others burn more than once during a cycle [26]. Even for similar vegetation types, average fire-return intervals (FRI) can vary from region to region or over time [27].
Here, we compare the fire frequency in the two largest peatland regions in Indonesia, Sumatra and Kalimantan. The latest version of Moderate Resolution Imaging Spectroradiometer (MODIS) burned area products (MCD64A1 Collection 6) allowed us to create long-term and systematic burning-observations from 2001 to 2018. These consistent satellite-based burned area products have been increasingly used and validated in several ecosystems [28,29,30,31]. The collection 6 MODIS burned area product is believed to be superior to other products (the MODIS burned area product collection 5, both MCD64A1 and MCD45A1) because it includes more small fires.
We calculated the annual percentage of area burned (APAB) and average fire-return intervals (FRI, the time required to burn an area equal to the study area) [32,33] from these datasets to compare the fire frequency in both regions. This approach has been widely used in different ecosystems [34,35,36,37,38], allowing for comparisons across types or sizes of landscape [39]. We report area burned from 2001 to 2018 in Sumatran and Kalimantan peatlands, as well as linkages between burning and subsequent landcover changes. Our specific questions were: (1) How do fire occurrences differ between peatland regions? (2) Which LULC types were associated with the most burning, including which one’s result in recurring fires? (3) How does fire frequency differ between peatland regions over time?

2. Materials and Methods

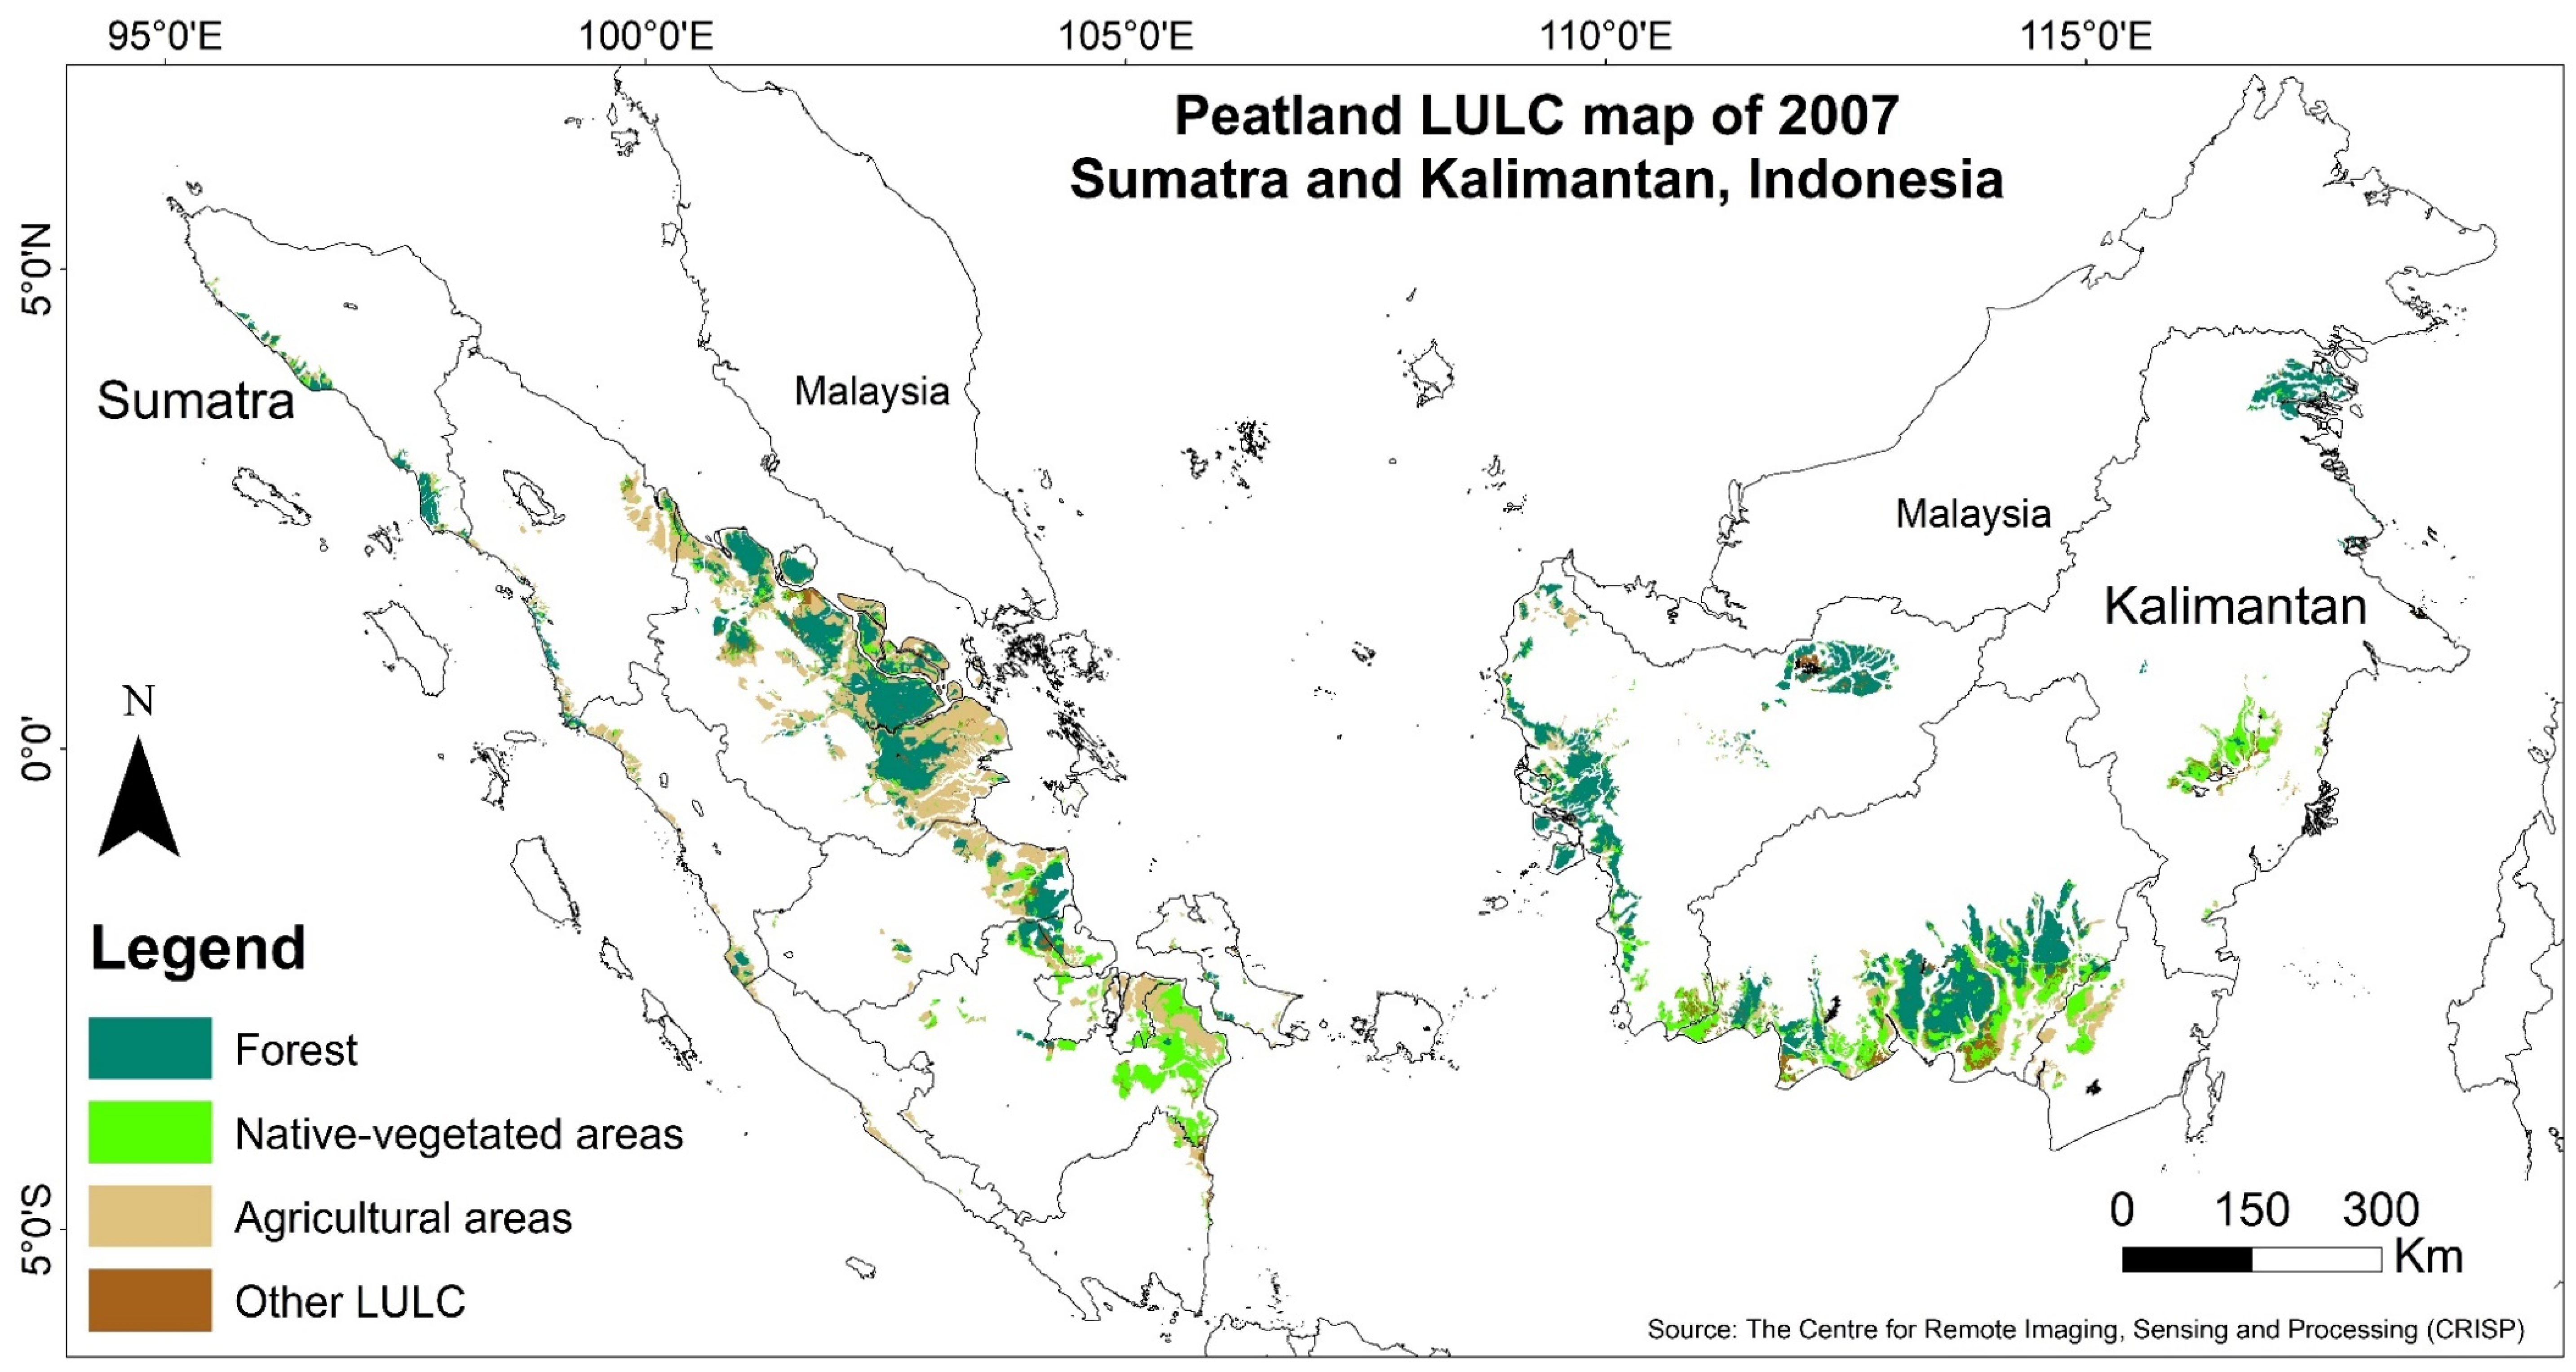
2.1. Study Sites and Peatland Maps

The study area covers 75% of Indonesian peatlands (Figure 1), roughly 7.2 million hectares (Mha) in Sumatra and 5.7 Mha in Kalimantan [6,7]. The analyses used the peatland map published by Wetlands International [6,7]. This map of peatlands differs from the recently updated one issued by the Ministry of Agriculture [40] that excludes shallow peat (<0.5 m depth) areas. This exclusion is largely responsible for the disparity in total peatland area (13 Mha vs. 11.2 Mha) and smallholder area (3.1 Mha vs. 2.5 Mha) [41]. Both maps are widely used for official uses. However, both maps have relatively low resolution (1:250,000), reducing certainties about accurate location and associated estimates of peat thickness.
The Wetlands International map shows that peatlands cover most of the eastern coast of Sumatra, with the most substantial portions in Riau and South Sumatra, while Kalimantan’s peatlands are spread over southern and western parts of the island [5,6,7]. The peatlands vary in depth, with roughly 58% <2-m depth and 42% of >2 m depth on both islands. Ages of the peats differ between the islands as well [5].
Both regions have drawn international attention due to extensive peat burning and resultant haze impacts on neighboring countries. The two regions experience different land-management practices, with Sumatra having more plantation areas (mainly oil palm (Elaeis guineensis) and pulp wood (Acacia sp.)) than Kalimantan [42] but both regions suffer near-annual burning crises. Natural peat forest areas were predominantly covered by Dipterocarp sp. and Gonysylus sp. trees in both regions before massive forest deforestation and degradation took place (see Table 1). The sites have different fire history time frames but, in each, land-use policies related to forest clearing have been the primary cause of fires [43]. Indonesia has experienced high rates of forest loss and degradation with 7.54 Mha lost from Sumatra [44] and 14.4 Mha from Kalimantan [21] since 1978. Forests being converted to plantations have been blamed for contributing to the large area burned. It is still unclear whether fires associated with plantation development affect landscape-level fire frequency [21].
Sub-regional differences exist. For example, Riau has experienced persistent burning with heavy smoke that effects nearby countries and had the highest percentage of peat swamp forests converted to oil palm plantations by 2007 [45]. In South Sumatra, on the other hand, fires have become part of Sonor, a traditional system of wetland rice cultivation [9]. For Central Kalimantan, the fires have been associated with the one million hectares of drained peat-swamp forest—the so-called Mega Rice Project, converted into rice plantations that were later abandoned [20,46,47,48,49]. A massive network of drainage canals was built at this site, with a combined length of 4500 km, in peat with depths of up to 10 m [50].
Regardless of land-use history, all peatland sites become prone to fire when drained before the establishment of new LULC or through careless logging techniques and plantation establishment. Severe droughts, especially those associated with El Niño-Southern Oscillation (ENSO) events, substantially increase fire susceptibility [24] and recurrent fire events. El Niño corresponds to the warm phase of ENSO as opposed to La Niña in the cool phase. Here, we defined the El Niño/La Niña conditions as anomalous sea surface temperatures (SST) in the Niño 3.4 region (5°N–5°S, 120°–170°W) that exceed 0.4 °C for at least 5 months. Impacts from El Niño-related reductions in rainfall increase as anomalous SSTs rise and when the timing aligns with dry season periods, which usual begin in the June, July, August (JJA) period. Since 2001, El Niño events have been recorded in 2002, 2004, 2006, 2009, and 2015, with corresponding La Niña events in 2007, 2010, 2011, and 2016 [51]. Kalimantan’s peak fire season usually occurs from September to October while Sumatra’s usually starts in June. However, in Riau, two peak fire seasons occur, February to April and June to August.

2.2. Satellite Data and Sources

We downloaded the Terra and Aqua MODIS combined MCD64A1 burned area Collection 6 (C6) products from July 2001 to September 2018 (207 months or 17.25 years) for the fire frequency analysis [52]. To cover the entirety of Sumatra and Kalimantan, six scenes were composited including the tiles of h29v08, h29v09, h28v08, h28v09, h27v08, and h27v09. All pixels were selected based on two dataset layers provided with the products: “Burn Date” and Quality Assurance (QA). Day of burn (1–366) was extracted from the Burn Date layer. We filtered pixels so as to retain only those with valid-data flags (QA layer) located over land in all subsequent analyses. Active Fire Data (hotspot) MODIS Collection 6 were downloaded for the same period. The data is available at https://firms.modaps.eosdis.nasa.gov/download/. This product provides hotspot the coordinates and confidence levels. We removed all hotspots with confidence levels less than 30% from subsequent analyses. All datasets were processed using R software.
Some areas burning in 2001 may be missing since only the Terra MODIS satellite was operating at the time. MODIS orbital gaps near the equator mean that availability of full daily coverage of Earth surfaces does not exist, specifically in the tropics, but this should not significantly impact the burned area products since they will detect land-cover changes on subsequent passes. Given the unavailability of specific burned area products for Terra and Aqua, we were unable to directly compare the area burned contributions of the Terra and Aqua data in the combined product. However, we did verify that none of the pixels were classified as “unmapped” for the 2001 product, indicating no gaps due to insufficient data. Since 2001 was a non-El Niño year, when fewer areas typically burn, minor reductions in detections of area burned in that year are unlikely to significantly affect our analysis. The information provided with the burned area product states that there are no known problems observed by starting from July 2001. Given these factors, we believe that extending our time-series datasets is accurate and a valued contribution. These products have not been well validated in many Indonesian biomes and may not accurately record all burned areas in this region. However, since our scope of analysis was regional in scale, covered several years (2001–2018), and used a consistent MODIS product over that time period, analyses should accurately reflect regional trends, and may be conservative.

2.3. Land-Use and Land-Cover Maps

Peatland LULC maps were provided by the Centre for Remote Imaging, Sensing and Processing (CRISP) [42] for 1990, 2007, and 2015. The map products used Landsat and SPOT 4 (Satellite Pour l’Observation de la Terre, 30 m and 20 m resolution, respectively) for classification of LULC (see the maps in the Appendix B, Figure A1, Figure A2 and Figure A3). Manual classification was used with a final accuracy of 89%. The most problematic classifications involved separation of taller shrubs and secondary forest or confusion between open undeveloped land and newly established smallholder areas or industrial plantations.
Since the maps were produced at different times, slight classification differences exist between the 2007 map and the other two map years. For comparison purposes between years, the three 2007 LULC map categories (slightly, moderate, and highly degraded peat swamp forest) were combined into a single generic degraded peat swamp forest class. We divided the map into four groups for the fire frequency analysis: forests (including pristine and degraded forests), native-vegetated areas (low/tall shrubs, secondary forest), agricultural areas (smallholder and plantation areas), and other LULC types (water, seasonal water, built-up area, cleared/burned area, and mangrove).
Table 1 describes the LULC group and types.

2.4. Fire Occurrences, Annual Burned Area, Fire Frequency, and Related Land-Use and Land-Cover Change

Fires accumulated (times burning) and annual burned area were calculated from the MODIS burned area product C6. Only a single fire occurrence per year/pixel was counted. Multi-year fire accumulations at a location of greater than 2 were categorized as recurrent burning. In addition to total annual burned area, burned surface areas were classified as either being extensive (fire accumulation ≤2) or recurrent (>2) in nature.
For the analysis, we divided fire events into two time periods to match the available LULC maps, 2001–2007 (period-I) and 2008–2018 (period-II). We used the 2007 LULC map for period-I and 2015 LULC map for period-II to relate LULC change and fire frequency. We divided the map into four groups: forests (including pristine and degraded forests), native-vegetated areas (low/tall shrubs, secondary forest), agricultural areas (smallholder and plantation areas), and other LULC types (water, seasonal water, built-up area, cleared/burned area, and mangrove).
Fire frequency was calculated from the annual percentage of area burned (APAB, Equation (1)). Average fire-return intervals (FRI), time to burn the entire area, was then calculated (Equation (2)), respective to each LULC type. We removed areas not covered in vegetation and grouped the LULC types into forest and non-forest. Our land cover-related calculations referenced the baseline map of 1990, when most of the region was still forested and forest degradation and conversion amounts were minimal, to assess subsequent fire-LULC change associations.
APAB i   =   ( Annual   burning   rate ) i / ( Total   peatland   areas ) i   ×   100 %
FRI i   =   ( Total   peatland   areas ) i / ( Annual   burning   rate ) i
where APAB is percentage of annual burn areas (%) over total peatland (ha) of a specific LULC types (i) while FRI is annual fire-return intervals (year) of a specific land-cover type (i) defined as the inverse of APAB.

3. Results

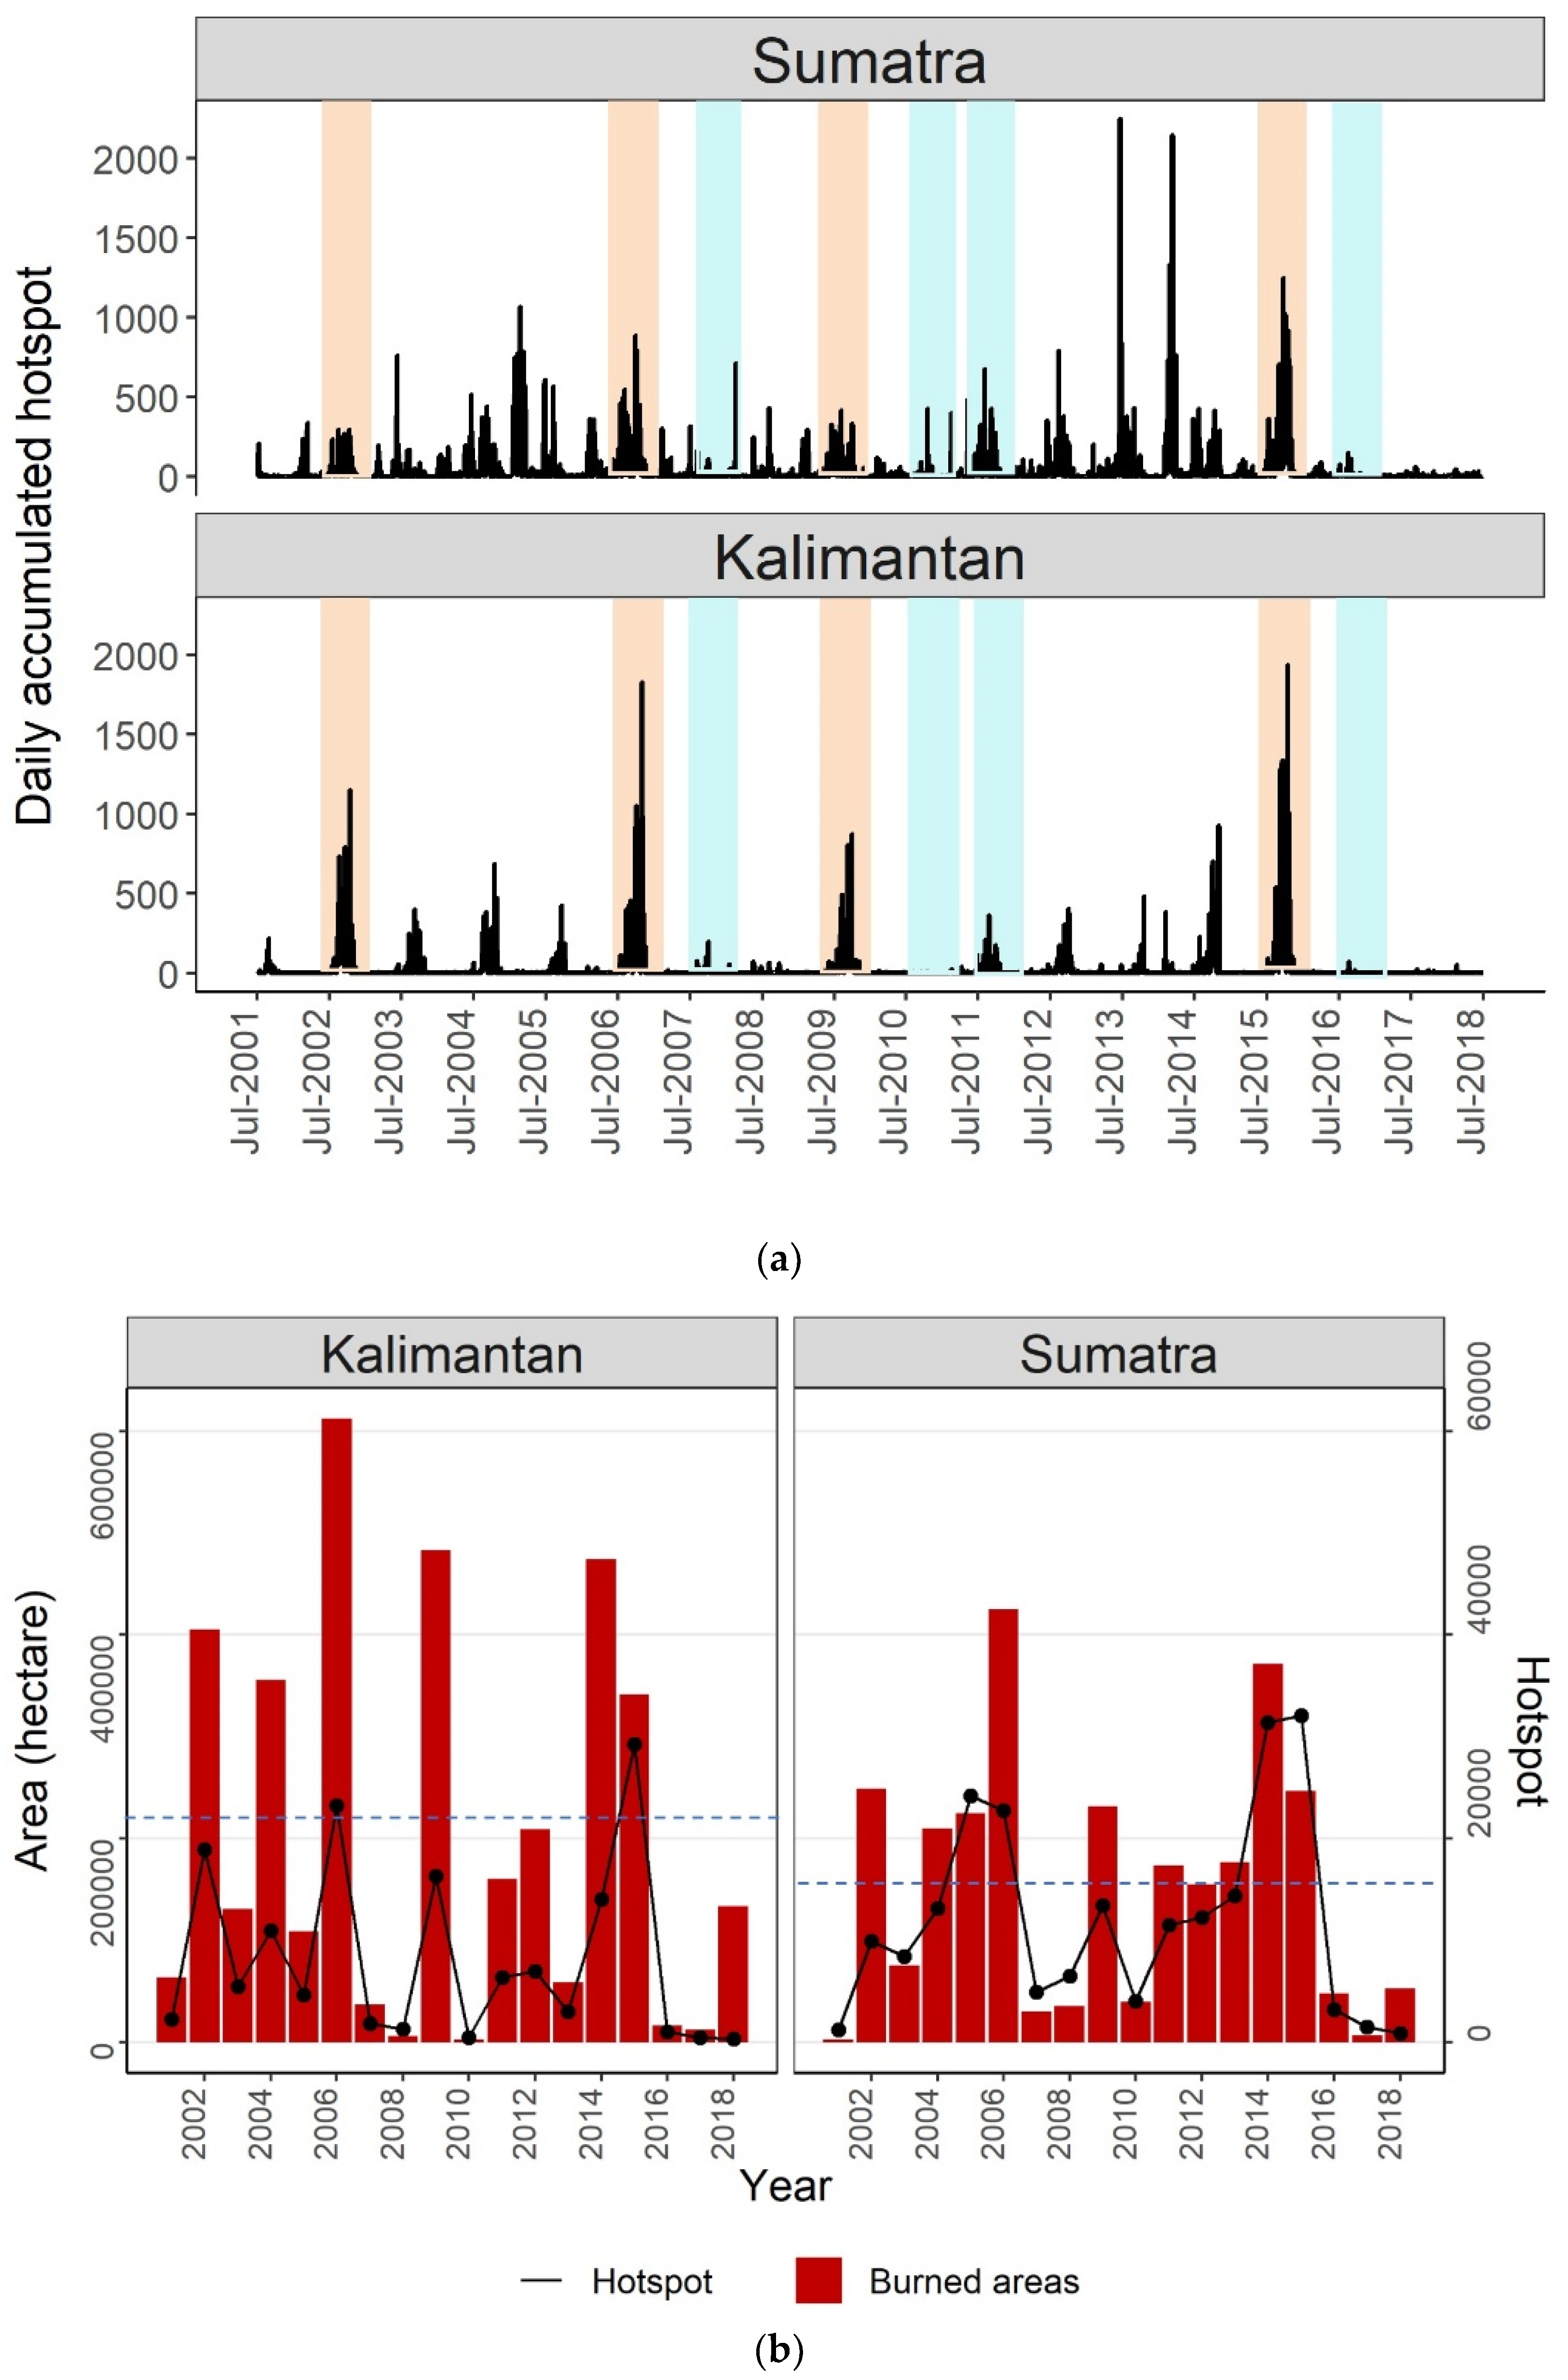
3.1. Fire Occurrences, Total Area Burned, and Area Affected by Burning among Regions

The MODIS burned area product (C6) shows areas burned one or more times in both peatlands and non-peatlands over the eighteen-year study period (Figure 2). At least 7.9% and 9.4% of the Sumatran and Kalimantan lands were affected by fires, respectively (Table 2), with the most area affected by burning found in Riau province, Southern Sumatra, and Central Kalimantan (see subsets Figure 2 and Figure 3). The average annual area burned decreased by 37% and 48% between the first (2001–2007) and second time (2008–2018) periods for Sumatra and Kalimantan, respectively. Although peatlands only cover roughly 13% of Sumatra and Kalimantan, burning affected these areas at rates five times higher than non-peatlands (2.8% vs. 0.6%).
From 2001 to 2018, at least a quarter of the Sumatran and Kalimantan peatland areas were affected by fires. During the 6-year first period (2001–2007), nearly half million hectares (3.5% of the areas) burned annually in both peatland regions. These rates decreased by 29% during the 11-year second period (2008–2018). Inter-annual variability of area burned shows Kalimantan’s burned areas exceeded Sumatra’s in most years (Figure 4), with exceptions occurring during many non El Niño years (2005, 2008, 2010, 2011, 2013, and 2016). The greatest areas burned occurred during the El Niño conditions which lined up with dry seasons (2002, 2006, 2009, and 2015) except for 2014 (weak El Niño conditions) which was actually the early stage of the 2015 El Niño event [51]. Although Sumatra’s peatland fires are less highly correlated with El Niño events than Kalimantan, large amounts of area burned occurred during those events in both regions.
We found that almost half of the areas burned in Sumatra and Kalimantan peatlands were recurrent burning (more than twice in the same location, Table 2). On average, the rate of the amounts of recurrent burning were nearly triple in Kalimantan compared to Sumatra. In the first 6-year period alone, more than one-quarter of burning was recurrent in Kalimantan, with a recurrent fire APAB nearly three times higher than in Sumatra. This rate disparity decreased in the second period but was still twice as high. The recurrent fire FRI was almost the same (slightly longer) than the overall peatland FRI for the entire peatlands from 2001 to 2018. Although there are some regional disparities, these findings reveal that previously burned areas burn nearly as frequently as other areas.

3.2. Fire-Related Land-Use and Land-Cover Change in Peatlands

Between 2001 and 2018, burning predominantly occurred in areas that had been forested in 1990, but these areas are now experiencing different land management practices in peatlands of Sumatra and Kalimantan (Figure 5). At least 70.5% and 63.8% of all fires occurred in peat swamp forests (pristine or degraded) of Sumatra and Kalimantan, respectively. Based on the LULC as of 2007, subsequent burning of standing forests was more prevalent in Sumatra (13.7%) than Kalimantan (6.9%). By 2015, 64% of these burned forests were converted to agriculture in Sumatra, while only 41% of such areas became agriculture in Kalimantan. Remaining burned forest areas transitioned to other native-vegetation (mostly shrubs). The disparity in plantation area located in peatlands between the regions has diminished in recent years from a 10-fold difference in 2007 to only a three-fold difference by 2015 (see Table A1 in Appendix A). At least 29% and 39% of the total plantation areas in Sumatra and Kalimantan established by 2015, respectively, were associated with burning (Table A2, Appendix A).
Based on the LULC map of 1990, the highest burning rate from 2001 to 2007 of non-forests occurred in ferns/low shrub for both regions (Figure 6 and Table A3 in Appendix A), with a higher annual burned rate in Kalimantan (32,902 ha/year) than Sumatra (29,575 ha/year). Burning rates in Kalimantan exceeded those in Sumatra for all LULC types other than industrial plantations, explaining the more rapid fire-return intervals in this region. In the early time period (2001–2007) burning was minimal in plantation areas with no detected fires Kalimantan and only a few burning in Sumatra (4.3 ha/year). However, plantation burning rates increased in both regions during 2008–2018, most drastically in Sumatra (14,143 ha/year). Despite the increase, established plantations had the lowest average annual burning rate among all vegetated areas. The areas burned detected as burn scars, or bare land were excluded from this calculation, accounting for 16% of the total area burned in Kalimantan. Those areas were subsequently converted to either agricultural or non-vegetated areas, as shown on the 2015 LULC map (Figure 5b).
LULC types other than native-vegetation or agricultural for both Sumatra and Kalimantan accounted for only 8% of total area burned during 2001–2018, on average (Figure 5b). Kalimantan had more prominent amounts of area burned in seasonal water locations than Sumatra (see Figure 7), usually located along rivers traversing peat swamp. Areas burned more than twice (2001–2018) predominantly occurred in either pristine or degraded peat swamp forest (extant in 1990) in both regions, accounting for 61% and 57% in Sumatra and Kalimantan, respectively (Figure 5b). Native-vegetation of various types still constituted the majority of LULC in Kalimantan as of 2015 (Figure 5a).

3.3. Fire Frequency Analysis in Peatland and Their Associated Land-Use and Land-Cover Types

Overall, the FRI from 2001 to 2018 is short in both regions with shorter lengths in Kalimantan than Sumatra (28 vs. 45 years, Table 2). Shorter FRIs predominated during the first period of 2001–2007 but have lengthened somewhat in both regions during the second period, from 38 to 50 years in Sumatra and from 22 to 33 years in Kalimantan. This cycle equates to Sumatra’s and Kalimantan’s peatlands experiencing an average of 2.3% and 3.8% annual burning for the entire 2001–2018 period, respectively.
When associated with specific LULC types, both Kalimantan peatland forests and non-forest have the shortest FRIs (35 and 13 years, respectively). This indicates rapidly increasing amounts of deforestation/degradation in Kalimantan caused by burning. However, both Sumatra and Kalimantan have considerably short forest FRIs, less than 50 years on average (Figure 8). In forests, only 55 years and 47 years are required to burn areas equivalent to the entire pristine peat swamp forests of Sumatra and Kalimantan, respectively, while degraded PSF have even shorter FRIs, 34 and 25 years for Sumatra and Kalimantan, respectively. Annual fire-return intervals for non-forests are longer in Sumatra (40 years) than in Kalimantan (13 years).

4. Discussion

We found that burning was much more prevalent in peatlands than non-peatlands in both regions. Overall, Kalimantan and Sumatran peatlands both experienced extensive amounts and high rates of burning, but experienced different temporal and spatial patterns of fire. Kalimantan had both higher rates of annual burning and significantly higher percentages of recurrent fire events in the same locations than Sumatra. This suggests that extensive burning, such as was reported in 1982–1983 [54], has been increasingly replaced by recurrent fires, as reported by Hoscillo [25] for the Mega Rice Project areas of Central Kalimantan (see Figure 3). Our analysis indicated that these areas continue to be subjected to recurring fire events. Both regions experience more fire during the intense droughts associated with El Niño periods, but Kalimantan’s responses are more extreme increasing during El Niño droughts and decreasing during La Niña conditions.
Most areas burned were forested in 1990 but have been converted to a majority of either degraded native vegetation (Kalimantan) or agricultural lands (Sumatra). This indicates that, although development follows upon intentional burning, these areas partially suppress landscape-level fire spread, potentially explaining the modest reductions in overall annual area burned between the first and second periods. Lower burning rates in the plantation areas of both Sumatra and Kalimantan may be indicating that, although burning initiated agricultural conversion, different management practices may be helping to suppress fires once crops are established. This could support the recent findings [55] that few fires originated from within plantations. Recurrent burning in Kalimantan, on the other hand, has been concentrated within non-managed shrublands, such as found in the drained peatlands of the now discontinued Mega Rice Project.
With a moist microclimate, low-flammability soils [56] and waterlogged conditions, fire in natural peat swamp forests should be exceedingly rare. However, drained peatlands and degraded forest canopies allow the peat to dry and change both the above-ground biomass and the peat itself into more flammable fuels. The shorter FRIs of Kalimantan’s forests indicate a greater threat from fire than in Sumatra, but both are experiencing relatively high levels of burning compared to natural conditions. This supports the contention that continued losses of degraded primary forest from 2002 to 2012 might be fire-related [57]. Burned forest area transitions to non-forest conditions indicate the critical role of fires in fostering LULC conversions.
Unlike burning in many other regions where natural causes, such as lightning, predominate, human-mediated activities drive altered fire regimes in Indonesian peatlands. However, the probability of burning is still strongly modulated by precipitation anomalies [58]. Repeated fires, that are increasingly prevalent in Kalimantan, impede natural forest succession, particularly when trees are replaced by shrubs and other vegetation. Vegetation that spreads widely by seed, such as the woody species Combretocarpus rotundatus [59], or ferns (Stenochlaena palustris and Blechnum indicum) act as invasive species that were not typically found in peat swamp forests, deflecting succession away from forest species (see Figure 7). The increasing prevalence of these degraded lands could lead to broader expansion of shrubs into degraded forests, even in the absence of additional fires. Natural reforestation may prove impossible unless more natural hydrological conditions and can be restored and fire prevalence greatly reduced.
Accurate burned area maps are critical for understanding LULC change and monitoring of land management efforts to reduce greenhouse gas emissions from Indonesia’s peatlands. Although the MODIS Burned Area product, MCDA164 has been validated globally, few of the validation sites were specifically located in Indonesian peatlands and it is likely burned areas are substantially under-reported. In assessing the limited sites visited earlier in 2013, 2014, and 2018 (some of them can be seen in Figure 7) it was evident that there were many fires that the MODIS burned area product failed to detect (manuscript in preparation). This is evident from the 2015 fire season, when fires resulted in huge greenhouse gas [47] and particulate emissions [60], exceeding those of previous years [3], but the MODIS burned area was less than the previous year. It is likely that the MODIS burned area product failed to detect many areas burned in 2015 due to obstruction by thick smoke from many fires.
To date, unfortunately, a long-term archive of official national burned area maps does not exist. Official national burned area maps have been provided since 2015 by the Ministry of Environment and Forestry Republic of Indonesia (http://geoportal.menlhk.go.id/arcgis/home/). For earlier years, total annual areas burned are only available as rough estimations [61], since field assessments are costly and many sites are inaccessible.
Remote sensing is the only practicable avenue for extensive burned area mapping in the peatlands. However, the capabilities of the optical-sensor satellites used for burned area mapping (e.g., [62,63]) are limited by high amounts of cloud coverage, frequently small burn sizes, and thick smoke during the worst fire years. Consequently, systematic and consistent information has not been available. However, leveraging of the archive of National Aeronautics and Space Administration (NASA) Earth observations and upcoming free multi-resolution data (e.g., Landsat, Sentinel-2, Sentinel-1) provide promising opportunities for addressing burned area mapping challenges. Several efforts to develop systematic information have been proposed using Landsat (e.g., [64,65]), Sentinel-2 (e.g., [66,67]) and Sentinel-1 [68]—an active sensor that is capable of penetrating the clouds that frequently impede LULC mapping in the tropics. The combined use of active and passive sensors may increase both spatial completeness and thematic detail [69] of coverage, allowing for more detailed characterization of fire impacts on both the vegetation and the underlying peat to complement burned area mapping efforts.

5. Conclusions

Nearly two decades of fire occurrences on the two biggest islands of Indonesia, Sumatra and Kalimantan, were synthesized from MODIS burned area products. We found Sumatra and Kalimantan experienced extensive fires with substantial amounts of recurring fire events. The initial LULC was predominantly forest, but most of these areas have been converted to other LULC types which experience different land management practices and rates of burning. Degraded shrublands have the most frequent rate of annual burning on both Sumatra and Kalimantan, precluding regeneration of native forests. Plantation areas are more established in Sumatra, but Kalimantan is experiencing rapid land conversion to plantations.
Our findings highlight the significant influence of LULC change in altering fire regimes in Indonesia. If the current rate of burning that is prevalent in Indonesia’s peatlands is not greatly reduced, within less than half of century, peat swamp forest will likely disappear from Sumatra and Kalimantan.

Author Contributions

Conceptualization, methodology, and formal analysis: Y.V. and M.A.C.; software, visualization, investigation, and writing—original draft preparation, Y.V.; supervision and writing—review and editing, M.A.C. All authors have read and agreed to the published version of the manuscript.

Funding

We gratefully acknowledge the support from NASA funding (Grants NNX13AP46G, NNX17AC95G and 80NSSC18K0235).

Acknowledgments

We thank two anonymous reviewers for their valuable comments. We would like to thank Jukka Miettinen (CRISP) for sharing the peatland LULC map data and Indonesian National Institute of Aeronautics and Space (LAPAN) for field images. Y.V. thank the Research and Innovation Science and Technology Project, Ministry of Research, Technology and Higher Education of the Republic of Indonesia for funded her Ph.D. We also acknowledge the use of data and imagery from LANCE FIRMS operated by NASA’s Earth Science Data and Information System (EOSDIS) with funding provided by NASA Headquarters.

Conflicts of Interest

The authors declare no conflict of interest.

Appendix A

Table A1. Total areas of Sumatran and Kalimantan peatland for land-cover maps dating to 1990, 2007, and 2015 (area in 1000 hectares).
Land Cover TypesSumatraKalimantan
199020072015199020072015
Forest
 Pristine peat swamp forest (PSF)3844.2285.0436.02861.999.2426.0
 Degraded PSF1468.32045.3956.51823.72760.92010.0
Non-forest (native-vegetated)
 Tall shrub/secondary forest343.1480.4468.5259.6712.51032.6
 Ferns/low shrub474.1742.2330.3236.5915.2443.9
 Smallholder area904.31880.12392.5302.3601.7680.9
 Industrial plantations25.51506.72405.50.1155.5809.6
Other land cover
 Cleared/burned area103.9185.0137.9101.4295.6128.4
 Seasonal water31.644.238.5169.8212.6220.5
 Built-up area0.54.97.71.22.63.8
 Mangrove29.428.329.022.521.520.8
 Water5.328.227.92.24.04.8
Table A2. Accumulated area burned from 2001 to 2018 in Sumatra and Kalimantan peatlands as related to its associated land cover (LC) for maps dating to 1990, 2007, and 2015 (area in 1000 hectares).
Land-Cover TypesSumatraKalimantan
199020072015199020072015
Forest
 Pristine peat swamp forest (PSF)1197.05.82.71053.40.87.2
 Degraded PSF744.6370.937.71248.7247.7116.4
Non-forest (native-vegetated)
 Tall shrub/secondary forest190.1281.9403.5311.7489.51101.8
 Ferns/low shrub415.4938.7377.8401.11401.7691.4
 Smallholder area138.9542.4883.6372.2752.2824.7
 Industrial plantations0.0404.3889.80.081.9656.7
Other land cover
 Cleared/burned area40.4176.9127.8112.5546.8115.1
 Seasonal water25.028.526.0109.588.293.9
 Built-up area0.00.00.10.00.00.6
 Mangrove2.52.52.61.01.01.0
 Water0.22.42.50.30.61.6
Table A3. Area burned in Sumatra and Kalimantan within two periods (2001–2007 and 2008–2018) and their related land cover types for maps dating to 1990 and 2007 (area in 1000 hectares; burning rate in 1000 hectares/year).
Land Cover (LC) TypesBurning from 2001 to 2007 Dating to the 1990 LC MapBurning from 2008 to 2018 Dating to the 2007 LC Map
SumatraKalimantanSumatraKalimantan
AreaBurning RateAreaBurning RateAreaBurning RateAreaBurning Rate
Forest
 Pristine peat swamp forest (PSF)483.074.3494.676.14.90.50.60.1
 Degraded PSF353.454.4537.582.7331.330.8184.217.1
Non-forest (native-vegetated)
 Tall shrub/secondary forest84.413.0160.624.7182.417.0253.623.6
 Ferns/low shrub192.229.6213.932.9488.045.4708.765.9
 Smallholder area70.110.8188.629.0270.825.2385.835.9
 Industrial plantations0.00.00.00.0152.014.122.22.1
Other land cover
 Cleared/burned area22.93.564.29.988.28.2295.627.5
 Seasonal water9.60.052.08.017.01.647.04.4
 Built-up area0.00.00.00.00.00.00.00.0
 Mangrove0.80.10.50.11.70.20.50.0
 Water0.10.00.12.21.10.10.00.1

Appendix B

Figure A1. Land-use and land-cover map of 1990 in peatlands of Sumatra and Kalimantan.
Remotesensing 12 00005 g0a1
Figure A2. Land-use and land-cover map of 2007 in peatlands of Sumatra and Kalimantan.
Remotesensing 12 00005 g0a2
Figure A3. Land-use and land-cover map of 2015 in peatlands of Sumatra and Kalimantan.
Remotesensing 12 00005 g0a3

References

  1. Page, S.; Rieley, J.; Hoscilo, A.; Spessa, A.; Weber, U. Current fire regimes, impacts and the likely changes–IV: tropical Southeast Asia. In Vegetation Fires and Global Change – Challenges for Concerted International Action A White Paper directed to the United Nations and International Organizations; Goldberg, J.G., Ed.; Kessel Publishing House: Remagen-Oberwinter, Germany, 2013. [Google Scholar]
  2. Field, R.D.; van der Werf, G.R.; Fanin, T.; Fetzer, E.J.; Fuller, R.; Jethva, H.; Levy, R.; Livesey, N.J.; Luo, M.; Torres, O. Indonesian fire activity and smoke pollution in 2015 show persistent nonlinear sensitivity to El Niño-induced drought. Proc. Natl. Acad. Sci. USA 2016, 113, 9204–9209. [Google Scholar] [CrossRef] [PubMed] [Green Version]
  3. GFED. 2015 Fire Season. Available online: http://www.globalfiredata.org/updates.html#2015_indonesia (accessed on 15 October 2019).
  4. World Bank. The Cost of Fire: An Economic Analysis of Indonesia’s 2015 Fire Crisis; The World Bank: Jakarta, Indonesia, 2016; Available online: http://pubdocs.worldbank.org/en/643781465442350600/Indonesia-forest-fire-notes.pdf (accessed on 10 October 2019).
  5. Dariah, A.; Agus, F. Distribution, properties, and carbon stock of Indonesian peatland. In Proceedings of the International Workshop on Evaluation and Sustainable Management of Soil Carbon Sequestration in Asian Countries, Bogor, Indonesia, 28–29 September 2010; pp. 187–204. [Google Scholar]
  6. Wahyunto, S.R.; Subagjo, H. Peta Luas Sebaran Lahan Gambut dan Kandungan Karbon di Kalimantan/Map of Peatland Distribution Area and Carbon Content in Kalimantan, 2000–2002; Wetlands International—Indonesia Programme & Wildlife Habitat Canada (WHC): Bogor, Indonesia, 2004. [Google Scholar]
  7. Wahyunto, S.R.; Subagjo, H. Peta Luas Sebaran Lahan Gambut dan Kandungan Karbon di Pulau Sumatera/Maps of Area of Peatland Distribution and Carbon Content in Sumatera, 1990–2002; Wetlands International—Indonesia Programme & Wildlife Habitat Canada (WHC): Bogor, Indonesia, 2003. [Google Scholar]
  8. Xu, J.; Morris, P.J.; Liu, J.; Holden, J. PEATMAP: Refining estimates of global peatland distribution based on a meta-analysis. Catena 2018, 160, 134–140. [Google Scholar] [CrossRef] [Green Version]
  9. Chokkalingam, U.; Permana, R.P.; Kurniawan, I.; Mannes, J.; Darmawan, A.; Khususyiah, N.; Susanto, R.H. Community fire use, resource change, and livelihood impacts: The downward spiral in the wetlands of southern Sumatra. Mitig. Adapt. Strateg. Glob. Chang. 2007, 12, 75–100. [Google Scholar] [CrossRef]
  10. Dennis, R.A.; Mayer, J.; Applegate, G.; Chokkalingam, U.; Colfer, C.J.P.; Kurniawan, I.; Lachowski, H.; Maus, P.; Permana, R.P.; Ruchiat, Y. Fire, people and pixels: Linking social science and remote sensing to understand underlying causes and impacts of fires in Indonesia. Hum. Ecol. 2005, 33, 465–504. [Google Scholar] [CrossRef]
  11. Murdiyarso, D.; Adiningsih, E.S. Climate anomalies, Indonesian vegetation fires and terrestrial carbon emissions. Mitig. Adapt. Strateg. Glob. Chang. 2007, 12, 101–112. [Google Scholar] [CrossRef]
  12. Miettinen, J.; Hyer, E.; Chia, A.S.; Kwoh, L.K.; Liew, S.C. Detection of vegetation fires and burnt areas by remote sensing in insular Southeast Asian conditions: Current status of knowledge and future challenges. Int. J. Remote Sens. 2013, 34, 4344–4366. [Google Scholar] [CrossRef]
  13. Langner, A.; Siegert, F. Spatiotemporal fire occurrence in Borneo over a period of 10 years. Glob. Chang. Biol. 2009, 15, 48–62. [Google Scholar] [CrossRef]
  14. Miettinen, J.; Shi, C.; Liew, S.C. Influence of peatland and land cover distribution on fire regimes in insular Southeast Asia. Reg. Environ. Chang. 2011, 11, 191–201. [Google Scholar] [CrossRef]
  15. Numata, I.; Cochrane, M.A.; Galvão, L.S. Analyzing the impacts of frequency and severity of forest fire on the recovery of disturbed forest using Landsat time series and EO-1 Hyperion in the Southern Brazilian Amazon. Earth Interact. 2011, 15, 1–17. [Google Scholar] [CrossRef] [Green Version]
  16. Barbosa, R.I.; Fearnside, P.M. Fire frequency and area burned in the Roraima savannas of Brazilian Amazonia. For. Ecol. Manag. 2005, 204, 371–384. [Google Scholar] [CrossRef]
  17. Graham, L.L.; Giesen, W.; Page, S.E. A common-sense approach to tropical peat swamp forest restoration in Southeast Asia. Restor. Ecol. 2017, 25, 312–321. [Google Scholar] [CrossRef]
  18. Tacconi, L.; Moore, P.F.; Kaimowitz, D. Fires in tropical forests—What is really the problem? Lessons from Indonesia. Mitig. Adapt. Strateg. Glob. Chang. 2007, 12, 55–66. [Google Scholar] [CrossRef]
  19. Knorr, W.; Kaminski, T.; Arneth, A.; Weber, U. Impact of human population density on fire frequency at the global scale. Biogeosciences 2014, 11, 1085–1102. [Google Scholar] [CrossRef] [Green Version]
  20. Konecny, K.; Ballhorn, U.; Navratil, P.; Jubanski, J.; Page, S.E.; Tansey, K.; Hooijer, A.; Vernimmen, R.; Siegert, F. Variable carbon losses from recurrent fires in drained tropical peatlands. Glob. Chang. Biol. 2016, 22, 1469–1480. [Google Scholar] [CrossRef] [PubMed] [Green Version]
  21. Gaveau, D.L.; Sheil, D.; Salim, M.A.; Arjasakusuma, S.; Ancrenaz, M.; Pacheco, P.; Meijaard, E. Rapid conversions and avoided deforestation: Examining four decades of industrial plantation expansion in Borneo. Sci. Rep. 2016, 6, 32017. [Google Scholar] [CrossRef]
  22. Hoscilo, A.; Page, S.E.; Tansey, K.J.; Rieley, J.O. Effect of repeated fires on land-cover change on peatland in southern Central Kalimantan, Indonesia, from 1973 to 2005. Int. J. Wildland Fire 2011, 20, 578–588. [Google Scholar] [CrossRef]
  23. Cochrane, M.A. Synergistic interactions between habitat fragmentation and fire in evergreen tropical forests. Conserv. Biol. 2001, 15, 1515–1521. [Google Scholar] [CrossRef]
  24. Siegert, F.; Ruecker, G.; Hinrichs, A.; Hoffmann, A. Increased damage from fires in logged forests during droughts caused by El Nino. Nature 2001, 414, 437–440. [Google Scholar] [CrossRef]
  25. Hościło, A. Fire Regime, Vegetation Dynamics and Land Cover Change in Tropical Peatland, Indonesia. Ph.D. Thesis, University of Leicester, Leicester, UK, 2009. [Google Scholar]
  26. Wagner, C.V. Age-class distribution and the forest fire cycle. Can. J. For. Res. 1978, 8, 220–227. [Google Scholar] [CrossRef]
  27. Cochrane, M.A.; Ryan, K.C. Fire and fire ecology: Concepts and principles. In Tropical Fire Ecology; Springer: Berlin/Heidelberg, Germany, 2009; pp. 25–62. [Google Scholar]
  28. Mouillot, F.; Schultz, M.G.; Yue, C.; Cadule, P.; Tansey, K.; Ciais, P.; Chuvieco, E. Ten years of global burned area products from spaceborne remote sensing—A review: Analysis of user needs and recommendations for future developments. Int. J. Appl. Earth Obs. Geoinf. 2014, 26, 64–79. [Google Scholar] [CrossRef] [Green Version]
  29. Roy, D.P.; Boschetti, L. Southern Africa validation of the MODIS, L3JRC, and GlobCarbon burned-area products. IEEE Trans. Geosci. Remote Sens. 2009, 47, 1032–1044. [Google Scholar] [CrossRef]
  30. Tsela, P.; Wessels, K.; Botai, J.; Archibald, S.; Swanepoel, D.; Steenkamp, K.; Frost, P. Validation of the two standard MODIS satellite burned-area products and an empirically-derived merged product in South Africa. Remote Sens. 2014, 6, 1275–1293. [Google Scholar] [CrossRef] [Green Version]
  31. Giglio, L.; Schroeder, W.; Justice, C.O. The collection 6 MODIS active fire detection algorithm and fire products. Remote Sens. Environ. 2016, 178, 31–41. [Google Scholar] [CrossRef] [Green Version]
  32. Bond, W.J.; Keeley, J.E. Fire as a global ‘herbivore’: The ecology and evolution of flammable ecosystems. Trends Ecol. Evol. 2005, 20, 387–394. [Google Scholar] [CrossRef] [PubMed]
  33. Brown, J.K. Introduction and Fire Regimes. In Wildland Fire in Ecosystems: Effects of Fire on Flora; Gen. Tech. Rep. RMRS-GTR-42; Brown, J.K., Smith, J.K., Eds.; US Department of Agriculture, Forest Service, Rocky Mountain Research Station: Ogden, UT, USA, 2000; Volume 2, pp. 1–6. [Google Scholar]
  34. Júnior, A.C.P.; Oliveira, S.L.; Pereira, J.M.; Turkman, M.A.A. Modelling fire frequency in a Cerrado savanna protected area. PLoS ONE 2014, 9, e102380. [Google Scholar]
  35. Steel, Z.L.; Safford, H.D.; Viers, J.H. The fire frequency-severity relationship and the legacy of fire suppression in California forests. Ecosphere 2015, 6, 1–23. [Google Scholar] [CrossRef]
  36. Oliveira, S.L.; Pereira, J.M.; Carreiras, J.M. Fire frequency analysis in Portugal (1975–2005), using Landsat-based burnt area maps. Int. J. Wildland Fire 2012, 21, 48–60. [Google Scholar] [CrossRef]
  37. Oliveira, S.L.; Turkman, M.A.; Pereira, J.M. An analysis of fire frequency in tropical savannas of northern Australia, using a satellite-based fire atlas. Int. J. Wildland Fire 2013, 22, 479–492. [Google Scholar] [CrossRef]
  38. Rogeau, M.P.; Armstrong, G.W. Quantifying the effect of elevation and aspect on fire return intervals in the Canadian Rocky Mountains. For. Ecol. Manag. 2017, 384, 248–261. [Google Scholar] [CrossRef]
  39. Johnson, E.A.; Gutsell, S.L. Fire frequency models, methods and interpretations. Adv. Ecol. Res. 1994, 25, 239–287. [Google Scholar]
  40. Ritung, S.; Wahyunto, N.K.; Sukarman, H.; Suparto, T.C. Peta Lahan Gambut Indonesia Skala 1:250,000; Balai Besar Penelitian dan Pengembangan Sumberdaya Lahan Pertanian, Badan Penelitian dan Pengembangan Pertanian: Bogor, Indonesia, 2011. [Google Scholar]
  41. Miettinen, J.; Hooijer, A.; Vernimmen, R.; Liew, S.C.; Page, S.E. From carbon sink to carbon source: Extensive peat oxidation in insular Southeast Asia since 1990. Environ. Res. Lett. 2017, 12, 024014. [Google Scholar] [CrossRef]
  42. Miettinen, J.; Shi, C.; Liew, S.C. Land cover distribution in the peatlands of Peninsular Malaysia, Sumatra and Borneo in 2015 with changes since 1990. Glob. Ecol. Conserv. 2016, 6, 67–78. [Google Scholar] [CrossRef] [Green Version]
  43. Murdiyarso, D.; Lebel, L.; Gintings, A.; Tampubolon, S.; Heil, A.; Wasson, M. Policy responses to complex environmental problems: Insights from a science—policy activity on transboundary haze from vegetation fires in Southeast Asia. Agric. Ecosyst. Environ. 2004, 104, 47–56. [Google Scholar] [CrossRef] [Green Version]
  44. Margono, B.A.; Turubanova, S.; Zhuravleva, I.; Potapov, P.; Tyukavina, A.; Baccini, A.; Goetz, S.; Hansen, M.C. Mapping and monitoring deforestation and forest degradation in Sumatra (Indonesia) using Landsat time series data sets from 1990 to 2010. Environ. Res. Lett. 2012, 7, 034010. [Google Scholar] [CrossRef]
  45. Miettinen, J.; Hooijer, A.; Shi, C.; Tollenaar, D.; Vernimmen, R.; Liew, S.C.; Malins, C.; Page, S.E. Extent of industrial plantations on Southeast Asian peatlands in 2010 with analysis of historical expansion and future projections. GCB Bioenergy 2012, 4, 908–918. [Google Scholar] [CrossRef] [Green Version]
  46. Page, S.E.; Siegert, F.; Rieley, J.O.; Boehm, H.D.; Jaya, A.; Limin, S. The amount of carbon released from peat and forest fires in Indonesia during 1997. Nature 2002, 420, 61–65. [Google Scholar] [CrossRef]
  47. Stockwell, C.E.; Jayarathne, T.; Cochrane, M.A.; Ryan, K.C.; Putra, E.I.; Saharjo, B.H.; Nurhayati, A.D.; Albar, I.; Blake, D.R.; Simpson, I.J. Field measurements of trace gases and aerosols emitted by peat fires in Central Kalimantan, Indonesia, during the 2015 El Niño. Atmos. Chem. Phys. 2016, 16, 11711–11732. [Google Scholar] [CrossRef] [Green Version]
  48. Ballhorn, U.; Siegert, F.; Mason, M.; Limin, S. Derivation of burn scar depths and estimation of carbon emissions with LIDAR in Indonesian peatlands. Proc. Natl. Acad. Sci. USA 2009, 106, 21213–21218. [Google Scholar] [CrossRef] [Green Version]
  49. Putra, E.I.; Hayasaka, H.; Takahashi, H.; Usup, A. Recent peat fire activity in the mega rice project area Central Kalimantan Indonesia. J. Disaster Res. 2008, 3, 334–341. [Google Scholar] [CrossRef]
  50. Jaenicke, J.; Englhart, S.; Siegert, F. Monitoring the effect of restoration measures in Indonesian peatlands by radar satellite imagery. J Environ. Manag. 2011, 92, 630–638. [Google Scholar] [CrossRef]
  51. The Climate Prediction Center/National Weather Service. Historical El Nino/La Niña Episodes (1950–present). Available online: https://origin.cpc.ncep.noaa.gov/products/analysis_monitoring/ensostuff/ONI_v5.php (accessed on 19 November 2019).
  52. Giglio, L.; Justice, C.; Boschetti, L.; Roy, D. MCD64A1 MODIS/Terra+Aqua Burned Area Monthly L3 Global 500m SIN Grid V006; NASA EOSDIS Land Processes DAAC, USGS Earth Resources Observation and Science (EROS) Center, Sioux Falls, South Dakota: Garretson, SD, USA, 2015. [CrossRef]
  53. Miettinen, J.; Liew, S.C. Status of peatland degradation and development in Sumatra and Kalimantan. Ambio 2010, 39, 394–401. [Google Scholar] [CrossRef] [Green Version]
  54. Goldammer, J.G.; Seibert, B. The impact of droughts and forest fires on tropical lowland rain forest of East Kalimantan. In Fire in the Tropical Biota; Springer: Berlin/Heidelberg, Germany, 1990; pp. 11–31. [Google Scholar]
  55. Cattau, M.E.; Harrison, M.E.; Shinyo, I.; Tungau, S.; Uriarte, M.; DeFries, R. Sources of anthropogenic fire ignitions on the peat-swamp landscape in Kalimantan, Indonesia. Glob. Environ. Chang. 2016, 39, 205–219. [Google Scholar] [CrossRef]
  56. Turetsky, M.R.; Benscoter, B.; Page, S.; Rein, G.; Van Der Werf, G.R.; Watts, A. Global vulnerability of peatlands to fire and carbon loss. Nat. Geosci. 2015, 8, 11–14. [Google Scholar] [CrossRef]
  57. Margono, B.A.; Potapov, P.V.; Turubanova, S.; Stolle, F.; Hansen, M.C. Primary forest cover loss in Indonesia over 2000–2012. Nat. Clim. Chang. 2014, 4, 730–735. [Google Scholar] [CrossRef]
  58. Van der Werf, G. Climate regulation of fire emissions and deforestation in equatorial Asia. Proc. Natl. Acad. Sci. USA. 2008, 105, 20350–20355. [Google Scholar] [CrossRef] [Green Version]
  59. Blackham, G.V.; Webb, E.L.; Corlett, R.T. Natural regeneration in a degraded tropical peatland, Central Kalimantan, Indonesia: Implications for forest restoration. For. Ecol. Manag. 2014, 324, 8–15. [Google Scholar] [CrossRef]
  60. Jayarathne, T.; Stockwell, C.E.; Gilbert, A.A.; Daugherty, K.; Cochrane, M.A.; Ryan, K.C.; Putra, E.I.; Saharjo, B.H.; Nurhayati, A.D.; Albar, I.J.A.C.; et al. Chemical characterization of fine particulate matter emitted by peat fires in Central Kalimantan, Indonesia, during the 2015 El Niño. Atmos. Chem. Phys. 2018, 18, 2585. [Google Scholar] [CrossRef] [Green Version]
  61. MoEF. Sipongi, Karhutla Sistem. Available online: http://sipongi.menlhk.go.id/hotspot/luas_kebakaran (accessed on 20 January 2019).
  62. Chuvieco, E.; Yue, C.; Heil, A.; Mouillot, F.; Alonso-Canas, I.; Padilla, M.; Pereira, J.M.; Oom, D.; Tansey, K. A new global burned area product for climate assessment of fire impacts. Glob. Ecol. Biogeogr. 2016, 25, 619–629. [Google Scholar] [CrossRef] [Green Version]
  63. Giglio, L.; Randerson, J.T.; Werf, G.R. Analysis of daily, monthly, and annual burned area using the fourth-generation global fire emissions database (GFED4). J. Geophys. Res. Biogeosci. 2013, 118, 317–328. [Google Scholar] [CrossRef] [Green Version]
  64. Hawbaker, T.J.; Vanderhoof, M.K.; Beal, Y.J.; Takacs, J.D.; Schmidt, G.L.; Falgout, J.T.; Williams, B.; Fairaux, N.M.; Caldwell, M.K.; Picotte, J.J. Mapping burned areas using dense time-series of Landsat data. Remote Sens. Environ. 2017, 198, 504–522. [Google Scholar] [CrossRef]
  65. Boschetti, L.; Roy, D.P.; Justice, C.O.; Humber, M.L. MODIS—Landsat fusion for large area 30 m burned area mapping. Remote Sens. Environ. 2015, 161, 27–42. [Google Scholar] [CrossRef]
  66. Roteta, E.; Bastarrika, A.; Padilla, M.; Storm, T.; Chuvieco, E. Development of a Sentinel-2 burned area algorithm: Generation of a small fire database for sub-Saharan Africa. Remote Sens. Environ. 2019, 222, 1–17. [Google Scholar] [CrossRef]
  67. Roy, D.P.; Huang, H.; Boschetti, L.; Giglio, L.; Yan, L.; Zhang, H.H.; Li, Z.J. Landsat-8 and Sentinel-2 burned area mapping-A combined sensor multi-temporal change detection approach. Remote Sens. Environ. 2019, 231, 111254. [Google Scholar] [CrossRef]
  68. Lohberger, S.; Stängel, M.; Atwood, E.C.; Siegert, F. Spatial evaluation of Indonesia’s 2015 fire affected area and estimated carbon emissions using Sentinel-1. Glob. Chang. Biol. 2017. [Google Scholar] [CrossRef]
  69. Reiche, J.; Verbesselt, J.; Hoekman, D.; Herold, M. Fusing Landsat and SAR time series to detect deforestation in the tropics. Remote Sens. Environ. 2015, 156, 276–293. [Google Scholar] [CrossRef]
Figure 1. The study site (light grey) and peatland distribution (brown color).
Remotesensing 12 00005 g001
Figure 2. Spatial distribution of all burned areas of Sumatra and Kalimantan (including both the peatlands and non-peatlands). The map shows how frequently an area was affected by burning from 2001 to 2007 (represented by the reddish color) and from 2008 to 2018 (bluish color) regardless of the LULC types (see the maps in the Appendix B, Figure A1, Figure A2 and Figure A3). Some areas burned once, twice or more for each period. The subsets are the three areas most prone to experiencing high-frequency burning: Riau, South Sumatra, and Central Kalimantan.
Remotesensing 12 00005 g002
Figure 3. Spatial distribution of burned areas in peatlands of Sumatra and Kalimantan. The map shows how frequently an area was affected by burning from 2001 to 2007 (represented by the reddish color) and from 2008 to 2018 (bluish color) in peatlands only regardless of the land-use and land-cover types. Some areas burned once, twice or more for each period. The subsets are the three areas most prone to experiencing high-frequency burning: Riau, South Sumatra, and Central Kalimantan. The black circle in the subset of Central Kalimantan shows the Mega Rice Project area [22].
Remotesensing 12 00005 g003
Figure 4. (a) Daily accumulated Moderate Resolution Imaging Spectroradiometer (MODIS) active fire in Sumatran and Kalimantan peatlands from July 2001 to June 2018 (confidence level >30%). Background color shows the El-Niño (orange) and La Niña (cyan) events; (b) annual accumulated active fire and inter-annual burned area variability. A single annual peak burning period is evident in nearly every year during the dry season, between July–October, in Kalimantan. In Sumatra, with peatlands spanning the Equator and some regions having two dry seasons, the patterns are less evident. High rates of daily accumulation hotspots and longer seasonal persistence occur during El-Niño years (2002, 2006, 2009, and 2015) and other periods of prolonged drought. Kalimantan’s areas burned exceeded those in Sumatra except for the La Niña years of 2010 and 2016, suggesting higher sensitivity of Kalimantan to dry El Niño and wet La Niña conditions. Although less highly correlated in Sumatra, high amounts of area burned (above the annual average, showing by dotted lines) occurred during strong El Niño events in both regions.
Remotesensing 12 00005 g004
Figure 5. Proportion of all area burned (a) and areas with recurrent burning (>2 fires) (b) within three burning periods (2001–2007, 2008–2018, and 2001–2018) as related to associated LULC for maps dating to 1990, 2007, and 2015 (a); While the majority of burning from 2001 to 2018 has occurred in areas that were forest in 1990, almost none of those areas are forests today, with progressively more being converted to either agriculture or non-forest vegetation. Aggregated LULC classes: forest (both pristine and degraded peat swamp forest); native-vegetated (ferns/low shrubs, tall shrubs/secondary forest); agricultural areas (smallholder and industrial plantations areas); other LULC types.
Remotesensing 12 00005 g005
Figure 6. Annual burning rate in Sumatra and Kalimantan within two burning periods (2001–2007 and 2008–2018) in non-forest (native-vegetated and agricultural areas).
Remotesensing 12 00005 g006
Figure 7. Examples of various LULC types, burning situation, and regrowth after burning in the study regions. Burned areas in forest (a) and young plantation (b) (Photos were taken during survey in Riau by LAPAN in 2013 and 2014); (c) and (d) are seasonal water sites, with grass/ferns that flood during the rainy season; Peatland regrowth in areas with frequent burning (e) and in forest (f). Photos were taken during our survey in Central Kalimantan in August 2018.
Remotesensing 12 00005 g007
Figure 8. Annual fire-return intervals (FRI) in peatlands of Sumatra and Kalimantan based on the annual percentage of areas burned in 2001–2007, 2008–2018, and 2001–2018. The shortest forest FRI appeared in Kalimantan peatlands for both forest and non-forest.
Remotesensing 12 00005 g008
Table 1. Description of land-use and land-cover (LULC) types in this study.
LULC GroupsLULC TypesDescription
ForestPristine peat swamp forest (PSF)PSF with no clear signs of human intervention. Dominant tree species include Dipterocarp sp., Gonysylus sp. and Dyera sp.
Degraded PSFPSF with clear evidence of disturbance (e.g., logging), typically in the form of logging tracks and canals and/or opened canopy. In addition to PSF species, tall shrubs, such as Melaleuca leucadendron are also prevalent.
Native-vegetated areasTall shrub/secondary forestShrubland or secondary forest with an average height above 2 m. Dominant species include Melaleuca leucadendron and Macaranga sp.
Ferns/low shrubFerns and grass or shrubland with average height less than 2 m. Dominant species include Stenochlaena palustris, Blechnum indicum, Pandanus helicopus, and Melastoma malabathricum.
Agricultural areasSmallholder areaMosaic of housing, agricultural fields, plantations, gardens, fallow shrubland, etc. Note that the name of the class refers to the patchy landscape patterns, typical in smallholder dominated areas but the actual land tenure of the areas is unknown.
Industrial plantationsLarge-scale industrial plantations assumed to have been already planted with the plantation species. Mainly oil palm (Elaeis guineensis) and pulp wood (Acacia sp.).
Other LULC typesWaterPermanent water bodies. This class also includes fish and crab farming ponds.
Seasonal waterAreas that are inundated part of the year. Typically, either extremely degraded areas or flood zones of rivers. This class also includes smallholder mining sites.
Built-up areaTowns, industrial areas, etc.
Cleared/burned areaOpen area with no vegetation, including recently burned areas.
MangroveAreas determined to be mangrove forest in the satellite image interpretation although located within peatland areas of maps used in this study.
Source: [53].
Table 2. Area affected by burning, total area burned, annual percentage area burned (APAB), and annual fire-return intervals (FRI) in peatlands and non-peatlands Sumatra and Kalimantan within three periods. The areas were calculated as percentage areas burned respective to each region. The difference of areas burned and fire frequency is presented for (1) all Sumatran and Kalimantan land, (2) peatlands only, and (3) in non-peatland only.
Percentage of Area Burned and Surface Affected FiresSumatraKalimantanKalimantan and Sumatra
2001–20072008–20182001–20182001–20072008–20182001–20182001–20072008–20182001–2018
Surface area affected fires (%)
• Both the peatlands and non-peatlands4.84.87.96.55.49.45.75.18.7
• Peatlands only13.415.923.619.320.828.616.018.125.8
1. All burned areas including both the peatlands and non-peatlands
Accumulated area burned (%)6.16.312.49.07.716.67.67.014.6
APAB (%)0.90.60.71.40.71.01.20.70.8
FRI (years)1071701397214010485153118
2.All burned areas in the peatlands only
Accumulated area burned (%)16.921.438.329.532.762.322.526.449.0
• Burned once 10.411.814.712.113.013.511.212.414.1
• Burned twice4.96.010.99.69.512.87.07.611.7
• Burned more than twice * 1.63.612.77.810.236.04.36.523.1
APAB (%)2.62.02.24.53.03.63.52.52.8
FRI (years)385045223328294135
APAB in recurring * fires only (%)1.41.51.94.02.93.33.02.32.7
FRI in recurring * fires only (years)706552253530344437
3. All burned areas in the non-peatlands only
Accumulated area burned (%)4.13.77.86.54.611.15.44.29.6
APAB (%)0.60.30.51.00.40.60.80.40.6
FRI (years)157294221100233155120257180
Total area of peatlands and non-peatlands: Sumatra: 47.6 Mha, Kalimantan: 53.6 Mha; Total peatlands area: Sumatra: 7.2 Mha, Kalimantan: 5.8 Mha. Note: * recurring events between the time periods make the sum of areas burned only once smaller and the areas burned more than twice larger than simple addition of values from the two time periods.

