Potential of Night-Time Lights to Measure Regional Inequality
Abstract
1. Introduction
2. Study Area and Data
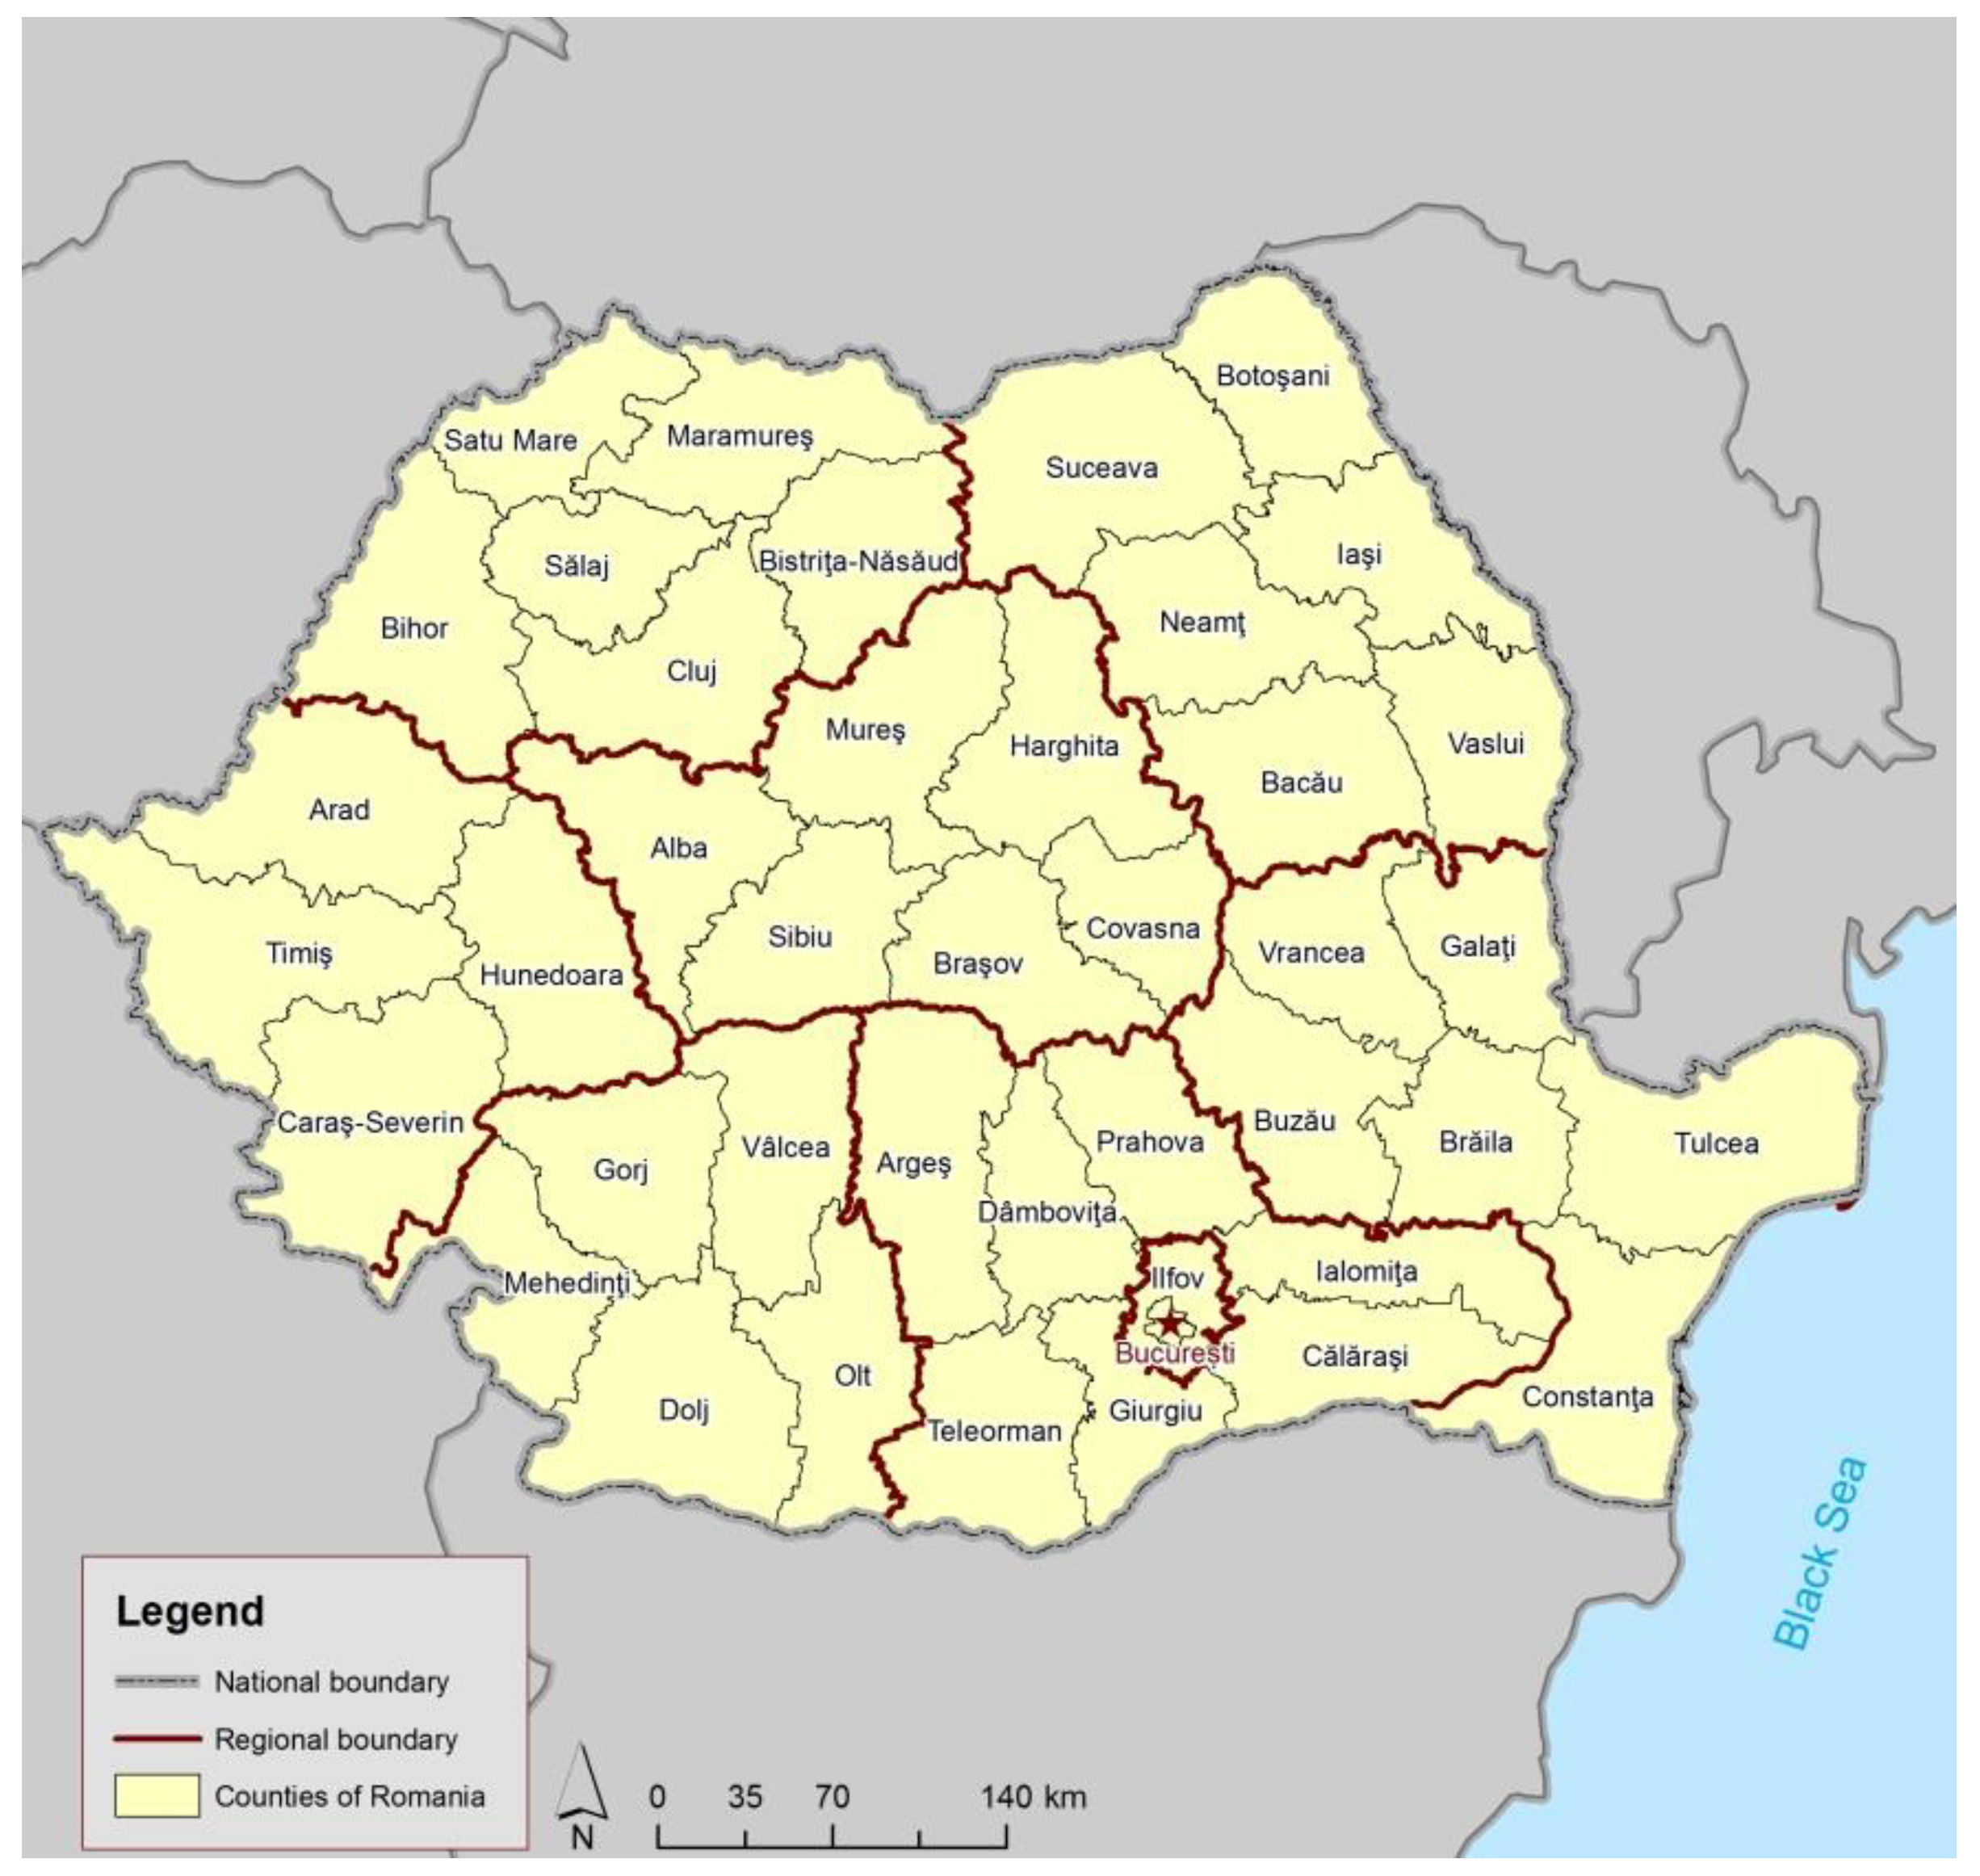
2.1. Study Area
2.2. Data Collection
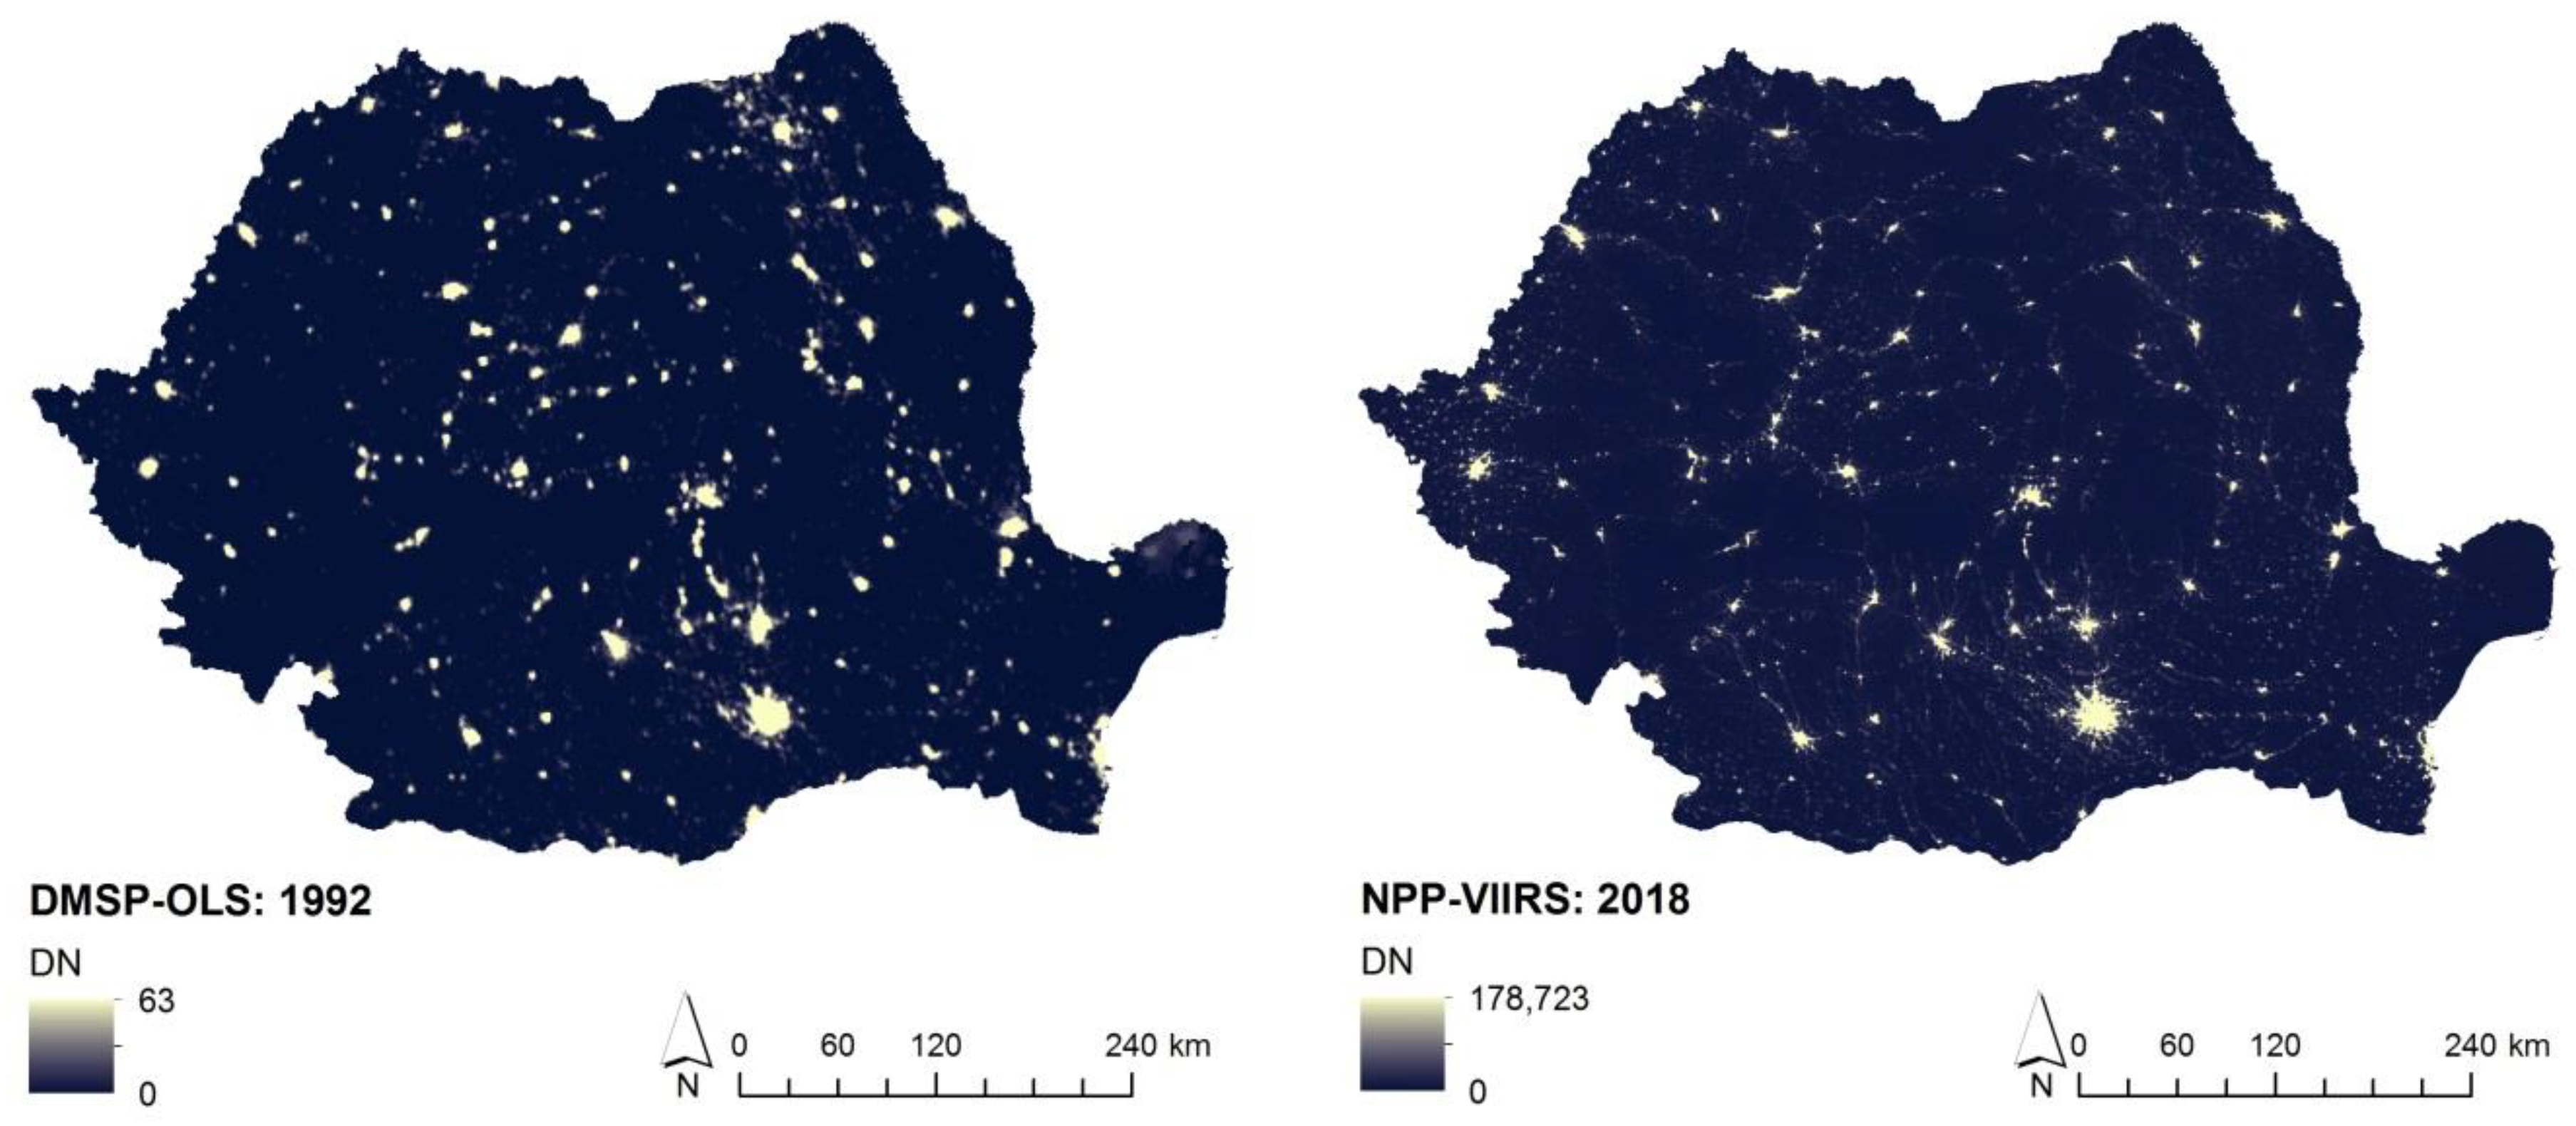
2.2.1. DMSP Night-Time Light Data
2.2.2. NPP-VIIRS Night-Time Light Imagery
2.2.3. Demographic and Economic Data
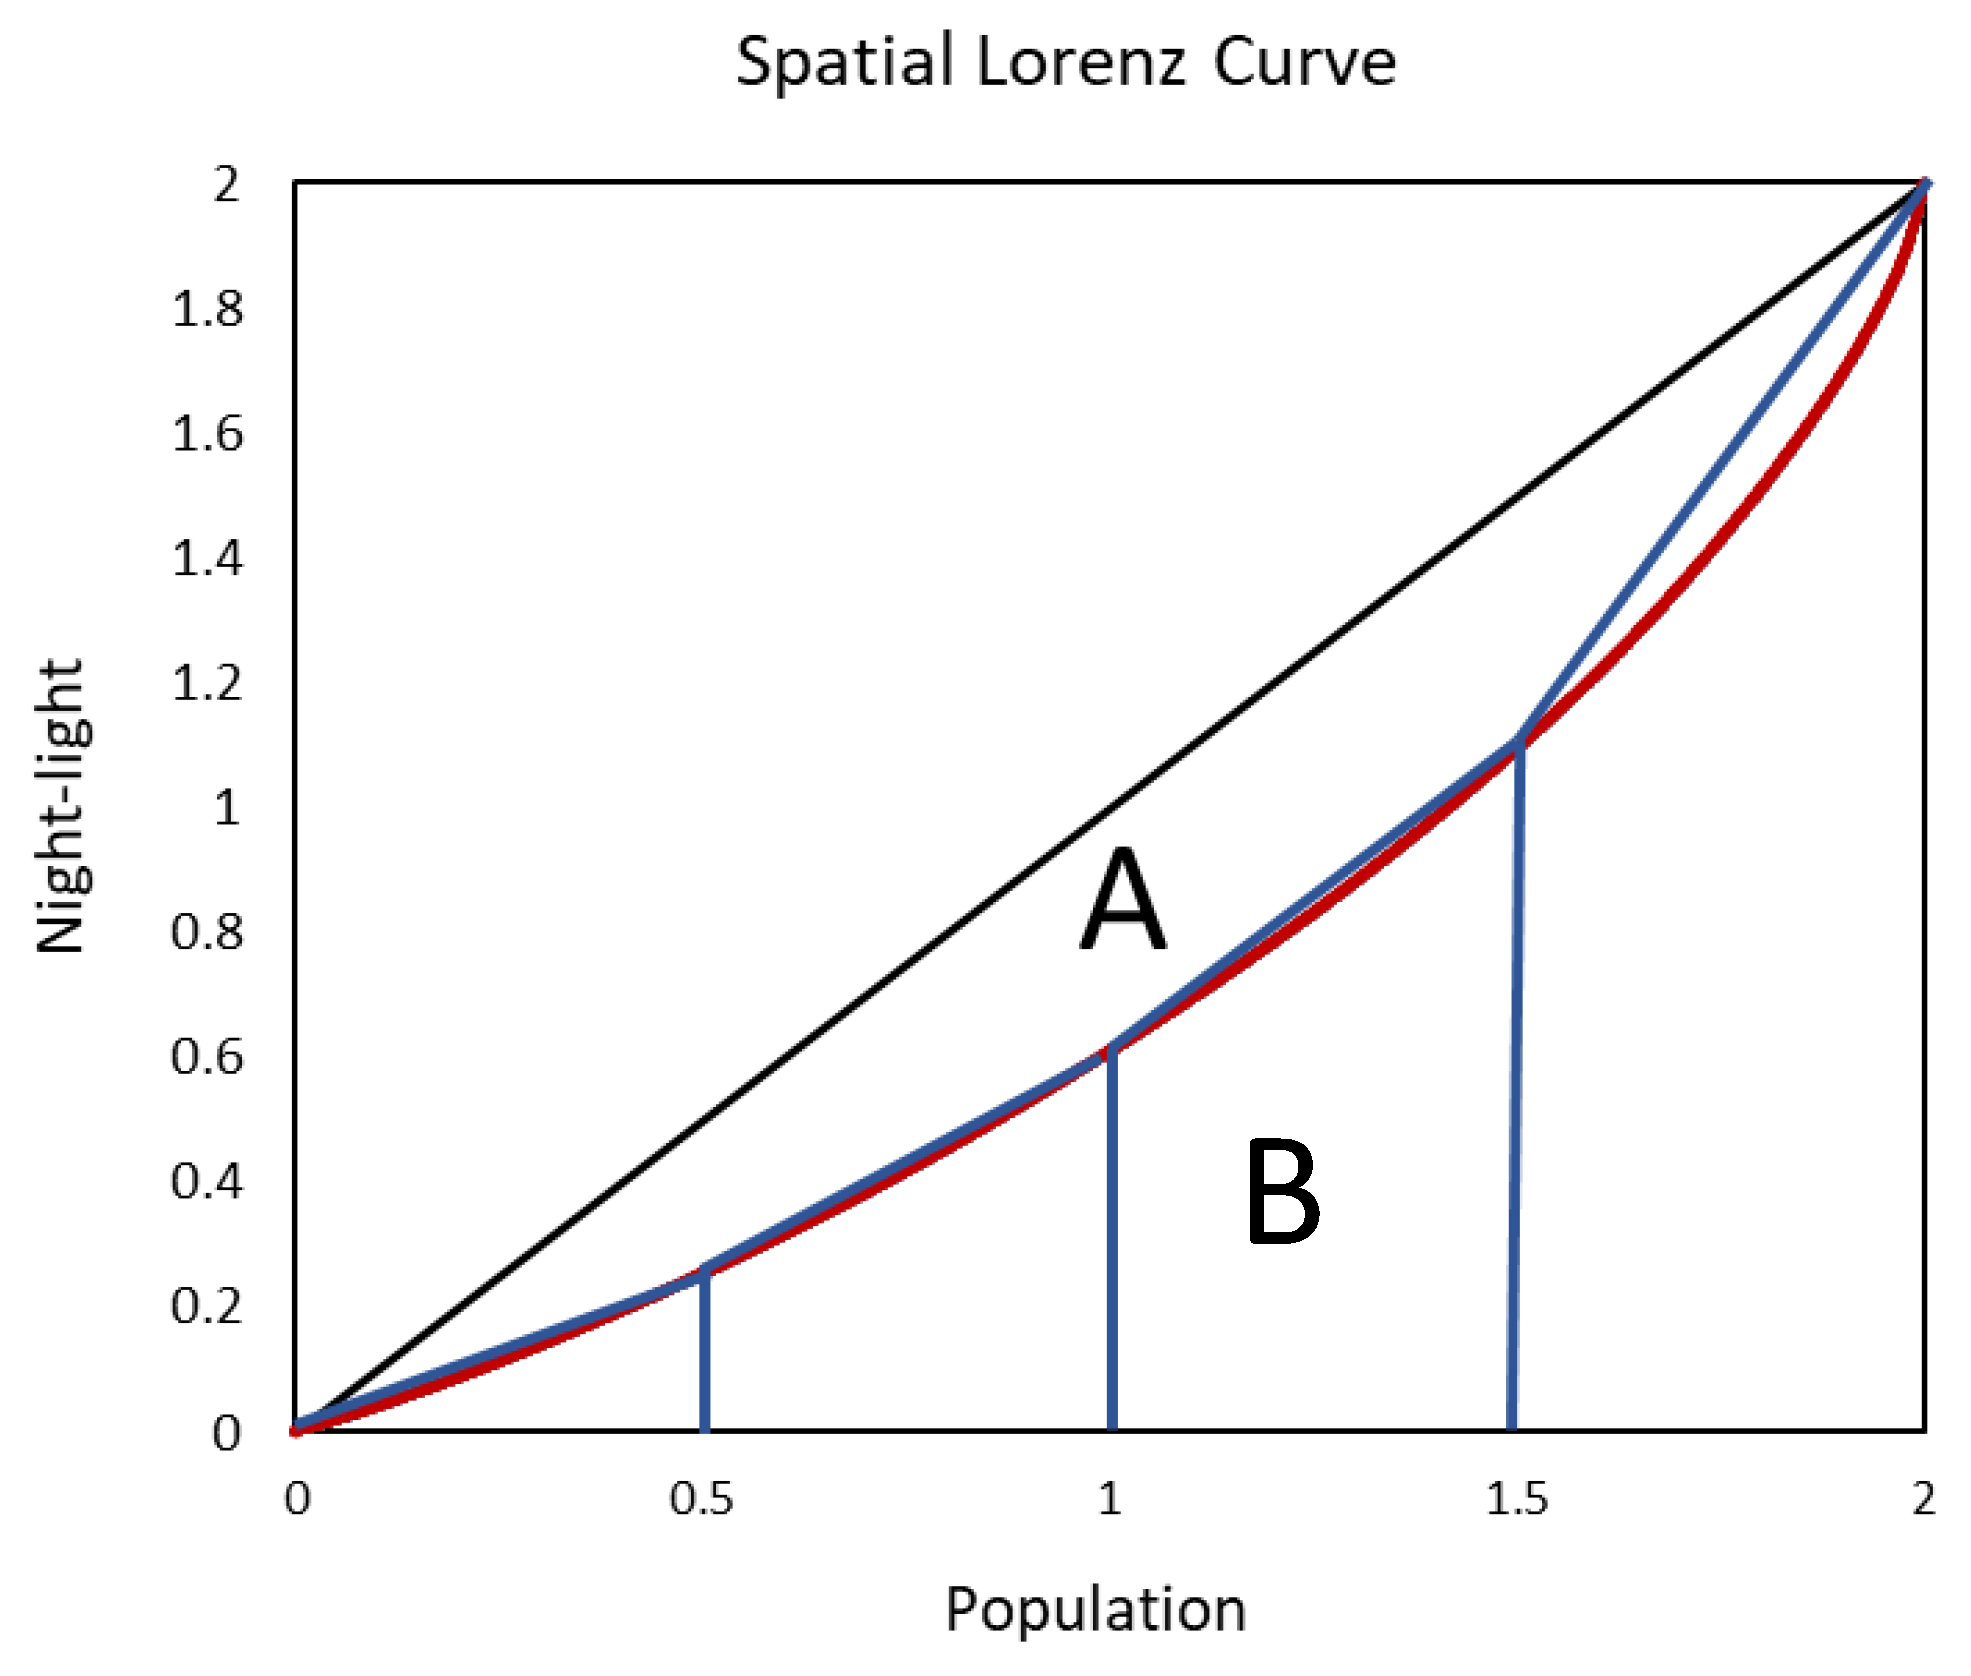
3. Methodology
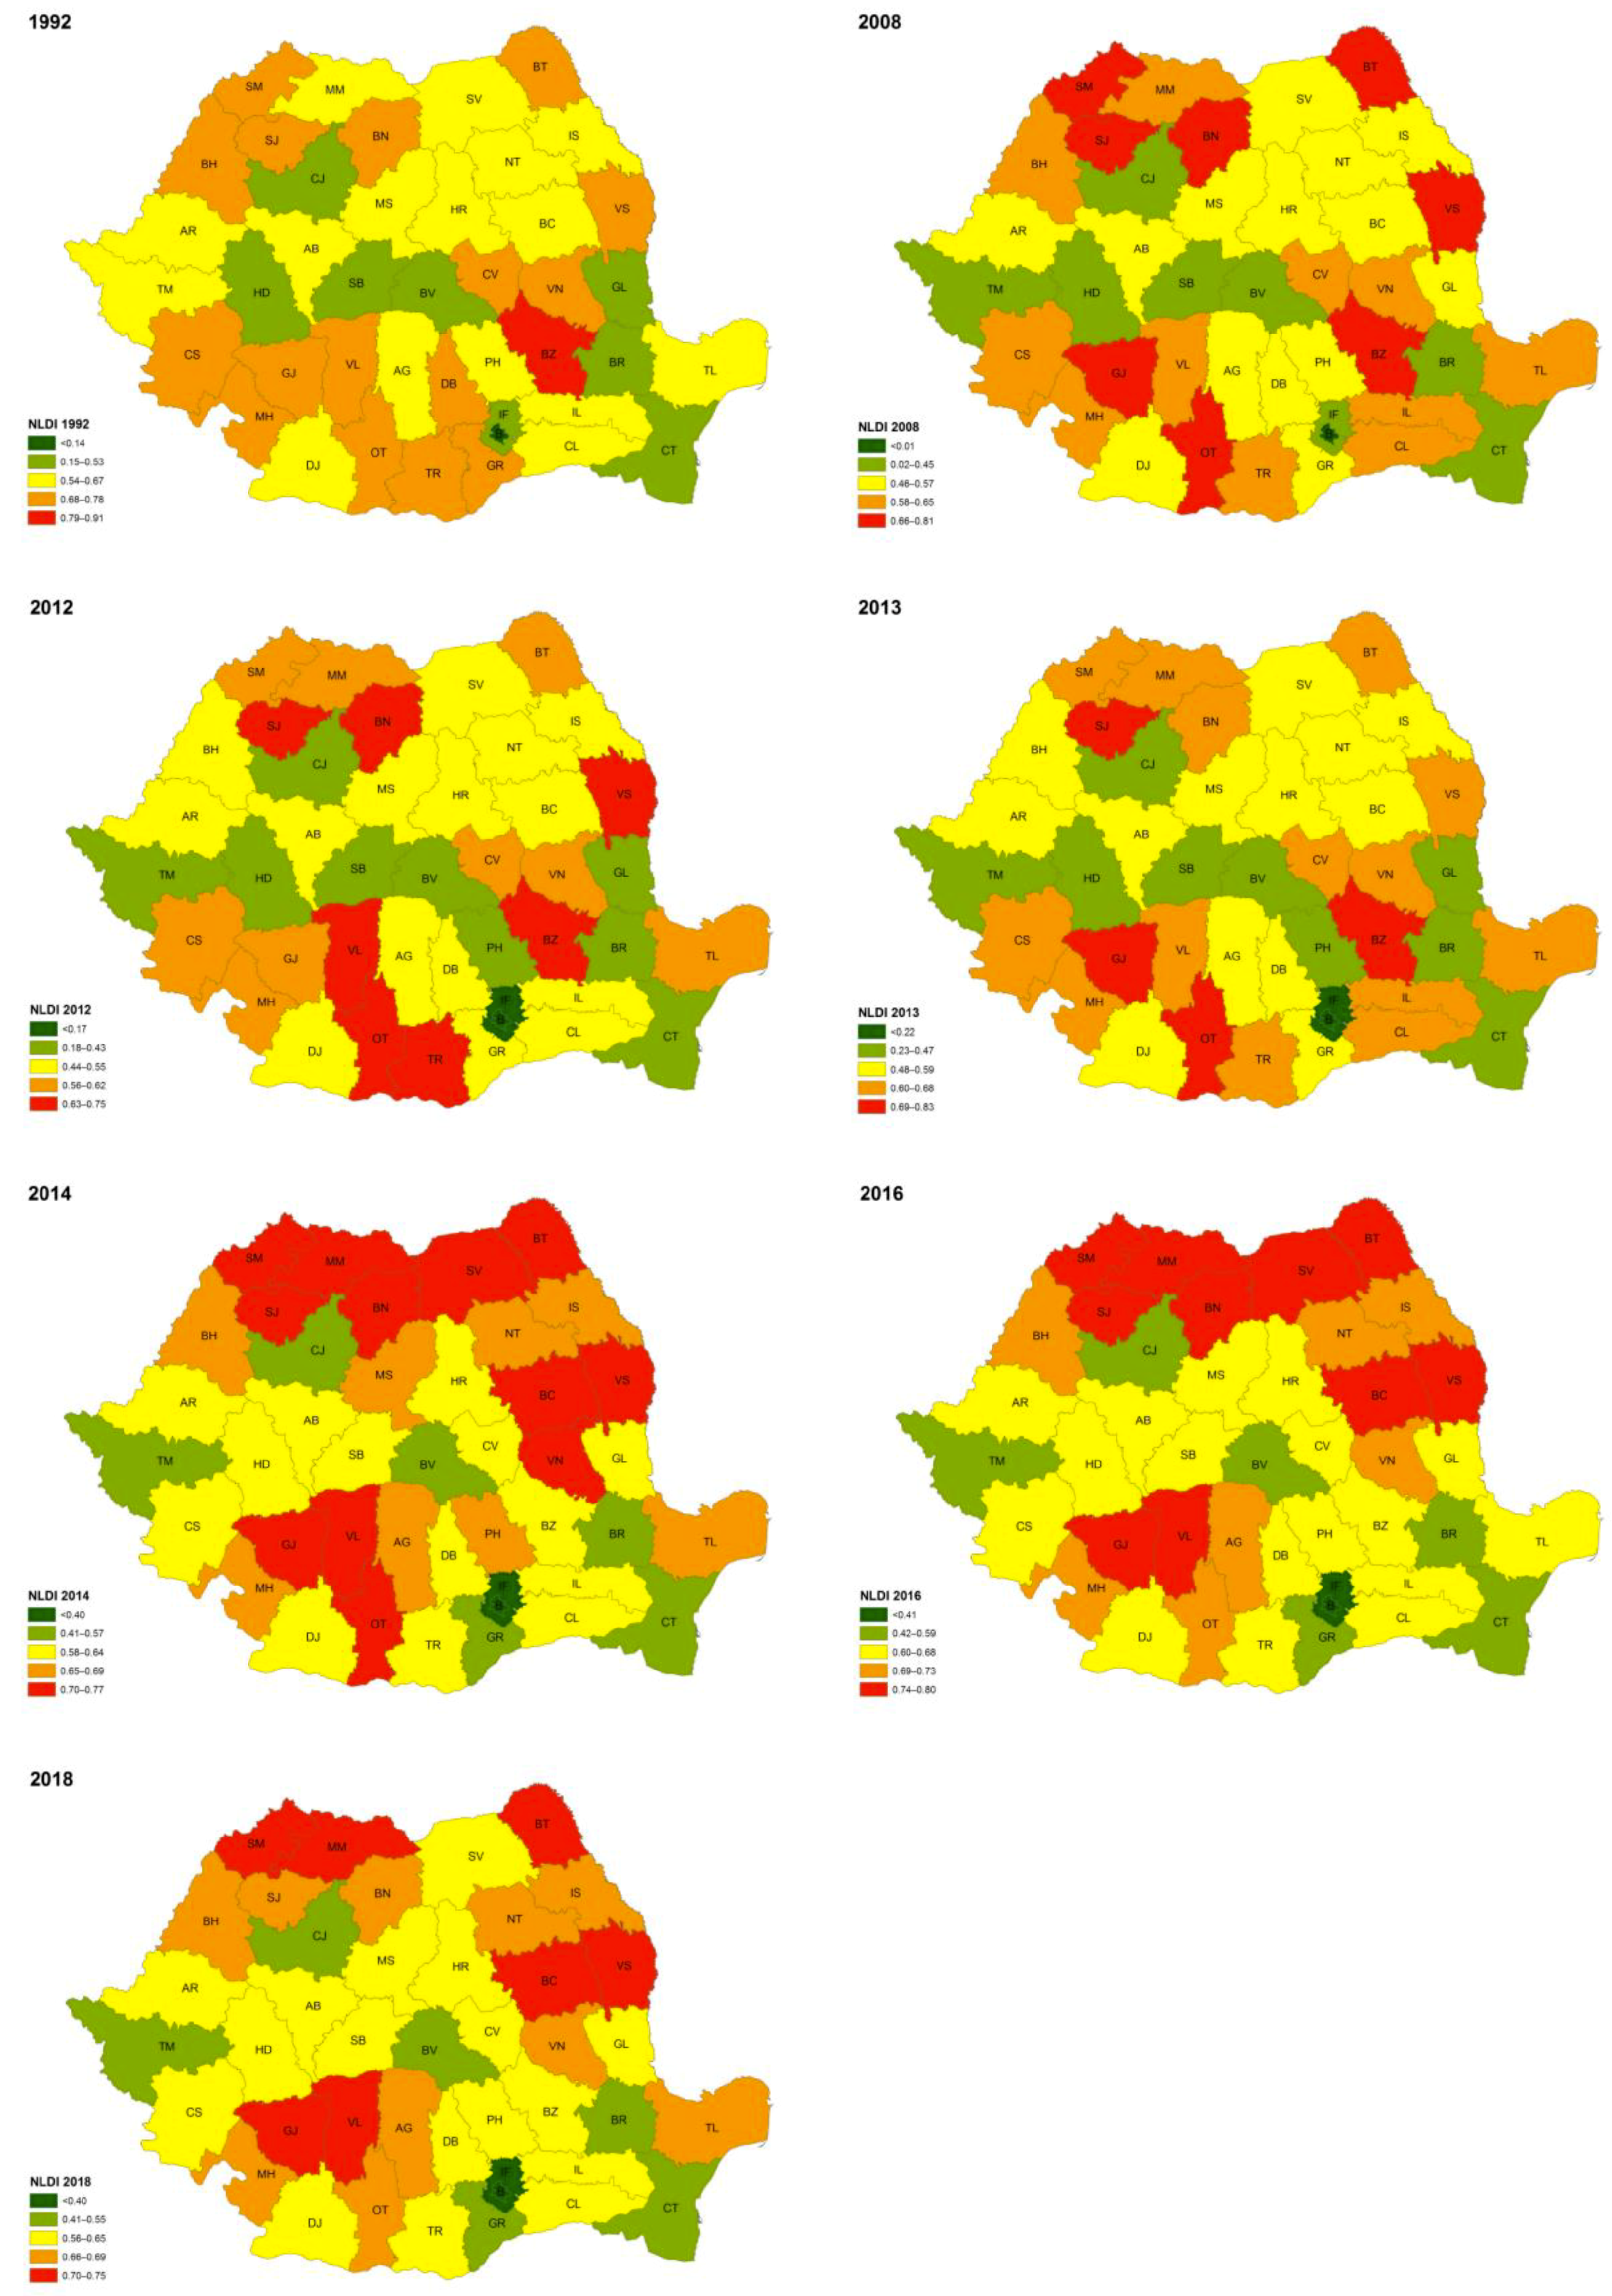
4. Results and Discussion
5. Conclusions
Author Contributions
Funding
Acknowledgments
Conflicts of Interest
References
- United Nations. Sustainable Development Goals. Department of Economic and Social Affairs. Available online: https://sustainabledevelopment.un.org/sdgs (accessed on 12 July 2019).
- Mellander, C.; Lobo, J.; Stolarick, K.; Matheson, Z. Night-Time Light Data: A Good Proxy Measure for Economic Activity? PLoS ONE 2015, 10, e0139779. [Google Scholar] [CrossRef] [PubMed]
- Benedek, J.; Ivan, K. Remote sensing based assessment of variation of spatial disparities. Geogr. Tech. 2018, 13, 1–9. [Google Scholar] [CrossRef]
- Czaran, L. Geospatial and Space Solutions for Monitoring the Sustainable Development Goals (SDGs) and other Global Agendas. Presentation at the CEU Summer School 2019. Available online: https://sunlearning.ceu.edu/pluginfile.php/34895/mod_resource/content/1/Lorant%20Czaran%20%28UNFPA%29%20%20Geospatial%20and%20Space%20Solutions%20for%20monitoring%20the%20Sustainable%20Development%20Goals%20%28SDGs%29%20and%20other%20Global%20Agendas.pdf (accessed on 15 September 2019).
- Goldblatt, R.; Heilmann, K.; Vaizman, Y. Can Medium-Resolution Satellite Imagery Measure Economic Activity at Small Geographies? Evidence from Landsat in Vietnam. World Bank Econ. Rev. 2019, lhz001, 1–19. [Google Scholar] [CrossRef]
- Kang, M.; Jung, M.C. Night on South Korea: Unraveling the Relationship between Urban Development Patterns and DMSP-OLS Night-Time Lights. Remote Sens. 2019, 11, 2140. [Google Scholar] [CrossRef]
- Taubenböck, H.; Dahle, F.; Geiß, C.; Wurm, M. Europe’s Socio-Economic Disparities Reflected in Settlement Patterns Derived from Satellite Data; Joint Urban Remote Sensing Event (JURSE): Vannes, France, 2019; pp. 1–4. [Google Scholar] [CrossRef]
- Ebener, S.; Murray, C.; Tandon, A.; Elvidge, C. From wealth to health: Modeling the distribution of income per capita at the sub-national level using nighttime lights imagery. Int. J. Health Geogr. 2005, 4, 5–11. [Google Scholar] [CrossRef]
- Ghosh, T.; Powell, R.L.; Elvidge, C.D.; Baugh, K.E.; Sutton, P.C.; Anderson, S. Shedding Light on the Global Distribution of Economic Activity. Open Geogr. J. 2010, 3, 148–161. [Google Scholar] [CrossRef]
- Basihos, S. Nightlights as a Development Indicator: The Estimation of Gross Provincial Product (GPP) in.Turkey (5 May 2016). Available online: https://ssrn.com/abstract=2885518 (accessed on 19 May 2019).
- Bhandari, L.; Roychowdhury, K. Night lights and economic activity in India: A study using DMSP-OLS night time images. Proc. Asia Pac. Adv. Netw. 2011, 32, 218–236. [Google Scholar] [CrossRef]
- Dai, Z.; Hu, Y.; Zhao, G. The Suitability of Different Nighttime Light Data for GDP Estimation at Different.Spatial Scales and Regional Levels. Sustainability 2017, 9, 305. [Google Scholar] [CrossRef]
- Chen, X.; Nordhaus, W.D. Using luminosity data as a proxy for economic statistics. Proc. Natl. Acad. Sci. USA 2011, 108, 8589–8594. [Google Scholar] [CrossRef]
- Li, X.; Ge, L.L.; Chen, X.L. Detecting Zimbabwe’s decadal economic decline using nighttime light imagery. Remote Sens. 2013, 5, 4551–4570. [Google Scholar] [CrossRef]
- Li, S.; Zhang, T.; Yang, Z.; Li, X.; Xu, H. Night Time Light Satellite Data for Evaluating the Socioeconomics in Central Asia. Int. Arch. Photogramm. Remote Sens. Spatial Inf. Sci. 2017, XLII–2/W7, 1237–1243. [Google Scholar] [CrossRef]
- Elvidge, C.; Zhizhin, M.; Baugh, K.; Hsu, F.-C. Automatic Boat Identification System for VIIRS Low Light Imaging Data. Remote Sens. 2015, 7, 3020–3036. [Google Scholar] [CrossRef]
- Bennie, J.; Davies, T.W.; Duffy, J.P.; Inger, R.; Gaston, K.J. Contrasting trends in light pollution across Europe based on satellite observed night time lights. Sci. Rep. 2014, 4, 3789. [Google Scholar] [CrossRef] [PubMed]
- Bennie, J.; Duffy, J.P.; Davies, T.W.; Correa-Cano, M.E.; Gaston, K.J. Global trends in exposure to light pollution in natural terrestrial ecosystems. Remote Sens. 2015, 7, 2715–2730. [Google Scholar] [CrossRef]
- Jiang, W.; He, G.J.; Long, T.F.; Wang, C.; Ni, Y.; Ma, R.Q. Assessing light pollution in china based on nighttime light imagery. Remote Sens. 2017, 9, 135. [Google Scholar] [CrossRef]
- Small, C.; Pozzi, F.; Elvidge, C.D. Spatial analysis of global urban extent from DMSP-OLS night lights. Remote Sens. Environ. 2005, 96, 277–291. [Google Scholar] [CrossRef]
- Ma, T.; Zhou, C.; Pei, T.; Haynie, S.; Fan, J. Quantitative estimation of urbanization dynamics using time series of DMSP/OLS nighttime light data: A comparative case study from China’s cities. Remote Sens. Environ. 2012, 124, 99–107. [Google Scholar] [CrossRef]
- Liu, Z.; He, C.; Zhang, Q.; Huang, Q.; Yang, Y. Extracting the dynamics of urban expansion in China using DMSP-OLS nighttime light data from 1992 to 2008. Landsc. Urban Plan. 2012, 106, 62–72. [Google Scholar] [CrossRef]
- Gao, B.; Huang, Q.; He, C.; Dou, Y. Similarities and differences of city-size distributions in three main urban agglomerations of China from 1992 to 2015: A comparative study based on nighttime light data. J. Geogr. Sci. 2017, 27, 533–545. [Google Scholar] [CrossRef]
- Ghosh, T.; Anderson, S.J.; Elvidge, C.D.; Sutton, P.C. Using nighttime satellite imagery as a proxy measure of human well-being. Sustainability 2013, 5, 4988–5019. [Google Scholar] [CrossRef]
- Shi, K.; Huang, C.; Yu, B.; Yin, B.; Huang, Y.; Wu, J. Evaluation of NPP-VIIRS night-time light composite data for extracting built-up urban areas. Remote Sens. Lett. 2014, 5, 358–366. [Google Scholar] [CrossRef]
- Sharma, R.C.; Tateishi, R.; Hara, K.; Gharechelou, S.; Iizuka, K. Global mapping of urban built-up areas of year 2014 by combining MODIS multispectral data with VIIRS nighttime light data. Int. J. Digit. Earth 2016, 9, 1004–1020. [Google Scholar] [CrossRef]
- Kiran Chand, T.R.; Badarinath, K.V.S.; Elvidge, C.D.; Tuttle, B.T. Spatial characterization of electrical power consumption patterns over India using temporal DMSP-OLS night-time satellite data. Int. J. Remote Sens. 2009, 30, 647–661. [Google Scholar] [CrossRef]
- He, C.; Ma, Q.; Liu, Z.; Zhang, Q. Modeling the spatiotemporal dynamics of electric power consumption in Mainland China using saturation-corrected DMSP/OLS nighttime stable light data. Int. J. Digit. Earth 2014, 7, 993–1014. [Google Scholar] [CrossRef]
- Min, B.; Gaba, K.M.; Sarr, O.F.; Agalassou, A. Detection of rural electrification in Africa using DMSP-OLS night lights imagery. Int. J. Remote Sens. 2013, 34, 8118–8141. [Google Scholar] [CrossRef]
- Pandey, B.; Joshi, P.K.; Seto, K.C. Monitoring urbanization dynamics in India using DMSP/OLS nighttime lights and SPOT-VGT data. Int. J. Appl. Earth Obs. 2013, 23, 49–61. [Google Scholar] [CrossRef]
- Shi, K.; Chen, Y.; Yu, B.; Xu, T.; Yang, C.; Li, L.; Huang, C.; Chen, Z.; Liu, R.; Wu, J. Detecting spatiotemporal dynamics of global electric power consumption using DMSO/OLS nighttime stable light data. Appl. Energy 2016, 184, 450–463. [Google Scholar] [CrossRef]
- Schroeder, W. Visible Infrared Imaging Radiometer Suite (VIIRS) 375 m & 750 m Active Fire Detection Data Sets Based on Nasa VIIRS Land Science Investigator Processing System (SIPS) Reprocessed Data-Version 1. NASA, 2017. Available online: https://lpdaac.usgs.gov/sites/default/files/public/product_documentation/vnp14_user_guide_v1.3.pdf (accessed on 17 June 2019).
- Nagy, J.A.; Benedek, J.; Ivan, K. Measuring Sustainable Development Goals at a Local Level: A Case of a. Metropolitan Area in Romania. Sustainability 2018, 10, 3962. [Google Scholar] [CrossRef]
- Zaman, G.; Goschin, Z. Economic Crisis and Wage Divergence: Empirical Evidence from Romania. Prague Econ. Pap. 2014, 4, 493–513. [Google Scholar] [CrossRef]
- Moroianu, N.D.; Constantin, D.L.; Herteliu, C.; Novac, A. Empirical Weighted Modelling on Inter-County Inequalities Evolution and to Test Economical Convergence in Romania. USV Ann. Econ. Public Adm. 2015, 15, 150–180. [Google Scholar]
- Moisescu, E.R. Regional convergence. Case of Romania. Theor. Appl. Econ. 2015, 2, 183–188. [Google Scholar]
- Török, I. From growth to shrinkage: The effects of economic change on the migration processes in rural Romania. Landbauforshung 2014, 64, 195–206. [Google Scholar] [CrossRef]
- Benedek, J. Spatial differentiation and core-periphery structures in Romania. East. J. Eur. Stud. 2015, 6, 49–61. [Google Scholar]
- Oancea, B.; Andrei, T.; Pirjol, D. Income distribution in Romania: The exponential-Pareto distribution. Phys. A Stat. Mech. Appl. 2017, 469, 486–498. [Google Scholar] [CrossRef]
- Benedek, J.; Lembcke, A.C. Characteristics of recovery and resilience in the Romanian regions. East. J. Eur. Stud. 2017, 8, 95–126. [Google Scholar]
- Benedek, J.; Cristea, M.; Szendi, D. Catching up or falling behind? Economic convergence and regional development trajectories in Romania. Rom. Rev. Reg. Stud. 2015, 11, 15–34. [Google Scholar]
- Goschin, Z. Exploring regional economic convergence in Romania. A spatial modeling approach. East. J. Eur. Stud. 2017, 2, 127–146. [Google Scholar]
- Török, I.; Benedek, J. Spatial patterns of local income inequalities. J. Settl. Spat. Plan. 2018, 2, 77–91. [Google Scholar] [CrossRef]
- Pinkovskiy, M.; Sala-i-Martin, X. Lights, camera. income! Illuminating the national accounts-household surveys debate. Q. J. Econ. 2016, 131, 579–631. [Google Scholar] [CrossRef]
- Tselios, V. Growth and convergence in income per capita and income inequality in the regions of the EU. Spat. Econ. Anal. 2009, 4, 343–370. [Google Scholar] [CrossRef]
- Rey, S.J.; Sastré-Gutiérrez, M.L. Interregional inequality dynamics in Mexico. Spat. Econ. Anal. 2010, 5, 277–298. [Google Scholar] [CrossRef]
- Paredes, D. The role of human capital, market potential and natural amenities in understanding spatial wage disparities in Chile. Spat. Econ. Anal. 2013, 8, 154–175. [Google Scholar] [CrossRef]
- Sacchi, A.; Salotti, S. The effects of fiscal decentralization on household income inequality: Some empirical evidence. Spat. Econ. Anal. 2014, 9, 202–222. [Google Scholar] [CrossRef]
- De Dominicis, L. Inequality and growth in European regions: Towards a place-based approach. Spat. Econ. Anal. 2014, 9, 120–141. [Google Scholar] [CrossRef]
- Ezcurra, R.; Rodríguez-Pose, A. Trade openness and spatial inequality in emerging countries. Spat. Econ. Anal. 2014, 9, 162–182. [Google Scholar] [CrossRef]
- Monastiriotis, V. Regional growth and national development: Transition in Central and Eastern Europe and the regional Kuznets curve in the east and the west. Spat. Econ. Anal. 2014, 9, 142–161. [Google Scholar] [CrossRef]
- Pereira, J.; Galego, A. Intra-regional wage inequality in Portugal. Spat. Econ. Anal. 2015, 10, 79–101. [Google Scholar] [CrossRef]
- Gluschenko, K. Measuring regional inequality: To weight or not to weight? Spat. Econ. Anal. 2018, 13, 36–59. [Google Scholar] [CrossRef]
- Zhou, Y.; Ma, T.; Zhou, C.; Xu, T. Nighttime light derived assessment of regional inequality of socioeconomic development in China. Remote Sens. 2015, 7, 1242–1262. [Google Scholar] [CrossRef]
- Elvidge, C.D.; Baugh, K.E.; Anderson, S.J.; Sutton, P.C.; Ghosh, T. The Night Light Development Index (NLDI): A spatially explicit measure of human development from satellite data. Soc. Geogr. 2012, 7, 23–35. [Google Scholar] [CrossRef]
- Xu, H.; Yang, H.; Li, X.; Jin, H.; Li, D. Multi-Scale Measurement of Regional Inequality in Mainland China during 2005–2010 using DMSP/OLS Night Light Imagery and Population Density Grid Data. Sustainability 2015, 7, 13469–13499. [Google Scholar] [CrossRef]
- Li, X.; Li, D.; Xu, H.; Wu, C. Intercalibration between dmsp/ols and viirs night-time light images to evaluate city light dynamics of syria’s major human settlement during syrian civil war. Int. J. Remote Sens. 2017, 38, 1–18. [Google Scholar] [CrossRef]
- Salvati, L.; Guandalini, A.; Carlucci, M.; Chelli, M.F. An empirical assessment of human development through remote sensing: Evidences from Italy. Ecol. Indic. 2017, 78, 167–172. [Google Scholar] [CrossRef]
- Wu, R.; Yang, D.; Dong, J.; Zhang, L.; Xia, F. Regional inequality in China based on NPP-VIIRS night-time light imagery. Remote Sens. 2018, 10, 240. [Google Scholar] [CrossRef]
- Version 4 DMSP-OLS Nighttime Lights Time Series. NOAA/NGDC Database. Available online: https://ngdc.noaa.gov/eog/dmsp/downloadV4composites.html (accessed on 28 March 2019).
- Version 1 VIIRS Day/Night Band Nighttime Lights. The Earth Observations Group (EOG). Available online: https://eogdata.mines.edu/download_dnb_composites.html (accessed on 1 March 2019).
- National Institute of Statistics of Romania. Population and Dwellings Census. Available online: http://www.recensamantromania.ro (accessed on 15 March 2018).
- National Institute of Statistics. Bucharest, Romania. Available online: http://www.insse.ro (accessed on 21 March 2019).
- Eurostat Database. Available online: http://ec.europa.eu/eurostat/ (accessed on 21 March 2019).
- Ministry of Regional Development and Public Administration (MRDPA). Bucharest, Romania. Available online: https://www.mdrap.ro/en/ (accessed on 17 June 2019).
- Benedek, J.; Varvari, Ș.; Litan, C. Urban growth pole policy and regional development: Old vine in new bottles. In Regional and Local Development in Times of Polarization. Re-Thinking Spatial Policies in Europe; Lang, T., Görmar, F., Eds.; Palgrave/MacMillan: Basingstoke, UK, 2019; pp. 173–196. [Google Scholar]
- Rodríguez-Pose, A.; Tselios, V. Toward inclusive growth: Is there regional convergence in social welfare? Int. Reg. Sci. Rev. 2015, 38, 30–60. [Google Scholar] [CrossRef]
- Lengwiler, Y. Computes the Gini Coefficient and the Lorentz Curve of Weighted Data. Available online: https://nl.mathworks.com/matlabcentral/fileexchange/28080-gini-coefficient-and-the-lorentz-curve (accessed on 17 March 2019).
| Data | Data Description | Year |
|---|---|---|
| DMSP-OLS NTL | annual product–stable light composite | 1992, 2008, 2012, 2013 |
| DMSP-OLS NTL | annual product–average light composite | 1992, 2008, 2012, 2013 |
| NPP-VIIRS DNB | annual product–“vcm-orm-ntl” | 2016 |
| NPP-VIIRS DNB | monthly product–“vcmslcfg” | 2014, 2018 (April, May, June, July, August, September) |
| Mean | Standard Deviation | ||||||||
| GDP per capita | Local tax income | Net migration rate | Population | GDP per capita | Local tax income | Net migration rate | Population | ||
| 1992 | * | * | −2.0 | 550,638 | 1992 | * | * | 3.4 | 309,804.9 |
| 2008 | 10,935.7 | 751.1 | −0.2 | 536,718.3 | 2008 | 4887.1 | 457.9 | 5.4 | 308,976.7 |
| 2012 | 12,173.8 | 802.7 | −0.4 | 533,377.7 | 2012 | 5102.5 | 447.9 | 5.8 | 308,994.3 |
| 2013 | 12,226.2 | 883.1 | −0.5 | 532,377.4 | 2013 | 5278 | 451.7 | 5.7 | 308,117.2 |
| 2014 | 12,690.5 | 908.9 | −0.4 | 530,946 | 2014 | 5585.5 | 469.8 | 6.1 | 304,972.3 |
| 2016 | 14,540.5 | 1068.2 | −1.0 | 529,430 | 2016 | 6363.7 | 520.2 | 6.5 | 305,148 |
| 2018 | * | 1200.8 | −1.8 | 528,038.2 | 2018 | * | 554.5 | 5.7 | 309,051.3 |
| Minimum | Maximum | ||||||||
| GDP per capita | Local tax income | Net migration rate | Population | GDP per capita | Local tax income | Net migration rate | Population | ||
| 1992 | * | * | −9.4 | 235,196 | 1992 | * | * | 6.9 | 2,191,176 |
| 2008 | 5900 | 340.4 | −5.8 | 232,279 | 2008 | 33,000 | 2724 | 31.4 | 2,158,816 |
| 2012 | 7000 | 389.0 | −6.1 | 230,600 | 2012 | 36,400 | 2739.7 | 34.4 | 2,151,758 |
| 2013 | 6800 | 438.9 | −7.0 | 230,226 | 2013 | 37,700 | 2768.5 | 31.8 | 2,140,816 |
| 2014 | 7000 | 436.4 | −4.9 | 229,563 | 2014 | 39,400 | 2861.5 | 35.2 | 2,110,752 |
| 2016 | 8100 | 519.3 | −6.4 | 228,492 | 2016 | 45,600 | 3131.2 | 37.7 | 2,102,675 |
| 2018 | * | 559.3 | −10.3 | 226,879 | 2018 | * | 3402.6 | 29.1 | 2,121,794 |
| Year | Altitude | X_Long | Y_Lat | Local Tax Income | GDP /Capita | Positive Net Migration Rate | Negative Net Migration Rate | Population |
|---|---|---|---|---|---|---|---|---|
| 1992 | 0.105 | −0.162 | 0.120 | ** | −0.747 * | −0.131 | −0.277 | −0.669 * |
| 2008 | 0.088 | −0.085 | 0.247 | −0.864 * | −0.840 * | −0.743 * | −0.044 | −0.666 * |
| 2012 | 0.102 | −0.055 | 0.222 | −0.862 * | −0.840 * | −0.748 * | 0.308 | −0.637 * |
| 2013 | 0.093 | −0.077 | 0.170 | −0.858 * | −0.824 * | −0.560 * | 0.306 | −0.670 * |
| 2014 | 0.288 | −0.120 | 0.470 * | −0.827 * | −0.797 * | −0.689 * | 0.205 | −0.553 * |
| 2016 | 0.304 | −0.118 | 0.474 * | −0.831 * | −0.806 * | −0.741 * | 0.110 | −0.573 * |
| Year | Variable | Unstandardized Coefficients | Standardized Coefficients |
|---|---|---|---|
| 2016 | (Constant) | 0.783 | |
| GDP per capita | −0.00000755 | −0.450 | |
| Altitude | 0.00005078 | 0.127 | |
| X_Long | −0.00000009 | −0.121 | |
| Y_Lat | 0.00000023 | 0.273 | |
| Local tax income | −0.00008564 | −0.418 | |
| Net migration rate | −0.00000516 | −0.384 | |
| Population | −0.00000011 | −0.311 |
| Model | Metric 1 | 2008 | 2012 | 2013 | 2014 | 2016 | 2018 |
|---|---|---|---|---|---|---|---|
| Linear | R2 | 0.746 | 0.743 | 0.736 | 0.683 | 0.691 | 0.617 |
| Adjusted R2 | 0.740 | 0.737 | 0.729 | 0.675 | 0.683 | 0.607 | |
| RMSE | 233,512 | 229,753 | 235,001 | 267,680 | 292,820 | 347,545 | |
| AIC | 460,022 | 458,659 | 460,556 | 471,493 | 479,034 | 493,426 | |
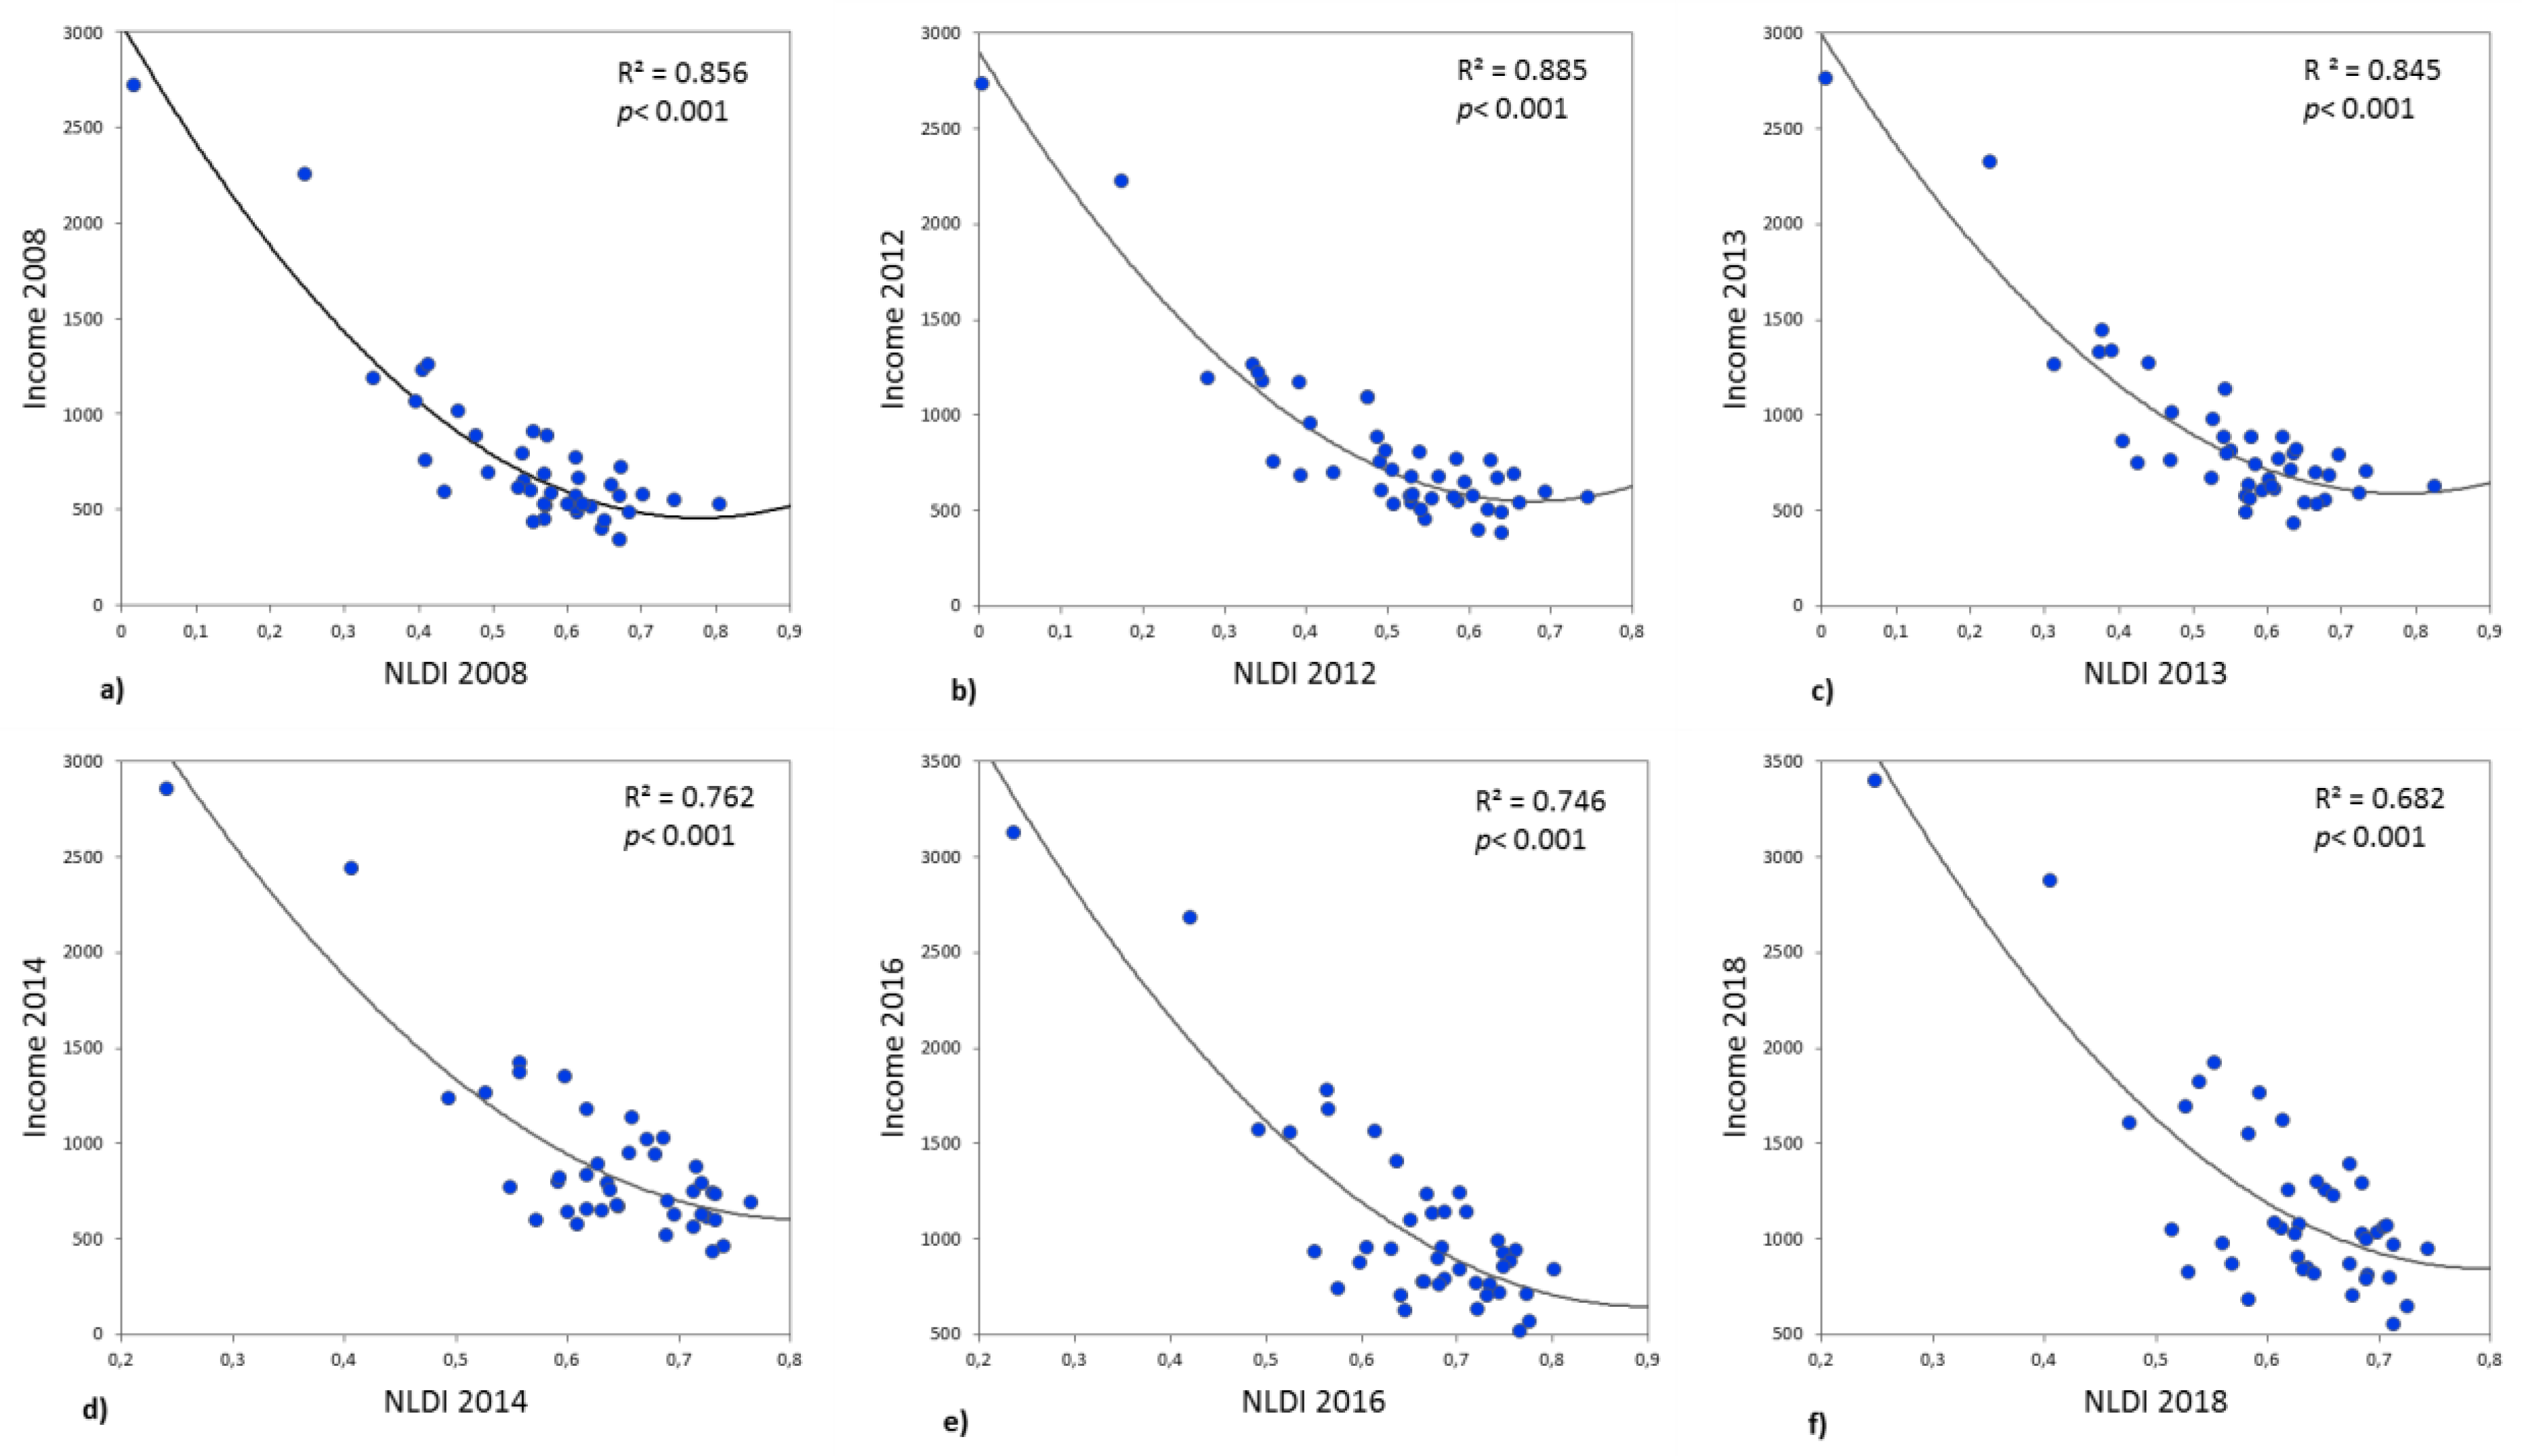
| Polynomial | R2 | 0.856 | 0.885 | 0.845 | 0.762 | 0.746 | 0.682 |
| RMSE | 178,054 | 155,534 | 182,044 | 235,052 | 268,758 | 320,801 | |
| AIC | 440,183 | 428,824 | 442,044 | 463,511 | 474,768 | 489,636 | |
| Exponential | R2 | 0.839 | 0.870 | 0.829 | 0.752 | 0.739 | 0.677 |
| RMSE | 188,374 | 165,788 | 191,394 | 239,688 | 272,340 | 323,133 | |
| AIC | 444,915 | 434,187 | 446,252 | 465,152 | 475,880 | 490,245 |
© 2019 by the authors. Licensee MDPI, Basel, Switzerland. This article is an open access article distributed under the terms and conditions of the Creative Commons Attribution (CC BY) license (http://creativecommons.org/licenses/by/4.0/).
Share and Cite
Ivan, K.; Holobâcă, I.-H.; Benedek, J.; Török, I. Potential of Night-Time Lights to Measure Regional Inequality. Remote Sens. 2020, 12, 33. https://doi.org/10.3390/rs12010033
Ivan K, Holobâcă I-H, Benedek J, Török I. Potential of Night-Time Lights to Measure Regional Inequality. Remote Sensing. 2020; 12(1):33. https://doi.org/10.3390/rs12010033
Chicago/Turabian StyleIvan, Kinga, Iulian-Horia Holobâcă, József Benedek, and Ibolya Török. 2020. "Potential of Night-Time Lights to Measure Regional Inequality" Remote Sensing 12, no. 1: 33. https://doi.org/10.3390/rs12010033
APA StyleIvan, K., Holobâcă, I.-H., Benedek, J., & Török, I. (2020). Potential of Night-Time Lights to Measure Regional Inequality. Remote Sensing, 12(1), 33. https://doi.org/10.3390/rs12010033


