Article

Quantifying Citrus Tree Health Using True Color UAV Images

by
Blanca N. Garza
1,
Veronica Ancona
1,
Juan Enciso
2,
Humberto L. Perotto-Baldivieso
3,
Madhurababu Kunta
1 and
Catherine Simpson
1,4,*
1
Kingsville Citrus Center, Texas A&M University, 312 N. International Blvd., Weslaco, TX 78599, USA
2
Biological and Agricultural Engineering Department, Texas A&M AgriLife Research, Weslaco, TX 78596, USA
3
Caesar Kleberg Wildlife Research Institute, Texas A&M University-Kingsville, Kingsville, TX 78363, USA
4
Department of Plant and Soil Sciences, Texas Tech University, Lubbock, TX 79409, USA
*
Author to whom correspondence should be addressed.
Remote Sens. 2020, 12(1), 170; https://doi.org/10.3390/rs12010170
Submission received: 26 November 2019 / Revised: 25 December 2019 / Accepted: 31 December 2019 / Published: 3 January 2020
(This article belongs to the Special Issue Remote Sensing for Plant Pathology)

Abstract

:
Huanglongbing (HLB) and Phytophthora foot and root rot are diseases that affect citrus production and profitability. The symptoms and physiological changes associated with these diseases are diagnosed through expensive and time-consuming field measurements. Unmanned aerial vehicles (UAVs) using red/green/blue (RGB, true color) imaging, may be an economic alternative to diagnose diseases. A methodology using a UAV with a RGB camera was developed to assess citrus health. The UAV was flown in April 2018 on a grapefruit field infected with HLB and foot rot. Ten trees were selected for each of the following disease classifications: (HLB-, foot rot–), (HLB+, foot rot–), (HLB-, foot rot+) (HLB+, foot rot+). Triangular greenness index (TGI) images were correlated with field measurements such as tree nutritional status, leaf area, SPAD (leaf greenness), foot rot disease severity and HLB. It was found that 61% of the TGI differences could be explained by Na, Fe, foot rot, Ca, and K. This study shows that diseased citrus trees can be monitored using UAVs equipped with RGB cameras, and that TGI can be used to explain subtle differences in tree health caused by multiple diseases.

Graphical Abstract

1. Introduction

Citrus is grown around the world and is produced in more than 80 countries, creating a worldwide interest in its development [1]. In the United States, the citrus industry is economically important and contributed an estimated $3.44 billion in the year 2017 [2]. However, citrus production worldwide is threatened by many abiotic or biotic factors. The most significant abiotic factors posing a threat to citrus production are flooding, salinity, heat, drought, and nutrient deficits [3]. The biotic factors, which are more immediately devastating, consist of insects, diseases, and/or pathogens [3]. Diseases like huanglongbing (HLB or citrus greening disease) and Phytophthora foot rot and gummosis are among the most devastating to the citrus industry in the US [4,5]. While Phytophthora foot rot does have treatment options available, the spore persistence in the environment and the expensive chemicals required to treat it make it difficult to control. HLB, caused by the bacterium Candidatus liberibacter asiaticus (CLas), has no known cure and has caused a severe decline in citrus production in Florida, the most affected state. As the disease has spread, other citrus producing states like Texas and California are trying to prevent large scale tree decline. Texas has had HLB since 2012 and it is currently estimated that one-third of groves are affected [6]. Tracking the spread of disease for effective management has been difficult due to asymptomatic trees and interaction with diseases such as Phytophthora foot rot.
Tracking tree health changes due to HLB and Phytophthora spp. infection of trees can be difficult for farmers due to gradual visual changes, spatial variation, inaccessibility to the field, or environmental factors. HLB can be visibly identified by the development of one or more yellow shoots, sectored leaf appearance, blotchy mottle of leaves which resembles zinc or magnesium deficiency, thicker leaves with large corky veins, and then towards the end stages the tree can have leaf drop and/or twig dieback followed by decline and tree death [7]. Diseased Citrus trees affected by Phytophthora spp. are commonly identified by two main characteristics which are foot root and gummosis [8]. At the canopy level, Phytophthora spp. infection is characterized by its defoliation, twig dieback, short growth flushes, and small leaves [8,9]. Although each disease has distinctive features, some of the visual characteristics such as prevalence of twig dieback, leaf yellowing, and leaf drop of both diseases can be similar. When the diseases are found in the same tree and/or in the same orchard, separating the visual symptoms and attributing them to an individual disease is more difficult.
Unmanned aerial vehicles (UAVs) have been presented as a possible solution to this problem, providing a more frequent and complete picture of tree health status. UAVs with infrared cameras that can monitor and track different diseases in several crops have shown promise [10]. However, one of the primary focuses has been to detect diseases prior to visible symptom expression or to quantify the extent of disease in field conditions. The images are commonly obtained using thermal, infrared, and visible-near infrared (VNIR) cameras. VNIR and thermal infrared reflectance imaging have been used to study tree health and HLB disease infection [11,12,13]. Spectral reflectance changes have been correlated to physiological stress and overall tree health as they are related to differences in pigments and other factors such as water stress, nitrogen status, etc. [11,12,13]. Previous studies by Mishra et al. (2011), Sankaran et al. (2011), and Sankaran and Ehsani (2011) [9,10,11] have shown that VNIR spectra has a good correlation (>90%) with HLB detection. Additionally, the normalized difference vegetation index (NDVI), which is used to estimate changes in vegetation states, has been a reliable measure of plant status [14]. Furthermore, the green normalized difference vegetation index (gNDVI) shows the greenness or photosynthetic activity of living plants, which is correlated with plant chlorophyll content [14,15]. While these indices are determined from specialized, expensive cameras, RGB cameras do not provide the necessary data for calculating these vegetation indexes. RGB cameras have been used to determine other indices, such as Green Leaf Index (GLI) which was designed to measure wheat cover from RGB images [16]. Another method of analyzing tree health using RGB camera images is the triangular greenness index (TGI), developed by Raymond Hunt et al. (2011) [15]. This is a measure of greenness in vegetation, which is related to leaf chlorophyll content, which is in turn calculated based on the area of a triangle from a leaf reflectance spectrum where the axes are in the red, blue, and green wavelengths [17]. In this study, Hunt (2011) shows that digital camera images, narrow bands, or broad-band multispectral sensors can be used to calculate the TGI of a tree canopy. Using RGB images to calculate TGI and relate this to tree health would open up a new avenue for the assessment of trees on a larger scale than before with regular RGB cameras on lower cost UAV platforms.
To date, one of the main limitations in UAV studies to monitor plant diseases is these only confirm pathogen presence or abundance (CLas titer, soil propagules, etc.) or disease symptomology to correlate with spectral image data [18,19,20]. Ground measurements of physiological data, such as nutritional deficiencies, drought stress, and other factors have not been thoroughly studied to determine which physiological factors can explain differences in the data generated by the imagery. To address this, the objectives of this study were to: a) identify physiological differences between important citrus diseases such as HLB and Phytophthora foot rot, b) use spectral values from RGB images to generate TGI values, c) establish a relationship between TGI, plant disease and health status, and d) explain TGI differences using physiological measurements of plant health.

2. Materials and Methods
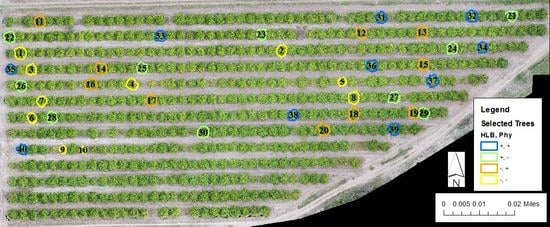
2.1. Study Area

The study was conducted at Texas A&M University—Kingsville South Research Farm (26°8′12.1122″N, −97°56′47.4″W; 24 m above sea level) in Weslaco, Hidalgo County, Texas. It is located in the Lower Rio Grande Valley of South Texas where subtropical and semi-arid climate prevail. Commercial citrus production of South Texas is almost entirely confined to Hidalgo, Cameron, Starr, and Willacy Counties with an approximate production area of 12,140 ha. Of the citrus groves in this region, approximately one-third of groves are estimated to be affected by HLB (Mamoudou Setamou, personal communication), and approximately 97% of groves are affected by Phytopthora foot rot [5]. Our study was conducted in a 1.34 ha block of Rio Red grapefruit trees (Citrus paradisi Macf.) on Bitters (C22, C. sunki Hort. Ex Tan x Poncirus trifoliata L. Raf. ‘Swingle’ cross) rootstocks planted in 2008 at a density of 410 trees/ha. The research block had 99.5% Hidalgo sandy clay loam soils with 0–1% slopes.

2.2. Experimental Design

Initial disease assessments were conducted to confirm CLas infection as well as Phytopthora foot rot and HLB disease severity in affected trees. To maintain the same level of Phytophthora foot rot symptoms in each category, the disease was rated on a scale from 0 to 4, where 0 = no disease, 1 = up to 25% of the branch with gummosis, 2 = 25–50% of tree branches affected, 3 = 50–75% affected, 4 = Decline of 75–100%, including dead trees [21]. Only trees rated as a “2” on the severity rankings were selected for further analysis. Because foot rot symptoms fluctuate throughout the season, they were assumed to be positive even if gummosis symptoms (may be washed off during heavy rains) were not present in different times of the study after the first disease rating.
We selected 40 trees after conducting an HLB survey based on visual typical leaf symptoms [4] on the entire block. Testing of trees for HLB/CLas presence [22,23] using quantitative polymerase chain reaction (qPCR) assays was performed by the Diagnostic Lab at Texas A&M University—Kingsville Citrus Center in Weslaco, TX. Total DNA was extracted from chopped midribs and petioles using the Qiagen DNeasy plant mini kit (Qiagen Inc., Germantown, MD, USA). Two hundred milligrams of chopped tissue was homogenized in a 2 mL lysing matrix A tube (MP Biomedicals, Santa Ana, CA, USA) with extraction buffer, and was pulverized for 3 min at a shaking speed of 2100 oscillations per min using a Mini-Beadbeater-96 (Biospec Products Inc., Bartlesville, OK, USA). Total DNA was eluted in 100 µL of nuclease-free water. For detecting CLas in the leaves, qPCR was performed on 2 µL of total DNA extract in a 25 µL reaction mixture using HLBaspr primer and probe set, which targets the 16s rDNA of CLas. The qPCR assays were performed in a CFX96 Touch real-time PCR detection system (Bio-Rad Laboratories, Hercules, CA, USA) and the reaction mixture consisted of 2 µL of total DNA, 2.5 µL 10X PCR buffer (Invitrogen, Carlsbad, CA, USA), 2.5 mM MgCl2, 0.2 mM each dNTPs, 0.2 µM each primer, 0.1 µM probe, and 1 Unit platinum Taq DNA polymerase (Invitrogen). A citrus mitochondrial cytochrome oxidase (COX)-based primer probe set COXfpr [18] was used as a positive internal control. Reactions containing known positive control DNA, healthy plant DNA, and non-template water control were also performed. The threshold cycle (Ct) values obtained from the assays were used to determine the presence of the target sequences in the DNA extracts. Trees with Ct value of less than 33 were considered HLB-positive. Once trees were confirmed for HLB and evaluated for disease symptom severity, they could be classified and selected for the study.
Four disease categories were utilized to select the 40 trees for measurements and analysis: HLB negative/foot rot negative (HLB-/P-), HLB positive/foot rot negative (HLB+/P-), HLB negative/foot rot positive (HLB-/P+), and HLB positive/foot rot positive (HLB+/P+). Ten trees in each disease category were selected (Figure 1).

2.3. Field Measurements

2.3.1. Nutrient Analysis and Leaf Area

Leaf nutrient analysis was conducted in April of 2018. A total of 20 leaves were taken from each tree selected for the study. Collected leaves were fully expanded, recently matured leaves from random locations within the tree canopy. Leaves were washed in 0.01 N HCl, rinsed in DI water, then patted dry. Individual leaf area was determined using the LI-3100 Area Meter (LiCor, Lincoln, Nebraska). After leaf area measurement, leaves were fully dried before sending to the Texas A&M University Soil, Forage, and Water Testing Lab in College Station, TX for tissue nutrient analysis. Leaf tissues were analyzed for N, P, K, Ca, Mg, Na, Zn, Fe, Cu, Mn, S, and B. These nutrients are vital for plant growth and development. Fruit yield, quality, and plant health are highly dependent upon adequate levels of these nutrients. Any deficiencies will result in visible deficiency symptoms, fruit malformations, or quality declines, and could also result in a reductions in yield.

2.3.2. SPAD

Soil plant analysis development (SPAD) is a measure of leaf greenness correlated with chlorophyll levels in plant leaves and is used as a diagnostic tool to measure plant nutrient status [24]. To determine SPAD, leaves are placed within the sensor and the meter automatically reads the value once the measurement button is pressed. The SPAD value given represents the difference between the transmittance of red and infrared light as it penetrates the leaf. SPAD measurements were taken in April of 2018 using the SPAD 502 Plus Chlorophyll Meter (Spectrum Technologies Inc., Plainfield, IL, USA). Random, mature, fully expanded leaves from the most recent season’s growth were selected for testing. Four leaves per tree were selected and 10 trees per disease category were tested.

2.4. Image Acquisition and Analysis

2.4.1. Acquisition

UAV data were acquired using a DJI Phantom 4 Pro platform (DJI; Shenzhen, China) on 23 April 2018. The RGB (red, green, and blue bands) camera mounted on the Phantom 4 Pro model WM331A takes 20 Megapixel images with a 25.4 mm1 in CMOS sensor. This DJI Phantom 4 Pro has an integrated GPS/GLONASS system, allowing for faster, more precise satellite acquisition during flights. The flight was conducted at 11 AM with winds < 8 km/h to minimize image distortion. This flight was selected to provide images and data to characterize diseases and nutrient deficiencies of a citrus orchard. A total of 318 images were collected for the study area. Pix4D Capture (Pix4D Inc., San Francisco, CA, USA) software was used to collect image data using the simple grid option and nadir (90 vertical) view [25]. Images were acquired with 80% overlap at 30 m altitude above ground level.

2.4.2. Image Processing and Analysis

The raw images were processed to generate ortho-mosaic image and digital surface model (DSM) using Pix4D Mapper (Pix4D SA, Switzerland). This program uses the structure from motion (SfM) algorithm. The pixel resolution of the final orthomosaic image and DSM was 8.2 cm. The orthomosaic was imported in Pix4D Fields (Pix4D Inc., San Francisco, CA, USA) where the TGI was generated [17]. The triangular greenness index (TGI) is the area of a triangle bounding a leaf reflectance spectrum (gray line) with vertices in the red (670 nm, R670), green (550 nm, R550), and blue (480 nm, R480) [17]. These three wavelengths were selected to approximate the definite integral of the chlorophyll spectrum from 480 to 670 nm wavelengths [26]. The TGI raster was imported into ArcMap where each individual tree was delineated into a polygon. The polygon corresponding to each tree was used to extract TGI values from the TGI raster and we calculated the mean TGI value per tree. Since our objective was to determine if mean TGI values and disease category were related, we limited the scope of our study to the 40 plants we measured and we did not extrapolate the data to the whole study area, hence no accuracy assessment was required for this analysis [27,28].

2.5. Data Analyses

Statistical analyses using JMP 13.0.0 (SAS Inc., Cary, NC, USA) were used to determine relationship between UAV image data and field data. Data was processed using a multivariate correlation function within JMP. This analysis defined a pairwise and higher relationship between nutrient concentrations, physiological parameters, and TGI. A full factorial analysis was used to determine statistical differences between disease classifications, nutritional status, and TGI for each measured factor and mean separation was determined by Students T (p ≤ 0.05). Stepwise regression analysis was performed using the proc reg function of SAS by selecting variables that significantly contributed to TGI values (SAS version 9.4, SAS Inc., Cary, NC, USA) [29]. Variables that significantly contributed to TGI values were indicated by significance at p = 0.05 from the stepwise selection model.

3. Results

3.1. Nutritional Analysis

Leaf nutritional analysis did not show a statistical difference between disease classifications for any mineral nutrients with the exception of Na (Table 1) according to the p-values. Na was significantly higher (Table 1; p = 0.334) in trees infected with both HLB and Phytophthora foot rot infections. However, the levels of Na in each of the disease categories were not considered to be at toxic levels. None of the mineral nutrients were considered to be deficient except N, which was below the deficiency threshold for trees with and without disease.

3.2. Field Measurements and Triangular Greenness Index (TGI)

Leaf area was significantly different between disease classifications (Figure 2A, p = 0.0003). The largest leaves (mean = 35.3 cm2; SE = 1.22 cm2) were found in the HLB-/P-category and the smallest leaves (mean = 30.16 cm2; SE = 1.53 cm2) were found in the HLB+/P+ class. Leaves with Phytophthora foot rot or HLB were of intermediate area.
Leaf SPAD was not significantly different between HLB- P-, HLB+P -, or HLB + P+, disease categories (Figure 2B; p classification = 0.037). However, HLB-/P+ leaves had significantly lower SPAD (mean HLB-/p+ = 49.9 cm2; SE = 2.5 cm2) values compared to all other disease classes (mean HLB-/p- = 55.07 cm2; SE = 1.37 cm2; mean HLB+/ p- = 53.9 cm2; SE = 2.6 cm2; mean HLB+/p+ = 54.7 cm2; SE = 1.77 cm2).
Average TGI was significantly different between classifications (Figure 2C; p classifications ≤ 0.0001). Disease-free trees had a greater average TGI than trees with disease. While TGI in HLB+/P+ trees was not significantly lower than the other disease classes, it showed lower numerical values than trees with HLB or Phytophthora foot rot diseases alone.

3.3. Relationship Analysis

3.3.1. Correlation of Measured Factors

CLas titer was positively related to leaf area and TGI, and negatively related to Na, Fe, Cu, and Mn (Table 2). The presence of foot rot disease was negatively related to Mg and TGI. Leaf area was positively related to TGI, K, and Mg and negatively related to SPAD, Na, Fe, and B. SPAD was positively related to Ca, Na, and B.; and negatively related to P, K, and Zn. Nutrient relationships varied by each mineral element as shown in Table 2. TGI was positively related to K, but negatively related to Na and Fe.

3.3.2. Stepwise Regression Analysis

The first variable related to TGI was Na, followed by Fe, disease rating, Ca, and K. These five factors combined resulted in an R2 value of 0.61 for the entire model (Table 3). Surprisingly, CLas titer did not play a large role in influencing TGI values.

4. Discussion

The use of UAV imagery is a valuable tool/methodology for identifying diseases affecting citrus plants in South Texas, as well as other citrus producing regions. Our study shows conflicting results from current studies using UAV collected images, with no correlations between plant nitrogen status and TGI [10,14,17,30,31,32,33]. This further supports evidence that UAV-collected RGB image data is highly variable, and also could be confounded by disease status because of the lack of correlation between TGI and nitrogen status. These findings lead to additional questions, such as, ‘What are the causes of differences in TGI?’ and ‘Can these visual differences in TGI be correlated with physiological measurements?’. Herein, we explore the answers to these questions in order to further the understanding of data collected via UAVs and how they correlate to plant disease status and overall health.
TGI is a useful index for determining disease in citrus trees and some of the factors causing the differences between diseases. UAV images to determine plant health factors and the calculation of TGI from those images have been increasingly evaluated in recent years. In this study, TGI was greatest in trees without disease and lowest in trees with both diseases indicating that multiple diseases lower the triangular greenness index. Many factors have the potential to influence measured and TGI values. Many studies using TGI as an indicator of plant status focus on its correlation with chlorophyll or N content [10,14,17,26,30,31,33]. However, the relationship between pigments and TGI did not fully explain their results indicating that more factors influence TGI [31]. Further analysis via stepwise regression showed a more complex relationship that described a significant portion of what was observed in the TGI calculated from UAV images. Stepwise regression showed that TGI is mainly described by Na followed by Fe, foot rot disease rating, Ca and K. These five factors explained 61% of TGI data. Na represented approximately half of this model indicating that in diseased citrus, TGI is was highly impacted by Na. Na is toxic to citrus, affecting tree water status, leaf size, mortality, dieback, etc. [34,35]. The symptoms of Na toxicity are very similar to those of HLB and Phytophthora foot rot, however, the Na levels shown in the study did not exceed known toxicity thresholds [36]. This could indicate several things, including: a) that Na toxicity threshold is lower in diseased citrus, and/or b) diseased citrus take up more Na and this affects spectral reflectance as related to TGI. Other ions related to plant water status are K and Ca which were included in the regression model. K, Ca, and Na play a large role in water uptake in citrus, and when there is a higher concentration of Na it affects osmotic stress within the plant [35]. K was positively correlated with TGI and Na and Fe were inversely related to TGI, indicating that whenever there is more uptake of K instead of Na that TGI values increase. Thus, this shows that there is a relationship between plant nutrient status, disease status and TGI. Not only does plant disease affect a plants ability to take up certain ions but the relationship between disease and nutritional status affects its spectral reflectance as shown by TGI. While there are other factors that are missing from this model to explain TGI differences between plant diseases these five factors represent the majority of what was seen in this study. These results are significant because previous studies have found that TGI was highly correlated with N, however our study indicates that Na, K, Ca, and Fe as well as disease status affect TGI while N does not. While we did not find a correlation between N and TGI, TGI may not be a good indicator of N in diseased citrus plants.
Field collected measurements have been used for many years to describe and explain plant physiological responses to disease, environment, and fertilization. UAV derived images to detect disease conditions is a promising tool to identify various diseases in several crops [20,37].
While there have been successes in the identification of diseases like HLB and other pathogens, the techniques and equipment varied in accuracy, expense, and complexity [11,13,38]. Furthermore, few have identified the causal factors associated with spectral differences in diseased vs. healthy plants [39]. Certain spectral signatures have been found to relate to plant stress, primarily in the visible and near infrared regions of the electromagnetic spectrum [18]. Because plant disease symptoms often mimic nutrition, water status, and other visual characteristics, these factors may reflect what is seen in UAV image analysis.
Nutrient analysis in this study did not show any differences between disease classification categories with the exception of Na. Here, Na was found in greater concentrations in trees with both HLB and Phytophthora foot rot. Na can be a toxic ion in excess of approximately 2500 ppm in citrus [36], however, levels did not reach this threshold in this experiment.
Leaf area is an important indicator of tree health and nutritional status [40]. Leaf area changes in response to stressful situations, meaning that as a tree is stressed the leaf area may decrease [40]. Field measurements of leaf area showed a gradual decreased in leaf size from healthy trees to trees with HLB and Phytophthora foot rot. The smallest leaves were found in those trees that were affected with both diseases. This indicates that disease status can additively affect leaf expansion and the resulting leaf size.
SPAD has been previously correlated with N and chlorophyll in leaves [24]. This nondestructive measurement is related to plant nutritional status and can indicate deficiencies [24]. In this study, there was no difference is SPAD except when tree had Phytophthora foot rot. This means SPAD was only significantly affected by Phytophthora spp. infection. While Stover et al., (2016) [41] found that there seemed to be a relationship between CLas titer and SPAD, the results were not consistent between citrus genotypes. This current experiment did not show a relationship between SPAD and HLB, supporting the findings that SPAD is not a reliable indicator of leaf chlorophyll changes due to HLB. Furthermore, SPAD measurements were conducted on random leaves which were not necessarily symptomatic for HLB; selecting for symptomatic leaves may alter these findings and a better relationship could be established.
To determine which factors were correlated with disease as affected by plant physiological parameters and nutritional status, a correlation analysis was conducted. This analysis showed that as qPCR threshold cycle (Ct) values decreased, indicating more CLas present, leaf area and TGI values declined, suggesting that CLas is suppressing leaf growth and is also impacting TGI in UAV images. The inverse relationship between Phytophthora foot rot, Mg, and TGI indicates that Phytophthora spp. infection decreased tree greenness and could have affected Mg absorption. As leaf area increased, TGI, K, and Mg increased, while SPAD, Na, Fe, and B decreased. This implies that Na, Fe, and B negatively affected leaf size while K and Mg increased leaf size. This was similar to what was found by Battie-Laclau et al. [42] who showed that K helped increased leaf area while excess Na had a negative impact. TGI was not correlated to SPAD or N indicating this relationship needs to be explored further. The relationship between SPAD and N and chlorophyll content has been previously established [10]. However, it was not correlated in this experiment, but was positively related to Ca, Na, and B. This brings into question whether SPAD is a good indicator of N status when the tree is infected with one or more diseases. TGI shows a positive relationship with K, which plays a role in maintaining water status. TGI was negatively related to Na and Fe, which might indicate some toxic effects of these elements.

5. Conclusions

HLB and Phytophthora foot rot are important diseases in citrus, and monitoring disease symptoms can help producers better manage their crops. Using UAVs to calculate TGI can simplify this process by distinguishing between the diseases over a large area in a short amount of time. This study found that TGI was different depending on disease or in combination of diseases and also explained which factors were involved in these differences. Relationships between the mineral nutrients, specifically K, Na, Ca, Fe, and Phytophthora foot rot infection affected TGI. This shows that the impact that diseases have on tree health can be observed using UAVs. However, this is likely affected by crop, timing, management, and other environmental factors hindering the assessment. Identifying the exact factors that influence TGI in diseased trees may take an extended period of time to evaluate as well. While more factors will have to be collected to explain the entire relationship between TGI, plant disease, and nutrition, this study provides a good basis for future research.

Author Contributions

Author contributions are listed as follows: Conceptualization, V.A., J.E. and C.S.; Data curation, B.N.G., V.A., J.E., H.L.P.-B., M.K. and C.S.; Formal analysis, B.N.G., H.L.P.-B. and C.S.; Investigation, B.N.G., V.A., J.E., M.K. and C.S.; Methodology, B.N.G., V.A., J.E., H.L.P.-B., M.K. and C.S.; Project administration, C.S.; Resources, J.E., H.L.P.-B. and C.S.; Software, B.N.G., H.L.P.-B. and C.S.; Supervision, C.S.; Validation, B.N.G., V.A., H.L.P.-B. and C.S.; Visualization, C.S.; Writing—original draft, B.N.G. and C.S.; Writing—review & editing, V.A., J.E., H.L.P.-B., M.K. and C.S. All authors have read and agreed to the published version of the manuscript.

Funding

This research received partial support from USDA/NIFA HSI Award No. 2016-38422-25543; “Experiential Learning in Use of Unmanned Aerial Systems (UAS) Technology for Agriculture Applications”.

Acknowledgments

The authors would like to thank Chris Flores-Lopez, Jorge Solorzano, and Julissa Rodriguez for their assistance in taking field measurements. Special thanks to Mamoudou Setamou for advice and assistance in statistical analysis.

Conflicts of Interest

The authors declare no conflict of interest.

References

  1. Simmons, D. Citrus Fruits: Production, Consumption and Health Benefits; Nova Science Publishers: New York, NY, USA, 2016. [Google Scholar]
  2. USDA-NASS. Texas Citrus Production. 2018, 9992, 1–2. Available online: https://www.nass.usda.gov/Publications/Todays_Reports/reports/cfrt0818.pdf (accessed on 30 December 2019).
  3. Li, H. Citrus Tree Abiotic and Biotic Stress and Implication of Simulation and Modeling Tools in Tree Management. Tree For. Sci. Biotechnol. 2009, 3, 66–78. [Google Scholar]
  4. Bové, J.M. Huanglongbing: A destructive, newly-emerging, century-old disease of citrus. J. Plant Pathol. 2006, 88, 7–37. [Google Scholar]
  5. Chaudhary, S. Identification and characterization of Phytophthora isolates from citrus orchards of South Texas. In Proceedings of the American Phytopathological Society Annual Meeting, At San Antonio, TX, USA, 31 January 2017. [Google Scholar]
  6. Kunta, M.; Setamou, M.; Skaria, M.; Rascoe, J.; Li, W.; Nakhla, M.; daGraca, J. First report of citrus huanglongbing in Texas. Phytopathology 2012, 102, 66. [Google Scholar]
  7. Home, J.; Picks, E.; Health, P.; Health, P. Home|Log In Citrus Huanglongbing: The Pathogen and Its Impact. Plant Health Prog. 2018, 1–46. [Google Scholar] [CrossRef] [Green Version]
  8. Graham, J.H.; Timmer, L.W. Phytophthora Diseases of Citrus; University of Florida IFAS Extesion: Gainesville, FL, USA, 2003. [Google Scholar]
  9. Ciancio, A.; Mukerji, K.G. (Eds.) Management of citrus diseases caused by Phytopthora spp. In Integrated Management of Diseases Caused by Fungi, Phytoplasma and Bacteria; Springer: Dordrecht, The Netherlands, 2008. [Google Scholar]
  10. Hunt, E.R.; Perry, E.M.; Doraiswamy, P.C.; McMurtrey, J.E.; Daughtry, C.S.; Akhmedov, B. A visible band index for remote sensing leaf chlorophyll content at the canopy scale. Int. J. Appl. Earth Obs. Geoinf. 2013, 21, 103–112. [Google Scholar] [CrossRef] [Green Version]
  11. Sankaran, S.; Ehsani, R. Visible-near infrared spectroscopy based citrus greening detection: Evaluation of spectral feature extraction techniques. Crop Prot. 2011, 30, 1508–1513. [Google Scholar] [CrossRef]
  12. Sankaran, S.; Mishra, A.; Maja, J.M.; Ehsani, R. Visible-near infrared spectroscopy for detection of Huanglongbing in citrus orchards. Comput. Electron. Agric. 2011, 77, 127–134. [Google Scholar] [CrossRef]
  13. Mishra, A.; Karimi, D.; Ehsani, R.; Albrigo, L.G. Evaluation of an active optical sensor for detection of Huanglongbing (HLB) disease. Biosyst. Eng. 2011, 110, 302–309. [Google Scholar] [CrossRef]
  14. Gitelson, A.A.; Kaufman, Y.J.; Merzlyak, M.N. Use of a green channel in remote sensing of global vegetation from EOS-MODIS. Remote Sens. Environ. 1996, 58, 289–298. [Google Scholar] [CrossRef]
  15. Enciso, J.; Avila, C.; Jung, J.; Elsayed-Farag, S.; Chang, A.; Yeom, J.; Landivar, J.; Maeda, M.; Chavez, J. Validation of agronomic UAV and field measurements for tomato varieties. Comput. Electron. Agric. 2019, 15, 278–283. [Google Scholar] [CrossRef]
  16. Louhaichi, M.; Borman, M.M.; Johnson, D.E. Spatially located platform and aerial photography for documentation of grazing impacts on wheat. Geocarto Int. 2001, 16, 65–70. [Google Scholar] [CrossRef]
  17. Hunt, R.E.; Daughtry, C.S.T.; Eitel, J.U.H.; Long, D.S. Remote sensing leaf chlorophyll content using a visible band index. Agron. J. Abstr. 2011, 103, 1090–1099. [Google Scholar] [CrossRef] [Green Version]
  18. Garcia-Ruiz, F.; Sankaran, S.; Maja, J.M.; Lee, S.; Rasmussen, J.; Ehsani, R. Comparison of two aerial imaging platforms for identification of Huanglongbing-infected citrus trees. Comput. Electron. Agric. 2013, 91, 106–115. [Google Scholar] [CrossRef]
  19. Dadras Javan, F.; Samadzadegan, F.; Seyed Pourazar, S.H.; Fazeli, H. UAV-based multispectral imagery for fast Citrus Greening detection. J. Plant Dis. Prot. 2019, 126, 307–318. [Google Scholar] [CrossRef]
  20. Salgadoe, A.; Robson, A.; Lamb, D.; Dann, E.; Searle, C. Quantifying the severity of phytophthora root rot disease in avocado trees using image analysis. Remote Sens. 2018, 10, 226. [Google Scholar] [CrossRef] [Green Version]
  21. Mekonen, M.; Ayalew, A.; Weldetsadik, K.; Seid, A. Assessing and Measuring of Citrus gummosis (Phytophthora spp.) in Major Citrus Growing Areas of Ethiopia. J. Hortic. 2015, 2, 2–5. [Google Scholar]
  22. Li, W.; Hartung, J.S.; Levy, L. Quantitative real-time PCR for detection and identification of Candidatus Liberibacter species associated with citrus huanglongbing. J. Microbiol. Methods 2006, 66, 104–115. [Google Scholar] [CrossRef]
  23. Kunta, M.; Viloria, Z.; del Rio, H.S.; Louzada, E.S. Diverse DNA extraction methods and PCR primers for detection of Huanglongbing-associated bacteria from roots of ‘Valencia’ sweet orange on sour orange rootstock. Sci. Hortic. 2014, 178, 23–30. [Google Scholar] [CrossRef]
  24. Jifon, J.L.; Syvertsen, J.P.; Whaley, E. Growth environment and leaf anatomy affect nondestructive estimates of chlorophyll and nitrogen in Citrus sp. leaves. J. Am. Soc. Hortic. Sci. 2005, 130, 152–158. [Google Scholar] [CrossRef] [Green Version]
  25. Su, T.; Chou, H. Application of multispectral sensors carried on unmanned aerial vehicle (UAV) to trophic state mapping of small reservoirs: A case study of Tain-Pu reservoir in Kinmen, Taiwan. Remote Sens. 2015, 7, 10078–10097. [Google Scholar] [CrossRef] [Green Version]
  26. Oppelt, N.; Mauser, W. Hyperspectral monitoring of physiological parameters of wheat during a vegetation period using AVIS data. Int. J. Remote Sens. 2004, 25, 145–157. [Google Scholar] [CrossRef]
  27. Congalton, R.G. A review of assessing the accuracy of classifications of remotely sensed data. Remote Sens. Environ. 1991, 37, 35–46. [Google Scholar] [CrossRef]
  28. Morales-Barquero, L.; Lyons, M.B.; Phinn, S.R.; Roelfsema, C.M. Trends in Remote Sensing Accuracy Assessment Approaches in the Context of Natural Resources. Remote Sens. 2019, 11, 2305. [Google Scholar] [CrossRef] [Green Version]
  29. Little, T.M. Agricultural Experimentation: Design and Analysis; Wiley & Sons: New York, NY, USA, 1978. [Google Scholar]
  30. Foster, A.J.; Kakani, V.G.; Ge, J.; Gregory, M.; Mosali, J.; Gopal Kakani, V. Discriminant analysis of nitrogen treatments in switchgrass and high biomass sorghum using leaf and canopy-scale reflectance spectroscopy Discriminant analysis of nitrogen treatments in switchgrass and high biomass. Int. J. Remote Sens. 2016, 37, 2252–2279. [Google Scholar] [CrossRef]
  31. Sancho-Adamson, M.; Trillas, M.; Bort, J.; Fernandez-Gallego, J.; Romanyà, J. Use of RGB Vegetation Indexes in Assessing Early Effects of Verticillium Wilt of Olive in Asymptomatic Plants in High and Low Fertility Scenarios. Remote Sens. 2019, 11, 607. [Google Scholar] [CrossRef] [Green Version]
  32. Ayala-Silva, T.; Beyl, C.A. Changes in spectral reflectance of wheat leaves in response to specific macronutrient deficiency. Adv. Space Res. 2005, 35, 305–317. [Google Scholar] [CrossRef]
  33. Gitelson, A.A.; Gritz, Y.; Merzlyak, M.N. Relationships between leaf chlorophyll content and spectral reflectance and algorithms for non-destructive chlorophyll assessment in higher plant leaves. J. Plant Physiol. 2003, 160, 271–282. [Google Scholar] [CrossRef]
  34. Smith, P. A case of sodium toxicity in citrus. Proc. Fla. State Hort. Soc. 1962, 120–124. [Google Scholar]
  35. Bernstein, L.; Hayward, H.E. Physiology of salt tolerance. Annu. Rev. Plant Physiol. 1958, 9, 25–46. [Google Scholar] [CrossRef]
  36. Obreza, T.; Alva, A.; Hanlon, E.; Rouse, R. Citrus Grove Leaf Tissue and Soil Testing: Sampling, Analysis, and Interpretation; University of Florida IFAS Extesion: Gainesville, FL, USA, 1992. [Google Scholar]
  37. Nebiker, S.; Lack, N.; Abächerli, M.; Läderach, S. Light-weight multispectral uav sensors and their capabilities for predicting grain yield and detecting plant diseases. In Proceedings of the 2016XXIII ISPR Congress on International Archives of Photogrammetry, Remote Sensing and Spatial Information Sciences, Prague, Crech, 12–19 July 2016; Volume XLI-B1. [Google Scholar]
  38. Pourreza, A.; Lee, W.S.; Ehsani, R.; Schueller, J.K.; Raveh, E. An optimum method for real-time in-field detection of Huanglongbing disease using a vision sensor. Comput. Electron. Agric. 2015, 110, 221–232. [Google Scholar] [CrossRef]
  39. Mahlein, A.; Rumpf, T.; Welke, P.; Dehne, H.; Plümer, L.; Steiner, U.; Oerke, E. Development of spectral indices for detecting and identifying plant diseases. Remote Sens. Environ. 2013, 128, 21–30. [Google Scholar] [CrossRef]
  40. Taiz, L.; Zeiger, E.; Moller, I.M.; Murphy, A. Plant Physiology and Development, 6th ed.; Sinauer Associates, Inc.: Sunderland, MA, USA, 2015; ISBN 978-1-60535-255-8. [Google Scholar]
  41. Stover, E.; Shatters, R.G.; Gruber, B.; Kumar, P.; Moore, G.A. Influence of Photoperiod Duration and Phloem Disruption through Scoring on Growth, Disease Symptoms, and Bacterial Titer in Citrus Graft Inoculated with Candidatus Liberibacter asiaticus. HortScience 2016, 51, 1215–1219. [Google Scholar] [CrossRef]
  42. Battie-Laclau, P.; Laclau, J.; Piccolo, M.; Arenque, B.C.; Beri, C.; Mietton, L.; Muniz, M.R.A.; Jordan-Meille, L.; Buckeridge, M.S.; Nouvellon, Y.; et al. Influence of potassium and sodium nutrition on leaf area components in Eucalyptus grandis trees. Plant Soil 2013, 371, 19–35. [Google Scholar] [CrossRef]
Figure 1. Orthomosaic of selected trees of field conducted using Pix4D Mapper. Numbered trees from 1–10 are HLB and Phytophthora foot rot negative (yellow), 11–20 (orange) are HLB negative and Phytophthora foot rot positive, 21–30 (green) are HLB positive and Phytophthora foot rot negative, and 31–40 (blue) are HLB and Phytophthora foot rot positive.
Remotesensing 12 00170 g001
Figure 2. Field measurements of selected citrus trees according to disease status, (A) Average leaf area of trees in different disease classes, (B) Average SPAD of trees in different disease classes, (C) Average greenness index (TGI) of trees in different disease classes as calculated from the UAV images. Error bars are ±1 standard error of the mean. Different letters represent significant differences as determined by Students t. p-values for significant treatments are represented as “p classification or p treatment”.
Remotesensing 12 00170 g002
Table 1. Nutritional analysis of trees in different disease classifications. Different letters represent significant differences as determined by Students t (p = 0.05). Bold values indicate nutrient deficiencies.
Disease ClassN (%)P (ppm)K (ppm)Ca (ppm)Mg (ppm)Na (ppm)Zn (ppm)Fe (ppm)Cu (ppm)Mn (ppm)S (ppm)B (ppm)
HLB − Phy −1.921663.7316,050.7166,935.563450.68919.89 b54.9282.855.2036.175730.17169.98
HLB − Phy +2.011777.4014,700.2068,689.003100.901056.5 b54.1085.605.7036.305829.80182.50
HLB + Phy −2.091914.3016,051.6065,815.303351.701216.1 b59.8089.205.6038.906148.50173.60
HLB + Phy +2.091777.1014,304.5065,309.403288.201685.4 a55.0087.906.6038.006208.70200.20
p classification0.3340.6070.6360.9770.1720.0010.6470.8130.2280.5290.3490.430
Table 2. Correlation of measured physiological, disease, and extrapolated factors. The significant correlations are shown in italics, bold, or italics and bold numbers with increasing significance. Positive values indicate positive relationships while the negative values indicate negative relationships between variables.
CLas TiterFoot Rot Disease Leaf AreaSPADN%PKCaMgNaZnFeCuMnSBTGI
CLas titer1.0000
Foot rot Disease 0.07041.0000
Leaf area0.3757−0.25241.0000
SPAD−0.1611−0.0777−0.34391.0000
N%−0.22910.1195−0.1853−0.14481.0000
P−0.1035−0.02460.1962−0.51750.57171.000
K0.0454−0.20110.2696−0.44380.40450.72591.0000
Ca0.08050.0107−0.02700.3793−0.6928−0.7315−0.63671.0000
Mg0.0079−0.37240.2816−0.1046−0.0631−0.15090.01450.08841.0000
Na−0.45180.2100−0.50990.37140.0458−0.2512−0.50690.2761−0.13471.0000
Zn−0.1023−0.1374−0.0459−0.40250.39940.52900.4332−0.3840−0.0074−0.13761.0000
Fe−0.28010.0566−0.36710.14870.2478−0.01890.0132−0.2583−0.10900.26000.04171.0000
Cu−0.26790.2290−0.2595−0.04630.42630.51190.3593−0.3941−0.45320.22330.16380.45241.000
Mn−0.3009−0.0686−0.0862−0.26040.01970.32880.2234−0.2688−0.0836−0.06320.67820.21600.29351.0000
S−0.26360.01340.1215−0.0213−0.32730.0457−0.01060.30200.05980.1314−0.0358−0.05680.06880.12861.0000
B−0.21240.1755−0.34230.4051−0.5240−0.4842−0.49960.5715−0.35260.5306−0.29700.11290.07830.09870.49071.0000
TGI0.3351−0.36490.4512−0.0737−0.16640.08290.37920.14820.1520−0.54410.1012−0.4513−0.2358−0.10240.0088−0.20431.0000
p0.0001, p = 0.05, p = 0.
Table 3. Stepwise regression analysis for factors influencing TGI.
Summary of Stepwise Selection
StepVariableVariable NumberPartial R-SquareModel R-SquareC(p)F ValuePr > F
1Na10.29600.296014.357115.980.0003
2Fe20.10220.39829.04616.280.0167
3Foot rot disease30.06500.46326.39984.360.0440
4Ca40.03880.50205.62292.730.1075
5K50.11070.6127−0.29709.720.0037

