1. Introduction
Hyperspectral images (HSIs) have been widely used for various applications, such as precision agriculture [
1], anomalous target detection [
2], and environmental monitoring [
3]. It is necessary to accurately discriminate between different objects in HSIs. Difficulties of HSI classification are caused by the following problems: First, only limited ground truth data is available. Second, information redundancy and the Hughes phenomenon [
4] mean that an increase in the data dimension will lead to a decrease in classification accuracy when the number of training samples is fixed, which prevents the improvement of classification accuracies. Finally, HSIs are often contaminated by different types of noise and is dominated by mixed pixels. To overcome these problems, many pixel-wise classification methods have been proposed, such as using a support vector machine (SVM) [
5,
6] and multinomial logistic regression [
7,
8,
9]. However, such methods only consider the spectral characteristics of each pixel and ignores the spatial relationship between pixels, which can easily cause classification maps to have a lot of “salt-and-pepper” noise.
To further improve classification accuracy of HSIs, various spectral-spatial methods have been presented [
10,
11,
12,
13,
14,
15,
16,
17,
18,
19,
20,
21,
22,
23]. Different from those pixel-wise methods, the spectral-spatial methods perform image classification by employing both spectral and spatial information in the image. It has been confirmed that the inclusion of spatial information can greatly improve the classification accuracy of HSIs [
24,
25,
26]. Typically, these methods can be divided into three branches. The first branch is based on spatial information extraction. Specifically, the spatial and spectral information is combined either by using a single kernel with stacked vectors or multiple kernels. The spatial feature extraction can be conducted using mean filtering [
27], area filtering [
13], Gabor filtering [
28], a gray-level co-occurrence matrix [
29], edge-preserving filtering (EPF) [
17], and extended morphological profiles (EMPs) [
30]. The main disadvantage is that these methods cannot effectively avoid the “salt-and-pepper” noise effect caused by misclassified pixels. In the second branch, Markov random field (MRF) models are used to combine the spectral and spatial information due to its intuition and effectiveness. By applying the maximum a posteriori (MAP) decision rule, HSI classification can be converted, thereby solving the problem of minimizing a MAP-MRF energy function. The most typical representative of this branch is the combination of SVM and MRF [
16,
31,
32,
33,
34,
35,
36]. The main problem involved with this branch is the assumption that neighboring pixels should have the same class labels, which leads to over-smoothed classification maps, meaning that the object boundaries between different classes cannot be determined most effectively. To solve this problem, the third branch of object-based classification methods has been developed [
37]. The main idea of these methods is to partition the image into different regions to effectively preserve the object boundaries and overcome the misclassification effect. Then, a final classification map is obtained by combining its pixel-wise classification map and its segmentation map by employing a majority voting algorithm. The segmentation map can be obtained by using the most popular unsupervised algorithms, such as mean-shift [
38], watershed [
39], hierarchical segmentation [
23,
40], minimum spanning forest [
41], and graph cut [
42]. The main challenge is to obtain accurate object-based segmentation results of HSIs.
To obtain accurate classification results, kernel-based methods have been widely used to fuse different features because they can overcome several problems of HSI classification, such as the curse of dimensionality, limited ground truth data, and noise contamination. As a result, these methods have become conventional classification techniques. The most representative method is the SVM classifier employing a linear, polynomial, sigmoid, or Gaussian radial basis function (RBF) kernel, which is the function of only spectral characteristics. Although single kernel based SVMs can be improved by using stacked vectors to include spectral and spatial information, it requires more computational time to classify HSIs by using the improved SVMs. To deal with this problem, Camps-Valls et al. [
27] formulated a general classification framework for composite kernels. Specifically, two kernel functions are presented to integrate the spectral and spatial information in the ways of direct summation and weighted summation. Afterwards, Li et al. [
43] formulated a generalized composite kernel (GCK) framework for HSI classification, and modeled spatial information using the EMPs. Later, Wang et al. [
44] presented a HSI classification method, in which spectral, spatial, and hierarchical structure information was combined into an SVM classifier by using composite kernels. Based on this work, they presented its improved version by using multiscale information fusion [
45].
To produce more accurate classification results, the two techniques of multiple kernel and superpixel have been combined for HSI classification in several previous studies. Fauvel et al. [
13] proposed a novel SVM characterized with a customized spectral-spatial kernel where the spatial features are represented with the median value of each superpixel defined using morphological area filtering. Fang et al. [
46] extended this work by taking into account the spatial features among different superpixels using weighted average filtering, and constructed three kernels to represent the spectral features, the spatial features within and among the superpixels, respectively. More recently, we presented a spectral-texture SVM method for HSI classification, in which the texture features are extracted within each superpixel by using a local spectral histogram [
47]. The integrated methods mentioned above use only superpixels to fine tune the extracted spectral or spatial features, and to reduce the heterogeneity between features by using the mean filtering or average features of the pixels within each superpixel. Therefore, using superpixels as a simple spatial boundary constraint cannot make full advantages of superpixel attributes. Although the noise effect in classification maps by these methods can be effectively reduced, classification accuracy cannot be further improved.
The purpose of this study is to solve the above two problems and retain the integration framework. To obtain more accurate classification results, some new discriminative features should be intuitively obtained as a supplement to the spectral and spatial information, because they not only consider the characteristics of the pixels inside the superpixel, but also express the relationship between adjacent superpixels. Therefore, high classification accuracy can be achieved compared with the aforementioned methods using simply superpixels to improve the quality of spatial information, which means that they reduce interferences by using mean filtering or simply average features to process pixels inside each superpixel. It is necessary to treat each single superpixel as an independent entity rather than a simple spatial boundary constraint. For object-oriented classification methods, a superpixel composed of highly uniform pixels actually represents a specific scene in an image. Inspired by this idea, the semantic features related to superpixels are naturally produced to provide a specific meaning to each superpixel. Semantic analysis has attracted wide attention in the field of object classification and clustering of remote sensing images [
48,
49]. In this work, an effective SVM classification method is presented, which involves combining the spectral, spatial, and semantic features of HSIs. The main contributions of this work are summarized as follows: First, the proposed method attempts to use superpixels to extract the semantic information of HSIs as a very important supplement in addition to spectral and spatial information. Second, the proposed method is introduced by integrating spectral, spatial and semantic information into the SVM classifier through multiple kernels. Specifically, the spectral information is defined by directly using the spectral features of each pixel, and the spatial information is modeled by combining the EMP and Gabor features of HSIs to construct a stacked vector. Pesaresi and Benediktsson [
50] reported that the size of different structures of HSIs can be represented by using the EMP, and a set of Gabor filters with different frequencies and orientations has been widely used for texture representation of images, and the semantic information is obtained by using a bag of visual words (BOVW) model.
The rest of the paper is organized as follows:
Section 2 reviews the related techniques,
Section 3 describes the proposed method,
Section 4 provides a comparison of the proposed method with other state-of-the-art HSI classification methods,
Section 5 discusses some issues, and the concluding remarks and future work are summarized in the last section.
2. Related Techniques
Spatial information is usually divided into two categories: texture and shape features. The two features are stacked to fully model the spatial information and two techniques of superpixel segmentation and BOVW are used to obtain semantic features. In addition, all the features are then fused into a composite kernel and fed into the SVM classifier. In this section, spatial feature extraction techniques, superpixel segmentation, BOVW, and the principles of composite kernel methods are briefly introduced.
2.1. SVM Model and Kernel Functions
Given a set of training samples
,
and
, SVM solves the following problem:
where
is a nonlinear mapping function which transforms the input samples
into a higher dimensional space,
C controls the generalization capability of the classifier,
ω and
b define the linear classifier in the feature space, and
are positive slack variables dealing with permitted errors. The optimal hyperplane is identified by solving the following Lagrangian dual problem as follows:
where
is a set of coefficients associated with the training set. The mapping function
is represented in the form of an inner product, which makes it possible to define the kernel function
K as follows:
Substituting (2) with the kernel function (3), the decision rule for the dual problem can be built as follows:
For SVM, the widely used RBF kernel is defined as follows:
where
γ is the inverse width of the kernel function. Let
and
represent the spectral and spatial features, respectively, and
the concatenation of the two features, the typical spectral, and spatial kernels can be defined using the RBF kernel as follows:
To combine the spectral and spatial features for HSI classification, Camps-Valls et al. [
27] presented a spectral-spatial composite kernel as a weighted summation of (6) and (7) as follows:
where
μ is a weight used to balance the spectral and spatial kernels. After incorporating (8) into (4), a new decision function for classification can be obtained. In reference [
27], the mean and variance within a fixed-size window are computed for each pixel to model the spatial information. The SVM classifier with the composite kernel (8) can effectively combine the spectral and spatial information, which provides a reasonable way to improve the classification accuracy. In the paper, the SVM is adopted as the basic classifier.
2.2. Gabor Filter
Gabor filters are band-pass filters which were inspired by a multiband filtering theory for processing visual information in the human visual system. This technique has been widely used for feature extraction and texture representation because it is capable of performing multi-resolution decomposition due to its localization both in spatial and spatial frequency. Gabor filters are a set of scale-direction filters, which are obtained using:
from a mother wavelet:
in which:
where
and
are the scale and direction indices of wavelets,
Uh and
Ul are the minimum and maximum center frequencies of filters on the
u axis in the two-dimensional frequency domain, and
x0 and
y0 are the filters’ center coordination in the spatial domain, respectively [
51]. The Gabor filters constitute the texture part of spatial features.
2.3. Morphological Profiles
The main function of EMP is to reconstruct the spatial information by using morphological (opening/closing) operators, while preserving image edge features. Let
k and
n be the total of the required principal components (PCs) and the morphological operators, respectively,
ψ and
η be the opening and closing operations in morphology, respectively,
I be a single-band image, and
B be the total of spectral bands for a HSI, then the morphological profile (MP) for
I can be defined as follows:
According to (12), the MP is a (2
n + 1)-band image. Actually, we can construct the MP for each spectral band of the HSI without feature selection, which causes the following limitations. Firstly, information redundancy cannot be avoided in the
B(2
n + 1)-band image, which may reduce the classification accuracies. Secondly, the classification process using such high-dimensional data leads to much higher computational costs. To solve these problems, the principal component analysis (PCA) [
28] technique is used in this work. Specifically, the PCA transform was used in the original work for producing the EMP. For each PC, the MP is a (2
n + 1)-band image. Then, the EMP can be obtained by stacking the MPs as follows:
where EMP is a
-d vector and contains both the spectral and spatial information and models the shape information of spatial features.
2.4. Entropy Rate Superpixel (ERS)
Superpixel segmentation is an important module for many computer vision tasks such as object recognition and image segmentation [
52], and can be formulated as an optimization problem on an undirected graph
G (
V,
E), where two sets of
V and
E are the pixels of the base image and the pairwise similarity of adjacent pixels, respectively. We can consider image segmentation as a graph partitioning problem, i.e., to select a subset from
E to construct a compact, homogeneous, and balanced subgraph which corresponds to a superpixel and maximize the objective function as follows:
where
λ is the weight to balance the two terms,
NA is the number of connected components in the graph, and
H (
A) is the entropy rate of the random walk on a graph to obtain compact and homogeneous clusters and can be represented as follows:
where
,
is the sum of the weights of the edges connected to the
ith vertex and
is used for normalization, where
is the total of vertices in the graph and
denotes the transition probability. Let the graph partitioning for the edge set A to be
and
ZA and
NA to be the distribution of the cluster membership and the total of connected components with respect to
A in the graph, respectively. The distribution of
ZA is expressed as follows:
Then, the balancing term in (14) is presented to favor clusters with similar sizes as follows:
2.5. Bag of Visual Words (BOVW)
The BOVW method is derived from the bag of words (BOW) model, which has been used in the field of text classification. In the BOW model, a set of words is selected based on the text document to be classified to construct a word dictionary, and the document is then encoded into a histogram to indicate the number of occurrences of each selected word. It is reasonable to speculate that an image can be characterized by using a histogram of visual word counts.
To apply the BOVW method to perform image classification, a series of images can be considered as a document. Unlike text classification, the BOVW method does not have a given visual word dictionary, also known as a codebook. The two main steps to construct a visual word dictionary are summarized as follows. First, each image is characterized as a bunch of feature vectors by feature detection technique such as scale-invariant feature transform. These features are usually regarded as low-level features, also known as visual words. By clustering all these low-level features into k groups, the visual word dictionary of all the images is built by k cluster centers. Then, each image can be represented as a histogram feature vector by counting the numbers of occurrences of low-level features belonging to different visual word dictionaries. Histogram vectors can be regarded as semantic features and can be further used for image classification. In fact, semantic information is capable of providing “medium-level” features, which helps to bridge the huge semantic gap between low-level features extracted from images and high-level concepts to be classified. The main procedures of the BOW algorithm are summarized in Algorithm 1.
| Algorithm 1: BOW Algorithm |
| Input: a set of images, the number of cluster centers k. |
| Step 1: Local features detection. |
| Apply feature detection techniques for each image to extract key points which is also called visual words (vw). |
| Step 2: Visual word dictionary construction. |
| Cluster methods are adopted to divide all vws into k groups, the cluster centers constitute the visual-words dictionary. |
| Step 3: Histogram feature vectors construction |
| Count the numbers of vws belonging to different elements of visual-words dictionary (generally through calculating the Euclidean distance of feature vectors) which construct the histogram features vectors. |
3. Proposed Method
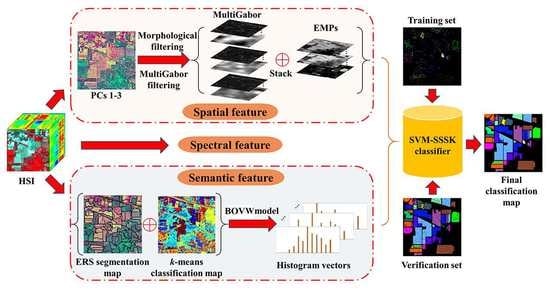
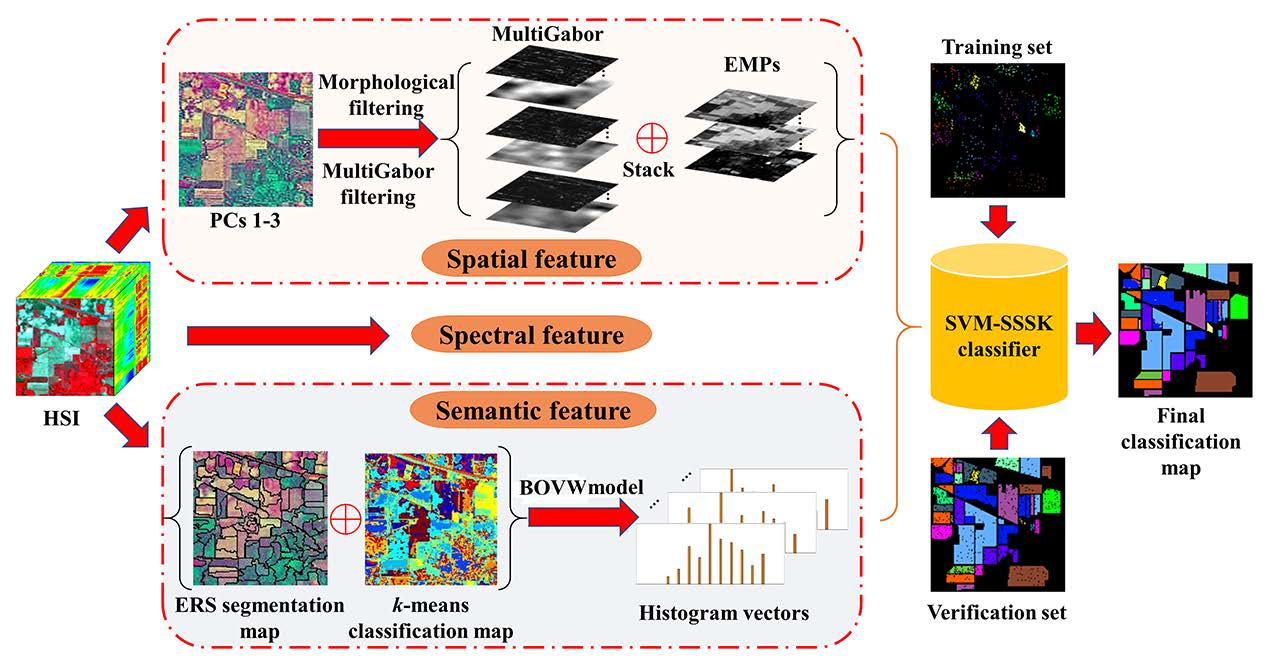
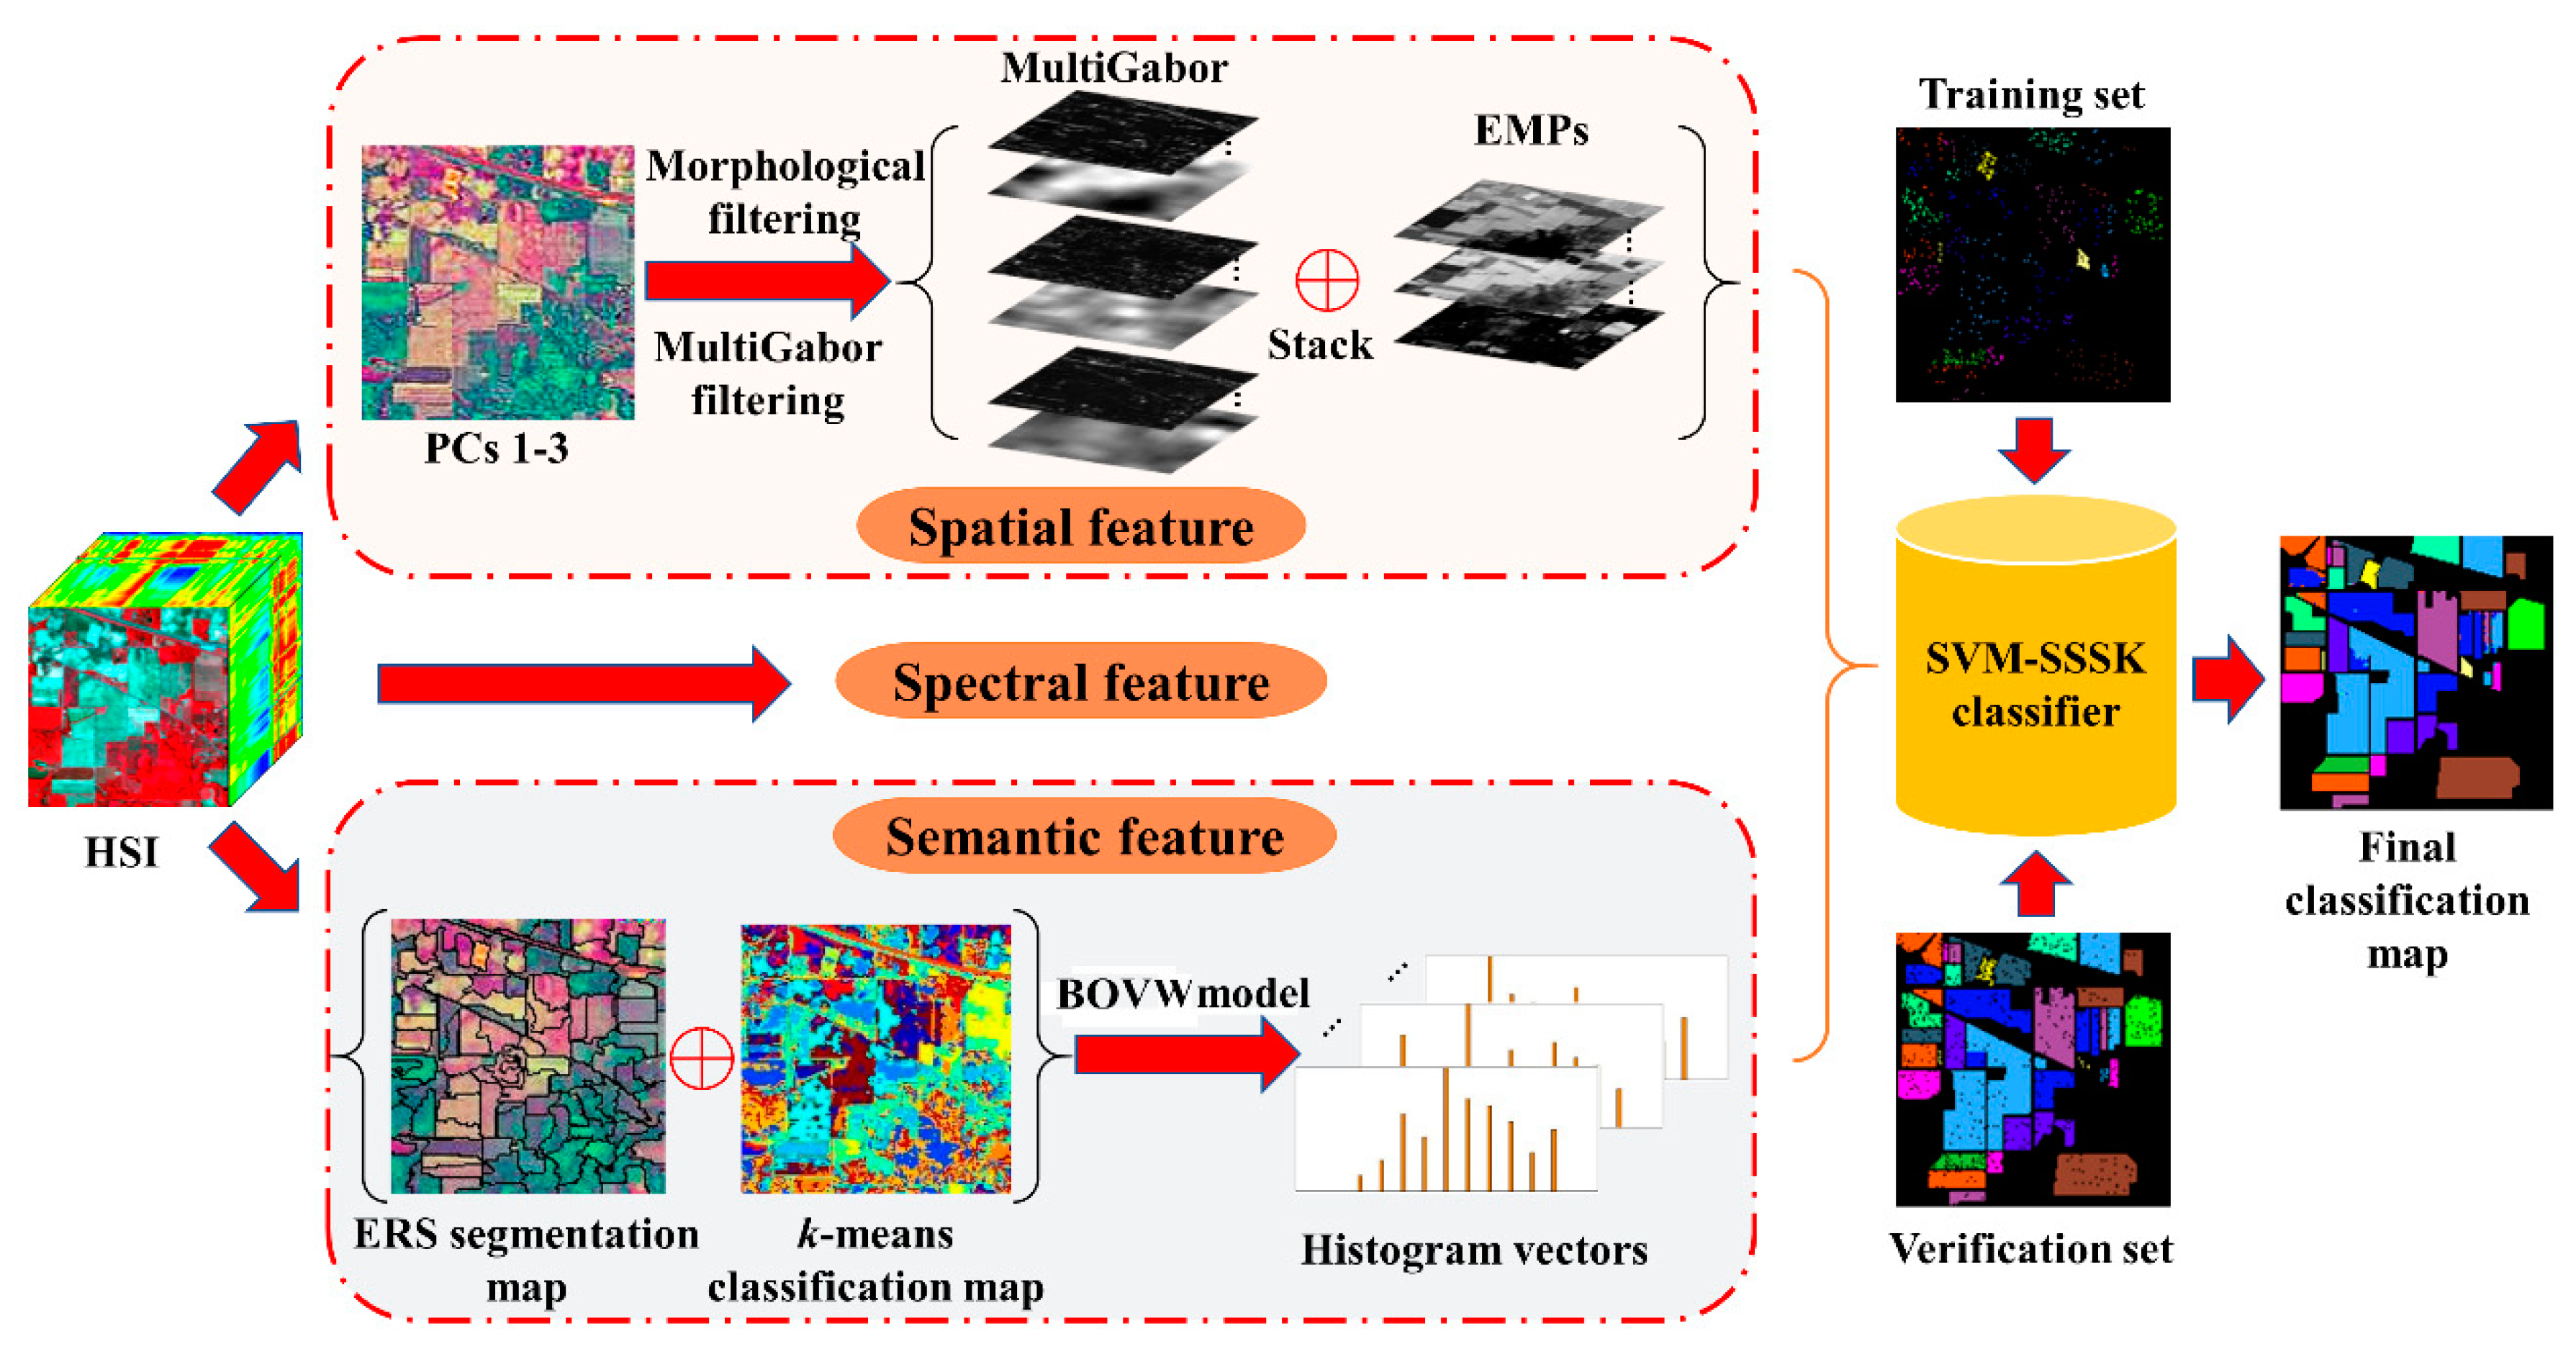
In this work, we present an SVM classifier with the spectral, spatial, and semantic kernels method (SVM-SSSK) for HSI classification. First, a PCA transform is performed on the original HSI to obtain the first three principle components (PCs 1–3). Then, the PCs 1–3 are used to obtain the EMP, Gabor features, and an ERS segmentation map. Next, to model the spatial information, the EMP and the Gabor features are combined to construct a new feature map, where each pixel is a stacked feature vector composed of structure and texture features. To ensure the uniform spatial characteristics, mean filtering is performed within each superpixel. Thereafter, to model the semantic information, a
k-means clustering map and the ERS segmentation map are integrated to produce a feature vector for each superpixel. In the following, three single kernels are constructed to represent spectral, spatial, and semantic information, respectively, and a composite kernel function is defined as the weighted sum of the three kernel functions. Finally, the final classification map is obtained by using the SVM classifier with the composite kernel. The flowchart of the proposed method is illustrated in
Figure 1.
3.1. Spatial Feature Extraction
To completely represent the spatial information, texture and structure features are directly combined for each pixel as a stacked vector. To this end, we use the EMP as the structure features of HSIs. The Gabor filter has been widely used for feature extraction for grayscale images and many studies have been proposed to extract the Gabor features from the first PC of HSIs. However, the texture information of some ground objects from PC 1 may not be sufficient to ensure there are better classification results. To avoid this problem, we performed the Gabor filtering on the PCs 1–3 in this work to extract the multiband Gabor (MultiGabor) features because these three PCs include over 99% of total variation in the image. A superpixel is usually defined as a uniform region in the image whose shape and size can be adaptive to different spatial structures. Nevertheless, each pixel corresponds to a stacked vector in the structure-texture feature image, which may be different from each other inside a superpixel. To ensure the uniform spatial features within each superpixel, the mean filtering is performed in each band of the structure-texture feature image. Eventually, the filtered spatial features are used for each pixel to construct the spatial kernel function.
3.2. Semantic Feature Extraction
Once the HSI has been segmented into nonoverlapping superpixels, each superpixel of the HSI can be considered as a separate image. Semantic features can represent similarities or differences between different superpixels. To extract the semantic features, the BOVW model was used in this work. Specifically, each superpixel can be regarded as a patch of an image in addition to being a document, and the spectral feature vector can also be used as a low-level feature. To group low-level features, the k-means clustering algorithm is used because of its simplicity, which indicates that the construction of a visual dictionary is an unsupervised process. Furthermore, it is more flexible to label the visual words since the number of the centers can be manually specified.
Once the visual word dictionary is constructed, the histogram information of visual words is used to describe the meaning of each superpixel. Specifically, the number of pixels inside each superpixel belonging to each cluster class is counted. Therefore, each superpixel can be represent by using a k × 1 histogram vector. In this way, the histogram vector of each superpixel can be used to represent semantic features. It should be noted that the pixels inside each superpixel should have the same semantic feature due to the homogeneity of the superpixel. The main procedures of semantic feature extraction are summarized in Algorithm 2.
| Algorithm 2: Semantic Feature Extraction |
| Input: An original HSI u, the ERS segmentation map us consisting of N superpixels, the number of cluster centroids k. |
| Step 1: Perform the k-means algorithm to cluster u into k cluster centers. |
| Step 2: For i = 1, 2, …, N |
- (a)
Count the number of pixels inside the ith superpixel belonging to each cluster. - (b)
Construct the k × 1 feature histogram vector as the semantic feature for the ith superpixel.
|
| End |
| Step 3: Obtain the Semantic feature extraction map. |
3.3. SVM-SSSK Method
So far, three different types of features have been obtained, namely, spectral, spatial and semantic. To fuse these features, the aforementioned composite kernel method was used to construct a novel HSI classification framework. Let
, so the composite kernel can be represented as follows:
which can be defined through the weighted summation of the spectral, spatial, and semantic kernel functions as follows:
where
,
and
are weights used to indicate the contribution of each piece of information involved in image classification. Let
,
and
be the spectral, spatial, and semantic features acquired from the training set
. The widely used Gaussian RBF kernel was utilized to compute the kernel matrix for each piece of information. As described in
Section 2.1, the spectral and spatial kernels are the same for (6) and (7) and the semantic function was defined as follows:
The main procedures of the proposed algorithm are summarized in Algorithm 3.
| Algorithm 3: SVM-SSSK |
| Input: An original HSI u, the available training/verification samples. |
| Step 1: Obtain PCs 1–3 of u; |
| Step 2: Perform the Gabor filtering on the PCs 1–3 to extract the MultiGabor features. |
| Step 3: Build the EMP by computing the MPs for the PCs 1–3 in Step 2 as described in Section 2.3. |
| Step 4: Conduct ERS as described in Section 2.4 obtain segmentation map with superpixels. |
| Step 5: Construct the spatial features as described in Section 3.1. |
| Step 6: Extract the semantic feature extraction by using Algorithm 1. |
| Step 7: Normalize u, the spatial feature, and semantic feature maps to (0,1). |
| Step 8: Construct the spectral, spatial, and semantic kernels as described in Section 3.3. |
| Step 9: Apply the SVM classifier with the proposed composite kernel in (20) to classify u using the training samples by choosing the optimized C and . |
| Step 10: Obtain the final classification map. |


