Cross-Matching VIIRS Boat Detections with Vessel Monitoring System Tracks in Indonesia

 ,
,  ,
, 
 ,
, 
Abstract
1. Introduction
2. Methodology
2.1. Data Collection
2.1.1. VMS
2.1.2. VBD
2.2. Vessel Location Prediction
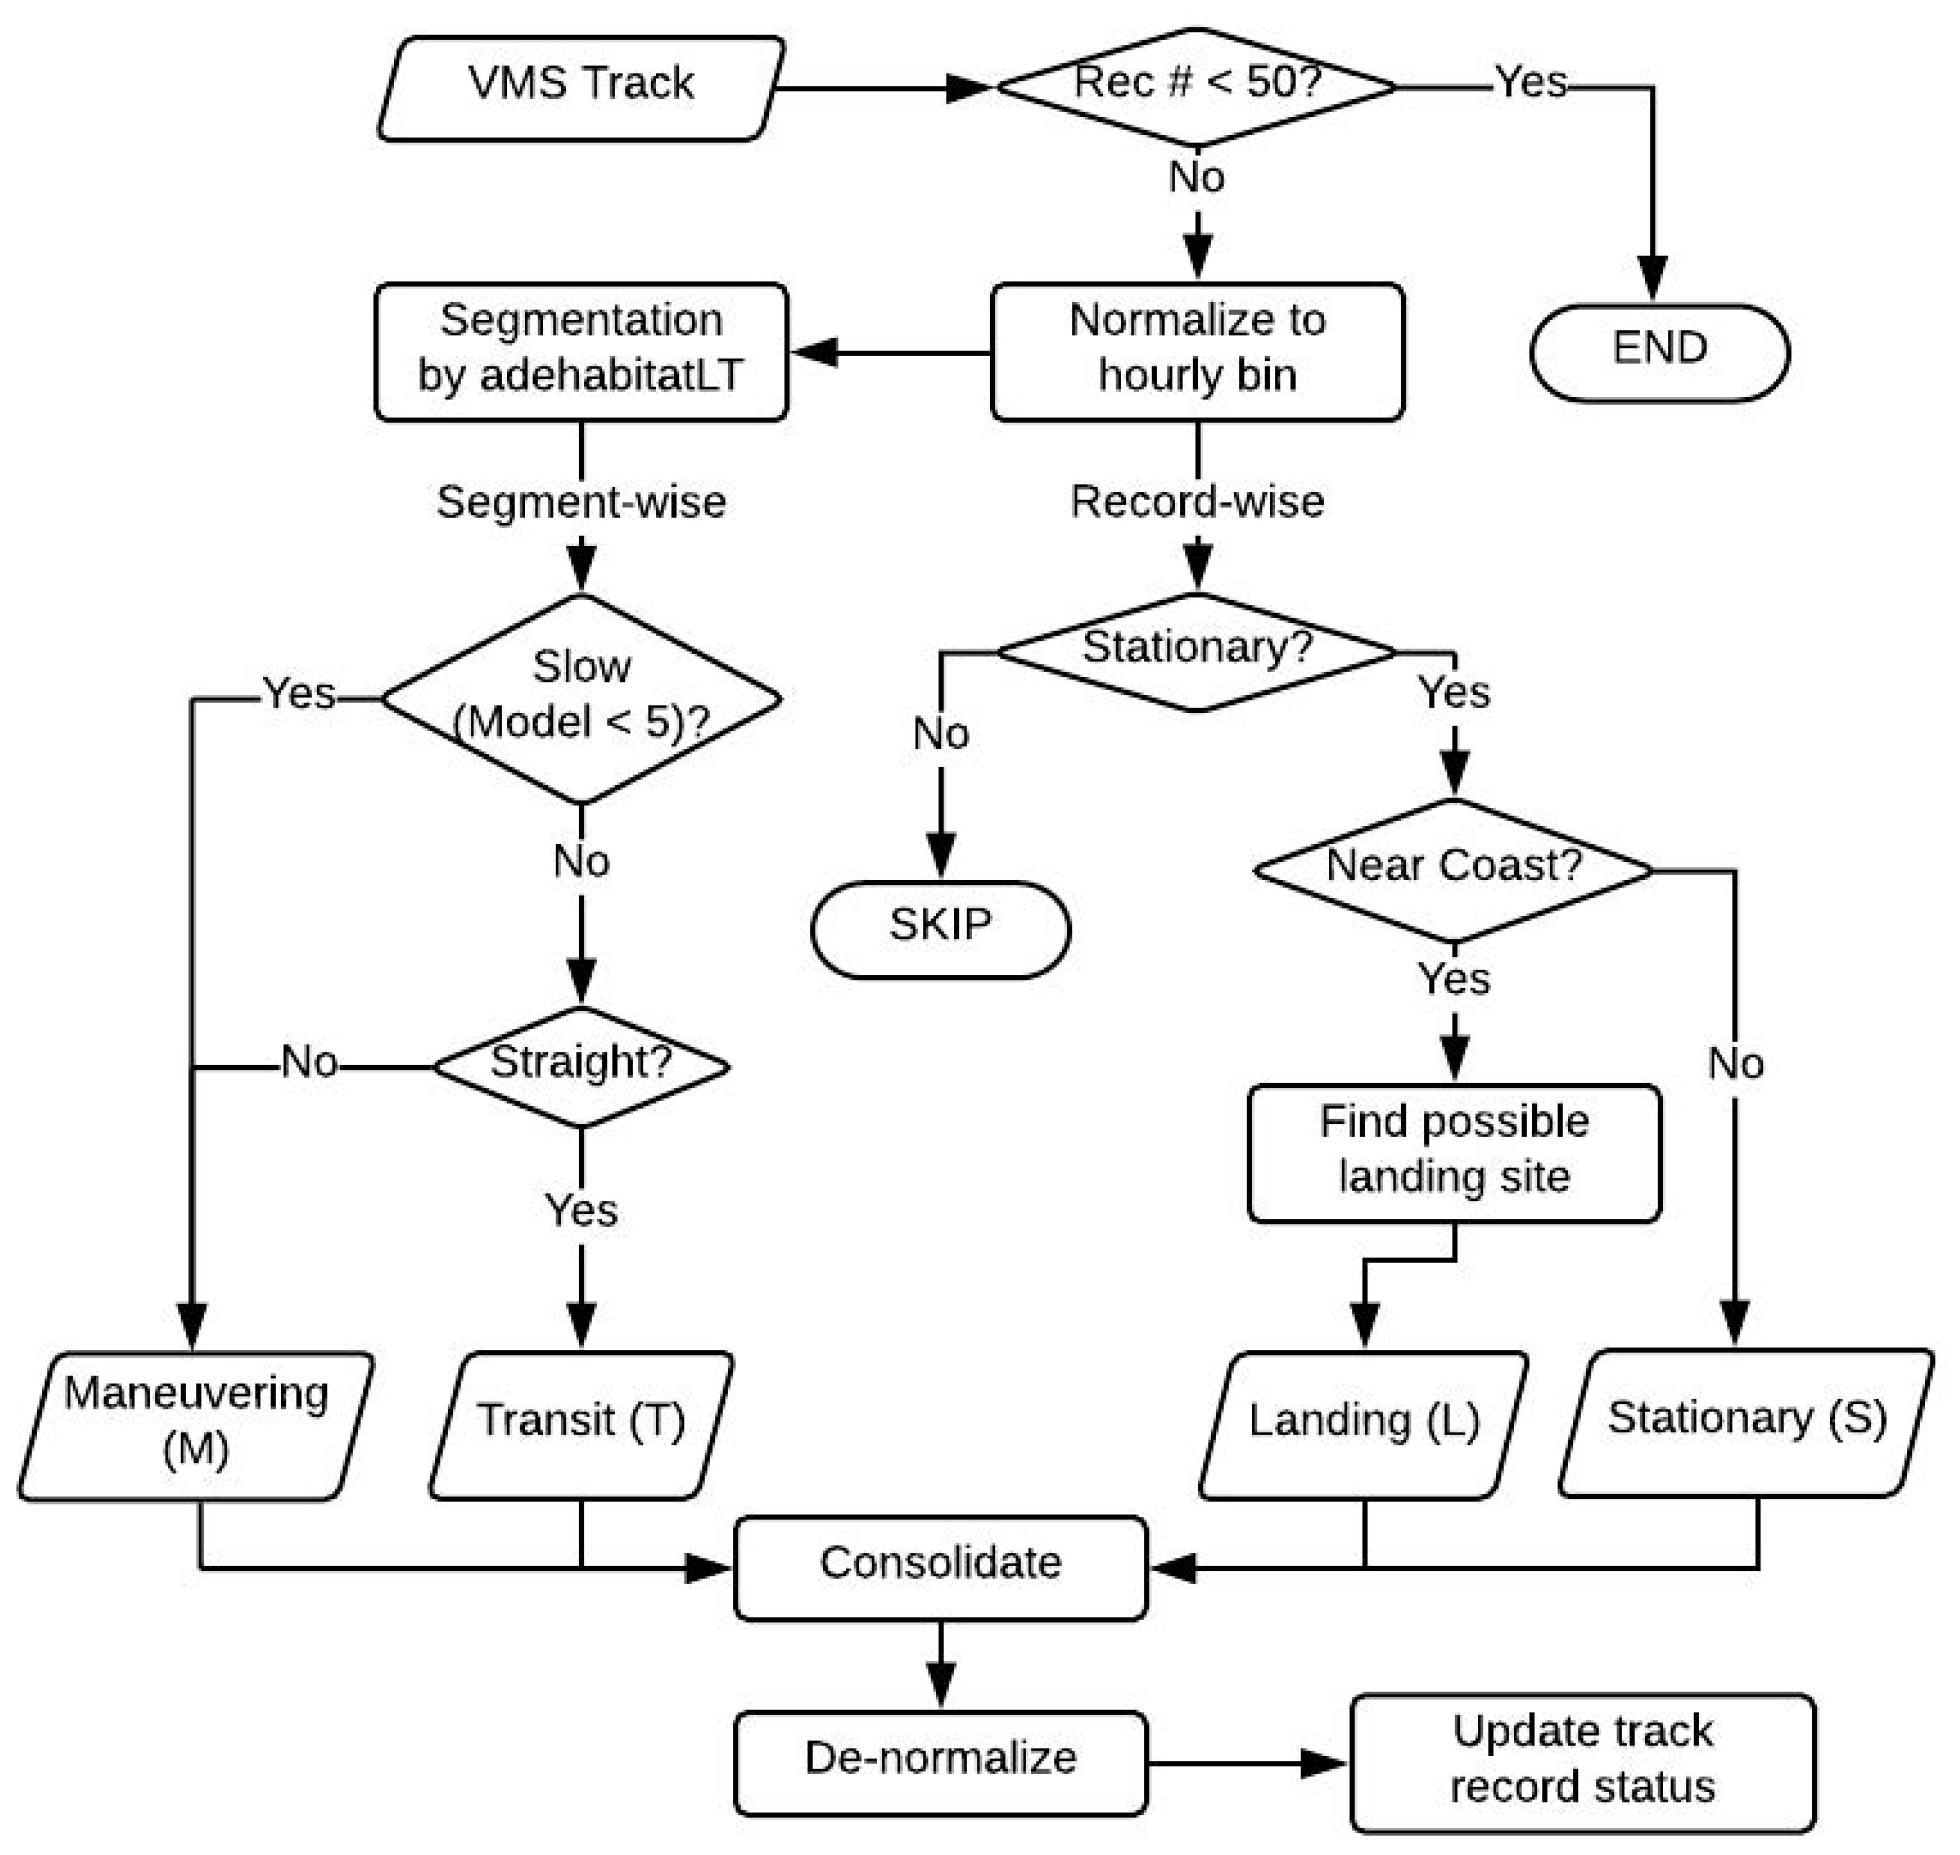
2.3. VMS Record Status Classification
2.4. VBD Cross Matching
3. Results
3.1. Status Classification Result
3.2. Cross-Matching Result
3.3. Match Rate
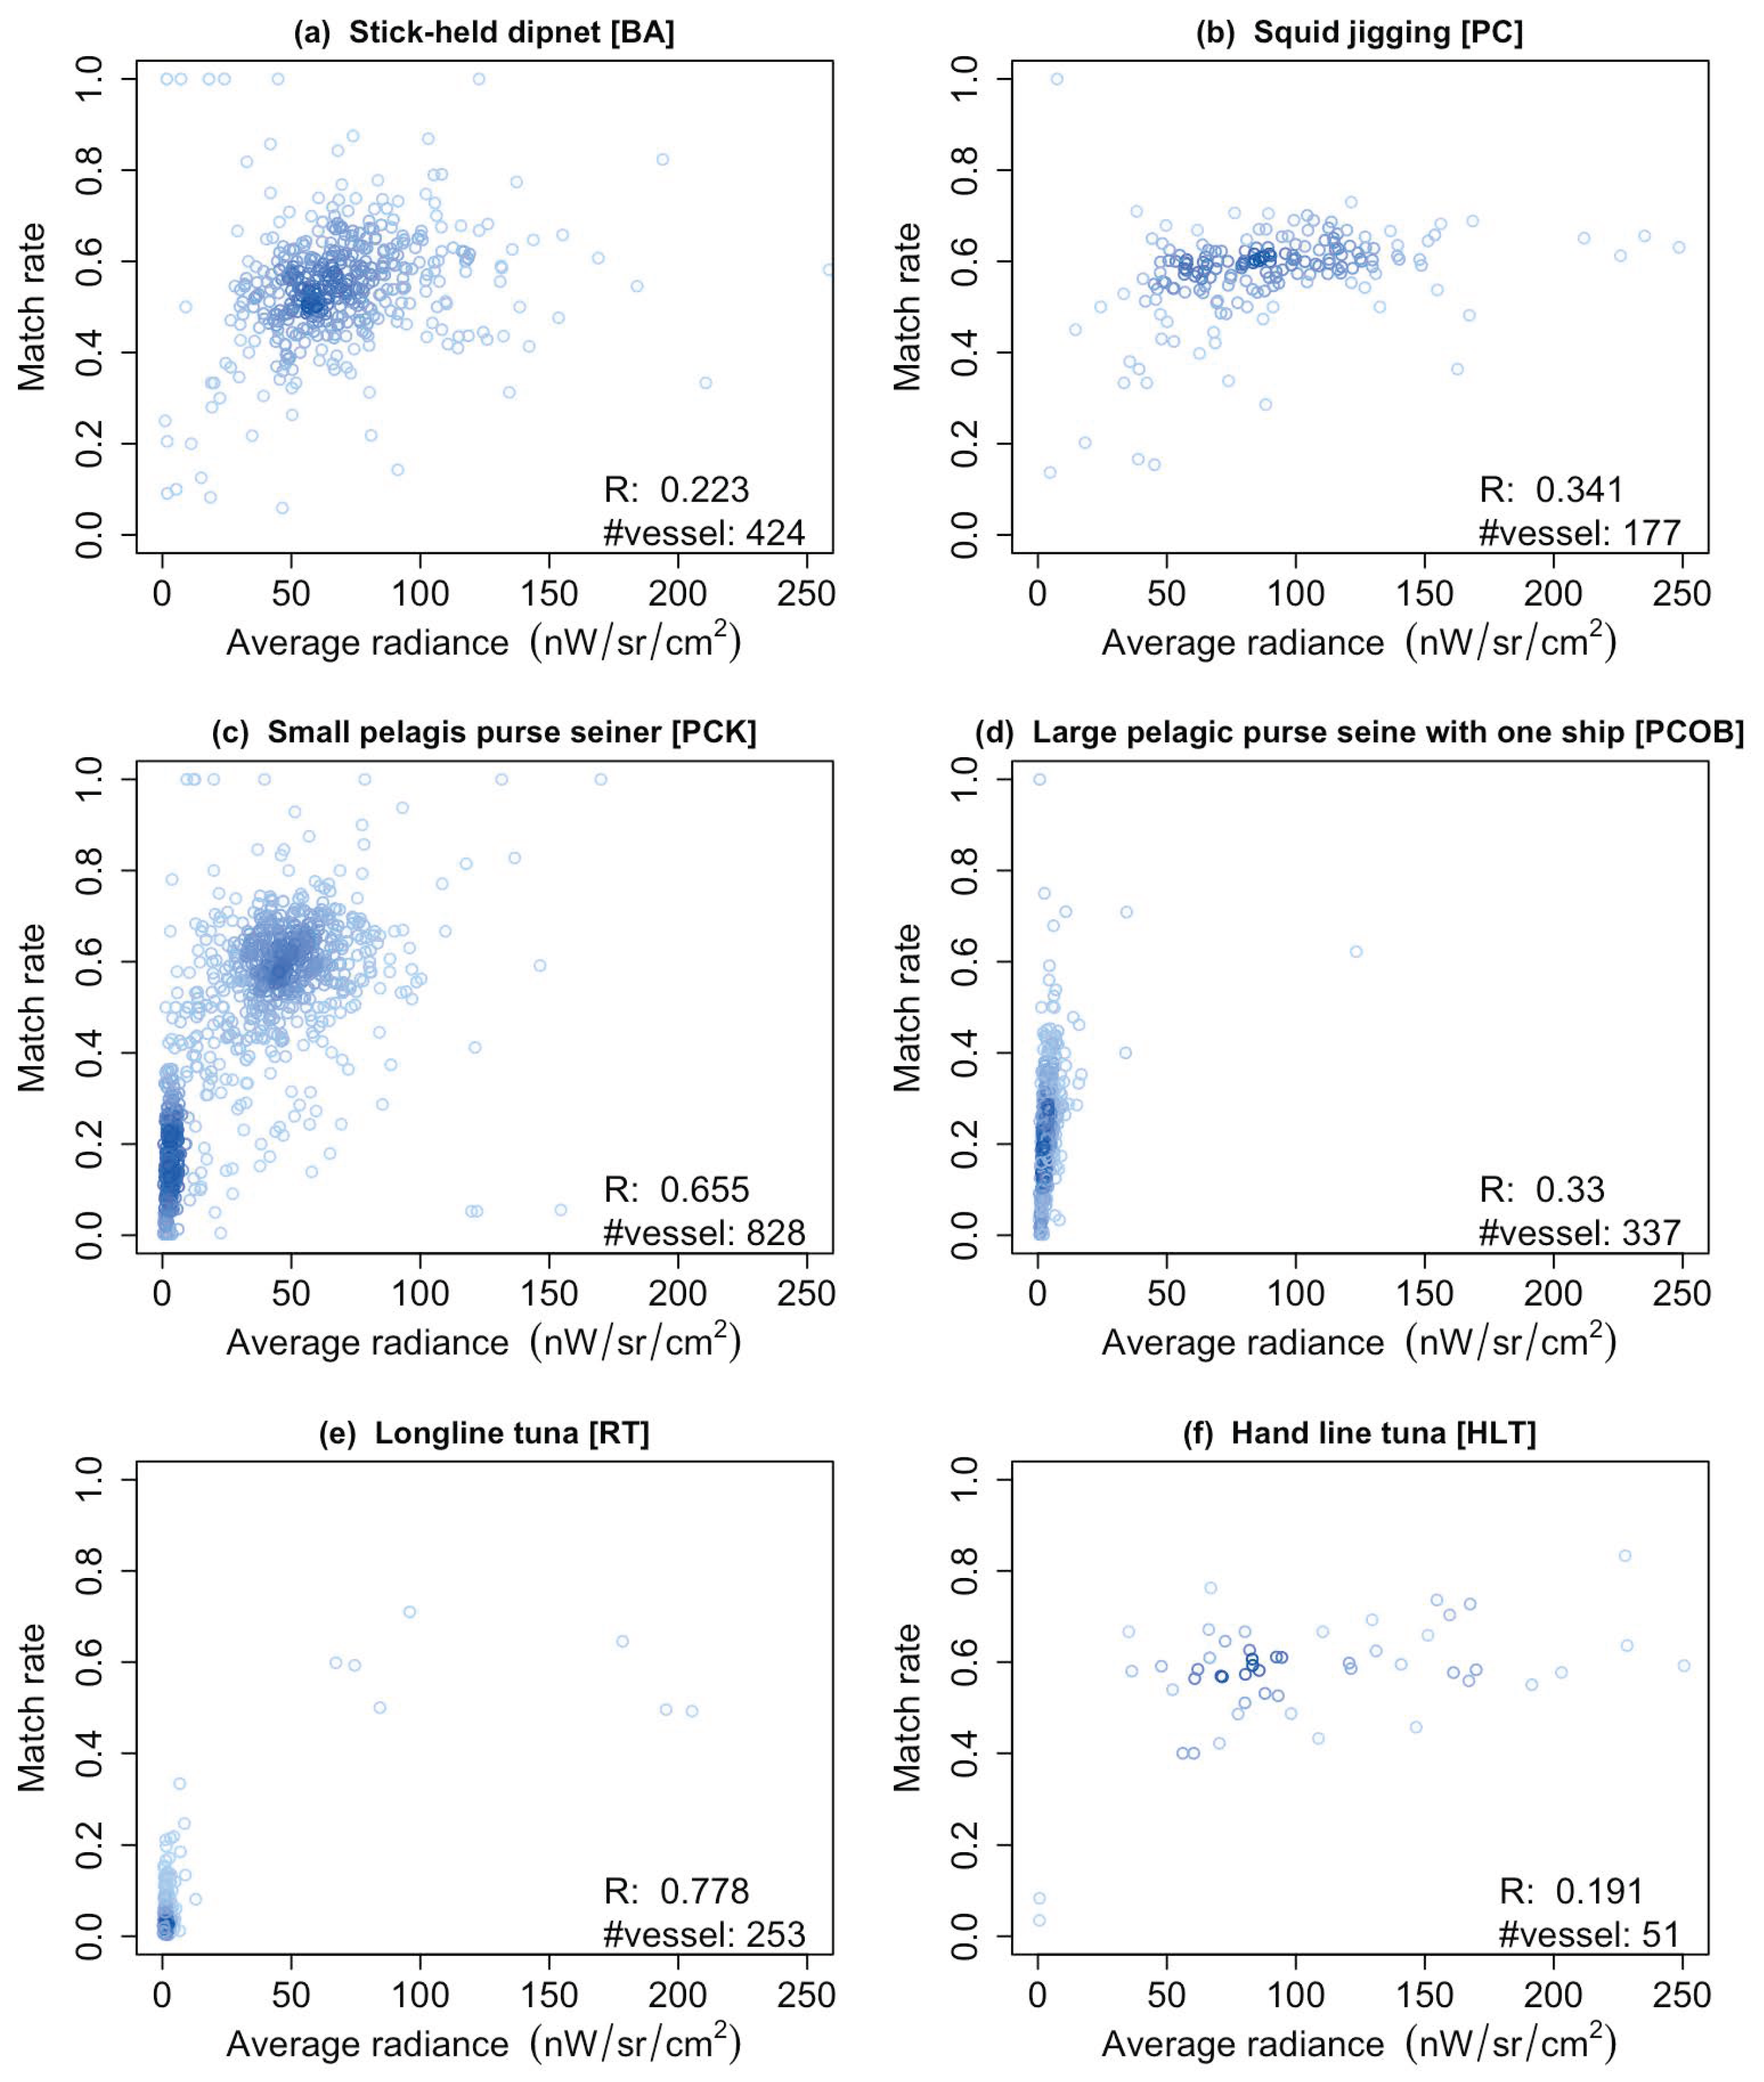
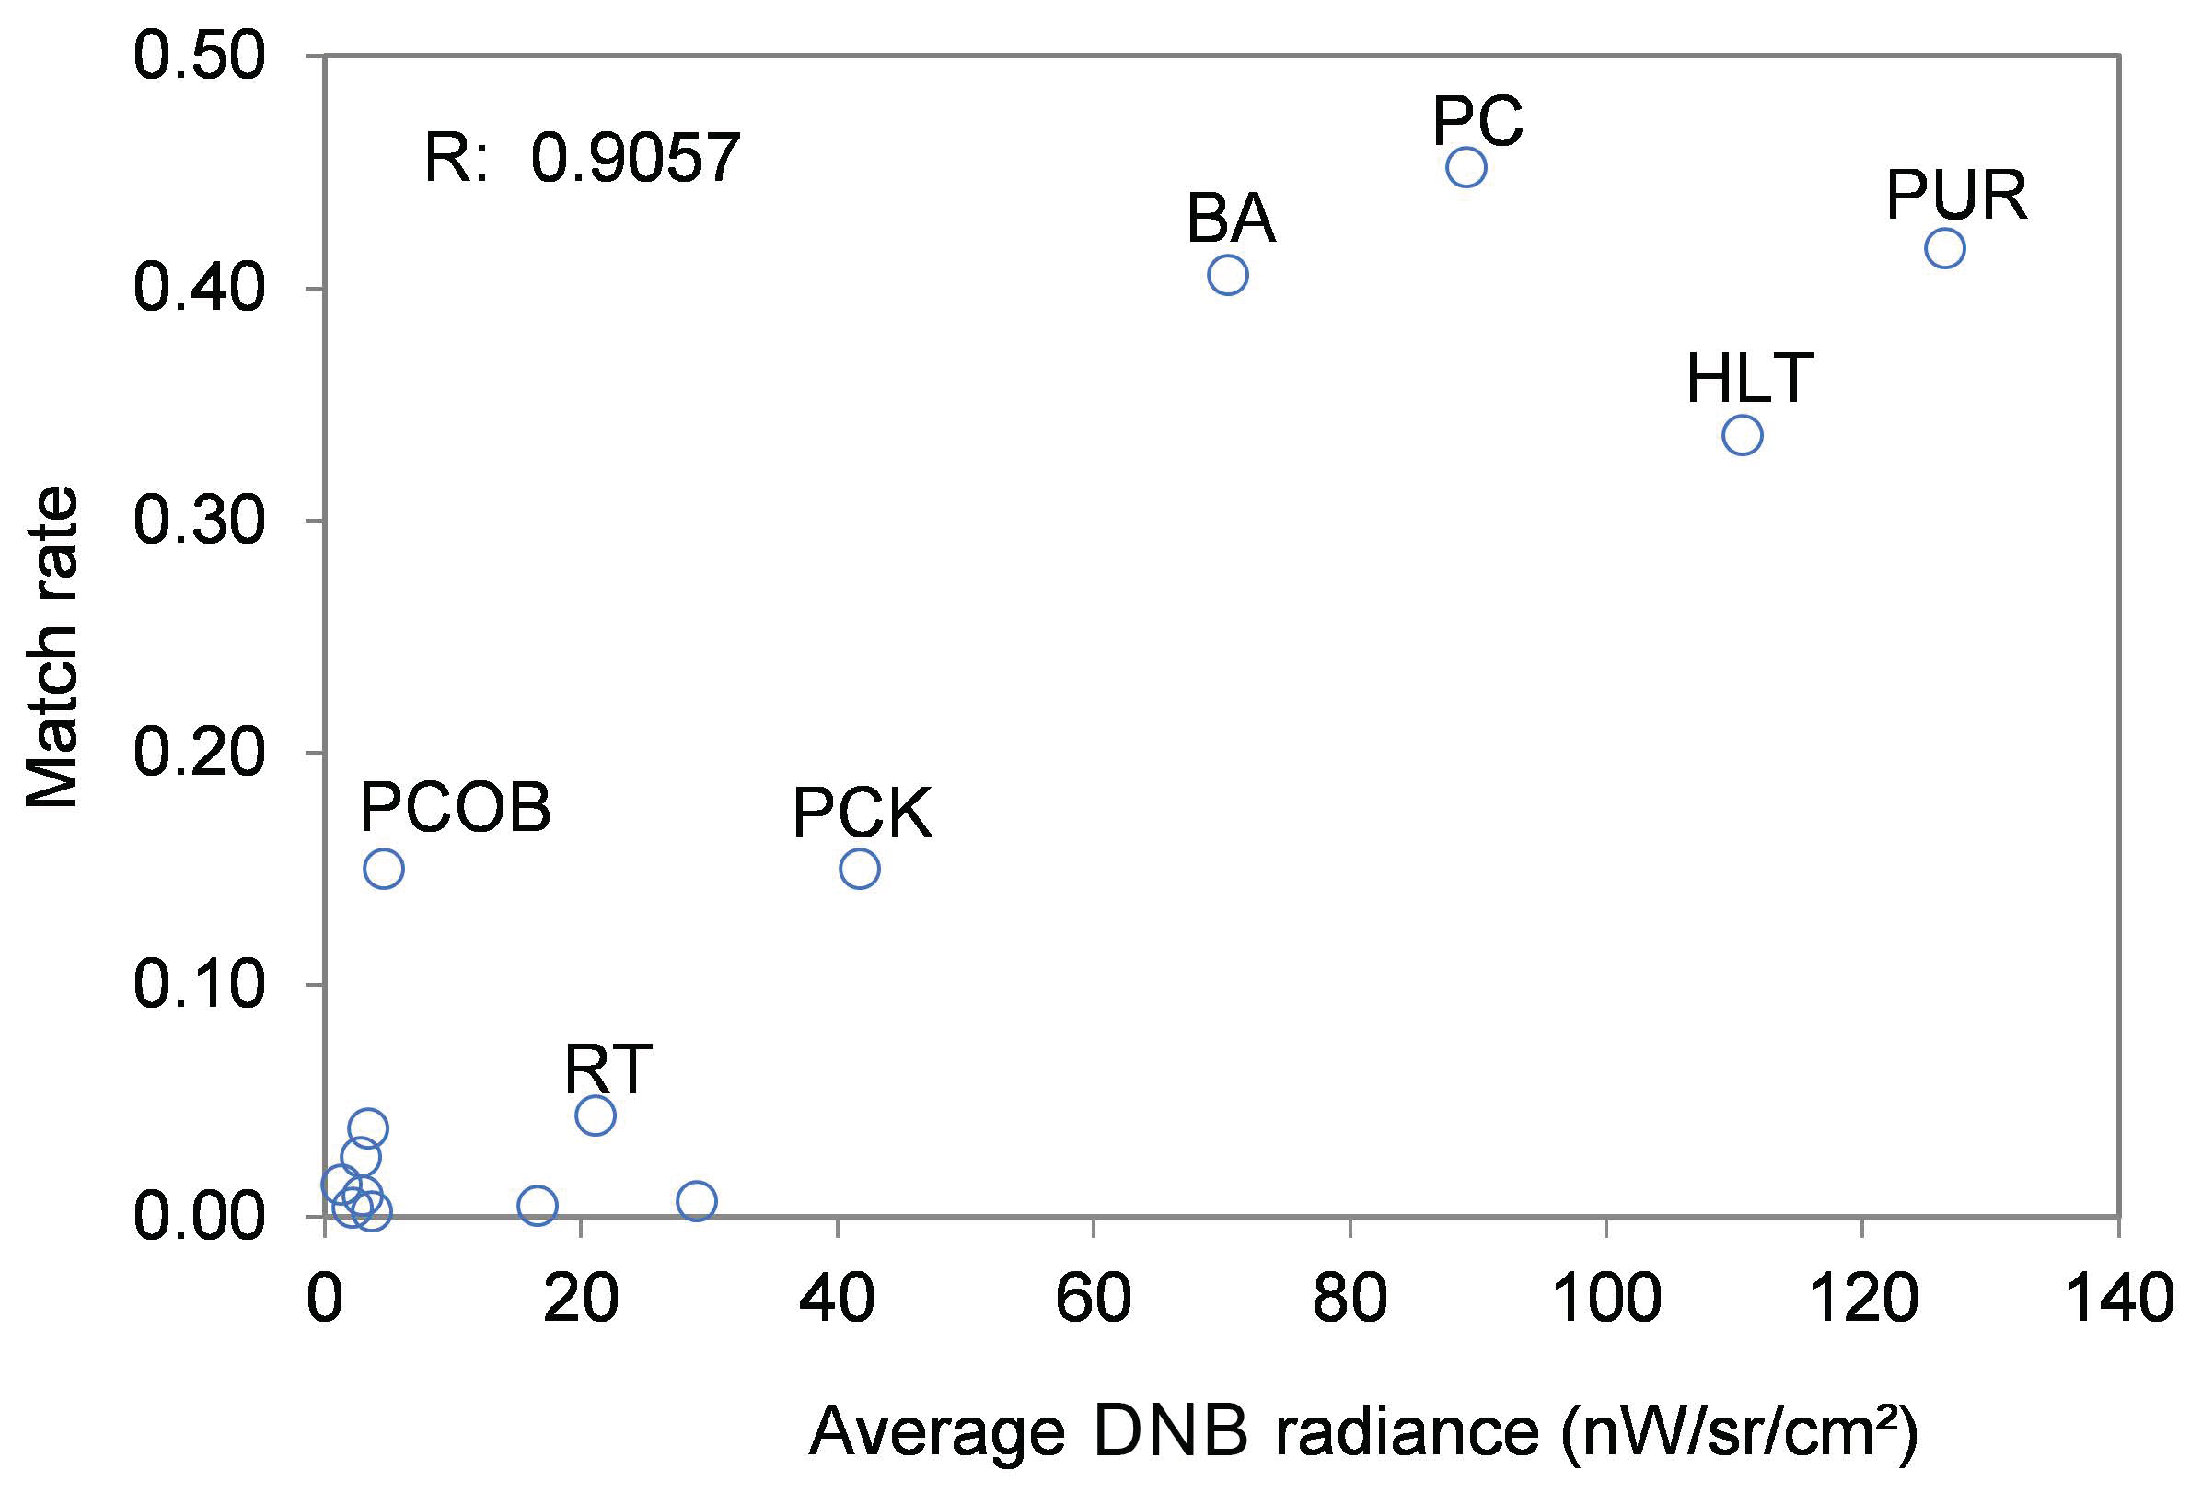
3.4. Average Radiance and Match Rate
3.5. VMS and VBD Record Uniqueness
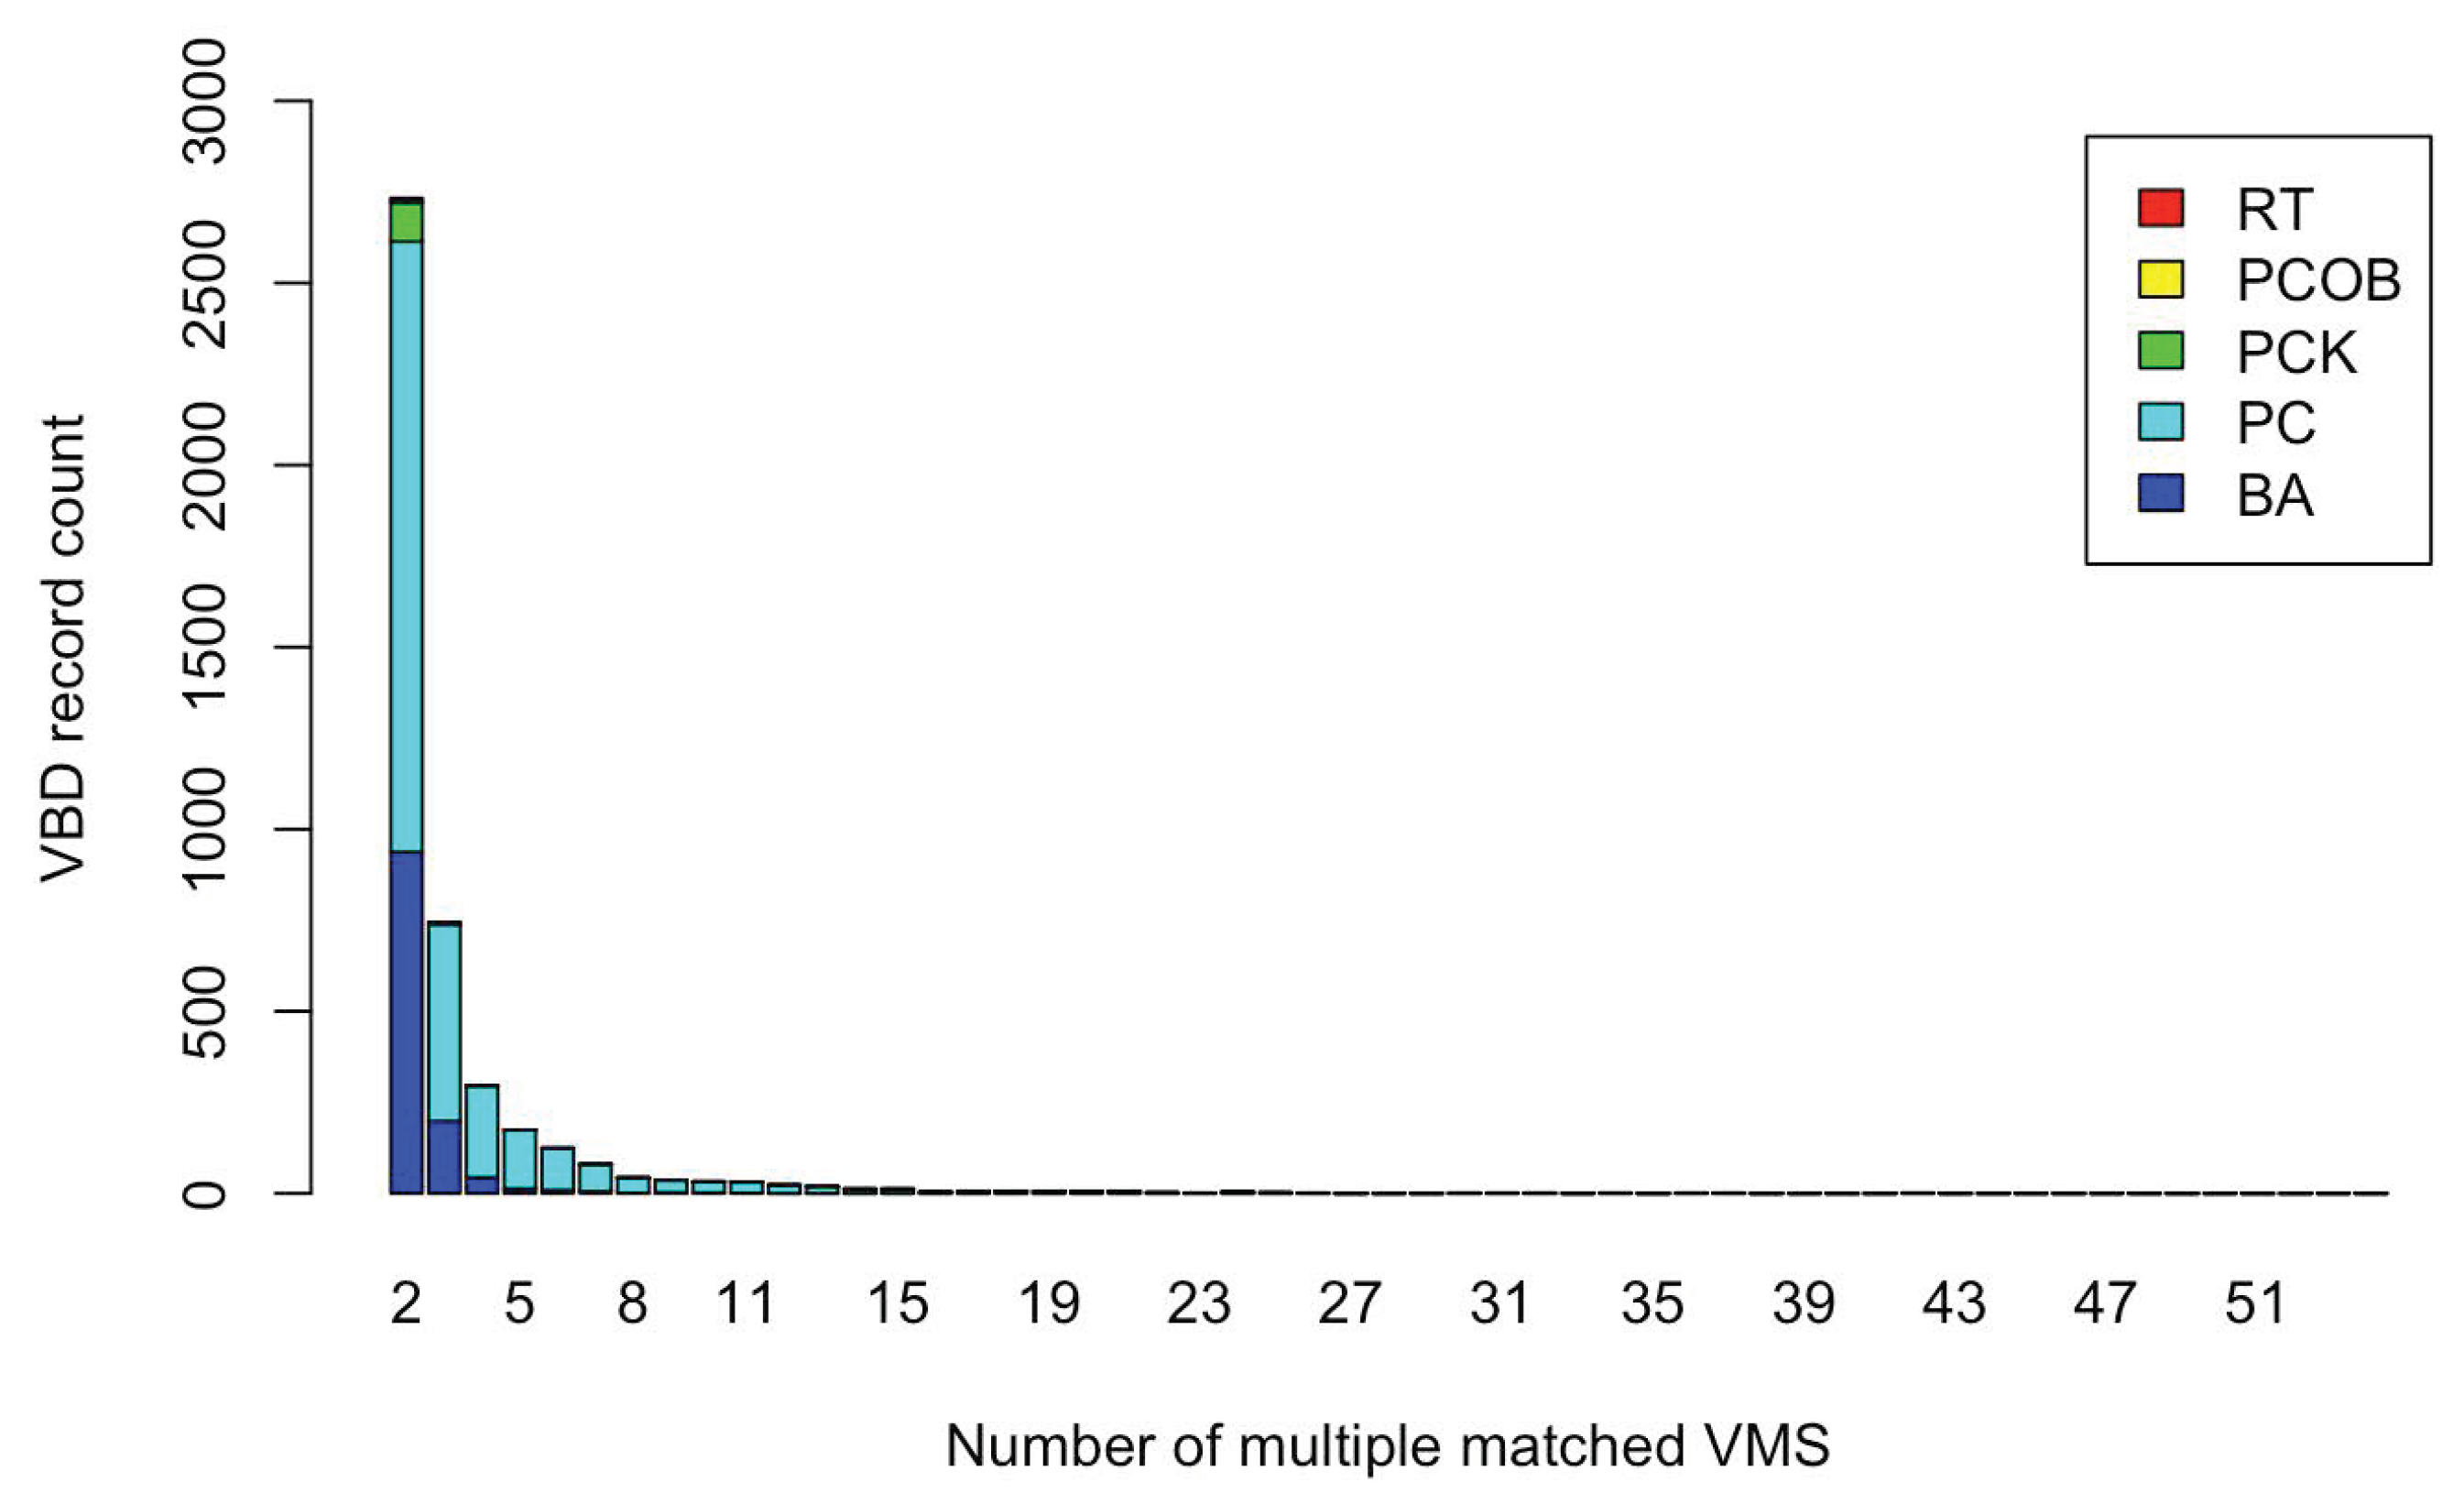
3.6. Multiple Matches
3.7. Matched QF_Detect
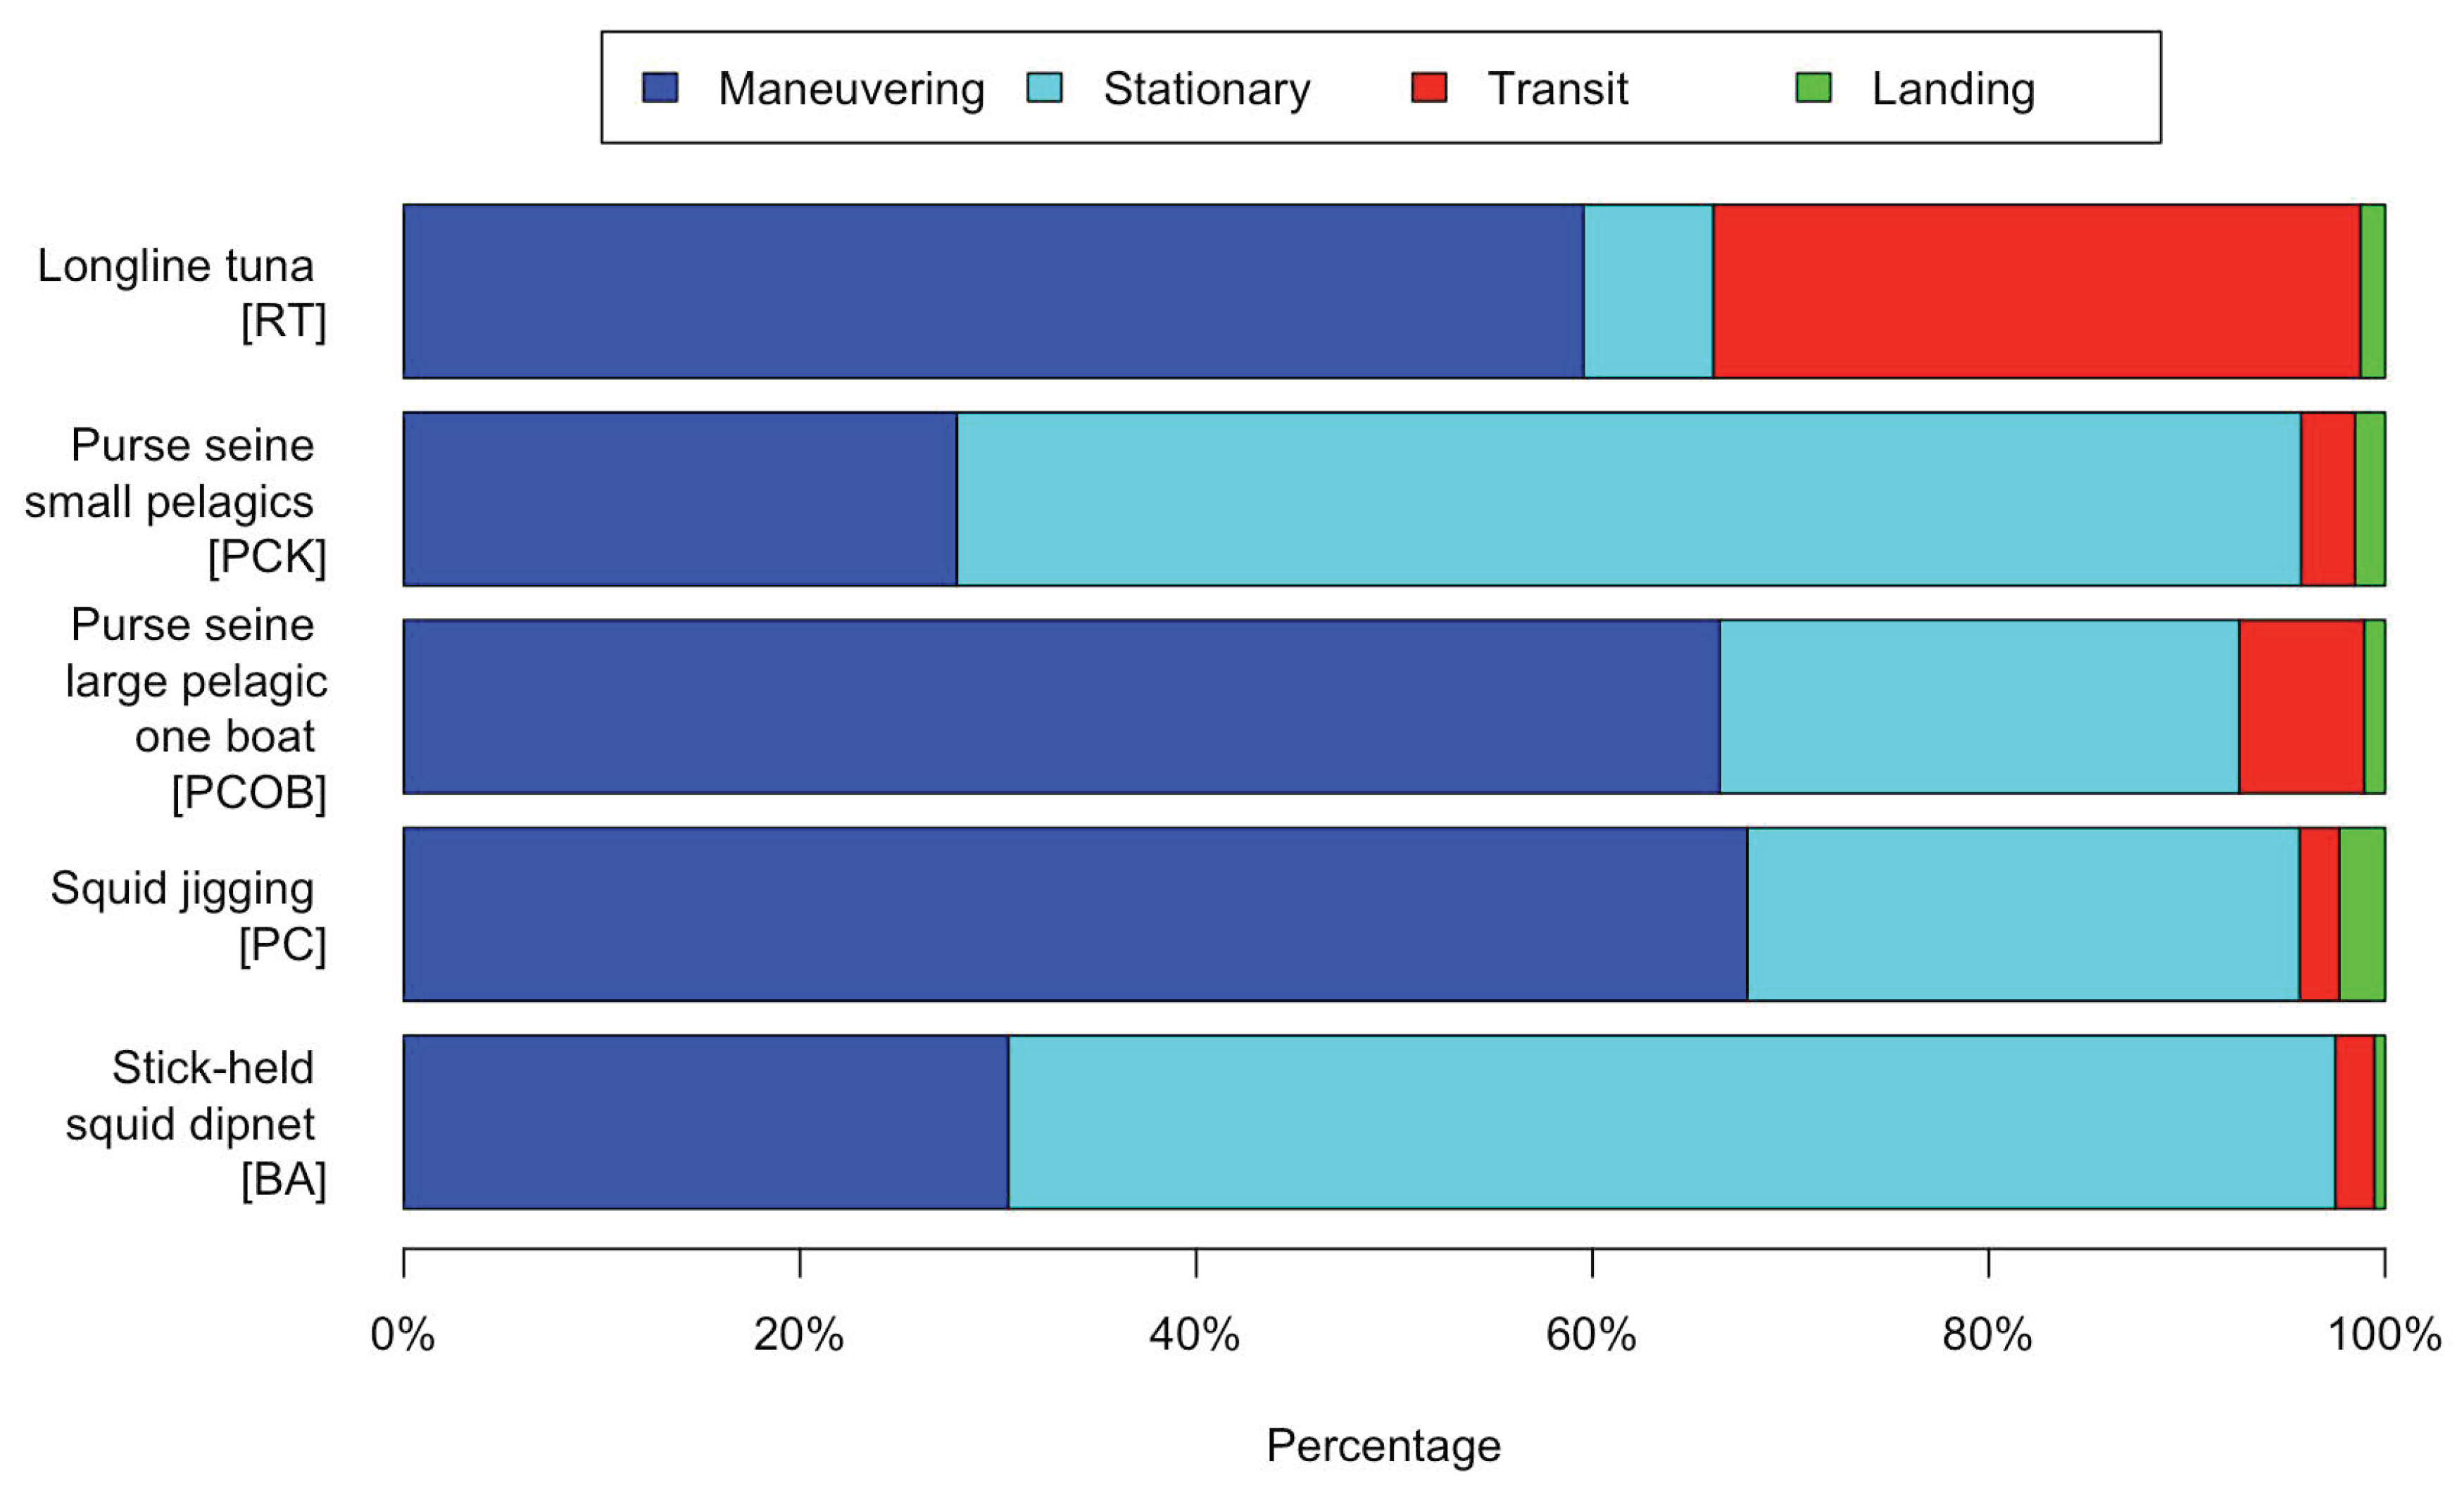
3.8. Matched VMS Status
4. Discussion
5. Conclusions
Author Contributions
Acknowledgments
Conflicts of Interest
Abbreviations
| AIS | Automatic identification system |
| DMSP-OLS | Defense Meteorological Satellite Program-Operational Linescan System |
| DNB | Day night band |
| FAD | Fishg aggregating device |
| GFW | Global Fishing Watch |
| GT | Gross tonnage |
| EEZ | Exclusive Economic Zone |
| EOG | Earth Observation Group |
| IMO | International Maritime Organization |
| IUU | Illegal, Unreported and Unregulated |
| MMAF | Ministry of Maritime Affairs and Fisheries |
| MSY | Maximum sustainable yield |
| NASA | National Aeronautics and Space Administration |
| NOAA | National Oceanic and Atmospheric Administration |
| SAR | Synthetic aperture radar |
| Suomi NPP | Suomi National Polor-orbiting Partnership |
| TLE | Two line element |
| UTM | Universal transverse mercator |
| VBD | VIIRS boat detection |
| VIIRS | Visual infrared imaging radiometer suite |
| VMS | Vessel monitoring system |
| WPP | Wilayah Pengelolaan Perikanan (Fishery Management Area) |
References
- Suhendar, M. Comparison of Vessel Monitoring System (VMS) between Iceland and Indonesia [Final Project]. Available online: http://www.unuftp.is/static/fellows/document/suhendar12prf.pdf (accessed on 15 August 2018).
- Enforcement | NOAA Fisheries. Available online: https://www.fisheries.noaa.gov/topic/enforcement#vessel-monitoring (accessed on 21 August 2018).
- Automatic Identification System (AIS). Available online: http://www.imo.org/en/OurWork/safety/navigation/pages/ais.aspx (accessed on 10 August 2018).
- Tello, M.; Lopez-Martinez, C.; Mallorqui, J.J. A novel algorithm for ship detection in SAR imagery based on the wavelet transform. IEEE Geosci. Remote Sens. Lett. 2005, 2, 201–205. [Google Scholar] [CrossRef]
- Greidanus, H.; Clayton, P.; Indregard, M.; Staples, G.; Suzuki, N.; Vachoir, P.; Wackerman, C.; Tennvassas, T.; Mallorqui, J.; Kourti, N.; et al. Benchmarking operational SAR ship detection. In Proceedings of the IEEE International Geoscience and Remote Sensing Symposium, Anchorage, AK, USA, 20–24 September 2004. [Google Scholar]
- Wu, G.; de Leeuw, J.; Skidmore, A.K.; Liu, Y.; Prins, H.H.T. Performance of LandsatTM in ship detection in turbid waters. Int. J. Appl. Earth Obs. Geoinf. 2009, 11, 54–61. [Google Scholar] [CrossRef]
- Máttyus, G. Near real-time automatic marine vessel detection on optical satellite images. In Proceedings of the International Archives of the Photogrammetry, Remote Sensing and Spatial Information Sciences, ISPRS Hannover Workshop, Hannover, Germany, 21–24 May 2013. [Google Scholar]
- Corbane, C.; Najman, L.; Pecoul, E.; Demagistri, L.; Petit, M. A complete processing chain for ship detection using optical satellite imagery. Int. J. Remote Sens. 2010, 31, 5837–5854. [Google Scholar] [CrossRef]
- Zhu, C.; Zhou, H.; Wang, R.; Guo, J. A novel hierarchical method of ship detection from spaceborne optical image based on shape and texture features. IEEE Trans. Geosci. Remote Sens. 2010, 48, 3446–3456. [Google Scholar] [CrossRef]
- Croft, T.A. Night-time images of the earth from space. Sci. Am. 1978, 239, 68–79. [Google Scholar] [CrossRef]
- Elvidge, C.D.; Baugh, K.; Zhizhin, M.; Hsu, F.-C. Why VIIRS data are superior to DMSP for mapping nighttime lights. Proc. Asia-Pac. Adv. Netw. 2012, 35, 62–69. [Google Scholar] [CrossRef]
- Oozeki, Y.; Inagake, D.; Saito, T.; Okazaki, M.; Fusejima, I.; Hotai, M.; Watanabe, T.; Sugisaki, H.; Miyahara, M. Reliable estimation of IUU fishing catch amounts in the northwestern Pacific adjacent to the Japanese EEZ: Potential for usage of satellite remote sensing images. Mar. Policy 2018, 88, 64–74. [Google Scholar] [CrossRef]
- Guo, G.; Fan, W.; Xue, J.; Zhang, S.; Zhang, H.; Tang, F.; Cheng, T. Identification for operating pelagic light-fishing vessels based on NPP/VIIRS low light imaging data. Trans. Chin. Soc. Agric. Eng. 2017, 33, 245–251. [Google Scholar]
- Cozzolino, E.; Lasta, C.A. Use of VIIRS DNB satellite images to detect jigger ships involved in the Illex argentinus fishery. Remote Sens. Appl. Soc. Environ. 2016, 4, 167–178. [Google Scholar] [CrossRef]
- Liu, Y.; Saitoh, S.I.; Hirawake, T. Detection of squid and pacific saury fishing vessels around Japan using VIIRS Day/Night Band image. Proc. Asia-Pac. Adv. Netw. 2015, 39, 28–39. [Google Scholar] [CrossRef]
- Elvidge, C.; Zhizhin, M.; Baugh, K.; Hsu, F.-C. Automatic Boat Identification System for VIIRS Low Light Imaging Data. Remote Sens. 2015, 7, 3020–3036. [Google Scholar] [CrossRef]
- Joint Polar Satellite System. Available online: http://www.jpss.noaa.gov/launch.html (accessed on 21 August 2018).
- EOG VIIRS Boat Detection. Available online: https://eogdata.mines.edu/vbd/ (accessed on 4 February 2019).
- Guerriero, M.; Wilett, P.; Coraluppi, S.; Carthel, C. Radar/AIS data fusion and SAR tasking for Maritime Surveillance. In Proceedings of the International Conference on Information Fusion, Cologne, Germany, 30 June–3 July 2008. [Google Scholar]
- Grasso, R.; Mirra, S.; Baldacci, A.; Horstmann, J.; Coffin, M.; Jarvis, M. Performance Assessment of a Mathematical Morphology Ship Detection Algorithm for SAR Images through Comparison with AIS Data. In Proceedings of the International Conference on Intelligent Systems Design and Applications, Pisa, Italy, 30 November–2 December 2009. [Google Scholar]
- Margarit, G.; Tabasco, A. Ship Classification in Single-Pol SAR Images Based on Fuzzy Logic. IEEE Trans. Geosci. Remote Sens. 2011, 49, 3129–3138. [Google Scholar] [CrossRef]
- Chaturvedi, S.K.; Yang, C.-S.; Ouchi, K.; Shanmugam, P. Ship Recognition by Integration of SAR and AIS. J. Navig. 2012, 65, 323–337. [Google Scholar] [CrossRef]
- Lemoine, G.; Ghesworth, J.; Schwartz-Juste, G.; Kourti, N.; Shepherd, I. Near real time vessel detection using spaceborne SAR imagery in support of fisheries monitoring and control operations. In Proceedings of the IEEE International Geoscience and Remote Sensing Symposium, Anchorage, AK, USA, 20–24 Septemer 2004. [Google Scholar]
- KKP WPP MapServer. Available online: http://www.ppk-kp3k.kkp.go.id/ArcGIS/rest/services/kkp/Kawasan/MapServer (accessed on 26 March 2019).
- Elvidge, C.; Zhizhin, M.; Baugh, K.; Hsu, F.C.; Ghosh, T. Methods for global survey of natural gas flaring from visible infrared imaging radiometer suite data. Energies 2016, 9, 14. [Google Scholar] [CrossRef]
- Vallado, D.A.; Crawford, P.; Hujsak, R.; Kelso, T.S. Revisiting Spacetrack Report #3. In Proceedings of the AIAA/AAS Astrodynamics Specialist Conference, Keystone, CO, USA, 21–24 August 2006. [Google Scholar]
- Kelso, T.S. Frequently Asked Questions: Two-Line Element Set Format. Satellite Times 1997, 4, 68–69. [Google Scholar]
- CelesTrak. Available online: http://celestrak.com/ (accessed on 5 April 2015).
- McCluskey, S.M.; Lewison, R.L. Quantifying fishing effort: A synthesis of current methods and their applications. Fish Fish. 2008, 9, 188–200. [Google Scholar] [CrossRef]
- De Souza, E.N.; Boerder, K.; Matwin, S.; Worm, B. Improving Fishing Pattern Detection from Satellite AIS Using Data Mining and Machine Learning. PLoS ONE 2016, 11, e0158248. [Google Scholar]
- Calenge, C. Analysis of Animal Movements in R: The AdehabitatLT Package. Available online: https://cran.r-project.org/web/packages/adehabitatLT/vignettes/adehabitatLT.pdf (accessed on 31 August 2018).
- NASA Ocean Color. Available online: https://oceancolor.gsfc.nasa.gov/docs/distfromcoast/ (accessed on 17 June 2017).
- Pusat Informasi Pelabuhan Perikanan. Available online: http://pipp.djpt.kkp.go.id (accessed on 15 August 2017).
- OpenStreetMap. Available online: https://www.openstreetmap.org/ (accessed on 15 May 2018).
- Baker, N.; Kilcoyne, H. Joint Polar Satellite System (JPSS) VIIRS Radiometric Calibration Algorithm Theoritical Basis Document (ATBD); Rev. C; Goddard Space Flight Center: Greenbelt, MD, USA, 2013.
- Yasfiandayani, R.; Baskoro, M.; Monintja, D. Imapct of fish aggregating device on sustainable capture fisheries. In Proceedings of the 1st International Symposium on Aquatic Product Processing 2013, Bogor, Indonesia, 13–14 November 2013. [Google Scholar] [CrossRef]
- Natsir, M.; Atmaja, S.B. Fishing activity of individual purse seiners in Molucca Sea: Vessel Monitoring System (VMS) and observers. J. Penelitian Perikanan Indonesia 2013, 19, 17–24. [Google Scholar]
- Mulyadi, R.A.; Brown, A.; Rengi, P. Study Technology Hand Line In Ocean Fishing Port Bungus Province West Sumatra. J. Online Mahasiswa Fakultas Perikanan Ilmu Kelautan Univ. Riau 2015, 2, 1–13. [Google Scholar]
- Mulyadi, R.A.; Sondita, M.F.A.; Yusfiandayani, R. Suhu permukaan laut dan kedalaman tertangkapnya tuna oleh kapal pancing ulur yang dilengkapi lampu. J. Teknol. Perikanan Kelautan 2018, 8, 199–207. [Google Scholar] [CrossRef]
- Fish Magnet Boom Creates Headaches in Indonesia’S War on Overfishing. Available online: https://news.mongabay.com/2017/02/fish-magnet-boom-creates-headaches-in-indonesias-war-on-overfishing/ (accessed on 24 February 2019).
- Submersible Underwater Green Fishing Lights Longline Tuna Lamp For Deep Sea. Available online: http://underwaterledfishinglights.sell.everychina.com/p-106898950-submersible-underwater-green-%20fishing-lights-longline-tuna-lamp-for-deep-sea.html (accessed on 12 September 2018).
- Miller, N.A.; Roan, A.; Hochberg, T.; Amos, J.; Kroodsma, D.A. Identifying Global Patterns of Transshipment Behavior. Front. Mar. Sci. 2018, 5, 240. [Google Scholar]
- Boerder, K.; Miller, N.A.; Worm, B. Global hot sopts of transshipment of fish catch at sea. Sci. Adv. 2018, 4, 7159. [Google Scholar] [CrossRef]
- European Fisheries Control Agency. Core Curriculum for the Training of Fisheries Inspectors: 2b Transhipment Inspection; Europena Union: Luxembourg, 2017; ISBN 978-92-9209-944-9.
- Rudd, M.B.; Branch, T.A. Does unreported catch lead to overfishing? Fish Fish. 2017, 18, 313–323. [Google Scholar] [CrossRef]
- Yuniarta, S.; van Zwieten, P.A.; Groeneveld, R.A.; Wisudo, S.H.; van Ierland, E.C. Uncertainty in catch and effort data of small- and medium-scale tuna fisheries in Indonesia: Sources, operational causes and magnitude. Fish. Res. 2017, 193, 173–193. [Google Scholar] [CrossRef]


| Gear Type | Abbr. | # Vessels | Average GRT | Recorded Time | |
|---|---|---|---|---|---|
| Bahasa | English | (Std. dev.) | (Hours) 1 | ||
| Pukat cincin pelagis kecil | Small pelagic purse seiner | PCK | 1085 | 99.9 (50.0) | 3,357,444 |
| Bouke ami | Stick-held squid dipnet | BA | 502 | 71.2 (28.2) | 1,441,394 |
| Rawai tuna | Longline tuna | RT | 428 | 113.5 (84.7) | 1,806,814 |
| Pukat cincin pelagis besar | Large pelagic purse seine | PCOB | 417 | 129.9 (55.9) | 1,936,373 |
| degan satu kapal | with one ship | ||||
| Pengangkut | Carrier 3 | P | 386 | 300.8 (539.0) | 1,825,319 |
| Pukat ikan | Trawler | PI | 205 | 210.9 (128.3) | 6777 |
| Pancing cumi | Squid jigging | PC | 195 | 107.8 (41.3) | 1,377,622 |
| Jaring insang oseanik | Oceanic gill net | JIO | 172 | 142.6 (106.1) | 742,990 |
| Jaring liong bun | Shark gillnet | JLB | 139 | 48.7 (13.5) | 82,034 |
| Rawai dasar | Basic longline | RD | 132 | 77.9 (59.4) | 945,630 |
| Hand line tuna 2 | Hand line tuna | HLT | 69 | 98.46 (43.8) | 88,705 |
| Huhate | Pole and line | H | 67 | 63.9 (18.8) | 205,372 |
| Pukat udang | Shrimp trawl | PUD | 42 | 152.8 (34.1) | 0 |
| Pukat cincin grup pelagis | Small pelagic purse | PCGK | 12 | 83.8 (18.9) | 0 |
| kecil | seine group | ||||
| Pancing ulur | Hand line | PUR | 4 | 107.5 (34.1) | 0 |
| Name | Explanation | Unit |
|---|---|---|
| ID_Key | Unique key for each VBD record | Unitless |
| Lat_DNB | Latitude of the center of DNB pixel | Degrees |
| Lon_DNB | Longitude of the center of DNB pixel | Degrees |
| Date_Mscan | Timestamp in UTC at the middle of the scan line | Unitless |
| Rad_DNB | Radiance of the DNB pixel | nW/sr/cm2 |
| QF_Detect | Quality flag (type) of the VBD detection | Unitless |
| Gear Type | 1 | 2 | 3 | 4 | 5 |
|---|---|---|---|---|---|
| Hand line (PUR) | 108 | 259 | 41.7% | 82.8% | 5.8% |
| Stick-held dipnet (BA) | 40,999 | 101,111 | 40.5% | 80.8% | 10.4% |
| Squid jiggiing (PC) | 35,001 | 77,431 | 45.2% | 78.3% | 9.1% |
| Hand Line Tuna (HLT) | 3691 | 10,961 | 33.7% | 72.7% | 5.8% |
| Small pelagic purse seiner (PCK) | 59,638 | 242,727 | 24.6% | 58.9% | 7.7% |
| Large pelagic purse seine with one ship (PCOB) | 18,225 | 121,535 | 15.0% | 32.9% | 8.3% |
| Pole and line (H) | 114 | 12,998 | 0.9% | 10.9% | 0.5% |
| Longline tuna (RT) | 3159 | 72,817 | 4.3% | 10.2% | 4.3% |
| Trawler (PI) | 1069 | 28,203 | 3.8% | 8.3% | 5.6% |
| Oceanic gill net (JIO) | 1259 | 49,073 | 2.6% | 6.3% | 2.5% |
| Shrimp trawl (PUD) | 247 | 11,643 | 2.1% | 6.6% | 2.5% |
| Carrier (P) | 293 | 63,541 | 0.5% | 6.2% | 0.9% |
| Shark gillnet (JLB) | 82 | 12,630 | 0.7% | 1.2% | 0.3% |
| Small pelagic purse seine group (PCGK) | 4 | 1047 | 0.4% | 0.4% | 2.2% |
| Basic longline (RD) | 104 | 50,447 | 0.2% | 0.3% | 0.2% |
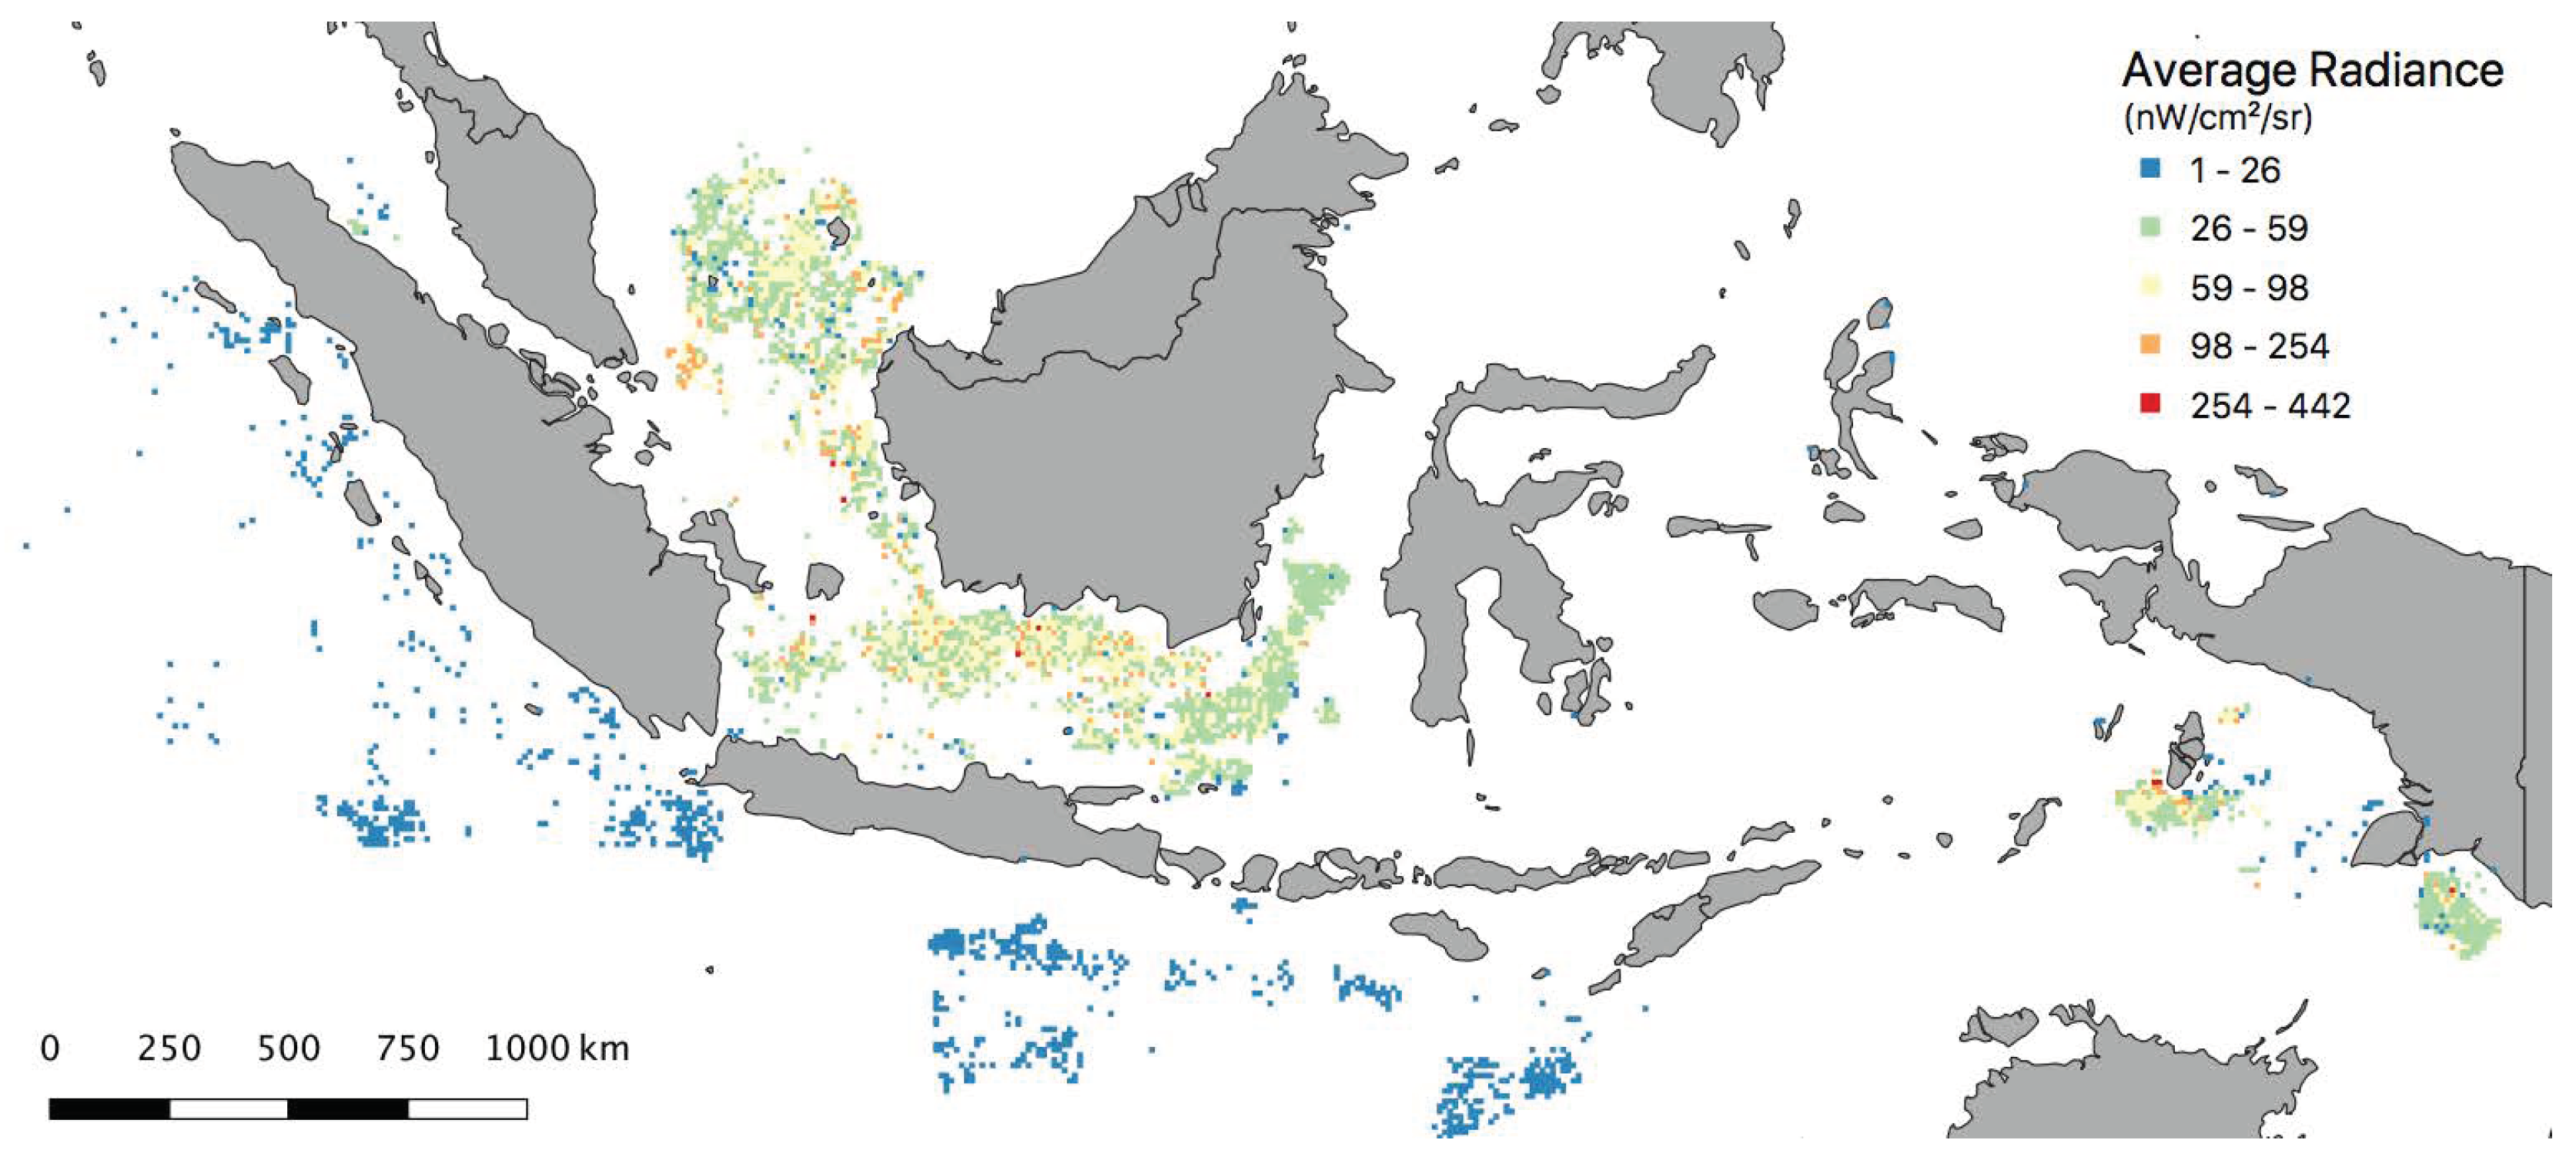
| Region | WPP # | VMS Counts | Raw Match Rate | |
|---|---|---|---|---|
| Match | Predicted | |||
| Natuna Sea | WPP 711 | 19,982 | 45,341 | 44.10% |
| Makassar Strait | WPP 712 WPP 713 | 31,827 | 71,456 | 44.50% |
| ine Maluku Sea | WPP 715 WPP 716 WPP 717 | 100 | 28,825 | 0.35% |
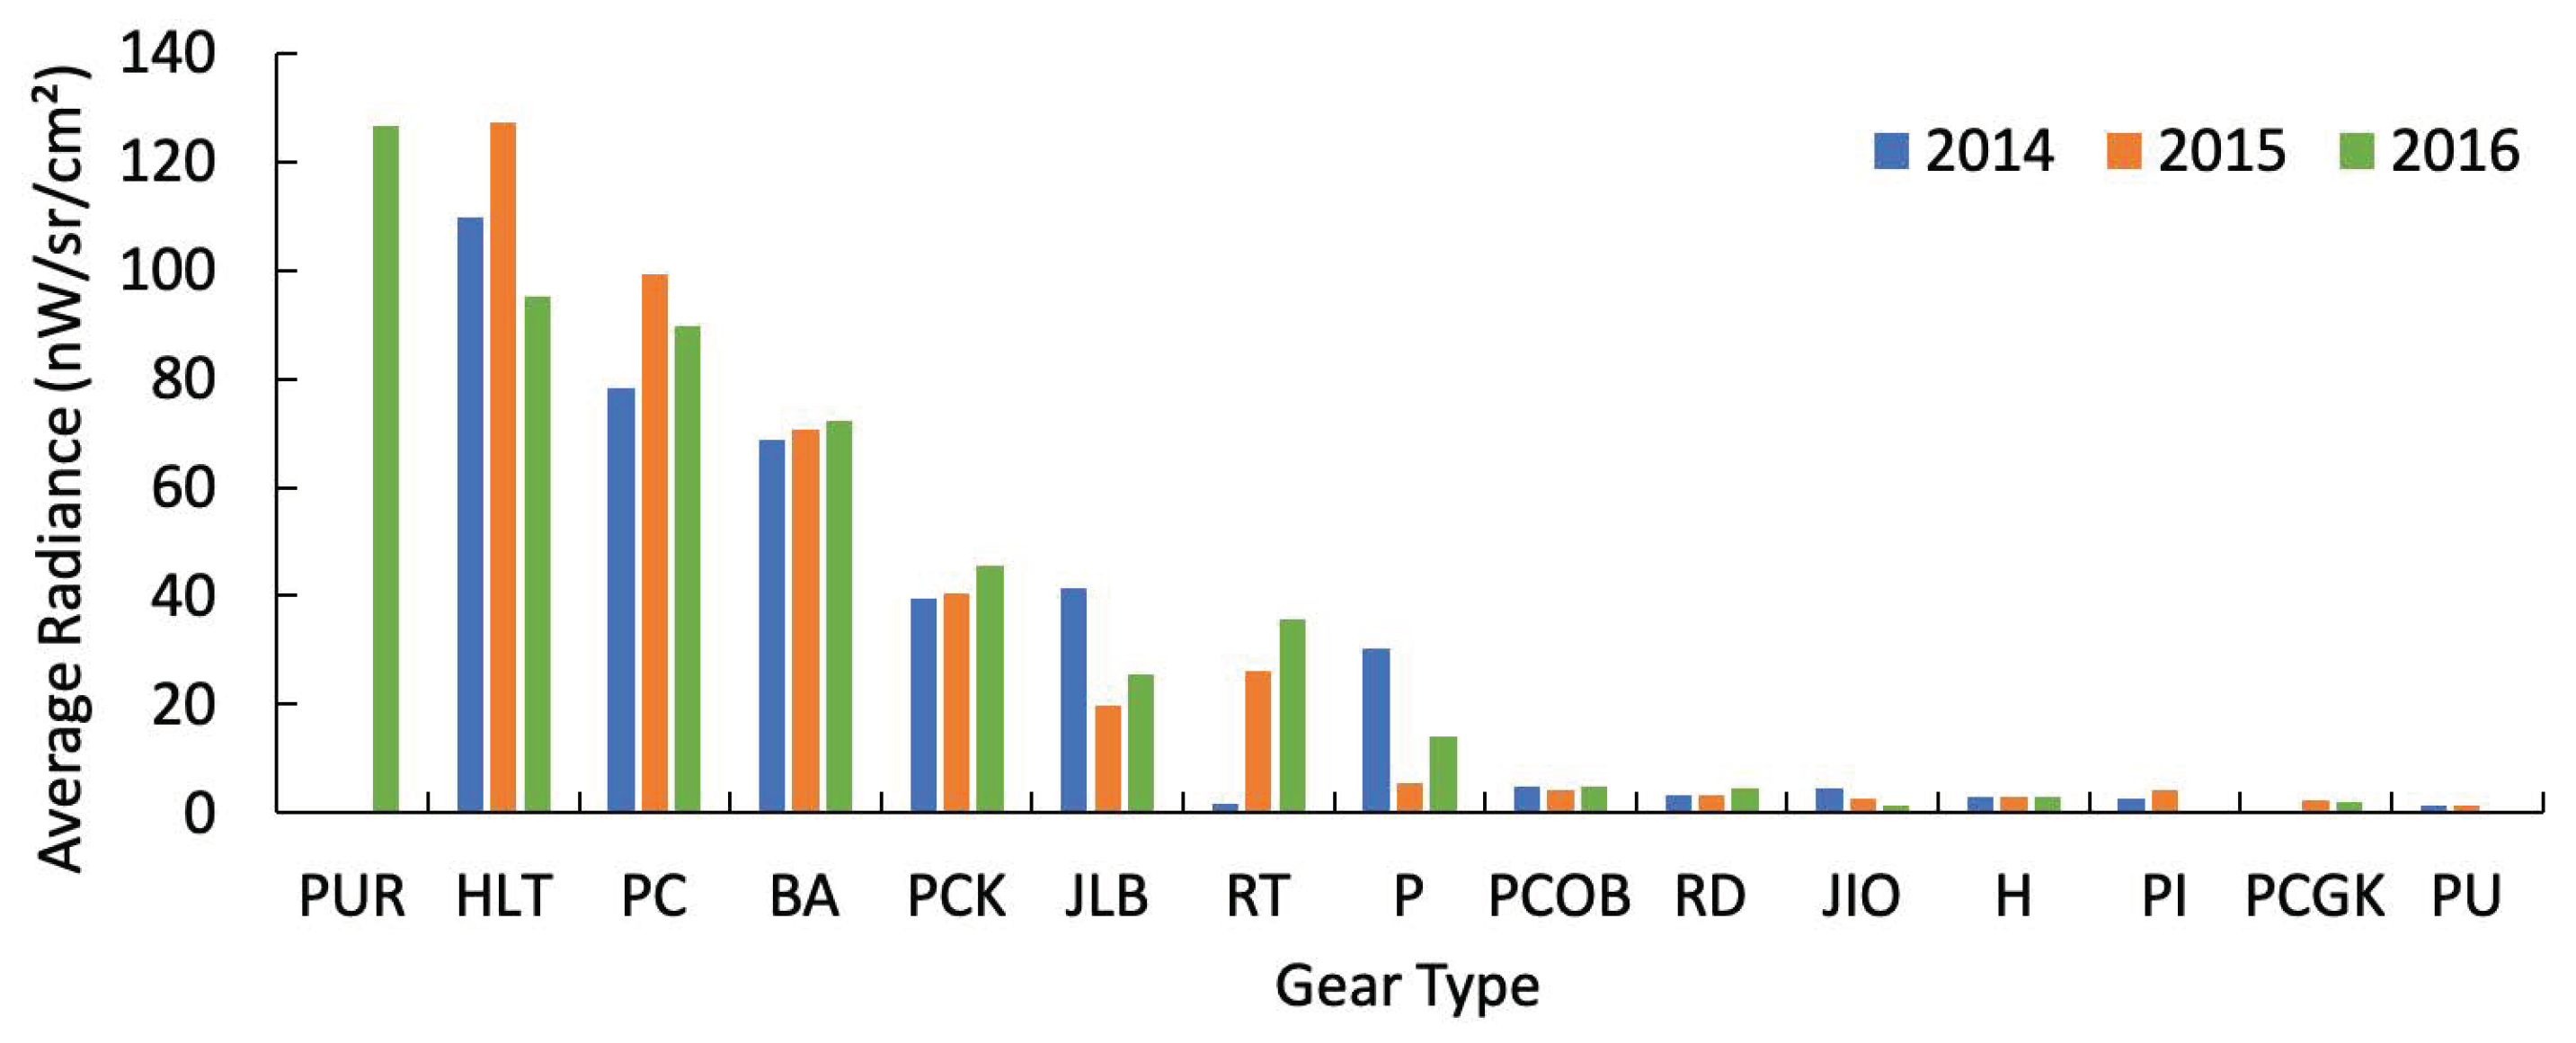
| Gear Type | Region | Average Radiance 1 | |||
|---|---|---|---|---|---|
| 2014 | 2015 | 2016 2 | All | ||
| Handline (PUR) | – | – | 126.50 | 126.50 | |
| Handline tuna (HLT) | 109.63 | 127.24 | 95.22 | 104.61 | |
| Squid jigging (PC) | 78.36 | 99.37 | 89.73 | 89.52 | |
| Stick-held squid dipnet (BA) | 68.87 | 70.58 | 72.13 | 70.78 | |
| Small pelagic purse seiner (PCK) | All | 39.47 | 40.48 | 45.45 | 42.23 |
| Natuna Sea | 48.46 | 46.16 | 52.85 | 48.87 | |
| Makassar Strait | 43.63 | 46.64 | 40.61 | 46.50 | |
| Maluku Sea | 4.48 | 3.09 | 3.48 | 4.24 | |
| Shark gillnet (JLB) | 41.55 | 19.93 | 25.60 | 26.44 | |
| Longline tuna (RT) | 1.74 | 26.08 | 35.61 | 24.01 | |
| Carrier (P) | 30.17 | 5.42 | 14.19 | 23.37 | |
| Large pelagic purse seine with one ship (PCOB) | 4.87 | 4.19 | 4.76 | 4.58 | |
| Basic longline (RD) | 3.24 | 3.30 | 4.48 | 3.43 | |
| Oceanic gillnet (JIO) | 4.51 | 2.61 | 1.34 | 3.27 | |
| Pole and line (H) | 3.00 | 2.97 | 3.08 | 2.99 | |
| Trawler (PI) | 2.67 | 4.17 | – | 2.72 | |
| Small pelagic purse seine group (PCGK) | – | 2.48 | 1.87 | 2.32 | |
| Shrimp trawl (PU) | 1.33 | 1.34 | – | 1.33 | |
| VBD 1 | VMS 2 | ||||
|---|---|---|---|---|---|
| Count | Percent | Count | Percent | ||
| Match | 143,917 | 6.72% | 158,119 | 19.99% | |
| Miss | 1,996,168 | 93.28% | 632,988 | 80.01% | |
| Sum | 2,140,086 | 100% | 791,107 | 100% | |
| QF_Detect | Explanation | Matched VBD counts | All VBD Counts 1,2 | |||||
|---|---|---|---|---|---|---|---|---|
| 2014 | 2015 | 2016 1 | Total | |||||
| 1 | Boat | 35,218 | 37,141 | 46,200 | 118,559 | (74.9%) | 1,420,332 | (71.2%) |
| 2 | Weak | 4098 | 5102 | 6069 | 15,269 | (9.6%) | 220,523 | (11.1%) |
| 3 | Blurry | 2827 | 2732 | 2497 | 5556 | (3.5%) | 59,491 | (3.0) |
| 8 | Recurring light | 3669 | 8214 | 4615 | 16,498 | (10.4%) | 218,707 | (11.0%) |
| 10 | Weak and blurry | 626 | 916 | 845 | 2387 | (1.5%) | 27,354 | (1.4%) |
| Sum | 46,435 | 54,105 | 60,206 | 158,269 | (100.0%) | 1,994,772 | (100.0%) | |
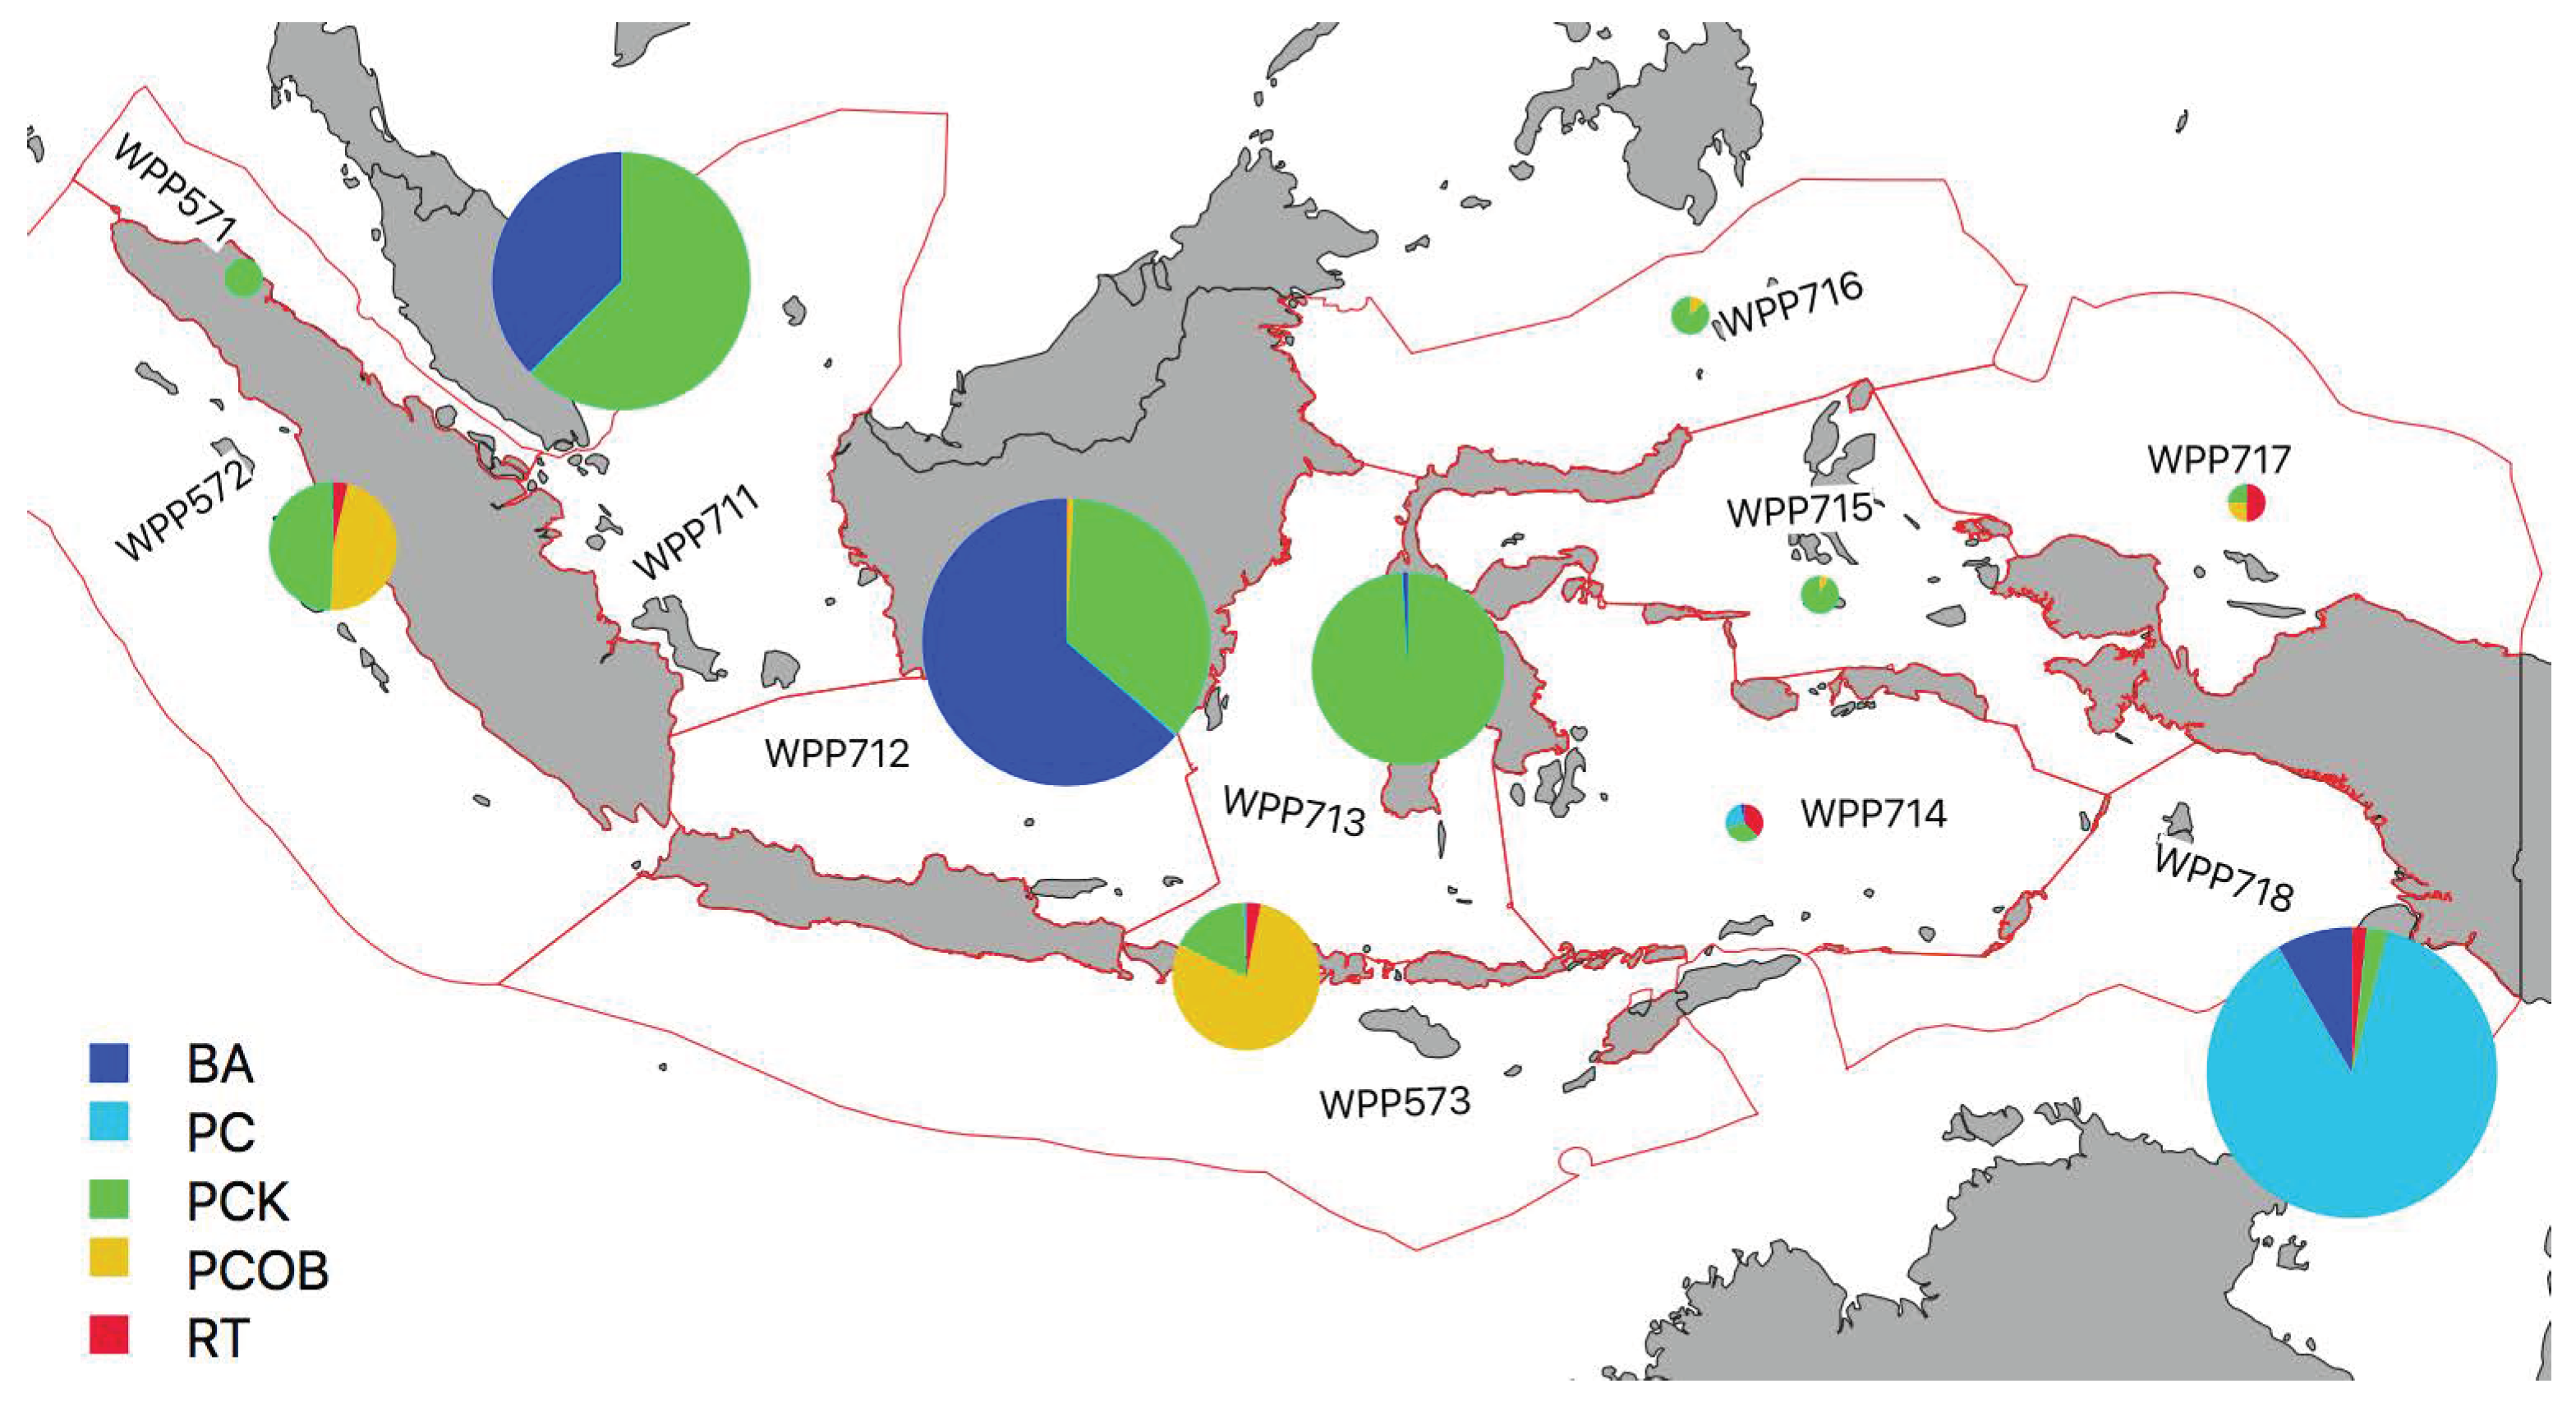
| WPP # | Region | Dominant Gear Type | Percentage |
|---|---|---|---|
| WPP 571 | Malacca Strait | Small pelagic purse seiner (PCK) | 97.20% |
| WPP 572 | West of Sumatra | Small pelagic purse seiner (PCK) | 48.17% |
| WPP 573 | South of Java | Large pelagic purse seine with one ship (PCOB) | 78.83% |
| WPP 711 | Natuna Sea | Small pelagic purse seiner (PCK) | 62.64% |
| WPP 712 | Java Sea | Stick-held squid dipnet (BA) | 63.47% |
| WPP 713 | Makassar Strait | Small pelagic purse seiner (PCK) | 98.80% |
| WPP 714 | Banda Sea | Longline tuna (RT) | 24.43% |
| WPP 715 | Maluku Sea | Small pelagic purse seiner (PCK) | 60.32% |
| WPP 716 | Sulawesi Sea | Small pelagic purse seiner (PCK) | 87.14% |
| WPP 717 | North Papua | Longline tuna (RT) | 50.00% |
| WPP 718 | Arafura Sea | Squid jigging (PC) | 75.47% |
© 2019 by the authors. Licensee MDPI, Basel, Switzerland. This article is an open access article distributed under the terms and conditions of the Creative Commons Attribution (CC BY) license (http://creativecommons.org/licenses/by/4.0/).
Share and Cite
Hsu, F.-C.; Elvidge, C.D.; Baugh, K.; Zhizhin, M.; Ghosh, T.; Kroodsma, D.; Susanto, A.; Budy, W.; Riyanto, M.; Nurzeha, R.; et al. Cross-Matching VIIRS Boat Detections with Vessel Monitoring System Tracks in Indonesia. Remote Sens. 2019, 11, 995. https://doi.org/10.3390/rs11090995
Hsu F-C, Elvidge CD, Baugh K, Zhizhin M, Ghosh T, Kroodsma D, Susanto A, Budy W, Riyanto M, Nurzeha R, et al. Cross-Matching VIIRS Boat Detections with Vessel Monitoring System Tracks in Indonesia. Remote Sensing. 2019; 11(9):995. https://doi.org/10.3390/rs11090995
Chicago/Turabian StyleHsu, Feng-Chi, Christopher D. Elvidge, Kimberly Baugh, Mikhail Zhizhin, Tilottama Ghosh, David Kroodsma, Adi Susanto, Wiryawan Budy, Mochammad Riyanto, Ridwan Nurzeha, and et al. 2019. "Cross-Matching VIIRS Boat Detections with Vessel Monitoring System Tracks in Indonesia" Remote Sensing 11, no. 9: 995. https://doi.org/10.3390/rs11090995
APA StyleHsu, F.-C., Elvidge, C. D., Baugh, K., Zhizhin, M., Ghosh, T., Kroodsma, D., Susanto, A., Budy, W., Riyanto, M., Nurzeha, R., & Sudarja, Y. (2019). Cross-Matching VIIRS Boat Detections with Vessel Monitoring System Tracks in Indonesia. Remote Sensing, 11(9), 995. https://doi.org/10.3390/rs11090995