1. Introduction
Over the past 40 years, China has experienced rapid urbanization due to its policies of reform and opening up [
1]. The continuous population growth and rapid expansion of urban land use have had a significant impact on the ecological and resource environments. There have been several problems in some areas, such as the urbanization of land faster than the population growth, insufficient resources and environmental carrying capacity, and extraordinary ecological and environmental issues [
2,
3]. Therefore, it is of great importance to scientifically implement urban planning and its associated adjustments to rapidly and accurately access changes in urban boundaries, which helps provide a better understanding of the urbanization process.
Remote sensing imagery has become an important data source for urban boundary extraction and urban expansion monitoring due to its timeliness and economy, as well as a wide range of monitoring capabilities. Higher resolution images (such as from QuickBird in the United States, GF satellite imagery in China, etc.) have the ability to better distinguish features and can be used for urban boundary extraction. However, these data come with a high acquisition cost, a high data processing workload, a weak acquisition ability, a long renewal period, large spectral differences in ground objects, and a strong regional heterogeneity, which hinder the automation of urban boundary extraction at national or large regional scales [
3,
4,
5,
6]. The above problems have been addressed as a result of the development of nighttime light imagery. First, the global nighttime light data obtained from an operations linescan system (OLS) sensor carried by the US military’s defense meteorological satellite program (DMSP) has been proven by many scholars to be related to human activities, which can be used to study the urbanization process at regional or larger scales [
7,
8,
9,
10,
11,
12]. The Suomi National Polar-orbiting Partnership-Visible Infrared Imaging Radiometer Suite (NPP-VIIRS) has a higher spatial resolution than the DMSP/OLS data and can also be used to monitor human activities [
13,
14,
15]. The world’s first professional nighttime remote sensing satellite “Luojia1-01” imagery was jointly developed by a team at Wuhan University and related institutions and can monitor the macroeconomic operations of China and the world for the National Development and Reform Commission and other departments to provide an objective basis for governmental decision-making [
16]. Nighttime light data has been used as early as 1970 for urban extraction [
17].
The nighttime light data can provide full coverage at the national or global scale with only a few images, while ordinary optical images require multiple frames for even a large city. In addition, nighttime light data can be automated and processed more quickly, giving it unique advantages for large-scale research. The nighttime light data can detect faint nighttime lights, which reveal only the intensity of the light without showing spectral differences [
18]. While ordinary optical images can only reflect the spatial information of objects, the nighttime light data has both spatial attributes and socio-economic attributes [
8,
9], making it more meaningful for urbanization research. At the same time, there are some regions marked as urban areas from optical imagery, but these can be recently built without significant human activity, suggesting they should not be defined as urban areas. The use of nighttime light data can avoid this problem.
There have been many scholars that have used nighttime light data to extract urban boundaries. The methods to accomplish this are roughly divided into three categories: Threshold methods [
19,
20,
21,
22,
23,
24,
25,
26,
27,
28], traditional image classification [
29,
30,
31,
32], and local trimming methods combined with other data [
27,
33]. Of these, the threshold method is the most widely used because of its relatively simple approach. Firstly, empirical threshold methods, statistical data comparison methods, mutation detection methods and spatial data comparison methods are all included as subsets of the threshold method where urban boundaries are extracted by setting a threshold based on past experience [
19]. While these methods are simple and easy to implement, their applicability is difficult to guarantee due to their strong subjectivity. Secondly, the method using statistical data comparisons takes statistics for urban land areas that are released by states and local regions as the true values to extract the urban boundaries [
20,
21]. In this method, the threshold is the optimal value from the urban boundary extraction that minimizes the differences between the area of the urban area extracted from the nighttime light data and the area from the statistics. However, this approach has no uniform definition for different regions where it is applied, making it difficult to compare horizontally between different cities. In addition, these statistics involve local interests, giving them a questionable reliability. Additionally, in the mutation detection method, the segmentation threshold for the urban boundary is determined when changing the threshold for the nighttime light data [
21,
22]. The threshold corresponding to a sudden increase in the perimeter of the urban boundary is taken as the segmentation threshold. Cities in single-center urban areas are more suitable for this method as the applicability for cities with multi-central urban areas is questionable. The extracted results are much larger than the actual urban area using this method, and each time the threshold is updated, a raster-to-vector conversion has to be performed, making this approach less efficient [
23]. Finally, the final urban boundary is obtained from changing the threshold of the nighttime light data by using spatial comparison method [
2,
4,
28]. Then, urban boundaries extracted using high-resolution optical remote sensing imagery are compared with the selected thresholds. The optimal threshold is determined when the areas of the two urban boundaries differs the least. The results obtained using this method provide some spatial characteristics.
Urban boundaries extracted using Landsat imagery are often used as true values in spatial data comparison methods. However, only the impervious surfaces or construction land can be better extracted from Landsat imagery as opposed to urban areas that reflect the range of human activity due to its coarser resolution. The accuracy of the optimal threshold will be affected if this data is selected as the true value. The accuracy of the urban boundary obtained using the spatial data comparison method still needs to be further explored through the generation of higher resolution remote sensing imagery [
3,
4,
5,
6]. In the current research, only one or a few cities can be extracted due to the difficulty in obtaining their true values. Moreover, the relationship between the urban boundaries extracted from an optical image and the thresholds for the nighttime light image has not been discovered. In addition, DMSP/OLS data are widely used in current urban extraction, while the NPP-VIIRS data have been researched and applied relatively less often, and Luojia1-01 data are used even less frequently. In this paper, three kinds of nighttime light data from the DMSP/OLS, NPP-VIIRS, and Luojia1-01 are selected, and the high-precision urban boundaries obtained from the high-resolution imagery are used as the true values. The optimal threshold function to extract urban boundaries is determined using the Jaccard coefficient and three different nighttime illumination datasets. Fifteen cities were selected as the training samples during this process. Finally, the accuracy of the urban extraction results obtained using the optimal threshold function is evaluated against other methods.
Selecting the statistical comparison method as a comparative experiment to the proposed approach requires comparing the area in the statistical data with the true urban area of the text. However, this would be unscientific because the concepts of “urban” in these two data sets are different. It is unreasonable to compare the empirical threshold method with the proposed method because it is too subjective and its accuracy is difficult to guarantee. However, the mutation detection method can be compared fairly with the proposed method as it does not introduce other information and only uses the image itself to extract the urban area. Therefore, the mutation detection method is selected for accuracy verification together with the proposed method.
2. Study Area and Data
In this paper, 15 cities (Tianjin, Chongqing, Hohhot, Jining, Luoyang, Nanjing, Qingdao, Shenzhen, Xuzhou, Wuhan, Shijiazhuang, Taiyuan, Changchun, Zhengzhou, and Yangquan) located in different regions and of various sizes were selected as the training samples for the proposed method. Then, 13 cities (Baotou, Beijing, Dalian, Fuzhou, Jinan, Kunming, Lanzhou, Nanchang, Nanning, Shenyang, Urumqi, Xi’an, and Yinchuan) were selected for accuracy verification through a comparison of the urban boundaries extracted using the mutation detection method and the proposed method.
The true values of the urban boundaries selected in this paper are extracted from high-resolution images using consistent extraction standards with a strong reliability. First, the aerial films GF1 and GF2, which generally have resolutions better than 1 m, are obtained from the Surveying and Mapping Department. Higher resolution imagery provides more obvious urban boundary characteristics, which gives a more detailed and accurate boundary decision. Moreover, manual extraction is used to further ensure the accuracy of the boundary extraction. A series of standard rules and processes is proposed to guarantee the consistent and comparative results of the urban boundaries. Finally, the accuracy of this set of boundaries has been verified, and the results are superior to the boundaries extracted when using other methods [
5].
Administrative boundaries from the results of basic geography monitoring are used in this paper.
The nighttime light data comes from three sources, including the 2012 global nighttime average light data (DMSP/OLS) as obtained from sensors onboard a US military meteorological satellite, the August average image data from the 2012 monthly synthesized nighttime remote sensing imagery (NPP-VIIRS), and the 2018 Luojia1-01 satellite. The satellite imagery data are from around the month of August, and all the image data are projected using the Albers double standard latitude line. The acquisition time of the Luojia1-01 images is different for each of the considered cities. As a result, the original light intensity values have certain differences and cannot be directly compared or analyzed. Therefore, the Luojia1-01 imagery is radiometrically scaled using Equation (1), and the administrative area demarcation line is used to select the image data for each city area. Radiation corrections can limit the differences caused by images taken in different periods to make them more comparable.
where
L is the radiance value after the absolute radiation correction and
DN is the image gradation value.
3. Method
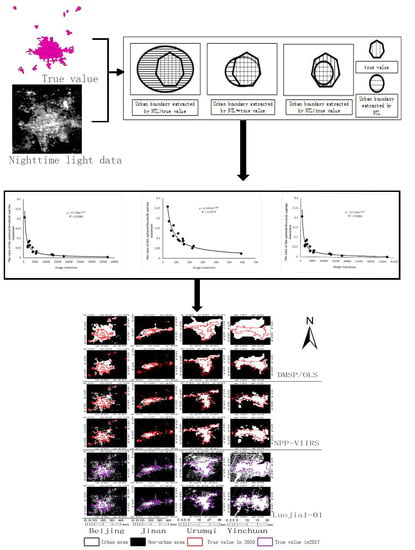
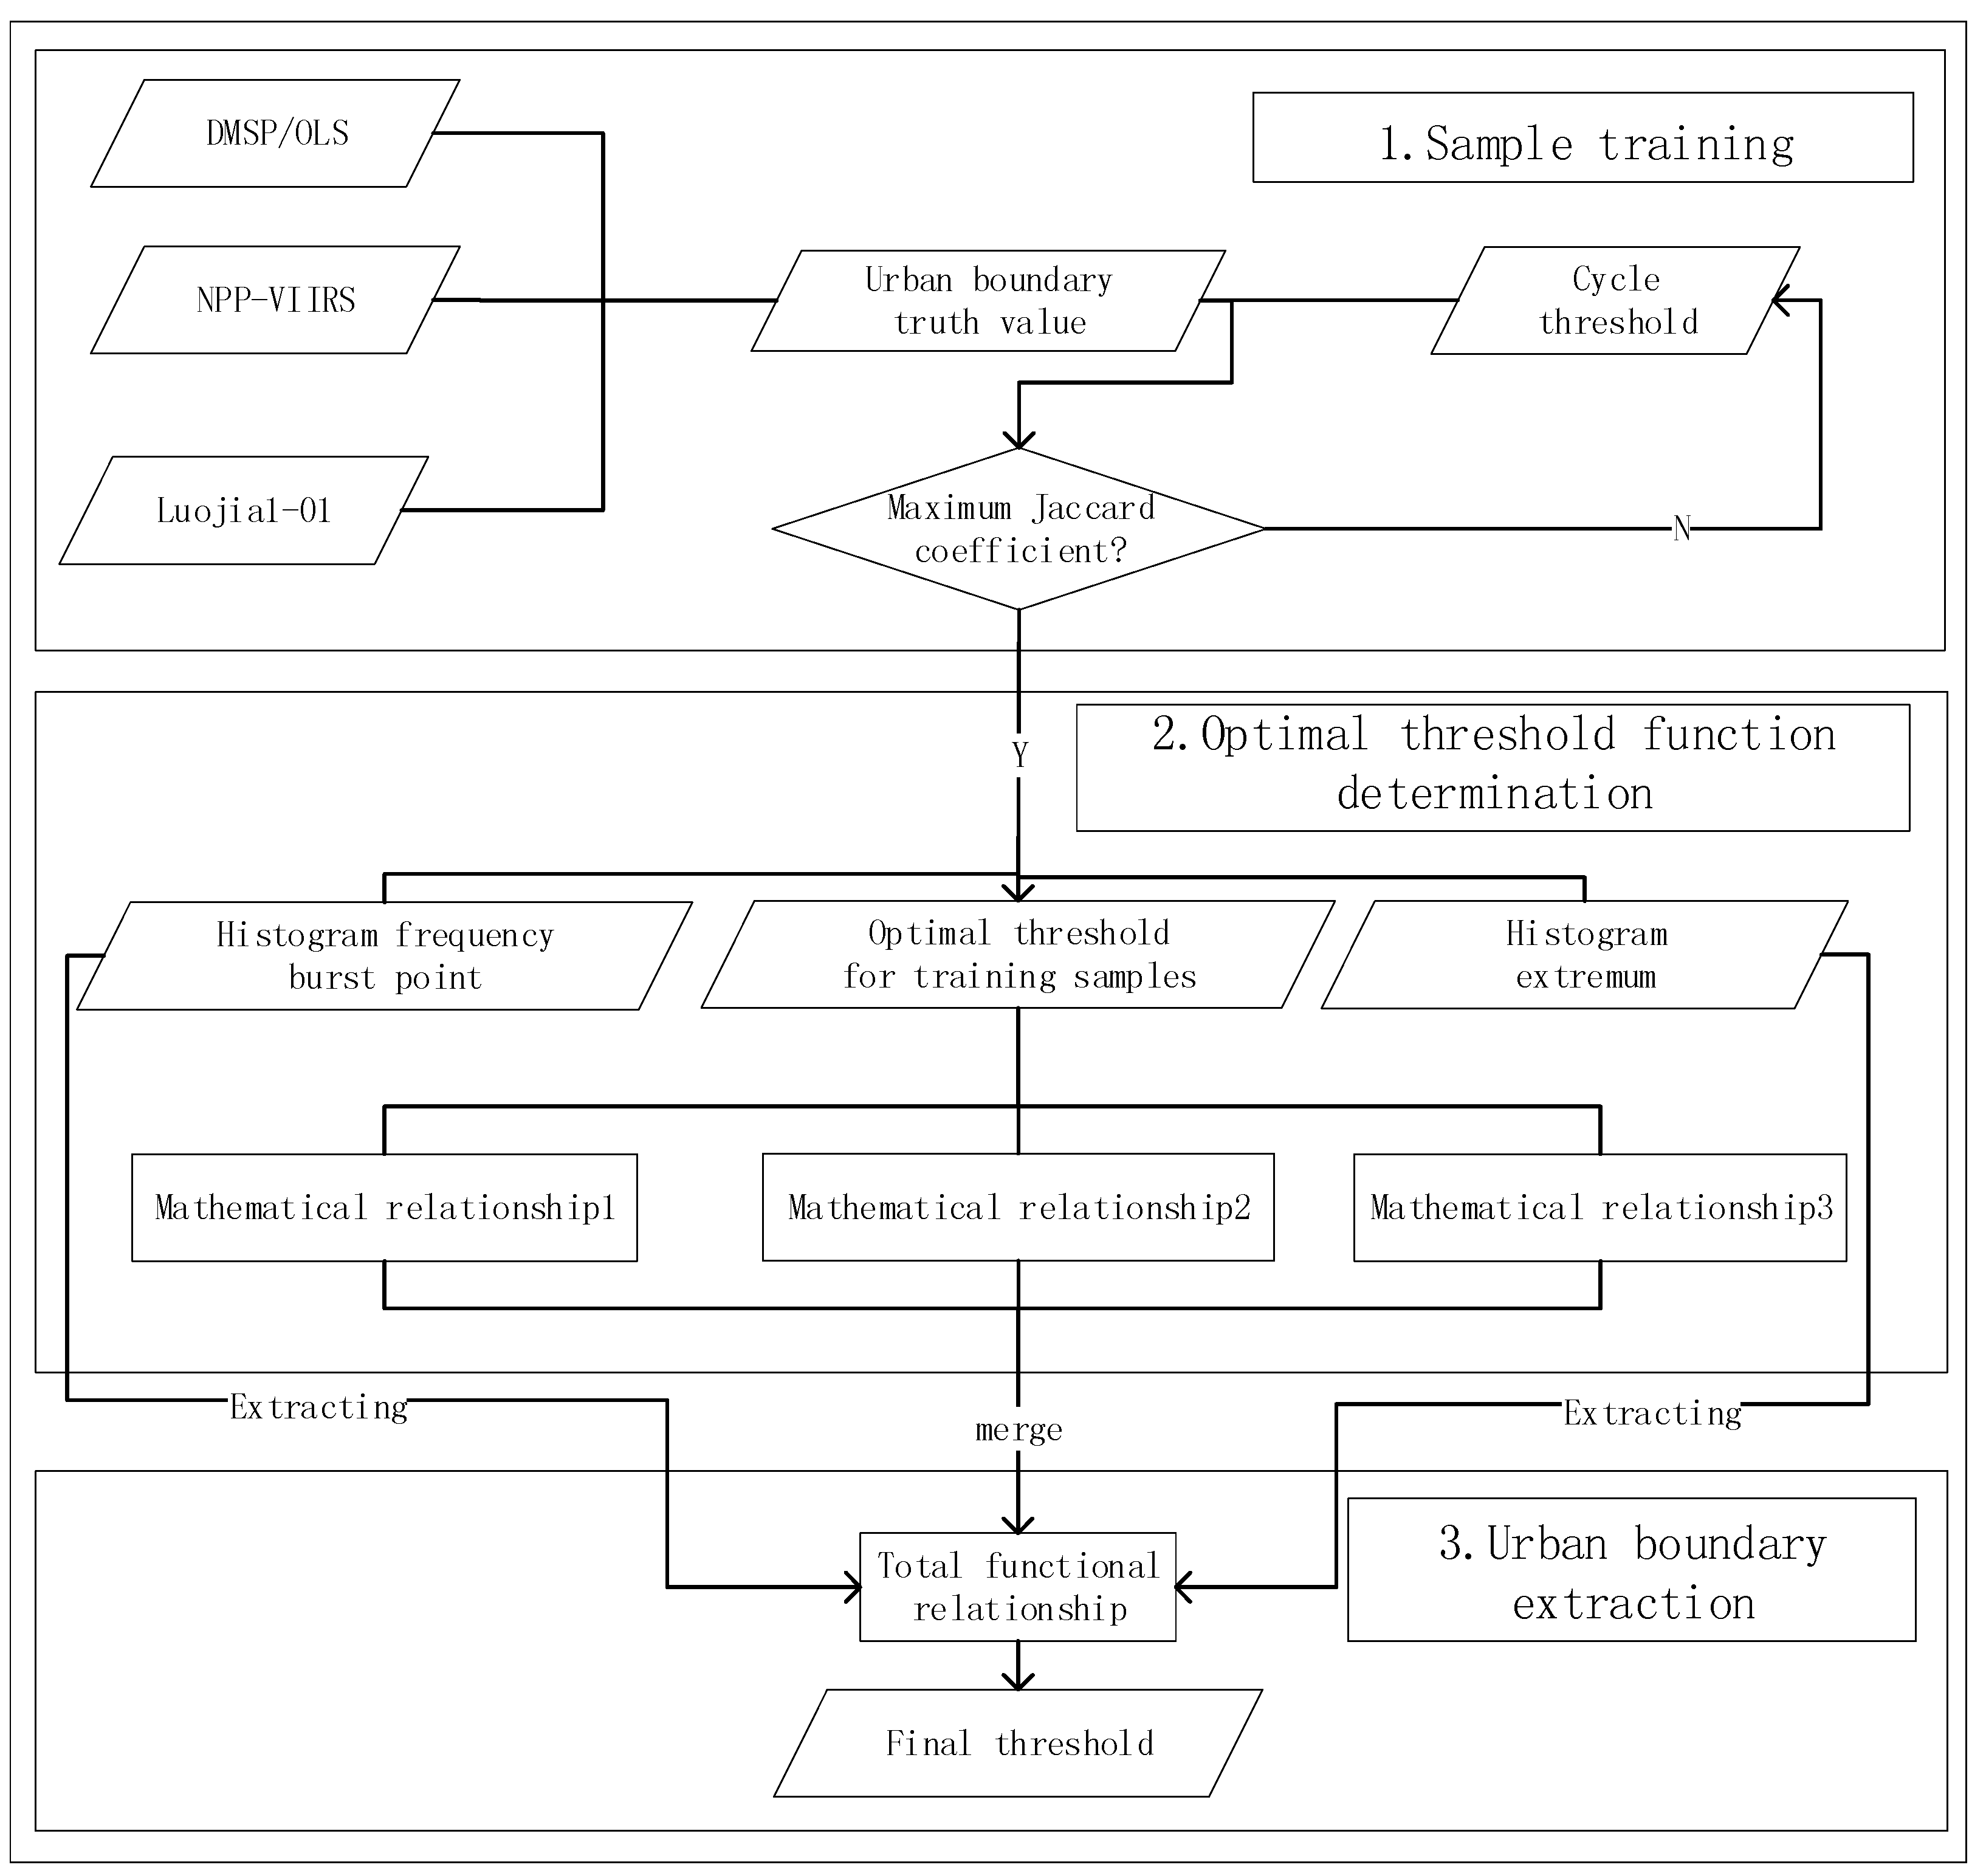
The research methodology used in this paper is illustrated in
Figure 1. First, 15 cities are selected as training samples, and a set of high-precision urban boundaries based on the higher resolution images is selected as the true values. The Jaccard coefficients are introduced and used to compare the similarities and differences between the sample sets and the nighttime light data. Larger coefficient values indicate a higher sample similarity. The true values and the extracted urban results are compared using a pixel-by-pixel comparison as the nighttime light image threshold is constantly changed. The optimal threshold for the training sample is determined when the Jaccard coefficient is the largest. As a result, a set of training thresholds is obtained. A functional relationship between the histogram information for the nighttime light imagery and the optimal thresholds in the training sample set is found by extracting the histogram information from the nighttime light images. The final urban boundary threshold is calculated when the histogram feature information is placed in this functional relationship. Finally, the mutation detection method is selected as a comparative experiment, which does not introduce any additional information and only uses the image itself to extract the urban area. The urban boundaries for thirteen cities not included in the training samples were extracted and compared using the mutation detection method and the proposed method.
3.1. Sample Training
The accuracy and spatial correlation between the training results and the true values can be guaranteed when the Jaccard coefficients are introduced during the sample training. The Jaccard coefficients compare the similarities and differences between two samples. The larger the coefficient, the higher the similarity of the samples [
34], which is defined as:
In Equation (2), represents the degree of coincidence with the true value, where a higher suggests a better fit. The operator represents the spatial intersection, which is recorded as 1 when both the true value pixel and the nighttime light image both indicate an urban area; otherwise, it is recorded as a 0. The operator indicates a space-sum. That is, the operation gives a value of 1 when either a nighttime light image pixel or the truth-value cell are in the urban area. The and are the i-th pixel values in the nighttime light image (0 means non-urban and 1 represents an urban area). Thus, the numerator in the formula represents the number of pixels that are determined to be an urban area in both images, and the denominator is the total number of pixels that are marked as urban.
The urban boundary of the training sample city is rasterized into a binary image. At the same time the image is then resampled to the same resolution as the nighttime light data. The urban area extracted according to the initial threshold and the true values are operated on pixel-wise according to Equation (2). In the process of changing the thresholds, the extracted urban area gradually approaches the true value. As a result, the Jaccard coefficient tends to increase first and then decrease. When the Jaccard coefficient is maximized, the corresponding value is taken to be the optimal threshold. As shown in
Figure 2, the denominator in Equation (2) continues to decrease as the threshold increases, and the
will continue to increase. As the threshold increases, the urban pixel values marked by the nighttime light image fall completely within the urban area marked by the true value. In this case, the denominator remains unchanged and the numerator begins to decrease, causing the JC to begin to decrease. Therefore, the maximum
value can be obtained in this process, and the urban area determined from the nighttime light image corresponding to the optimal threshold is the most accurate in regards to the total number of correct pixels and the spatial position.
3.2. Method to Determine the Optimal Threshold Function
3.2.1. Urban Boundary Extraction Based on the DMSP/OLS Data
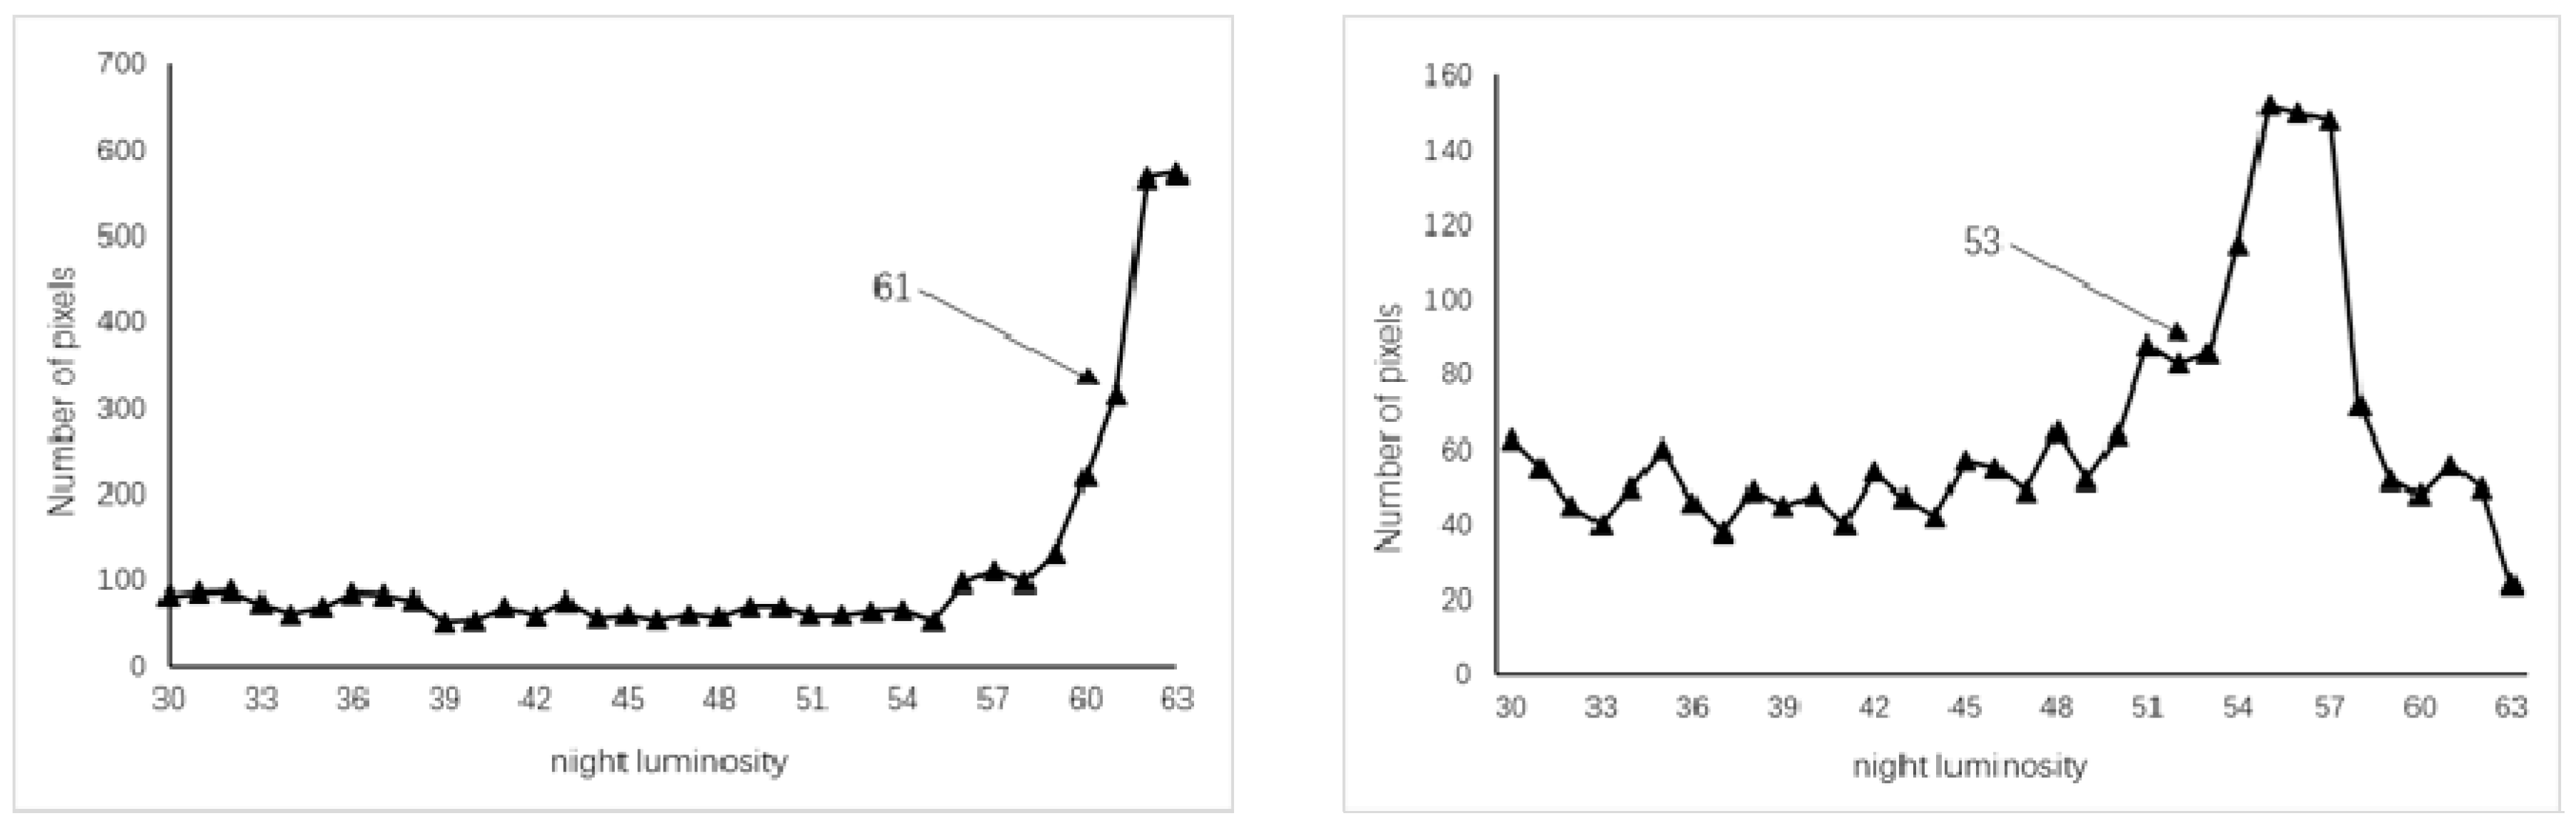
Due to the problems of light overflow and oversaturation in the DMSP/OLS data, there is more light intensity when closer to a city center. Here, it is found that there is always a sudden increase in the pixel frequency for each city (from 30 to 63) by analyzing the DMSP/OLS image histograms within a city’s jurisdiction (see
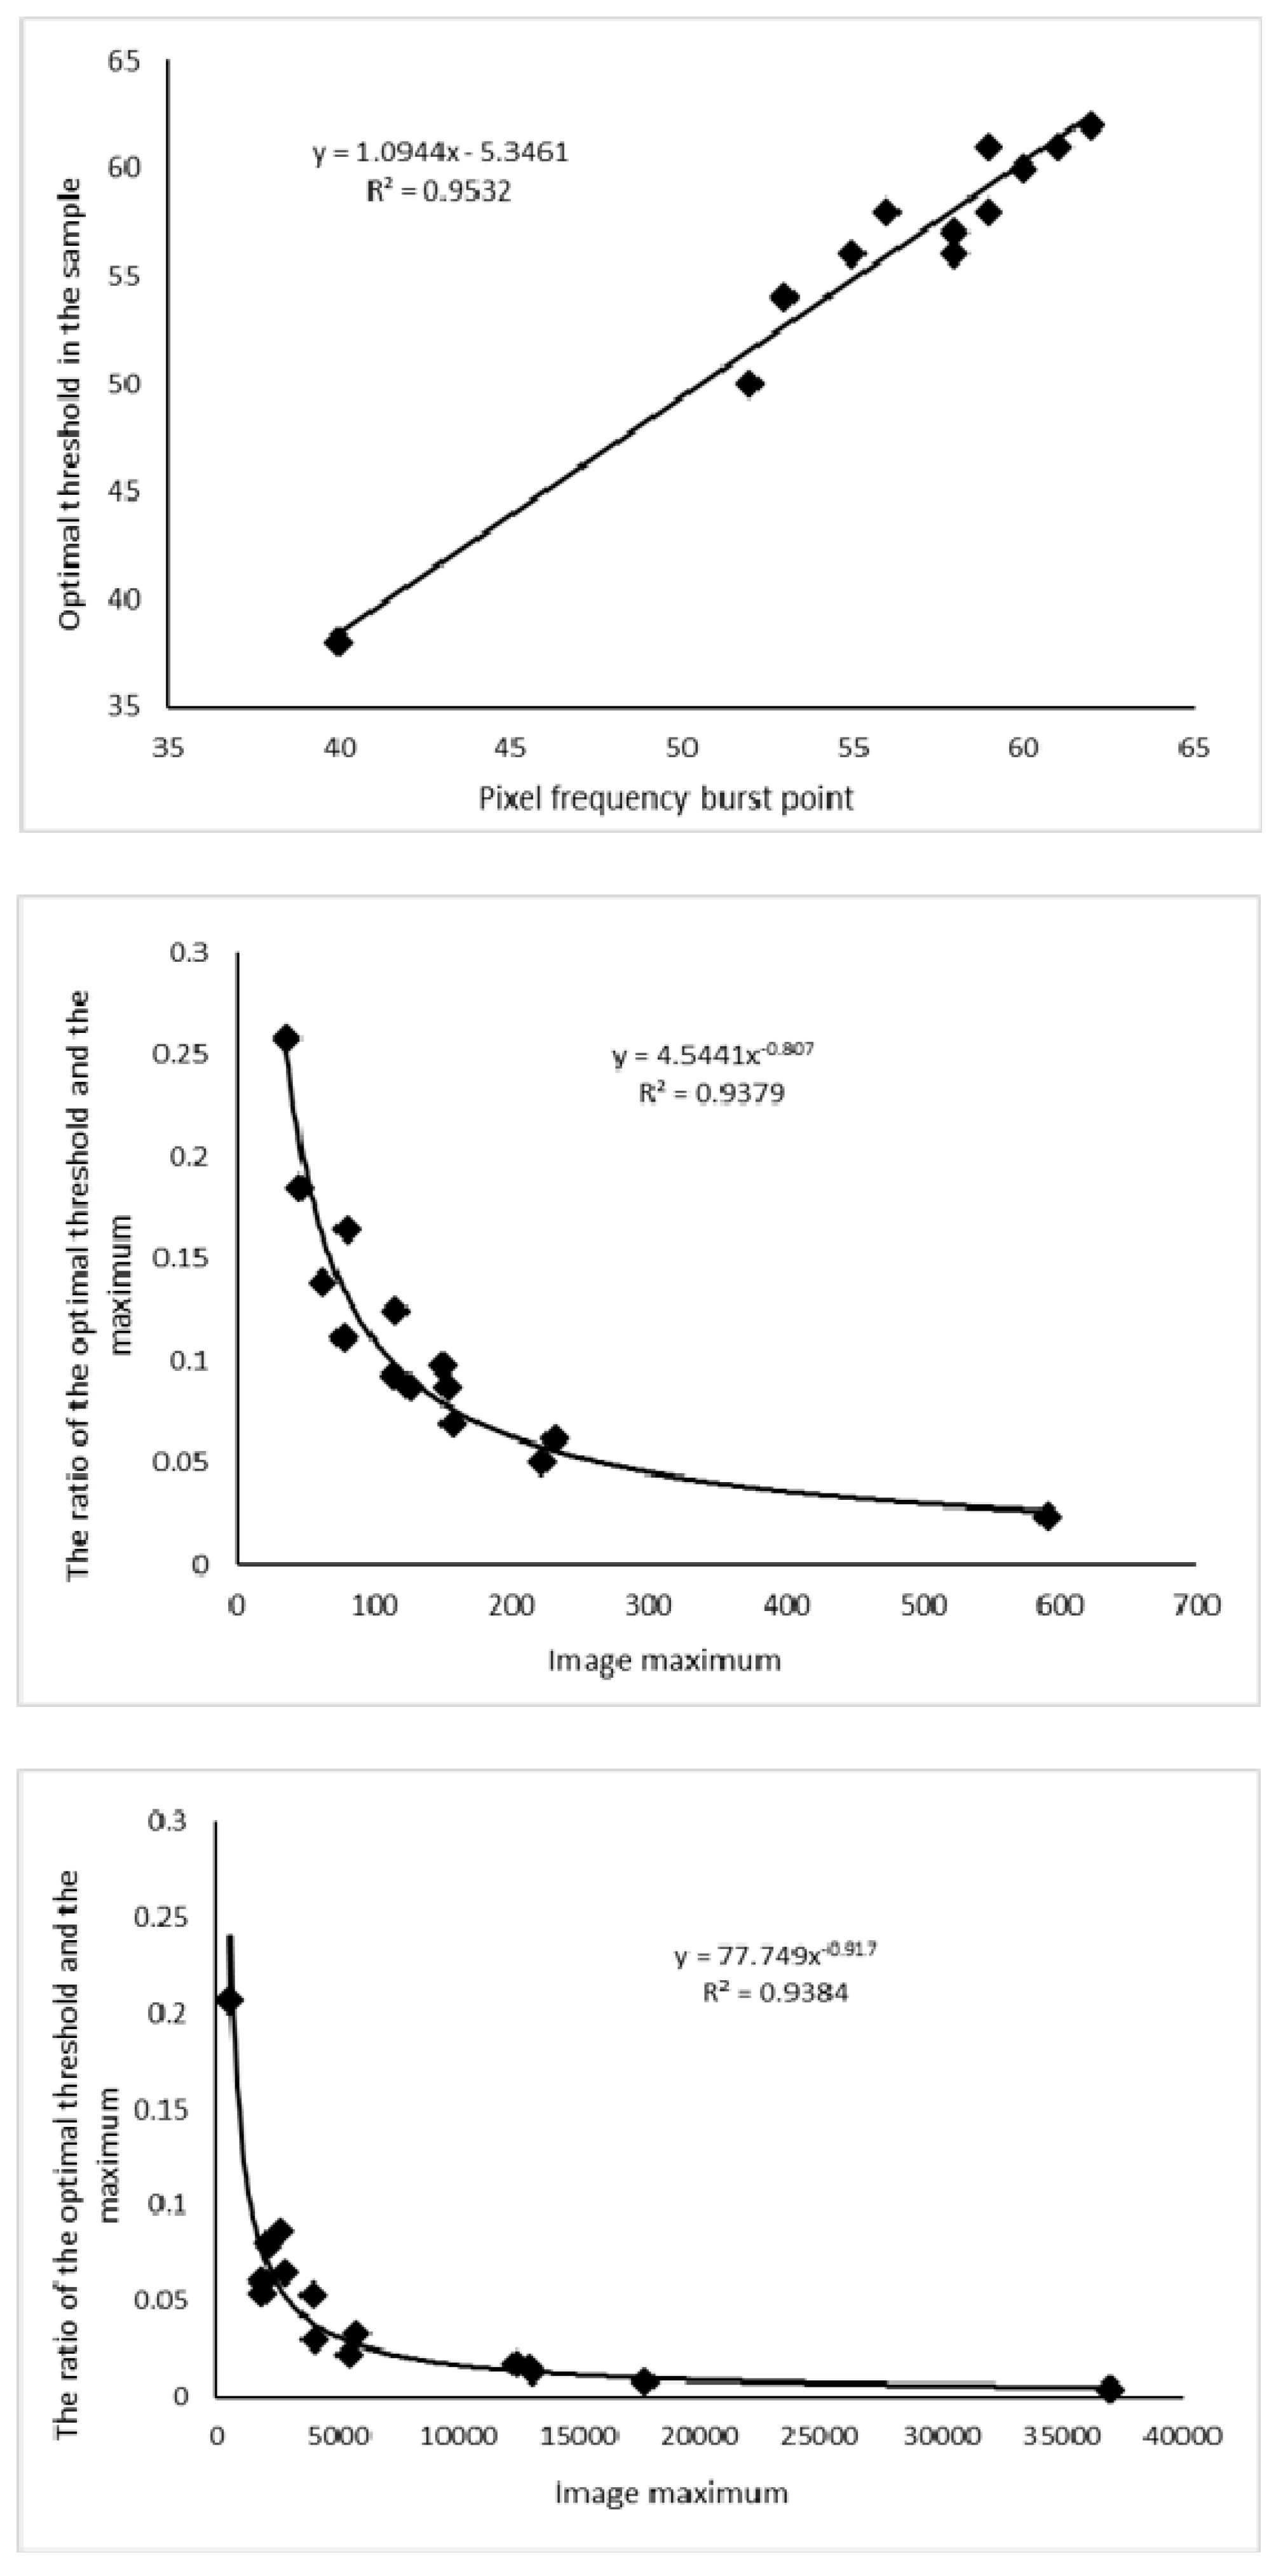
Figure 3). Combined with the frequency distribution law of the DMSP/OLS data, the histogram frequency of the pixel values in the range 30–63 is calculated and subsequently subtracted from the front and back to find the group with the largest frequency difference. Then, the former is taken as the image frequency burst point, and the associated pixel values and the optimal threshold of the sample area are analyzed. As a result, there is a strong linear correlation (
R2 = 0.9532) between the nighttime data histograms and the thresholds, as shown in
Figure 4. Therefore, the functional relationship between the optimal threshold to extract urban boundaries and the histogram features of the nighttime light data is as shown in Equation (3).
where
represents the optimal threshold for the DMSP/OLS data extraction in the urban areas, and
represents the corresponding pixel value for the DMSP/OLS data frequency burst points.
3.2.2. Urban Boundary Extraction Based on NPP-VIIRS Data
The NPP-VIIRS data is generally superior to the DMSP/OLS data as it has a higher resolution and uses a floating-point 32-bit form to store the pixel values. This avoids data saturation problems and gives is a clear distinction between luminance pixels. In this case, there is no rule to follow when directly counting the frequency histogram information. Therefore, the maximum value of the nighttime light data in the city area of the training sample is counted first, and the ratio of the optimal threshold to the maximum is subsequently calculated. It is found through experiments that there is a strong correlation between the proportional value and the maximum value of the data. A regression analysis indicates that the two have a strong power correlation, as shown in
Figure 4) (R
2 = 0.9379). The functional relationship between the optimal threshold for the urban boundary extraction and the histogram features of the nighttime light data is given in Equation (4).
which simplifies to
where
represents the optimal threshold for the NPP-VIIRS data extraction in urban areas and
represents the maximum value of the NPP-VIIRS data.
3.2.3. Urban Boundary Extraction Based on the Luojia1-01 Data
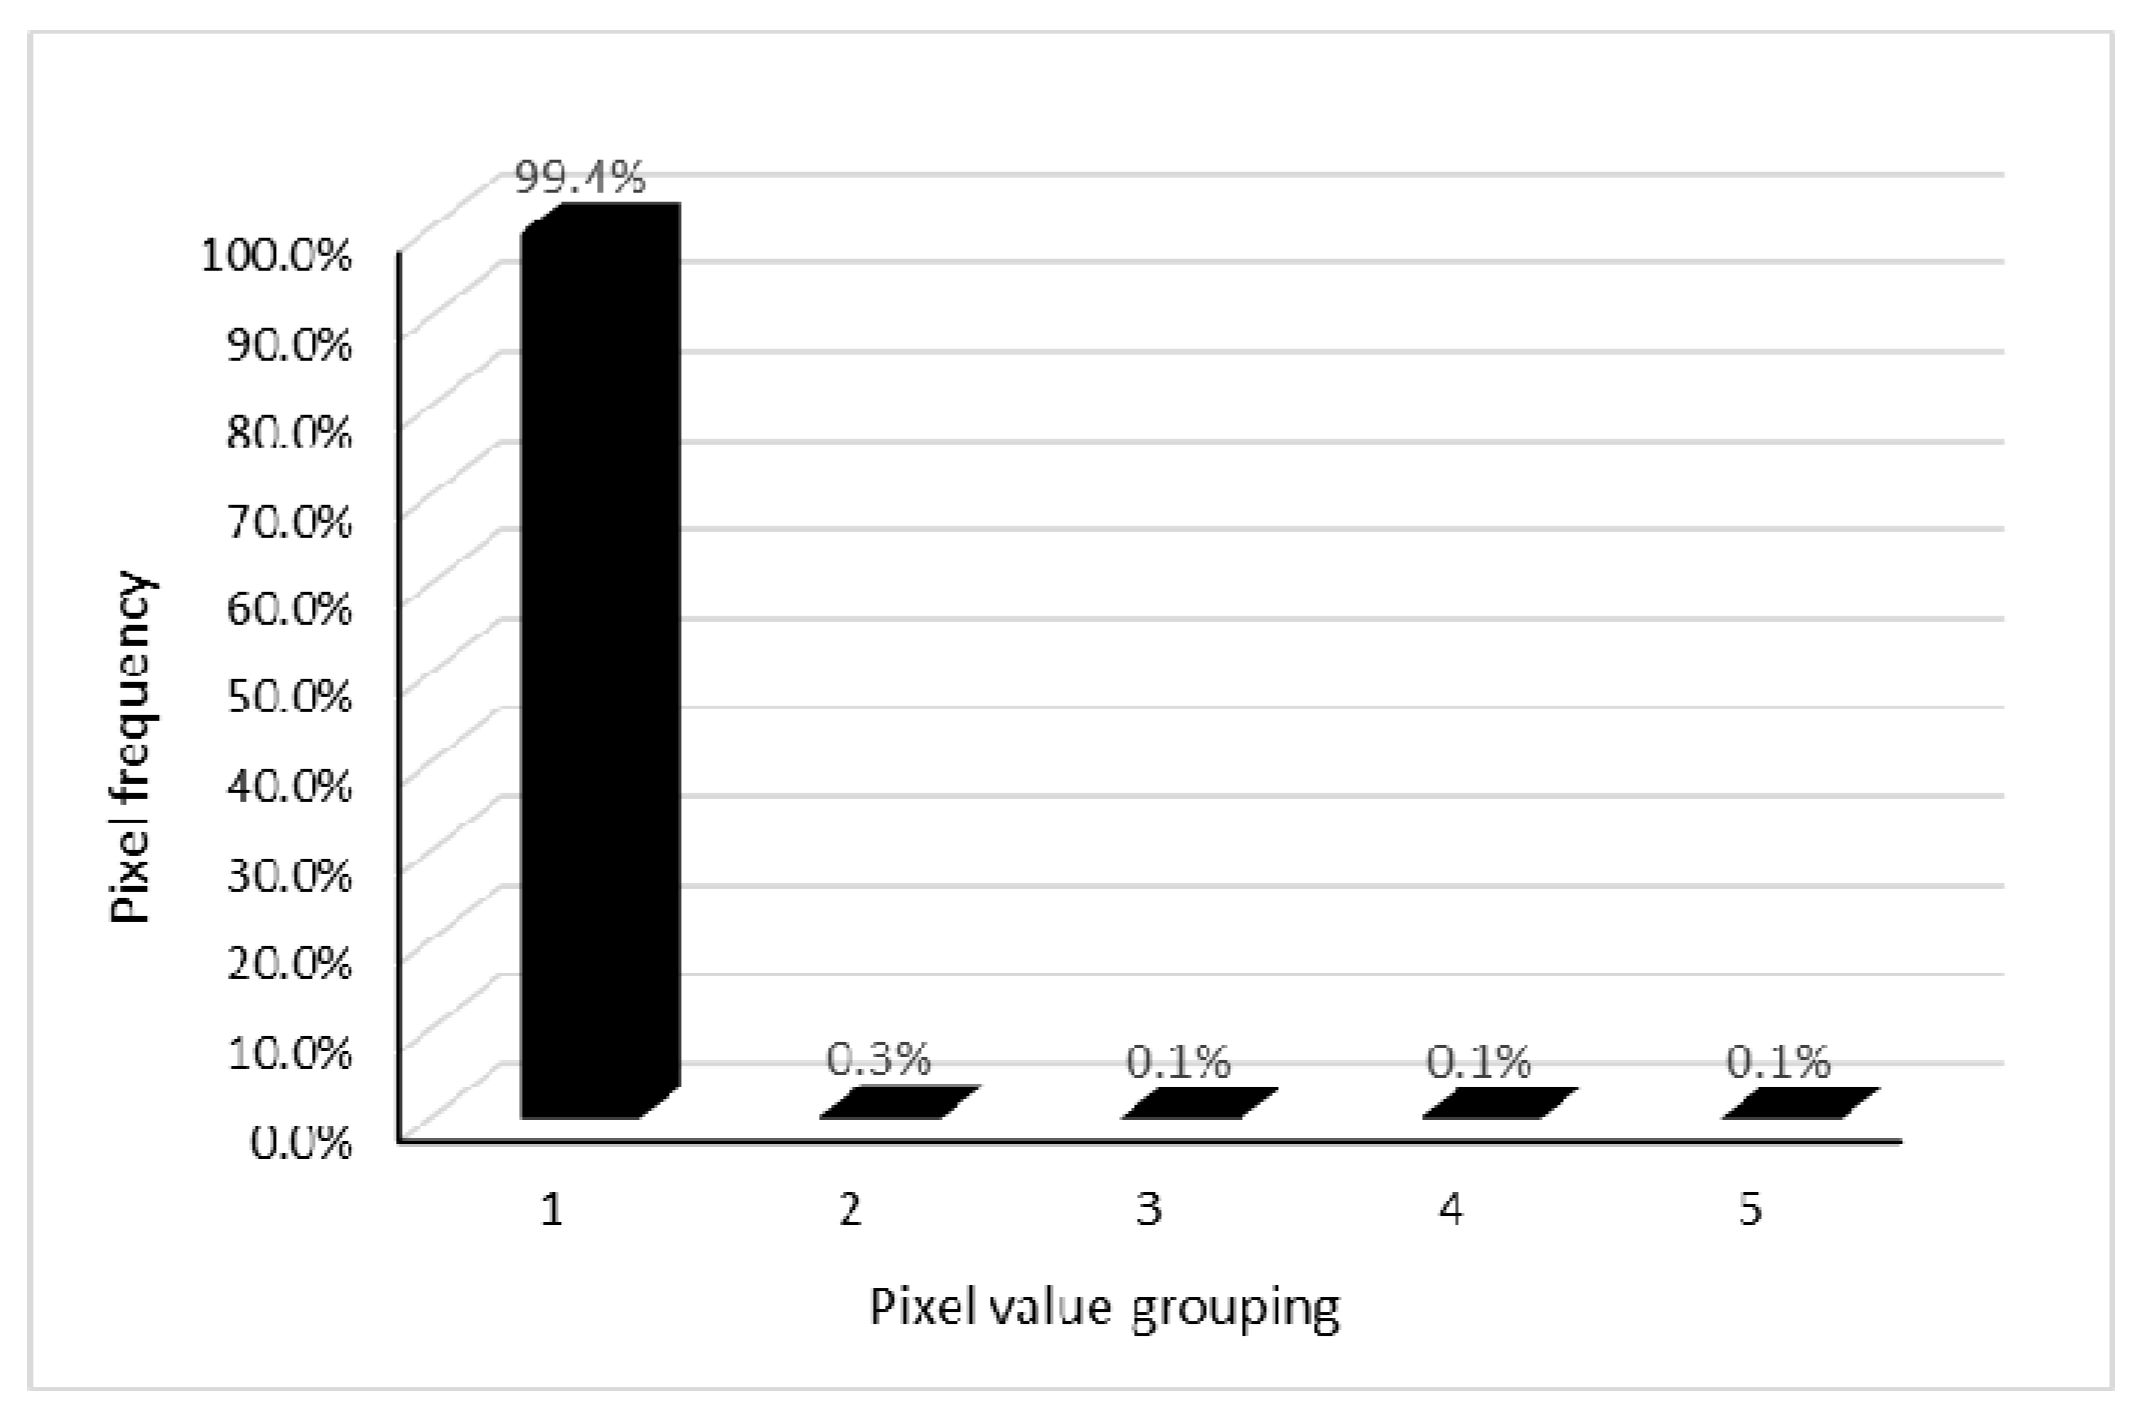
The Luojia1-01 is the first professional night-vision remote sensing satellite from China. It has an image resolution up to 130 m, and the original pixel values can span ten orders of magnitude, which is more accurate for light detection. After absolute radiation correction, the brightness values of the light become floating point data, and the histogram information distribution is not balanced with the NPP-VIIRS data. The statistical image histograms (divided into five groups) are shown in
Figure 5. It is found that less than 1% of the pixels are distributed in the last four groups, suggesting that the maximum may be an outlier due to excessive data dispersion. Therefore, the maximum value before the first statistical cell is taken as the true maximum, and the optimal threshold is found by extracting the urban area according to the NPP-VIIRS data. First, the ratio of the threshold from the training set to the maximum value is obtained. Then, the relationship between this ratio and the maximum value is analyzed to have a strong power correlation, as shown in
Figure 4 (R
2 = 0.9384). Therefore, the functional relationship between the optimal threshold for urban boundary extraction and the histogram characteristics of nighttime light data is as shown in Equation (6).
which simplifies to
In Equation (7), represents the optimal threshold for extracting urban areas from the Luojia1-01 image data and represents the maximum of the first 20% of the pixel values for the Luojia1-01 image data.
3.3. Accuracy Evaluation
The relative error, commission error, omission error, overall classification accuracy, and the Kappa coefficient based on the urban pixel classification results are all used to validate the model. The accuracy stabilities for all the cities in the experiment are tested based on their standard deviations. When the Kappa coefficient falls between 0.0 and 0.20, it is considered to have an extremely low consistency, while 0.21–0.40 indicates a general consistency, 0.41–0.60 is a medium consistency, 0.61–0.80 is a high consistency and 0.81–1 indicates they are nearly identical [
35]. The calculation formulae and definitions for each evaluation indicator are shown in
Table 1.
In
Table 1,
represents the number of urban pixels in the experiment,
is the number of urban pixels in the true value,
is the number of cells that are simultaneously marked as urban in the experimental results and true values,
is the number of cells correctly classified in the experiment (urban and non-urban),
is the number of test samples,
is the sample value,
is the average of the sample
,
is the total number of pixels,
is the total number of diagonals of the matrix,
is the total number of
i rows, and
is the total number of i columns.
4. Results
4.1. Urban Boundary Extraction Results
The urban extraction from Equations (3), (5), and (7) are integrated based on the DMSP/OLS, NPP-VIIRS, and Luojia1-01 datasets to obtain Equation (8).
where,
is the extracted optimal threshold of the urban area,
is the characteristic information of the nighttime light image histogram,
is the highest power coefficient,
is the power number, and
is a constant term. Based on the DMSP/OLS, NPP-VIIRS, and Luojia1-01 data extractions, the values for
are 1.0944, 4.5441, and 77.749;
are 1, 0.193, and 0.083; and
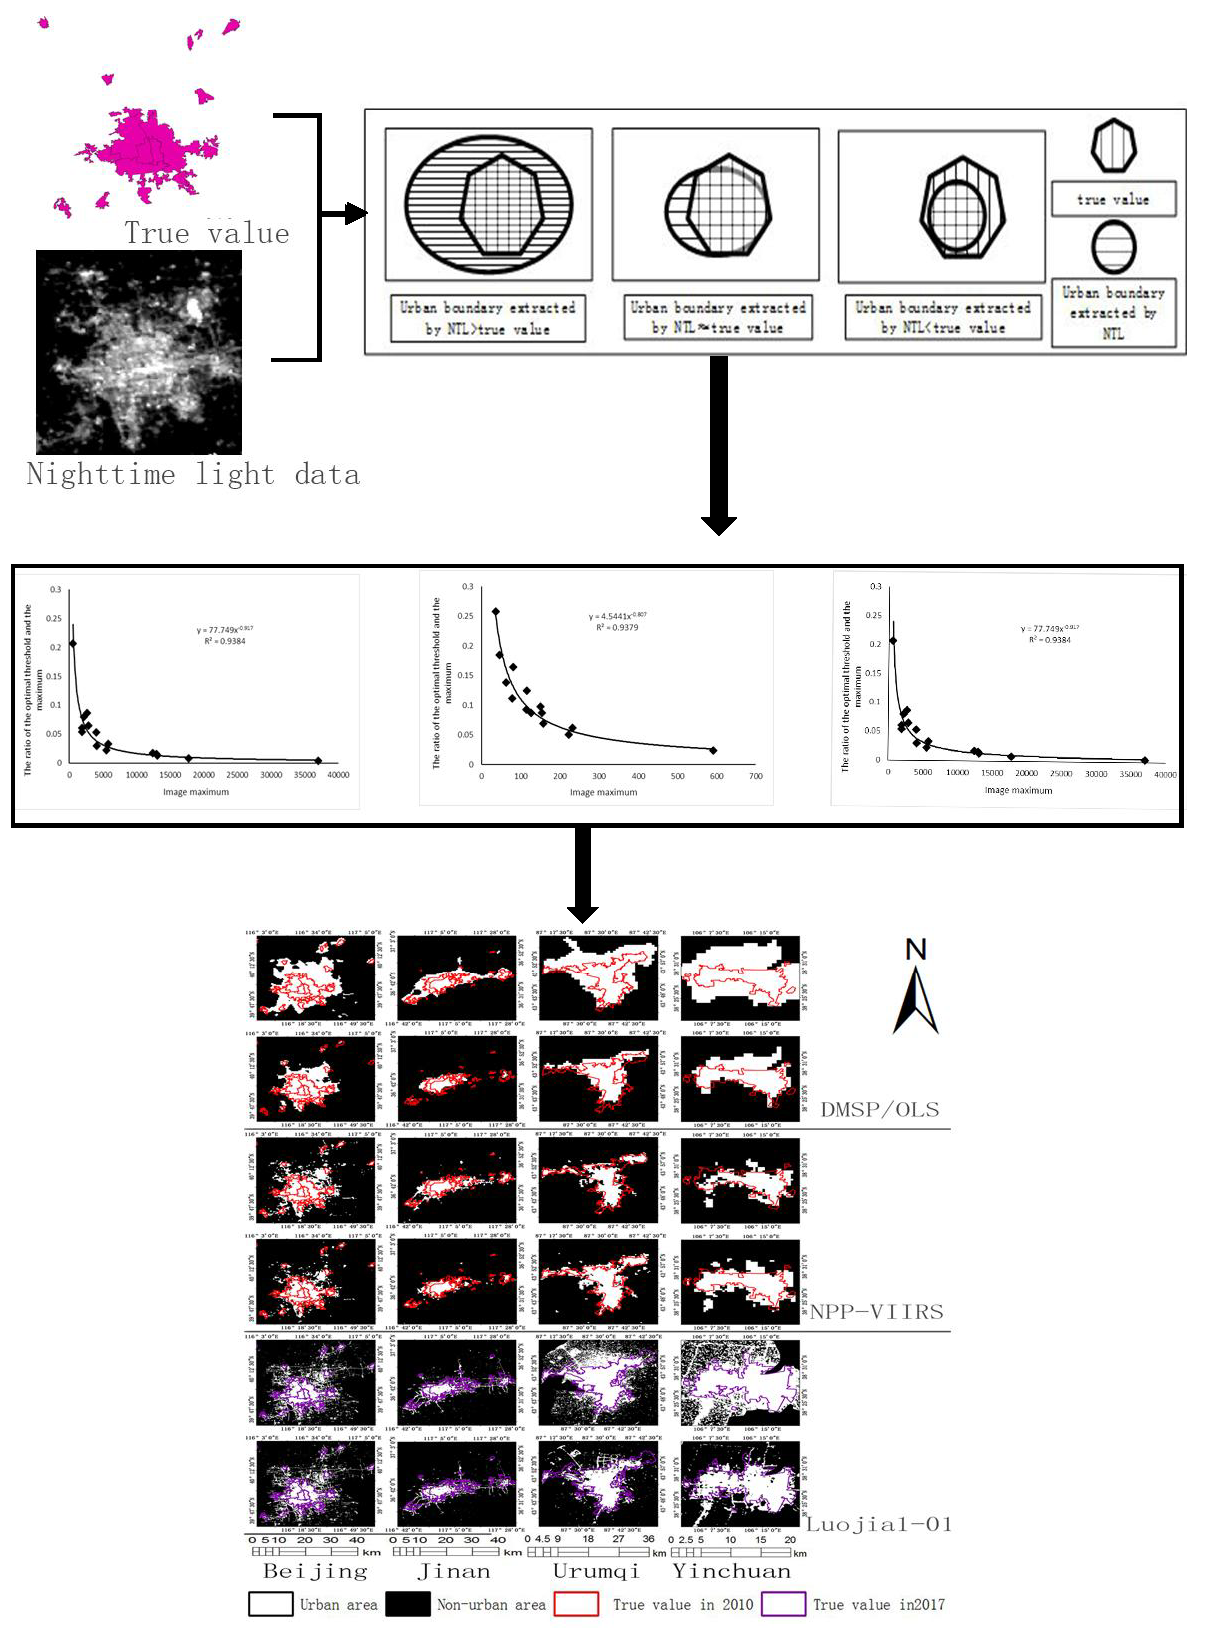
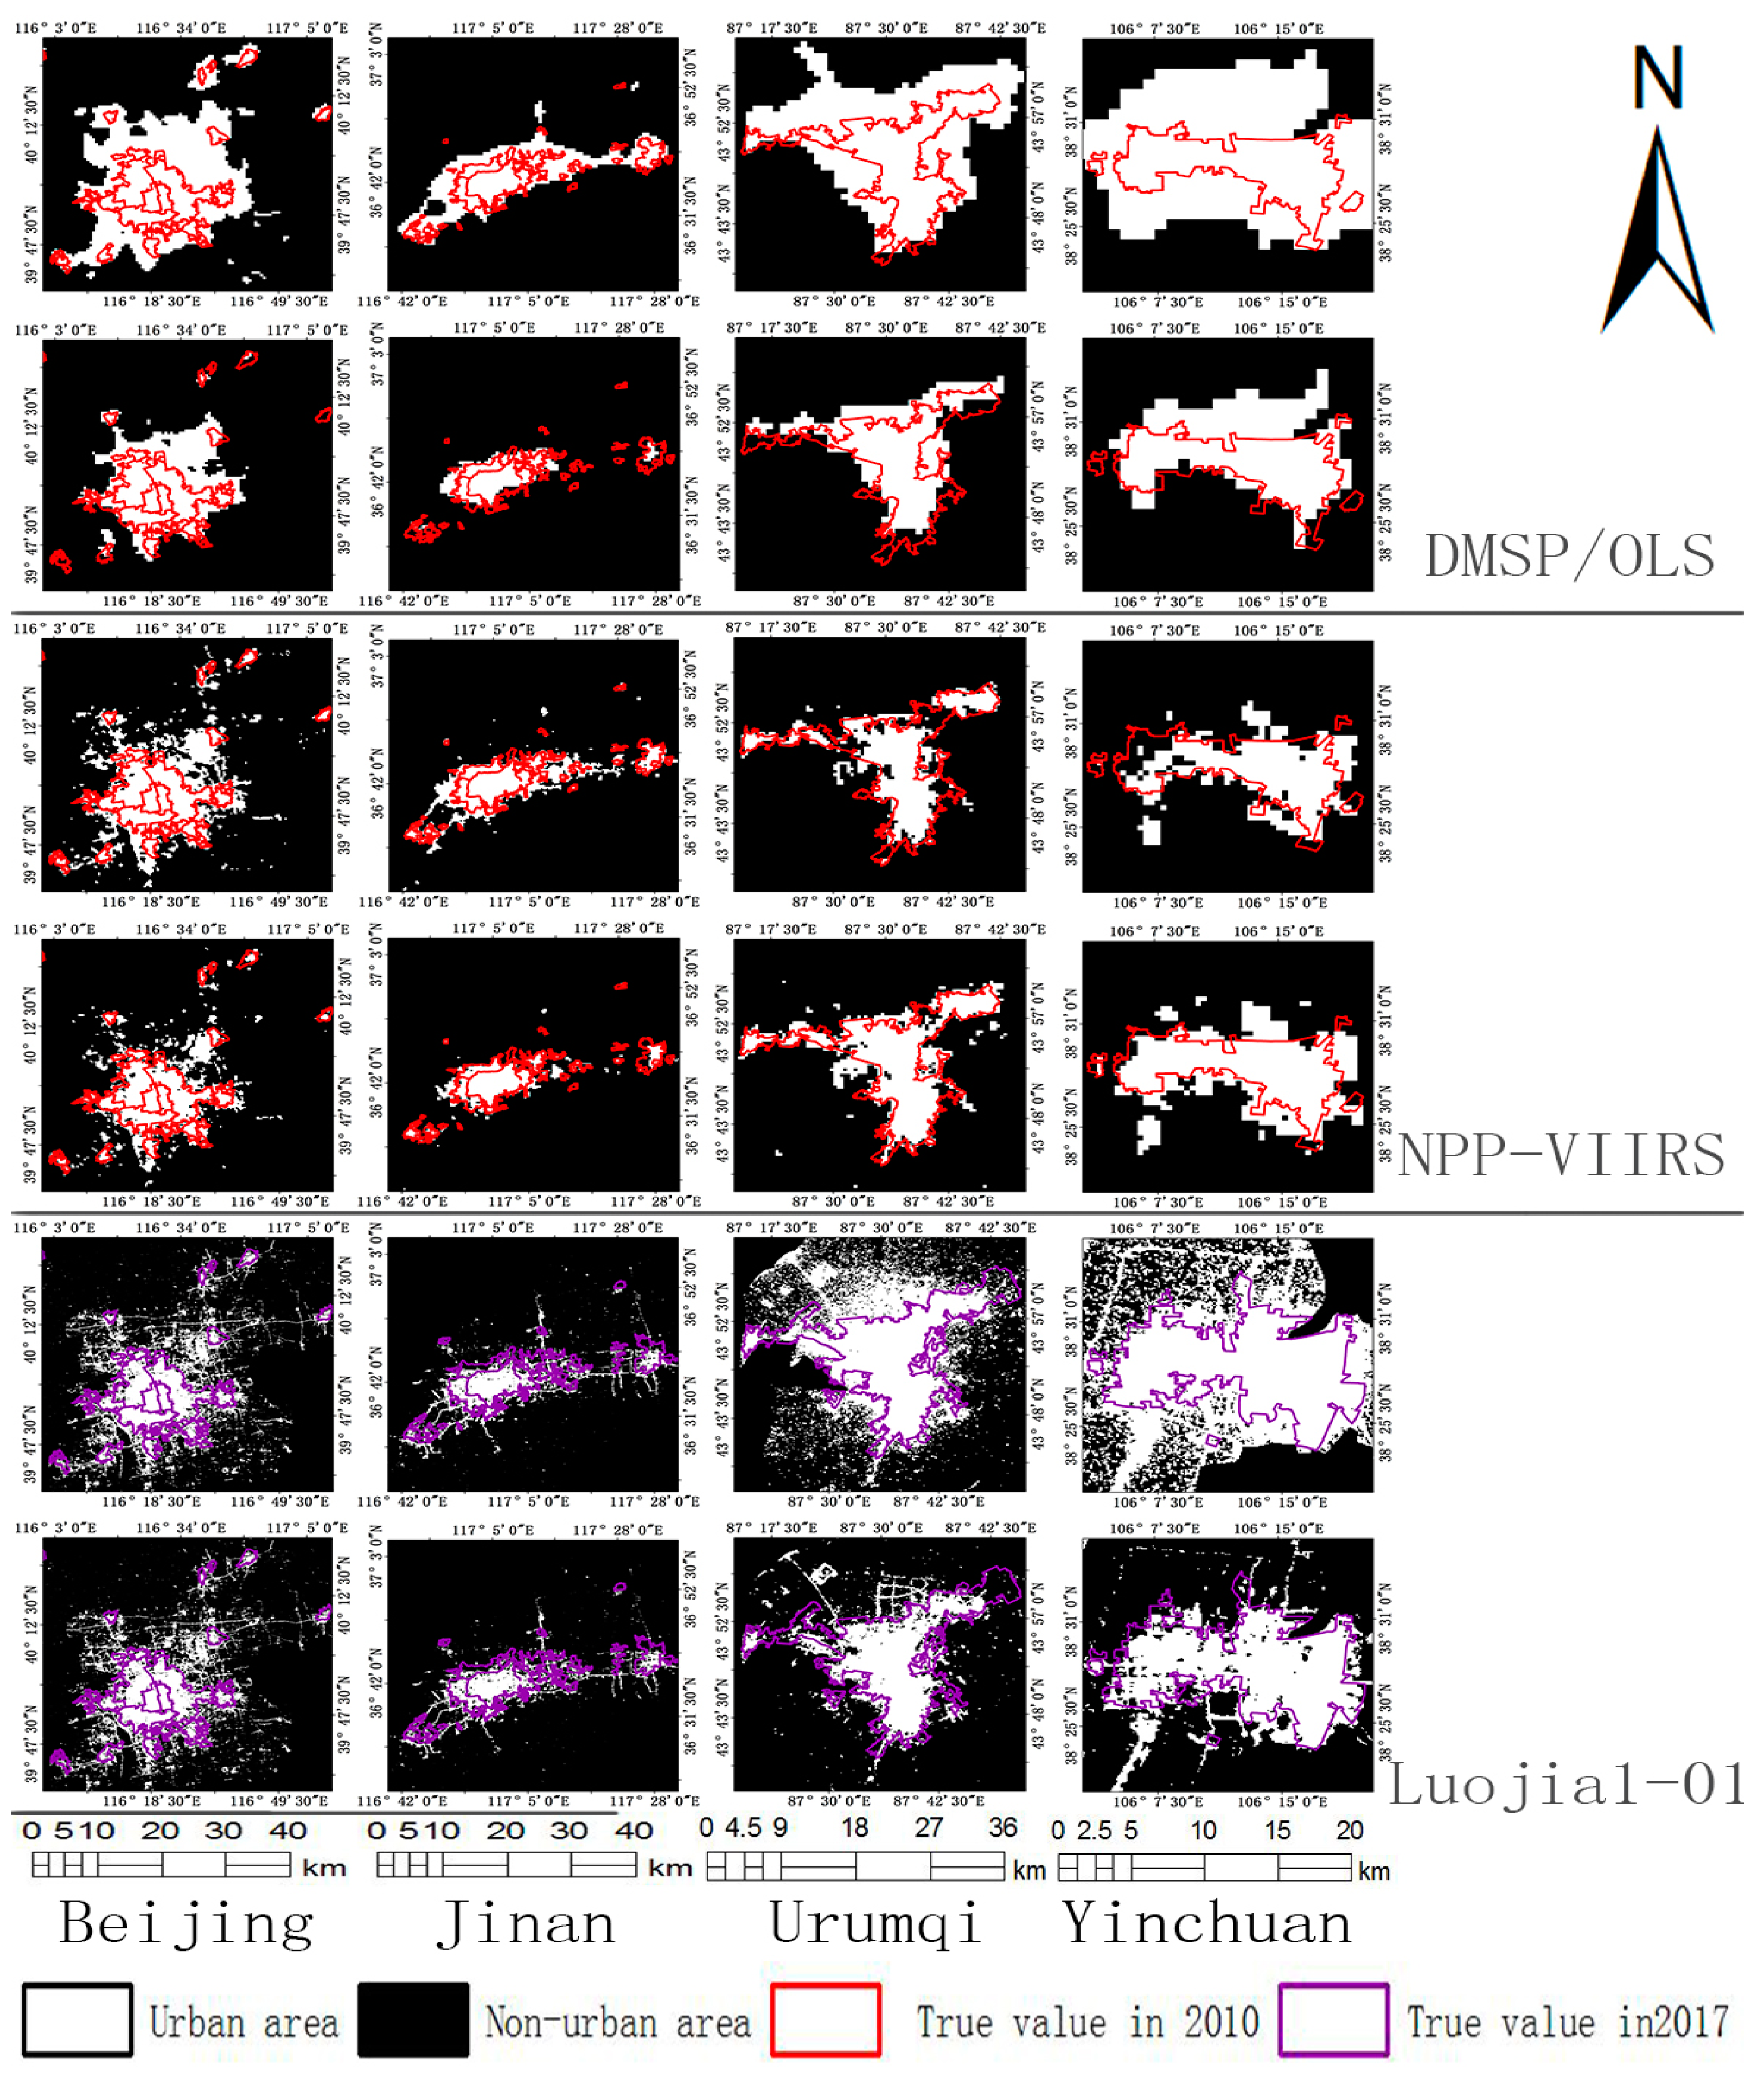
are 5.3461, 0, and 0, respectively. The histogram feature information for the nighttime light imagery is directly substituted into Equation (8) to extract the urban areas for the 13 cities independently, as shown in
Figure 6. At the same time, the urban area extraction for the 13 cities is performed using the mutation detection method as a control experiment.
4.2. Results of the Accuracy Evaluation
Based on the formulae for the accuracy evaluation indicators in
Table 1, the accuracy of the urban extraction results based on the three nighttime light datasets are verified using the proposed method and the mutation detection method for the 13 cities that did not participate in the training. The average (AVE) and standard deviation (SD) of the overall accuracy evaluation are shown in
Table 2. The accuracy verification results for each city are shown in
Table 3.
From
Table 2 and
Table 3, when using the proposed extraction method with the DMSP/OLS data, the average relative error is 29%, the average commission error is 25%, the average omission error is 42%, the average overall classification accuracy is 95%, and the average Kappa coefficient is 61%. When using the mutation detection method, the relative changes in these indicators are 83%, 29%, −35%, −5%, and −5%, respectively. There are major advantages in all the evaluation indicators with the exception of the omission error. The low omission error for the mutation detection method is due to the fact that there are more misdivided pixels, which gives a larger extracted urban area than found in the true value. Therefore, the overall classification accuracy is lower. On the other hand, the extraction results for the proposed method have the phenomenon of “enclave” omission. However, the commission and omission errors for the results obtained using the proposed method are similar and more stable. In the accuracy evaluation of each city, the average relative error and the commission error for the results obtained using the proposed method are lower than from the mutation detection method, and the overall classification accuracy is higher. The Kappa coefficient is only slightly lower in the cities of Kunming and Lanzhou when using the proposed method and is higher for the other cities. The average Kappa coefficient is 61%, which is consistent with the true value.
Using the proposed extraction method with the NPP-VIIRS data, the average relative error is 20%, the average commission error is 27%, the average omission error is 23%, the average overall classification accuracy is 96%, and the average Kappa coefficient is 71%. In comparison, the mutation detection method shows that these indicators increase by 18%, 3%, 2%, −1%, and −4%, respectively. Compared with the mutation detection method, the proposed extraction method is advantageous for all indicators and has an improved accuracy. In the accuracy evaluation of each city, with the exception of Fuzhou, the extraction results using the proposed method are more effective over the various accuracy evaluation indicators. The overall standard deviations of each evaluation indicator are also smaller than those of the mutation detection method. It can be seen from
Table 3 that the misclassification error and relative error for Fuzhou City are relatively large. Combined with the analysis of the true value for the urban boundary, it can be seen that the urban expansion of Fuzhou City is larger between 2010 and 2015. Thus, using the true value of the urban boundary from 2010 will result in certain errors for the evaluation of the nighttime light city image from 2012. Some areas in the true value have not been attributed as urban areas due to other factors, such as being far from the main city. However, the other cities are less affected by these phenomena.
Based on the Luojia1-01 data, the proposed method has an average relative error of 39%, average commission error of 44%, and average omission error of 23%, average overall classification accuracy of 93%, and average Kappa coefficient of 61%. In comparison, the mutation detection method has indicators that are increased by 77%, 9%, −2%, −7%, and −12%, respectively. Except for a slight drop in the omission error, the other indicators have higher precisions. The overall standard deviations for each evaluation indicator are smaller than those for the mutation detection method, indicating that the extraction results are more stable. In the accuracy evaluation of each city, the classification accuracy and Kappa coefficient using the proposed extraction method are higher than the corresponding results for the mutation detection method. In terms of the error evaluation, except for Shenyang and Nanjing, the omission error is slightly larger. The analysis shows that the mutation detection method has a large commission error in these two cities. The difference between these two errors is large, and the overall classification accuracy is low.
5. Discussion
There are some shortcomings regarding the proposed method, such as incomplete extraction of the urban “enclave” when using the DMSP/OLS data. The mutation detection method has a larger commission error, which makes the omission error of the proposed extraction method greater than that for the mutation detection method. The urban boundary extraction is based on the NPP-VIIRS data that was first released in 2012, while the true values used in this paper are from 2010, and some areas are impacted by the urban growth over this two-year discrepancy.
There are still additional problems that need to be solved in subsequent studies. First, there is some data that are difficult to collect, and it is difficult to implement comparative experiments and precision verifications in the strict sense. For example, the global images from the Luojia1-01 are difficult to obtain because the system was recently released, and there are differences in the image acquisition times for different regions. In addition, the true values of urban boundaries outside of China for verification experiments are difficult to obtain. Thus, obtaining these data and performing the urban boundary extraction at a global scale is the focus of future studies.
In addition, only the mutation detection method was selected in this work for the comparison experiment. This decision was made after making sufficient and scientific considerations. First, it is unfair to compare the traditional method of processing ordinary optical images with a method specifically designed for nighttime light imagery as there are completely different data features in both images. If the statistical comparison method is selected as a comparative experiment, the area in the statistical data will be compared with the true urban area of the text, which is unscientific since the concept of “urban” in these two data sets is different. In addition, it is unreasonable to compare the empirical threshold method with the proposed method because it is too subjective and its accuracy is difficult to guarantee. Therefore, we believe that only the mutation detection method is suitable as a comparative experiment.
Finally, there is no reference to the modifiable areal unit problem (MAUP). This is because the three datasets were not captured over the same period and have different resolutions. It is unscientific to discuss the scale effects of the MAUP caused by the size of the pixel. Thus, we only give a short qualitative evaluation instead of a more specific approach. Therefore, increasing the accuracy of the data to better compare the urban area extraction, setting multiple thresholds to solve the problem of loss based on the “enclave” in the DMSP/OLS data, including more cities in the training, and analysis of urban expansion changes combined with MAUP are areas of future work.
6. Conclusions
The nighttime light data for the DMSP/OLS, NPP-VIIRS and Luojia1-01 datasets are used to test the proposed urban extraction method. The high-precision urban boundary obtained from high-resolution imagery is used as the true value, and 15 cities are selected as the training samples to introduce and determine the Jaccard coefficients. The optimal threshold function for the urban boundary extraction using the three nighttime light datasets is determined through comparisons with the spatial data. Then, the high-precision urban boundary truth-values for the 13 cities are selected for testing, and the accuracy of the urban boundary extraction results obtained using the optimal threshold function and mutation detection method are evaluated and compared. The evaluation results show that the accuracy of the proposed method is better at extracting urban areas than the more conventional mutation detection method since it has good generalization capabilities.
The average relative errors for the extraction results based on the three nighttime light datasets (DMSP/OLS, NPP-VIIRS, and Luojia1-01) using the optimal threshold function are 29%, 20%, and 39%, respectively. Compared with mutation detection method, these represent reductions of 83%, 18%, and 77%, respectively. The average overall classification accuracies are 95%, 96%, and 93%, respectively, which are 5%, 1%, and 7% higher than the mutation detection method. The average Kappa coefficients are 61%, 71%, and 61%, respectively, which are 5%, 4%, and 12% higher than the mutation detection method.


