Article

Heat and Drought Stress Advanced Global Wheat Harvest Timing from 1981–2014

Institute of Remote Sensing and Geographic Information System, School of Earth and Space Sciences, Peking University, Beijing 100871, China
*
Author to whom correspondence should be addressed.
Remote Sens. 2019, 11(8), 971; https://doi.org/10.3390/rs11080971
Submission received: 10 March 2019 / Revised: 11 April 2019 / Accepted: 20 April 2019 / Published: 23 April 2019
(This article belongs to the Special Issue Monitoring Vegetation Phenology: Trends and Anomalies)

Abstract

:
Studying wheat phenology can greatly enhance our understanding of how wheat growth responds to climate change, and guide us to reasonably confront its influence. However, comprehensive global-scale wheat phenology–climate analysis is still lacking. In this study, we extracted the wheat harvest date (WHD) from 1981–2014 from satellite data using threshold-, logistic-, and shape-based methods. Then, we analyzed the effects of heat and drought stress on WHD based on gridded daily temperature and monthly drought data (the Palmer drought severity index (PDSI) and the standardized precipitation evapotranspiration index (SPEI)) over global wheat-growing areas. The results show that WHD was generally delayed from the low to mid latitudes. With respect to variation trends, we detected a significant advancement of WHD in 32.1% of the world’s wheat-growing areas since 1981, with an average changing rate of −0.25 days/yr. A significant negative correlation was identified between WHD and the prior three months’ normal-growing-degree-days across 50.4% of the study region, which implies that greater preseason effective temperature accumulation may cause WHD to occur earlier. Meanwhile, WHD was also found to be significantly and negatively correlated with the prior three months’ extreme-growing-degree-days across only 9.6% of the study region (mainly located in northern South Asia and north Central-West Asia). The effects of extreme heat stress were weaker than those of normal thermal conditions. When extreme drought (measured by PDSI/SPEI) occurred in the current month, in the month prior to WHD, and in the second month prior to WHD, it forced WHD to advance by about 9.0/8.1 days, 13.8/12.2 days, and 10.8/5.3 days compared to normal conditions, respectively. In conclusion, we highlight the effects that heat and drought stress have on advancing wheat harvest timing, which should be a research focus under future climate change.

1. Introduction

Vegetation phenology has attracted a lot of attention in the face of global climate change over the past several decades. Due to strong dependence on climate conditions, vegetation phenology dynamics are an effective tool to assess the magnitude of regional and global climate change [1,2,3]. Meanwhile, vegetation phenology spatiotemporal variability determines, to some extent, the terrestrial carbon budget and ecosystem productivity, and even impacts local climate [3,4]. Therefore, studying vegetation phenology can enhance our knowledge of how vegetation growth responds to climate change and how to confront the influence of global change. However, most studies have focused on the phenological variability of natural vegetation and only a few have investigated the phenological changes of agricultural plants [5,6,7,8].
Given that wheat is the most widely grown crop in the world, changes in its phenology could greatly affect regional land surface material and energy exchange, as well as yields [9,10]. Using long-term monitoring, many studies have detected a significant advance in wheat phenology events (such as the timing of shooting, heading, and yellow ripeness) over the past several decades in Germany [11], the U.S. Great Plains [6], and China [8,12,13], with rates of change from 0.1 days/yr to 0.31 days/yr. All of these shifts were primarily attributed to the significant increase in average preseason or seasonal temperatures. Remote sensing data provide an excellent opportunity to study the spatiotemporal patterns of wheat phenology at regional and global scales [14,15]. Using Moderate Resolution Imaging Spectroradiometer (MODIS) data from 2000–2009, Lobell et al. [14] found that extremely high temperatures (>34 °C) contributed more to the advancement of wheat senescence timing than average temperature increases in India. In addition to air temperature, water supply also impacts wheat growth by altering photosynthesis, photochemical activities, and enzyme activities [16,17]. However, the role of water conditions on wheat growth is still debated. Through statistical analysis and controlled experiments, some studies have found that increased precipitation or irrigation can slow wheat development and lengthen the growing period [14,18], while another study found that precipitation had no significant effects on wheat heading and flowering dates [6]. Therefore, studying the impacts of heat and moisture stress on wheat phenology is of crucial importance to wheat production and variety breeding.
Additionally, most studies on wheat phenology have focused on specific sites or covered a small regional scale. Global-scale wheat phenology–climate analysis is still lacking. In the current study, we used three methods to extract wheat harvest date (WHD) from satellite data covering 1981–2014 over global wheat-growing areas. Then we analyzed the effects of heat and drought stress on WHD and evaluated spatial differences at the global scale using gridded temperature and drought data. The goals of this study were to (1) evaluate the impacts of normal-growing-degree-days and extreme-growing-degree-days on WHD, and (2) assess how WHD responds to drought stress.

2. Materials and Methods

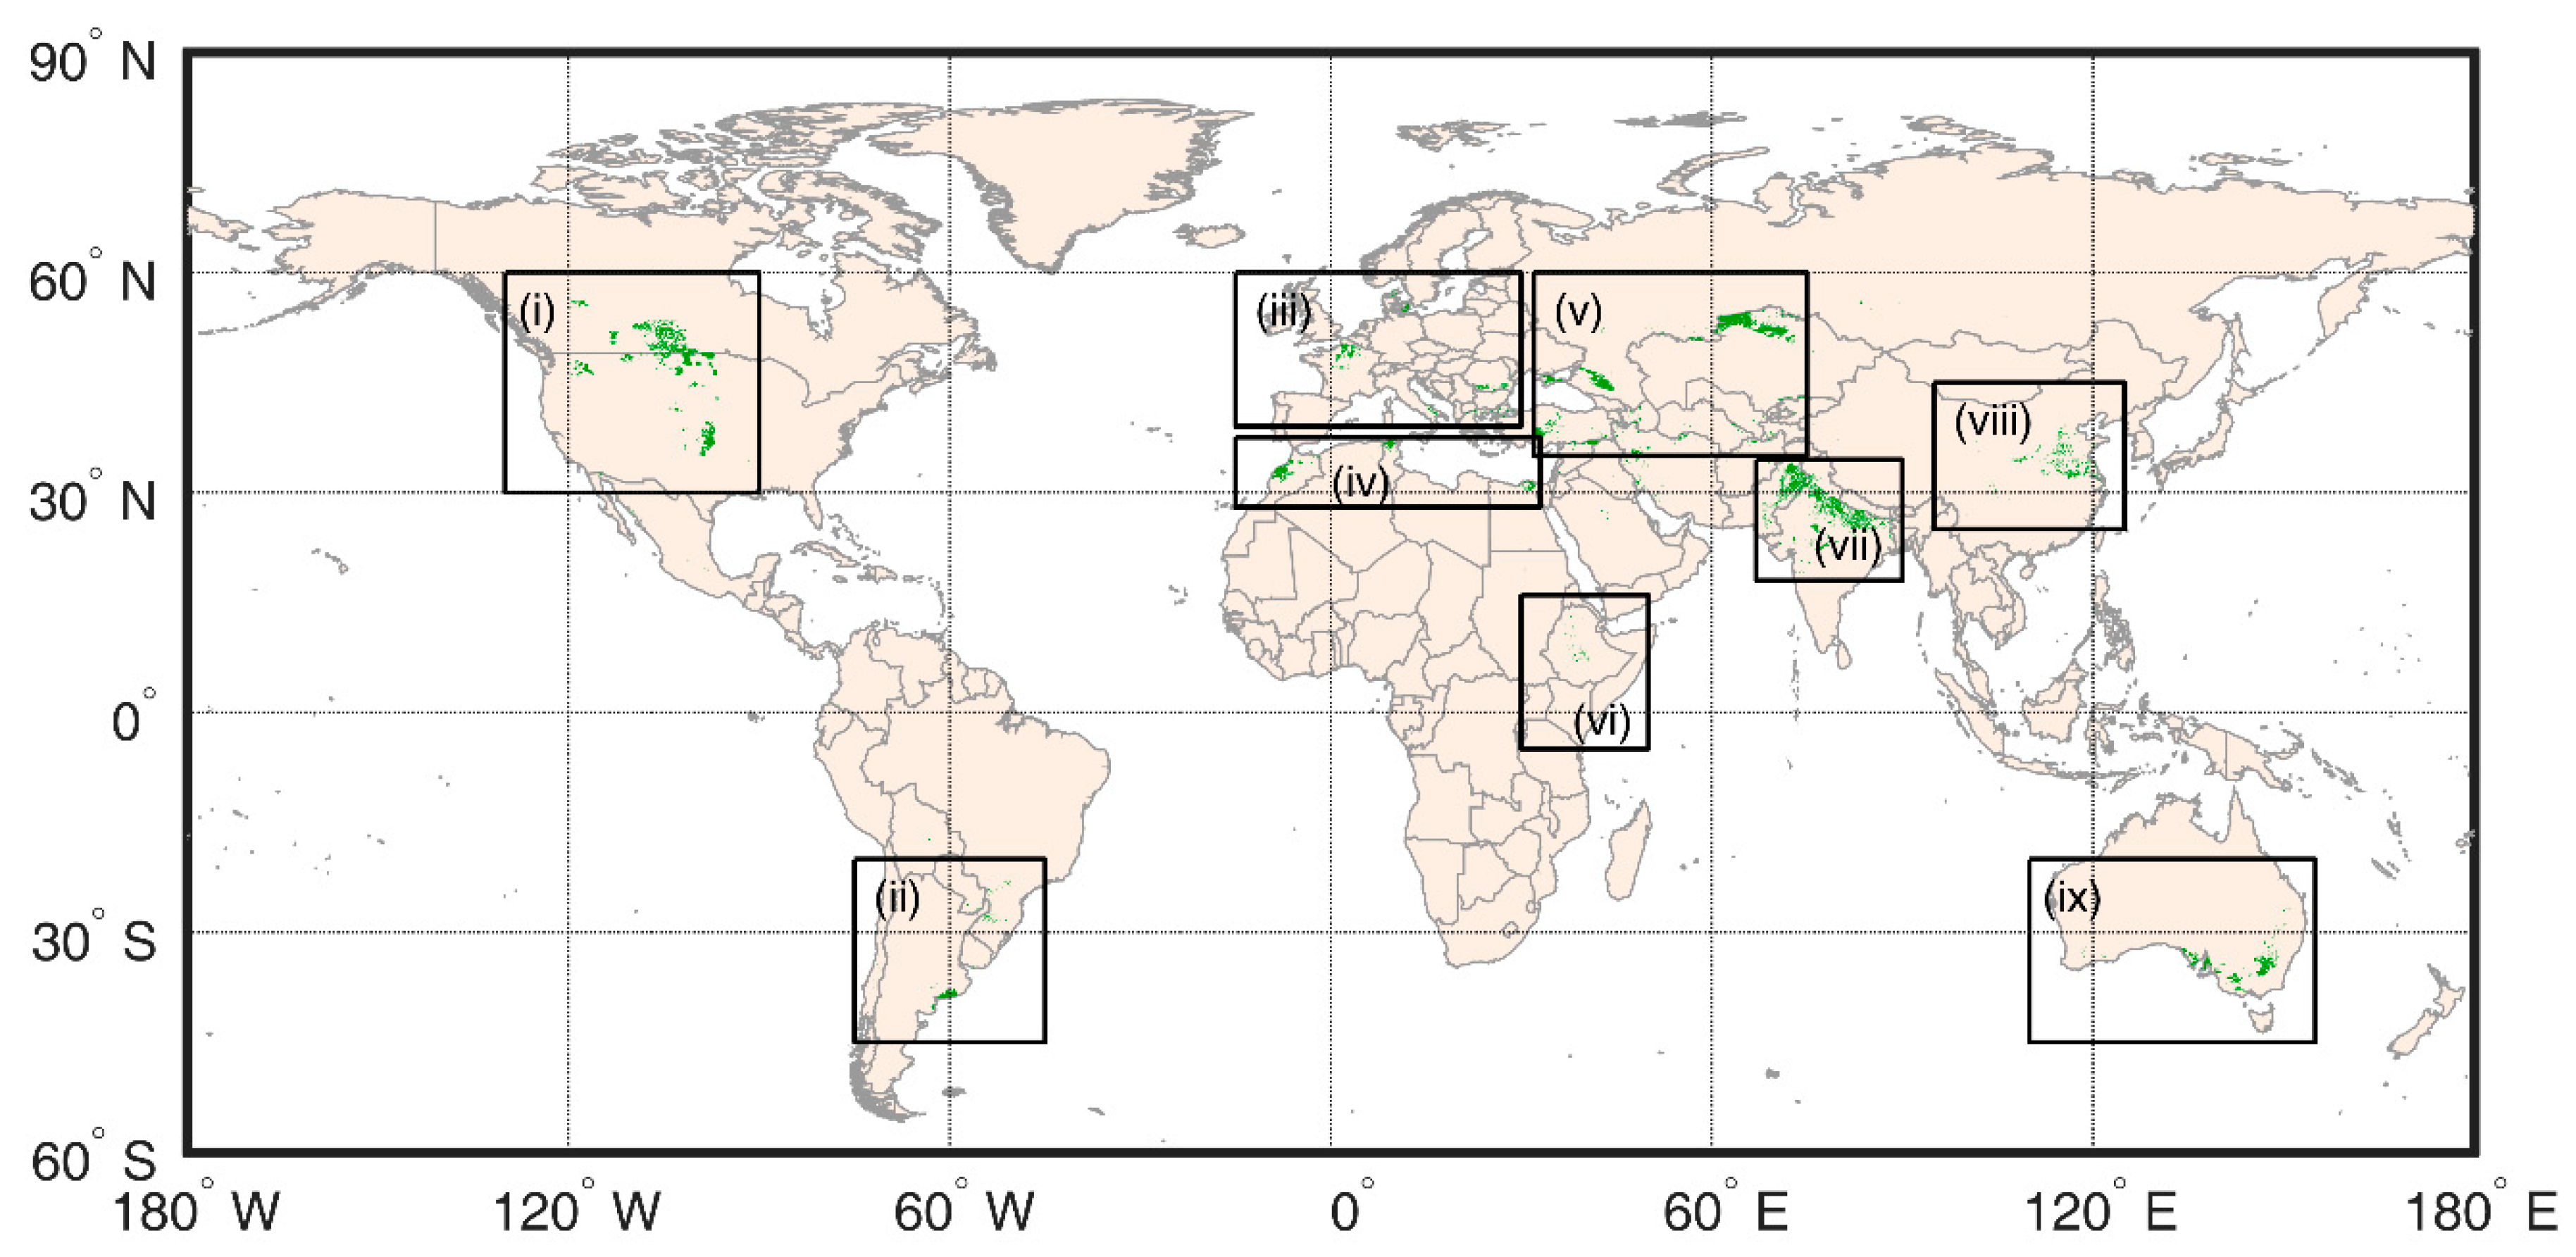
2.1. Global Wheat Planting Map

In the present study, global wheat distribution was identified using the spatial production allocation model 2005 (SPAM2005, http://mapspam.info/global-data), which was released by the International Food Policy Research Institute [19]. The SPAM2005 relies on a collection of spatially explicit input data covering three years around 2005, including crop production statistics, cropland data, biophysical crop “suitability” assessments, population density, and any prior knowledge about the spatial distribution of specific crops or crop systems. The spatial resolution is 5 arc minutes (0.083°, ~10 km). To reduce the effects of other crops and natural vegetation types as much as possible, we only focused on grids containing greater than 30% wheat. This wheat-planting extent was used for all years. Here, we assume there is no change in wheat-planting area during 1981–2014. In addition, to clarify the spatial differences in wheat phonological response to climate change, we divided the study into nine major wheat-planting regions, i.e., North America, South America, Europe, North Africa, Central-West Asia, East Africa, South Asia, China, and Australia (Figure 1).

2.2. Remote Sensing Data and Processing

We estimated WHD from two-band enhanced vegetation index data (EVI2, 1981–2014), released by the University of Arizona Vegetation Index & Phenology Laboratory (https://vip.arizona.edu/viplab_data_explorer.php). The data combine Advanced Very High Resolution Radiometer (AVHRR, 1981–1999) and MODIS (2000–2014) datasets by standardizing AVHRR to the same level of MODIS [20]. This product has a spatial resolution of 0.05° and a temporal resolution of 7 days.
We first chronologically joined the EVI2 time series across all years and removed poor-quality EVI2 observations (contaminated by cloud, snow, and ice, or affected by the viewing geometry (solar zenith angle >75°)) for each pixel based on the associated quality data. If the poor-quality EVI2 observations accounted for more than 30% of the total annual observations, the data from that year were discarded. Next, we smoothed the EVI2 time series and interpolated it to daily resolution using a cubic smooth spline function, which could simulate the continuous growth process of plants and create a curve with high smoothness. Using the growing calendar for global wheat summarized by the United States Department of Agriculture [21], the corresponding EVI2 wheat profile was further truncated from the full-year EVI2 time series. To eliminate the effects of other land cover types that experience small seasonal changes, we removed pixels with a multiyear average EVI2 seasonal amplitude time series less than 0.1. Finally, three methods, i.e., threshold-, logistic-, and shape-based methods, were used to estimate WHD from the wheat EVI2 time series for each pixel, respectively.
(1) Threshold-based method. This method defined the WHD as the time point corresponding to 20% of the wheat EVI2 time series amplitude each year, which has been widely used to estimate phenological parameters from remote sensing data [14,15,22].
(2) Logistic-based method. A double logistic function (Equation (1)) was used to fit the annual wheat EVI2 time series and calculate WHD (Equation (2)) based on the maximum curvatures of the fitted curve:
E V I 2 ( t ) = b a s e + f r a n g e 1 + e m S ( S t ) s r a n g e 1 + e m A ( A t )
W H D = A ln ( 2 3 ) m A
where base denotes the annual minimum EVI2 value; frange represents the range from spring minimum EVI2 to annual maximum EVI2; srange represents the range from autumn minimum EVI2 to annual maximum EVI2; mS and mA are the maximum slope values of the fitted curve in spring and autumn, respectively; S and A are the corresponding dates of mS and mA, respectively. The logistic-based method has been used extensively to retrieve vegetation phenology from remote sensing data and has had better performance in monitoring phenology for different land cover types [23,24,25,26].
(3) Shape-based method. This method assumes that the shape of the vegetation index (VI) growth curve (named “shape” curve) is relatively stable for a specific crop in a given location [27], which was defined as the multiyear mean EVI2 time series in this study. Geometric scaling differences exist between the annual VI curves and the shape curve due to local weather conditions and management types. The shifted shape curve for each year was obtained by fitting the annual EVI2 time series f(x) to the shape curve h(x) (Equation (3)):
f ( x ) = x s c a l e × h ( x + t s h i f t ) + y s c a l e
where x is the day of year; xscale, tshift, and yscale are scaling parameters that were determined based on the smallest root mean square error (RMSE, Equation (4)) between the shifted shape curve and the raw EVI2 time series for each year using the Markov chain Monte Carlo method.
R M S E = i = 1 n ( P E V I 2 R E V I 2 ) 2 n
where, PEVI2 is the estimated EVI2 value from Equation (1); REVI2 is the observed EVI2 value; n is the number of observations. A predefined WHD was extracted from the shape curve using the threshold-based method. Annual WHD values were then acquired by entering the estimated parameters and the predefined WHD into Equation (3).
For the logistic-based and shape-based methods, we also computed the goodness-of-fit (R2) and RMSE between the fitted and the raw EVI2 values. To ensure the accuracy of the results, estimated WHD values were discarded if R2 was less than 0.8, or if RMSE was greater than 0.05.

2.3. Climate Data

Daily mean air temperatures (1981–2014) from the gridded WATCH-Forcing-Data-ERA-Interim (WFDEI) dataset (http://www.eu-watch.org) were provided by the European Union Water and Global Change (WATCH) project [28], and were used to analyze the thermal impacts on temporal WHD patterns. The dataset has a spatial resolution of 0.5°. When comparing with 2 m temperature observed with flux tower, the average error of WFDEI air temperature is about 0.79°C. It has been previously used by Stacke and Hagemann [29] to drive the Max Planck Institute-Hydrology Model for global wetland mapping.

2.4. Drought Data

Two gridded drought index products, the Palmer drought severity index (PDSI) and the standardized precipitation evapotranspiration index (SPEI), were selected to study the effects of drought stress on global WHD. The PDSI was originally designed by Palmer [30] to characterize drought conditions of the United States and further developed by Wells et al. [31] to make it suitable for worldwide drought monitoring through self-calibration based on local conditions. The PDSI value is derived by a physical water-balance model, which uses both precipitation and air temperature at 2 m as inputs and considers preceding conditions. The PDSI data product used in this study was acquired from the Climatic Research Unit (CRU, https://crudata.uea.ac.uk/cru/data/drought/) and driven by the CRU TS3.26 monthly climate dataset [31,32].
SPEI is also extensively used for global drought monitoring but has the advantage of being multiscalar (1−48 months) over PDSI (9−12 months) [33]. It is based on monthly precipitation and potential evapotranspiration from the CRU TS 3.23 dataset. In this study, three-month SPEI data were downloaded from the Global SPEI database (https://digital.csic.es/handle/10261/153475). Both PDSI and SPEI have a spatial resolution of 0.5° × 0.5° and a temporal resolution of 1 month. According to PDSI and SPEI, drought was divided into five levels: near normal (NN), mild drought (MID), moderate drought (MOD), severe drought (SD), and extreme drought (ED) (Table 1) [34].

2.5. Analysis

Estimated WHD values from the three methods were first compared and averaged for each pixel. To match the spatial resolution of the climate data, WHD (0.05° × 0.05°) values were then resampled up to 0.5° × 0.5° by averaging all the records within a given climate grid. To explore the effects of normal and extreme thermal conditions on WHD, we calculated the normal-growing-degree-days (NDD, Equation (5)) and the extreme-growing-degree-days (EDD, Equation (6)) within 90 days prior to the WHD based on daily mean air temperatures for each climate grid. Considering the uncertainties of maximum temperature threshold for wheat growth [35] and such a large spatial range, we took 30 °C as the threshold to distinguish NDD and EDD.
N D D = W H D 90 W H D N ,   N = { 0 T < 0 T 0 T 30 30 T > 30
E D D = W H D 90 W H D E ,   E = { 0 T 30 T 30 T > 30
where T is daily air temperature. Pearson’s correlation coefficients were calculated for WHD and NDD and WHD and EDD at each grid.
To assess the impacts of drought conditions on wheat harvest, we first grouped WHD values according to drought levels for the current month, the previous month before WHD, and the second month prior to WHD in various years at each grid. WHD values at the same drought level were then averaged. Finally, WHDs were compared among different drought levels across the whole study region. In addition, long-term trends of WHD, NDD, EDD, PDSI, and SPEI were obtained using a Theil–Sen estimator, which selects the median of the slopes of all lines through pairs of two-dimensional sample points [36,37]. The Theil–Sen estimator is a robust method for detecting temporal series trends and is not affected by extreme outliers. The nonparametric Mann–Kendall test was then used to conduct significance testing for phenological trends at the level of 0.05.

3. Results

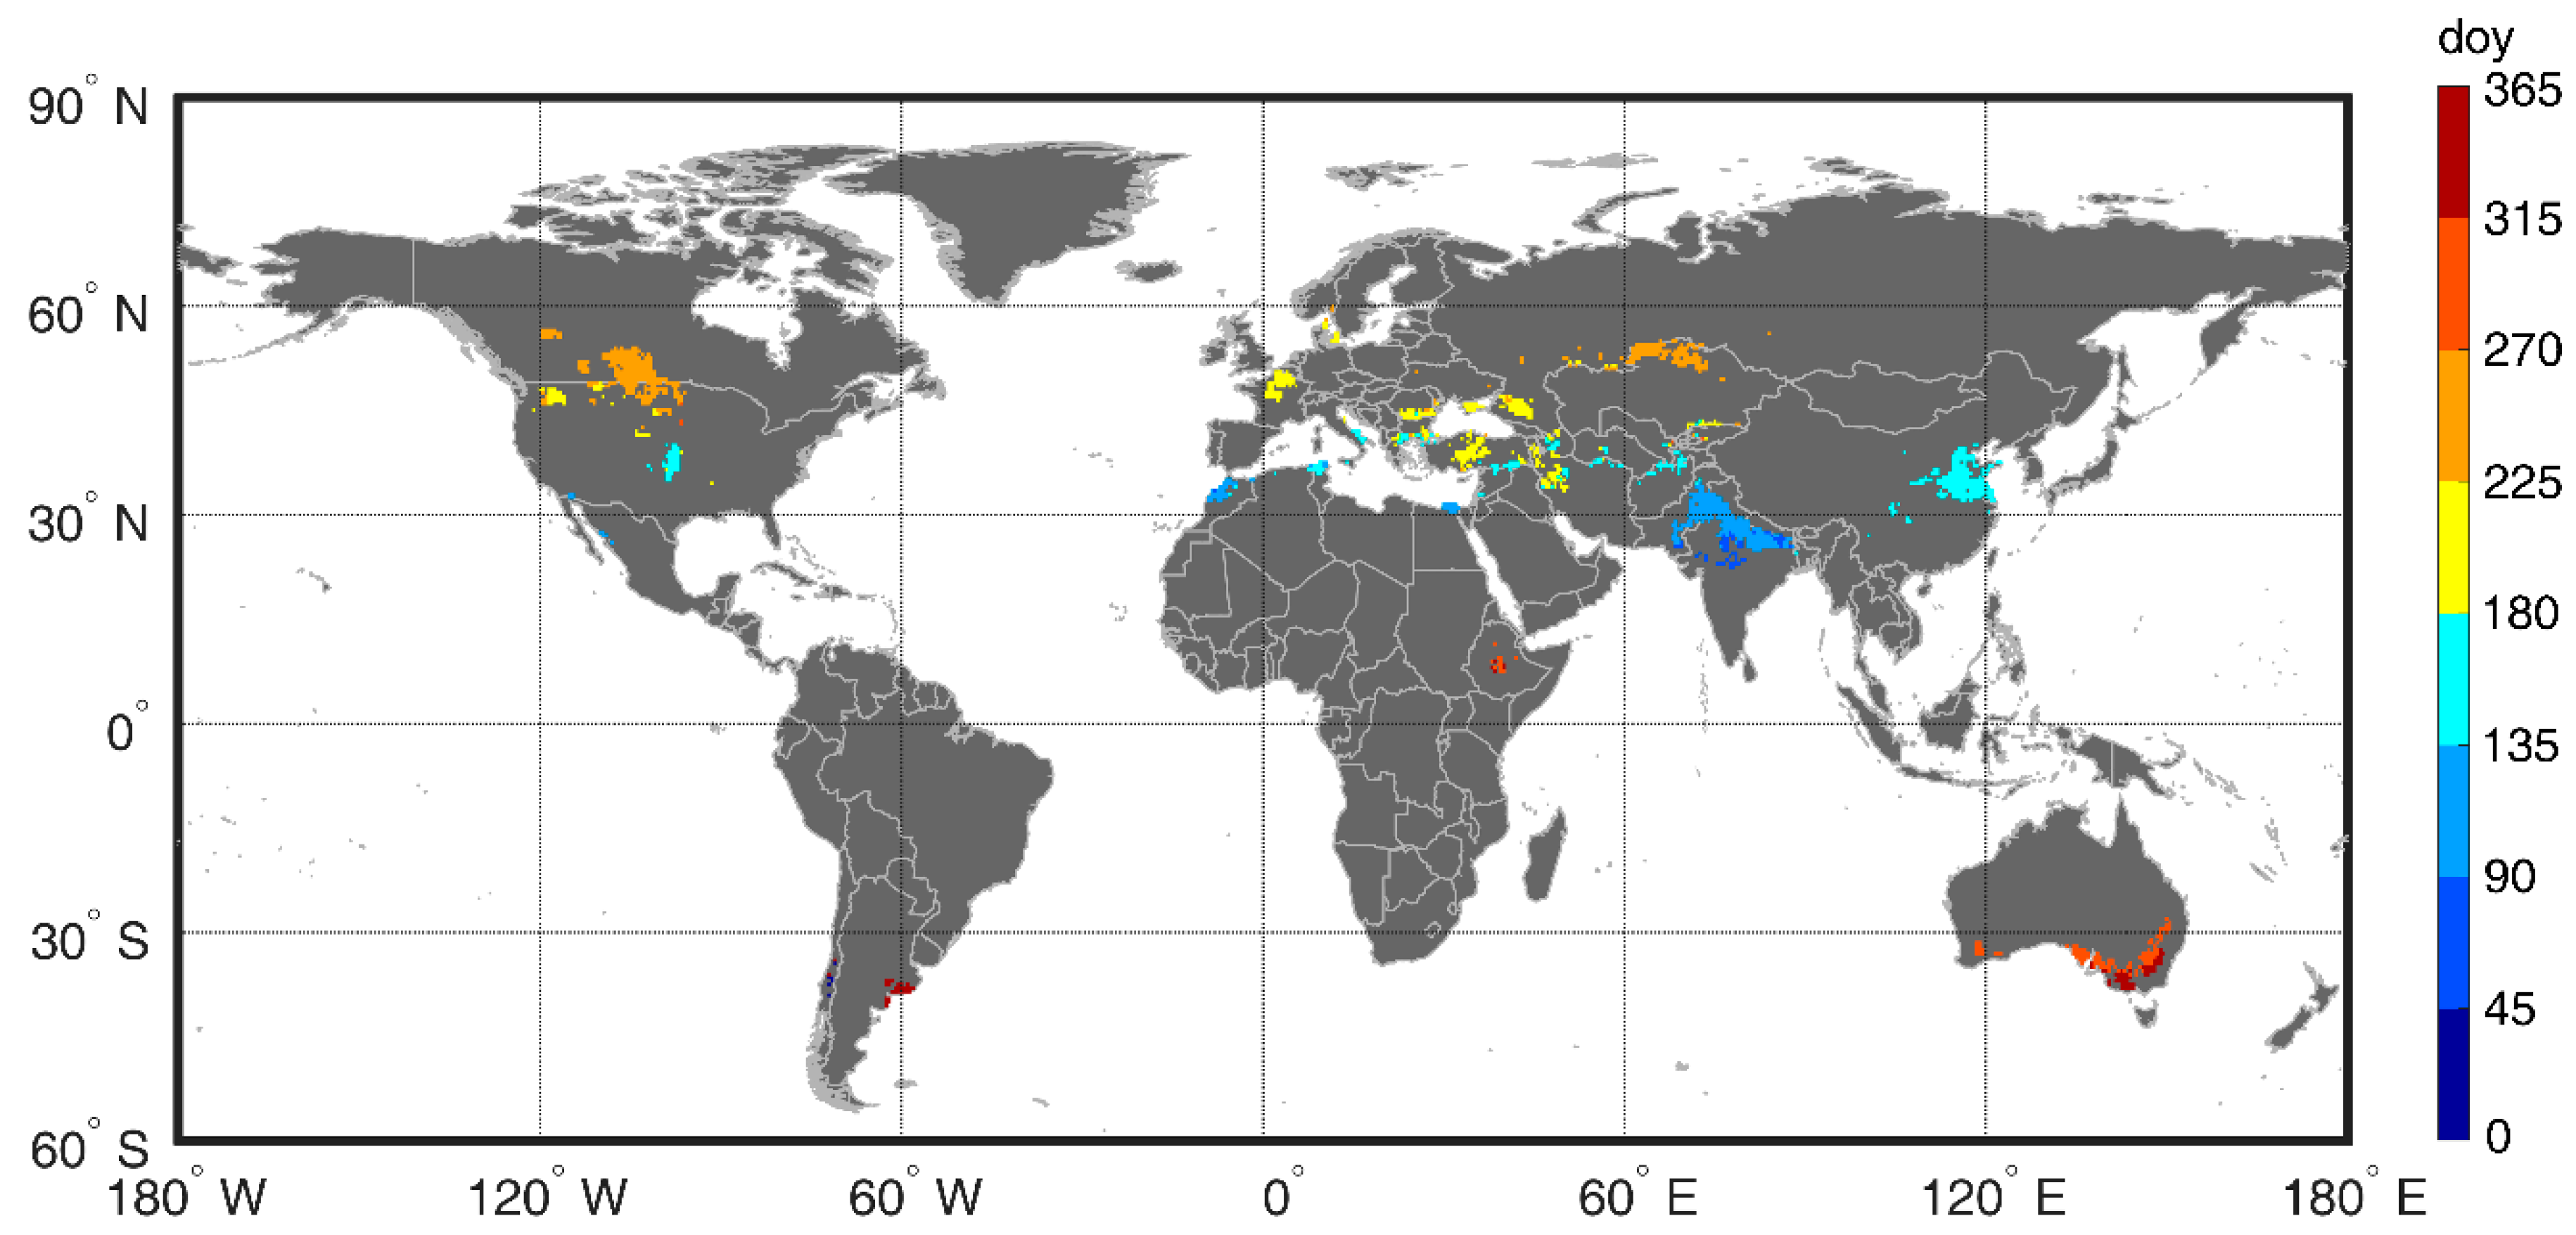
3.1. Spatial Pattern of WHD

The results show that WHD values calculated using the logistic-based method occurred slightly earlier by an average of 6.0 days than those derived by the threshold-based method, while WHD values from the shape-based method occurred slightly later by about 6.5 days than those from the threshold-based method. Spatially, WHDs estimated by all three methods were generally delayed from the low to mid latitudes (Figure S1a–c). By averaging WHD values from the three methods over all the years in each grid, we found that except for Chile, where wheat is harvested in late December or early January, the earliest WHD values occurred primarily in southern South Asia (from late February to March) (Figure 2). In northern South Asia, as well as Egypt and Morocco in North Africa, farmers usually harvest wheat from April to mid-May. In China, West Asia, Europe, as well as southern Central Asia and North America, wheat normally matures from mid-May to mid-August. For the northernmost wheat-growing areas in Canada, Russia, and Kazakhstan, wheat is usually harvested in late August and September. By comparison, WHD in Ethiopia and the Southern Hemisphere generally range from October to the end of the year.

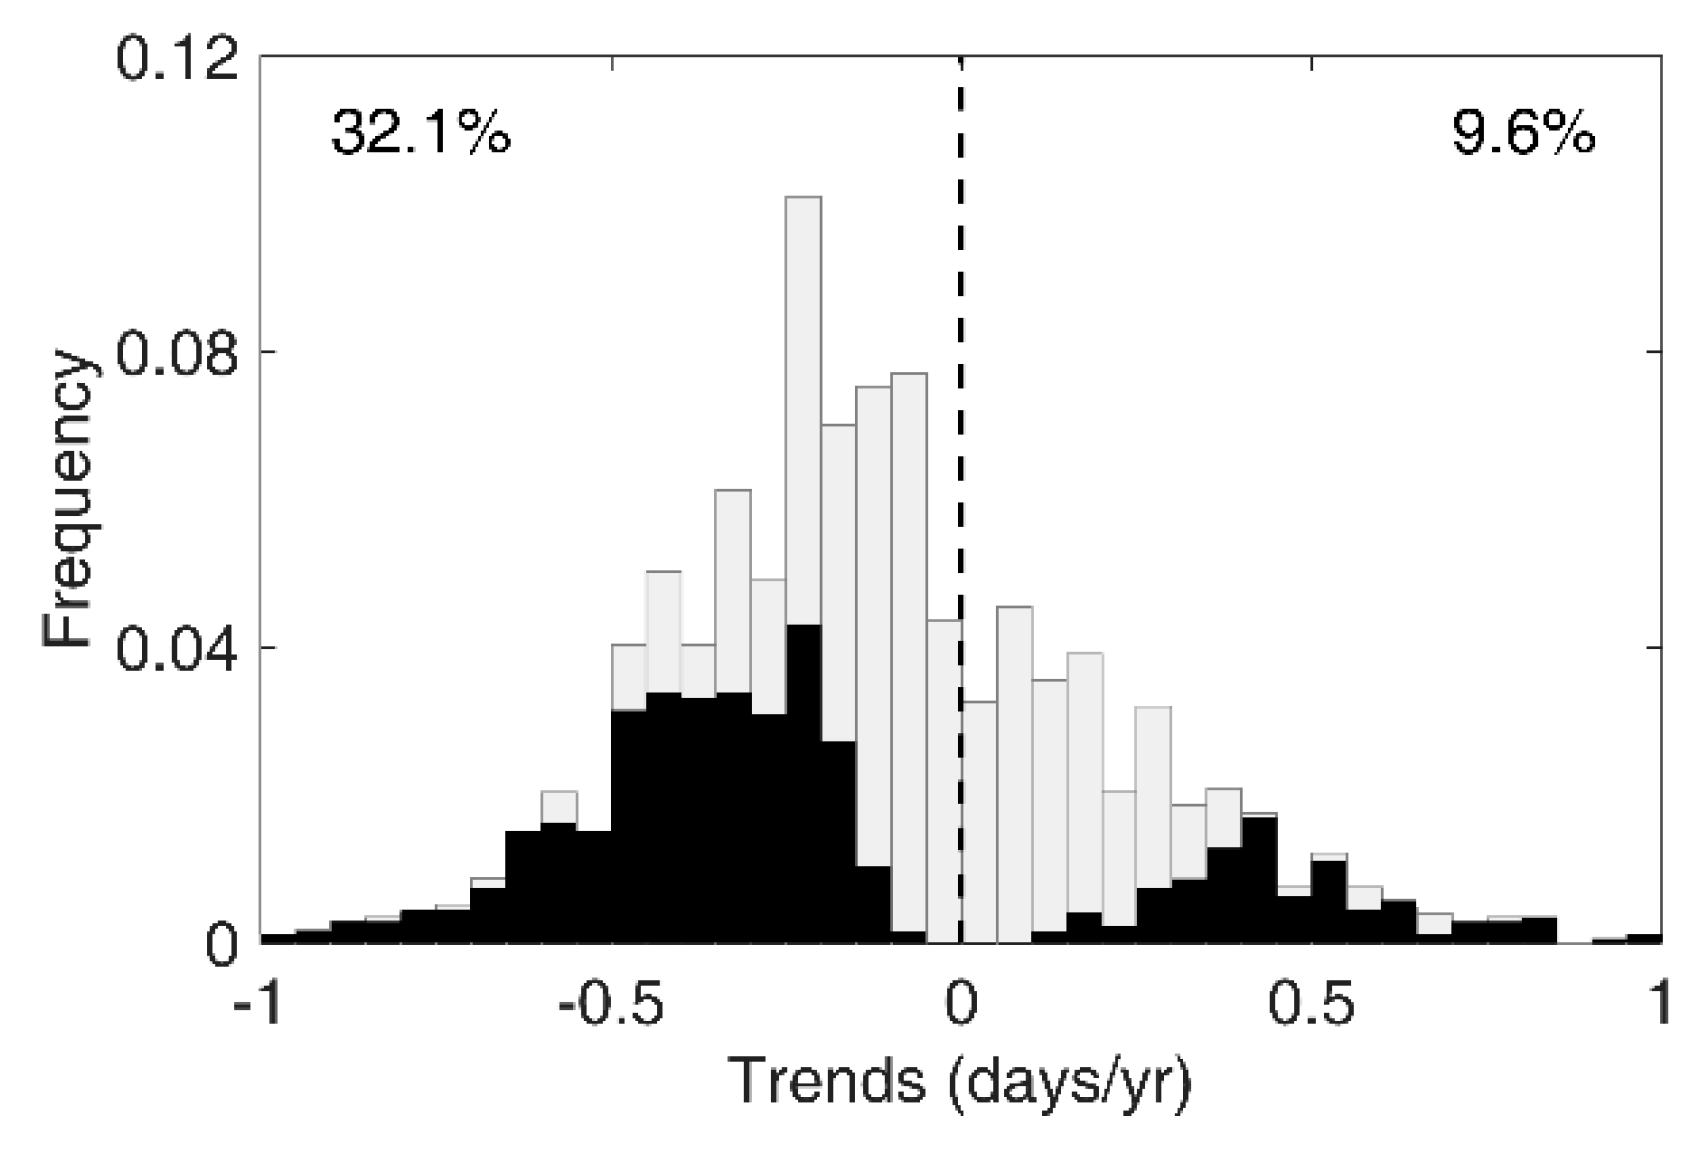
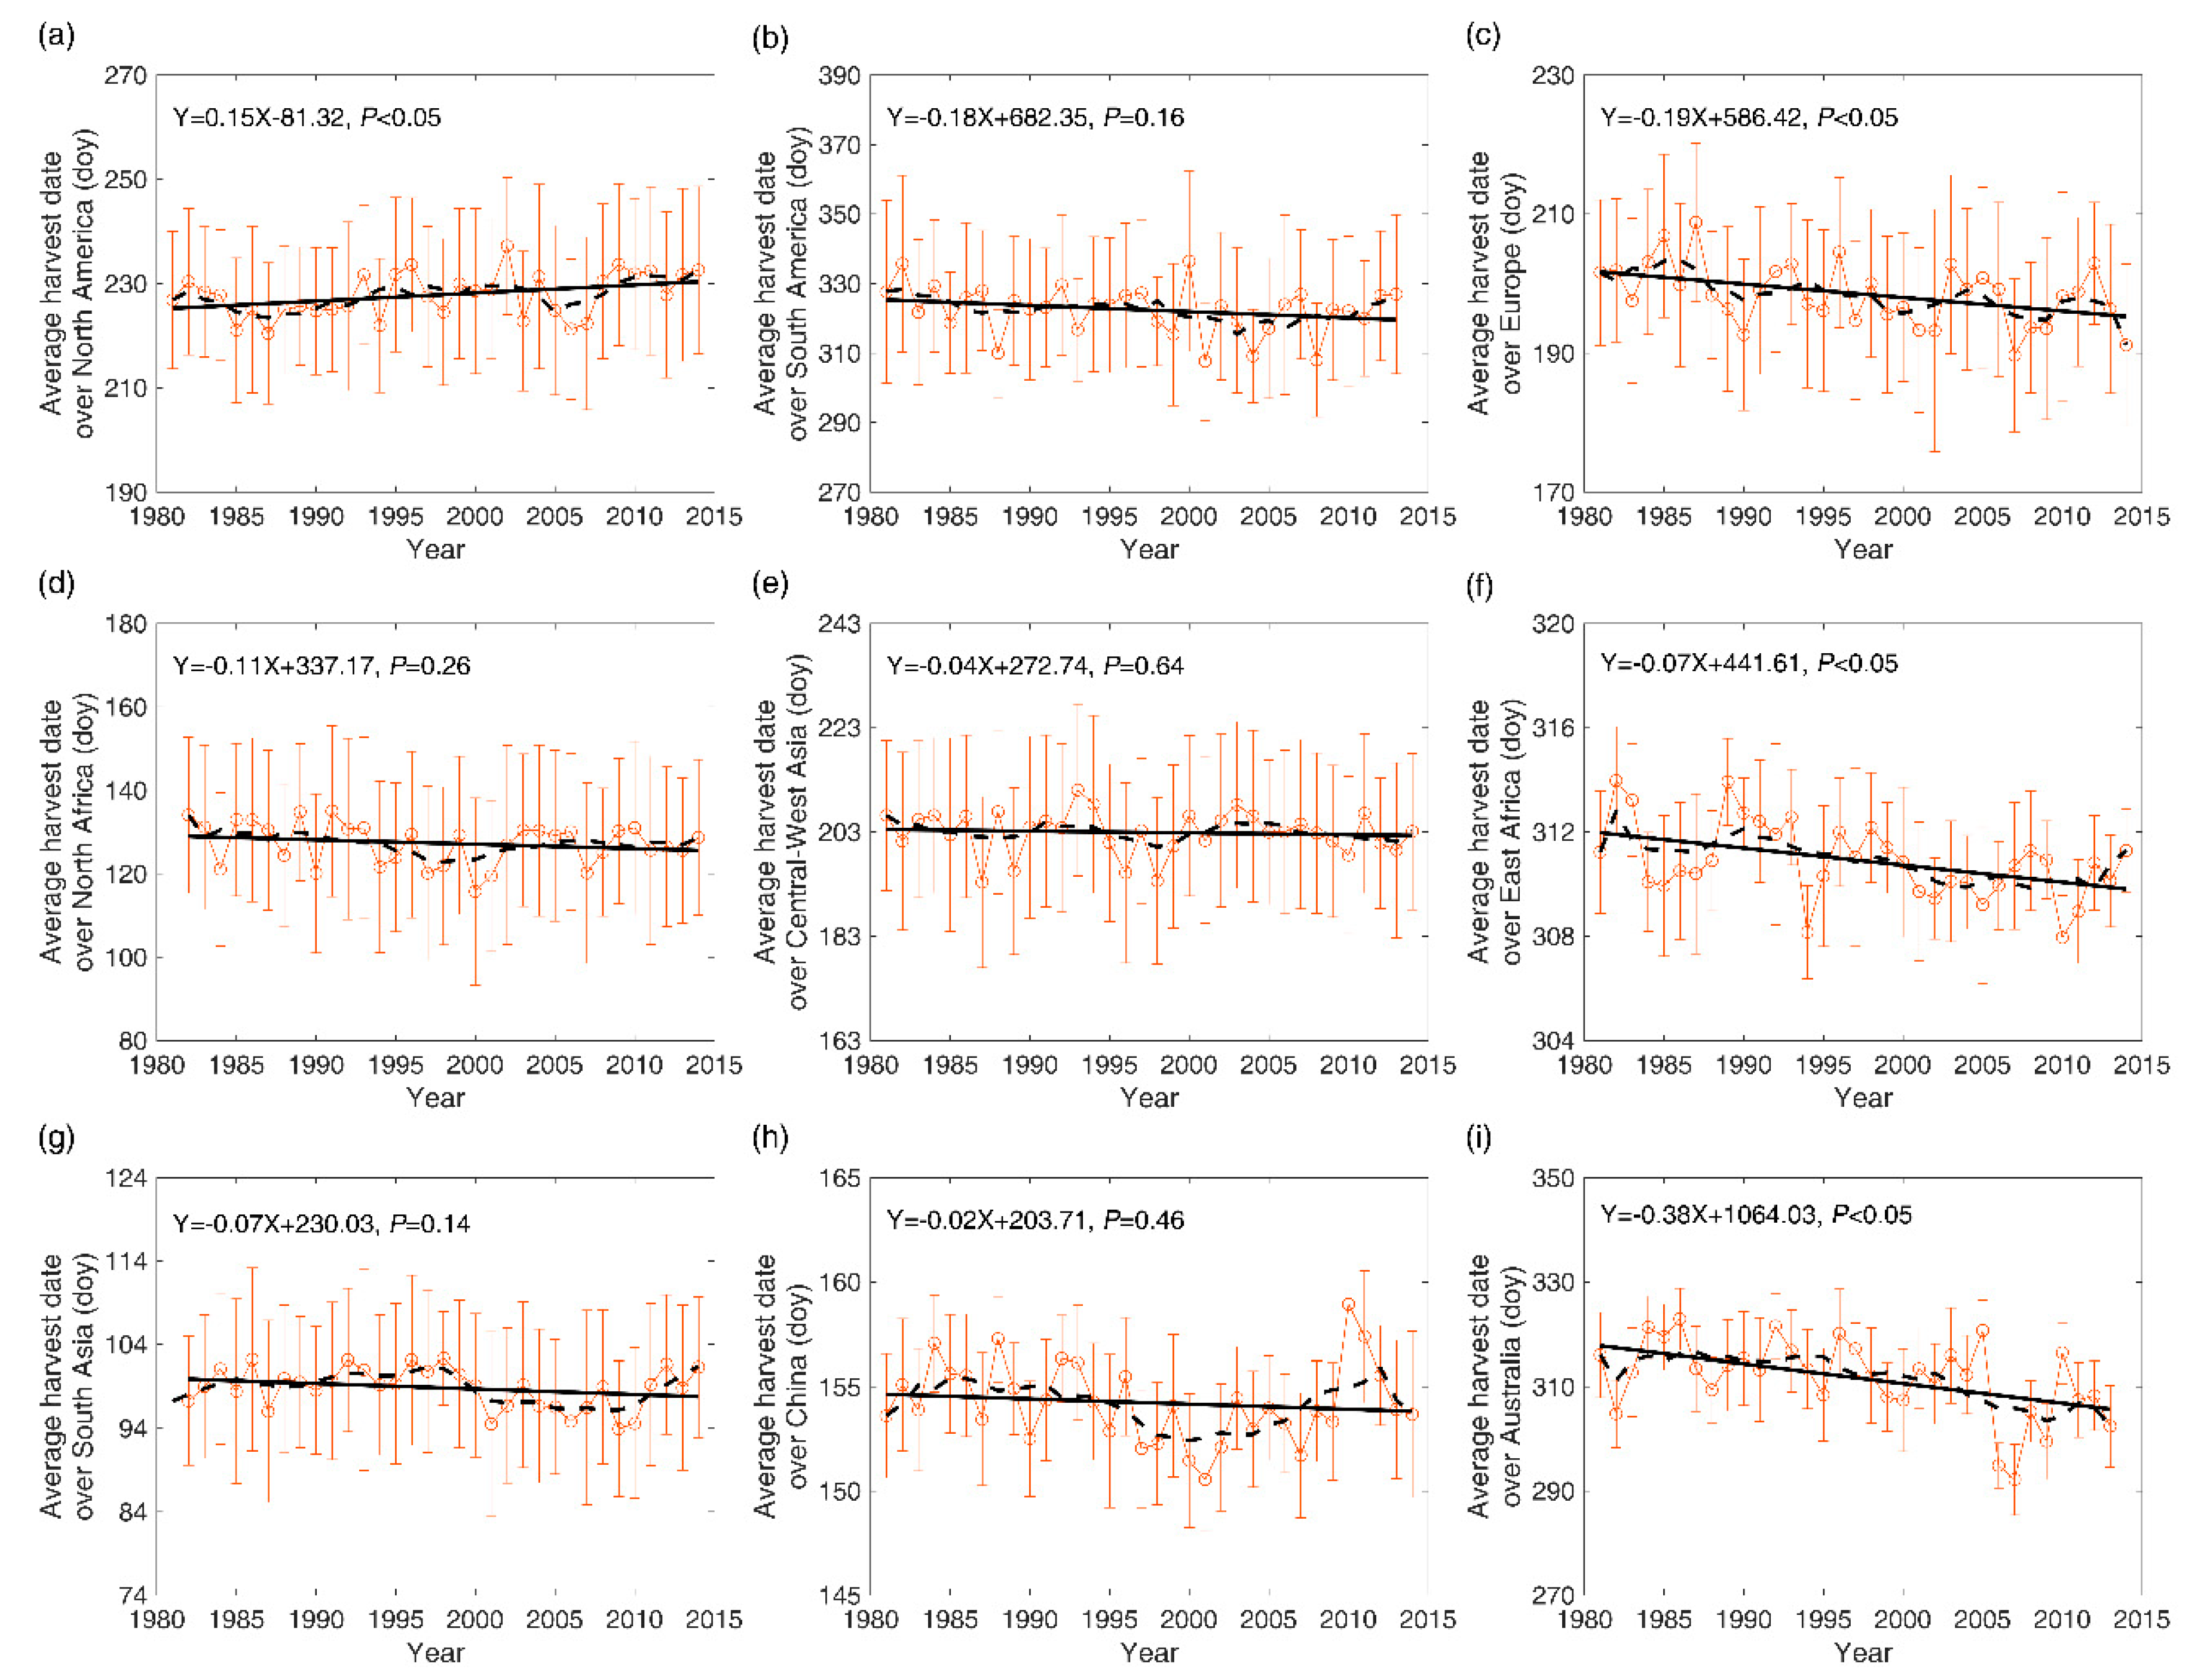
3.2. Variation Trends in WHD and Climate

At the pixel scale, a significant advancement in WHD was detected in 32.1% of the world’s wheat-growing areas since 1981, with an average rate of change of −0.25 days/yr (Figure 3). However, the direction and magnitude of WHD variability were different across the nine wheat-growing areas. During the past 34 years, WHD was significantly delayed in North America (0.15 days/yr), but significantly advanced in Europe, East Africa, and Australia by 6.5, 2.4, and 12.9 days, respectively (Figure 4). For China, a shift in WHD variability occurred around 2000, namely, gradually advancing between 1985 to 2000 and becoming delayed after 2000.
With regard to variation trend in climate, a declined NDD was found in central North America (Figure S2a), while NDD had significantly increased during 1981–2014 in most of the eight other wheat-planting areas, especially in Eurasian wheat-planting areas (Figure S2a). Meanwhile, drought had aggravated from 1981 to 2014 in West Asia, central India, and Australia (Figure S2c,d). Extreme high temperature events characterized by EDD were more frequent from 1981 to 2014 in northern South Asia and southern Central-West Asia (Figure S2b).

3.3. Interannual WHD Fluctuation in Relation to Thermal Conditions

A significant negative correlation was identified between WHD and the prior three months’ NDD in 50.4% of the study region, which means greater preharvest effective temperature accumulation would cause WHD to appear earlier. The stronger sensitivity of WHD to NDD was primarily detected in South Asia, Central-West Asia, Europe, and Australia (Figure 5a). Meanwhile, WHD was also significantly and negatively correlated with the prior three months’ EDD in 9.6% of the study region (mainly northern South Asia and northern Central-West Asia) (Figure 5b). In other words, higher preharvest EDD values led to earlier WHD.

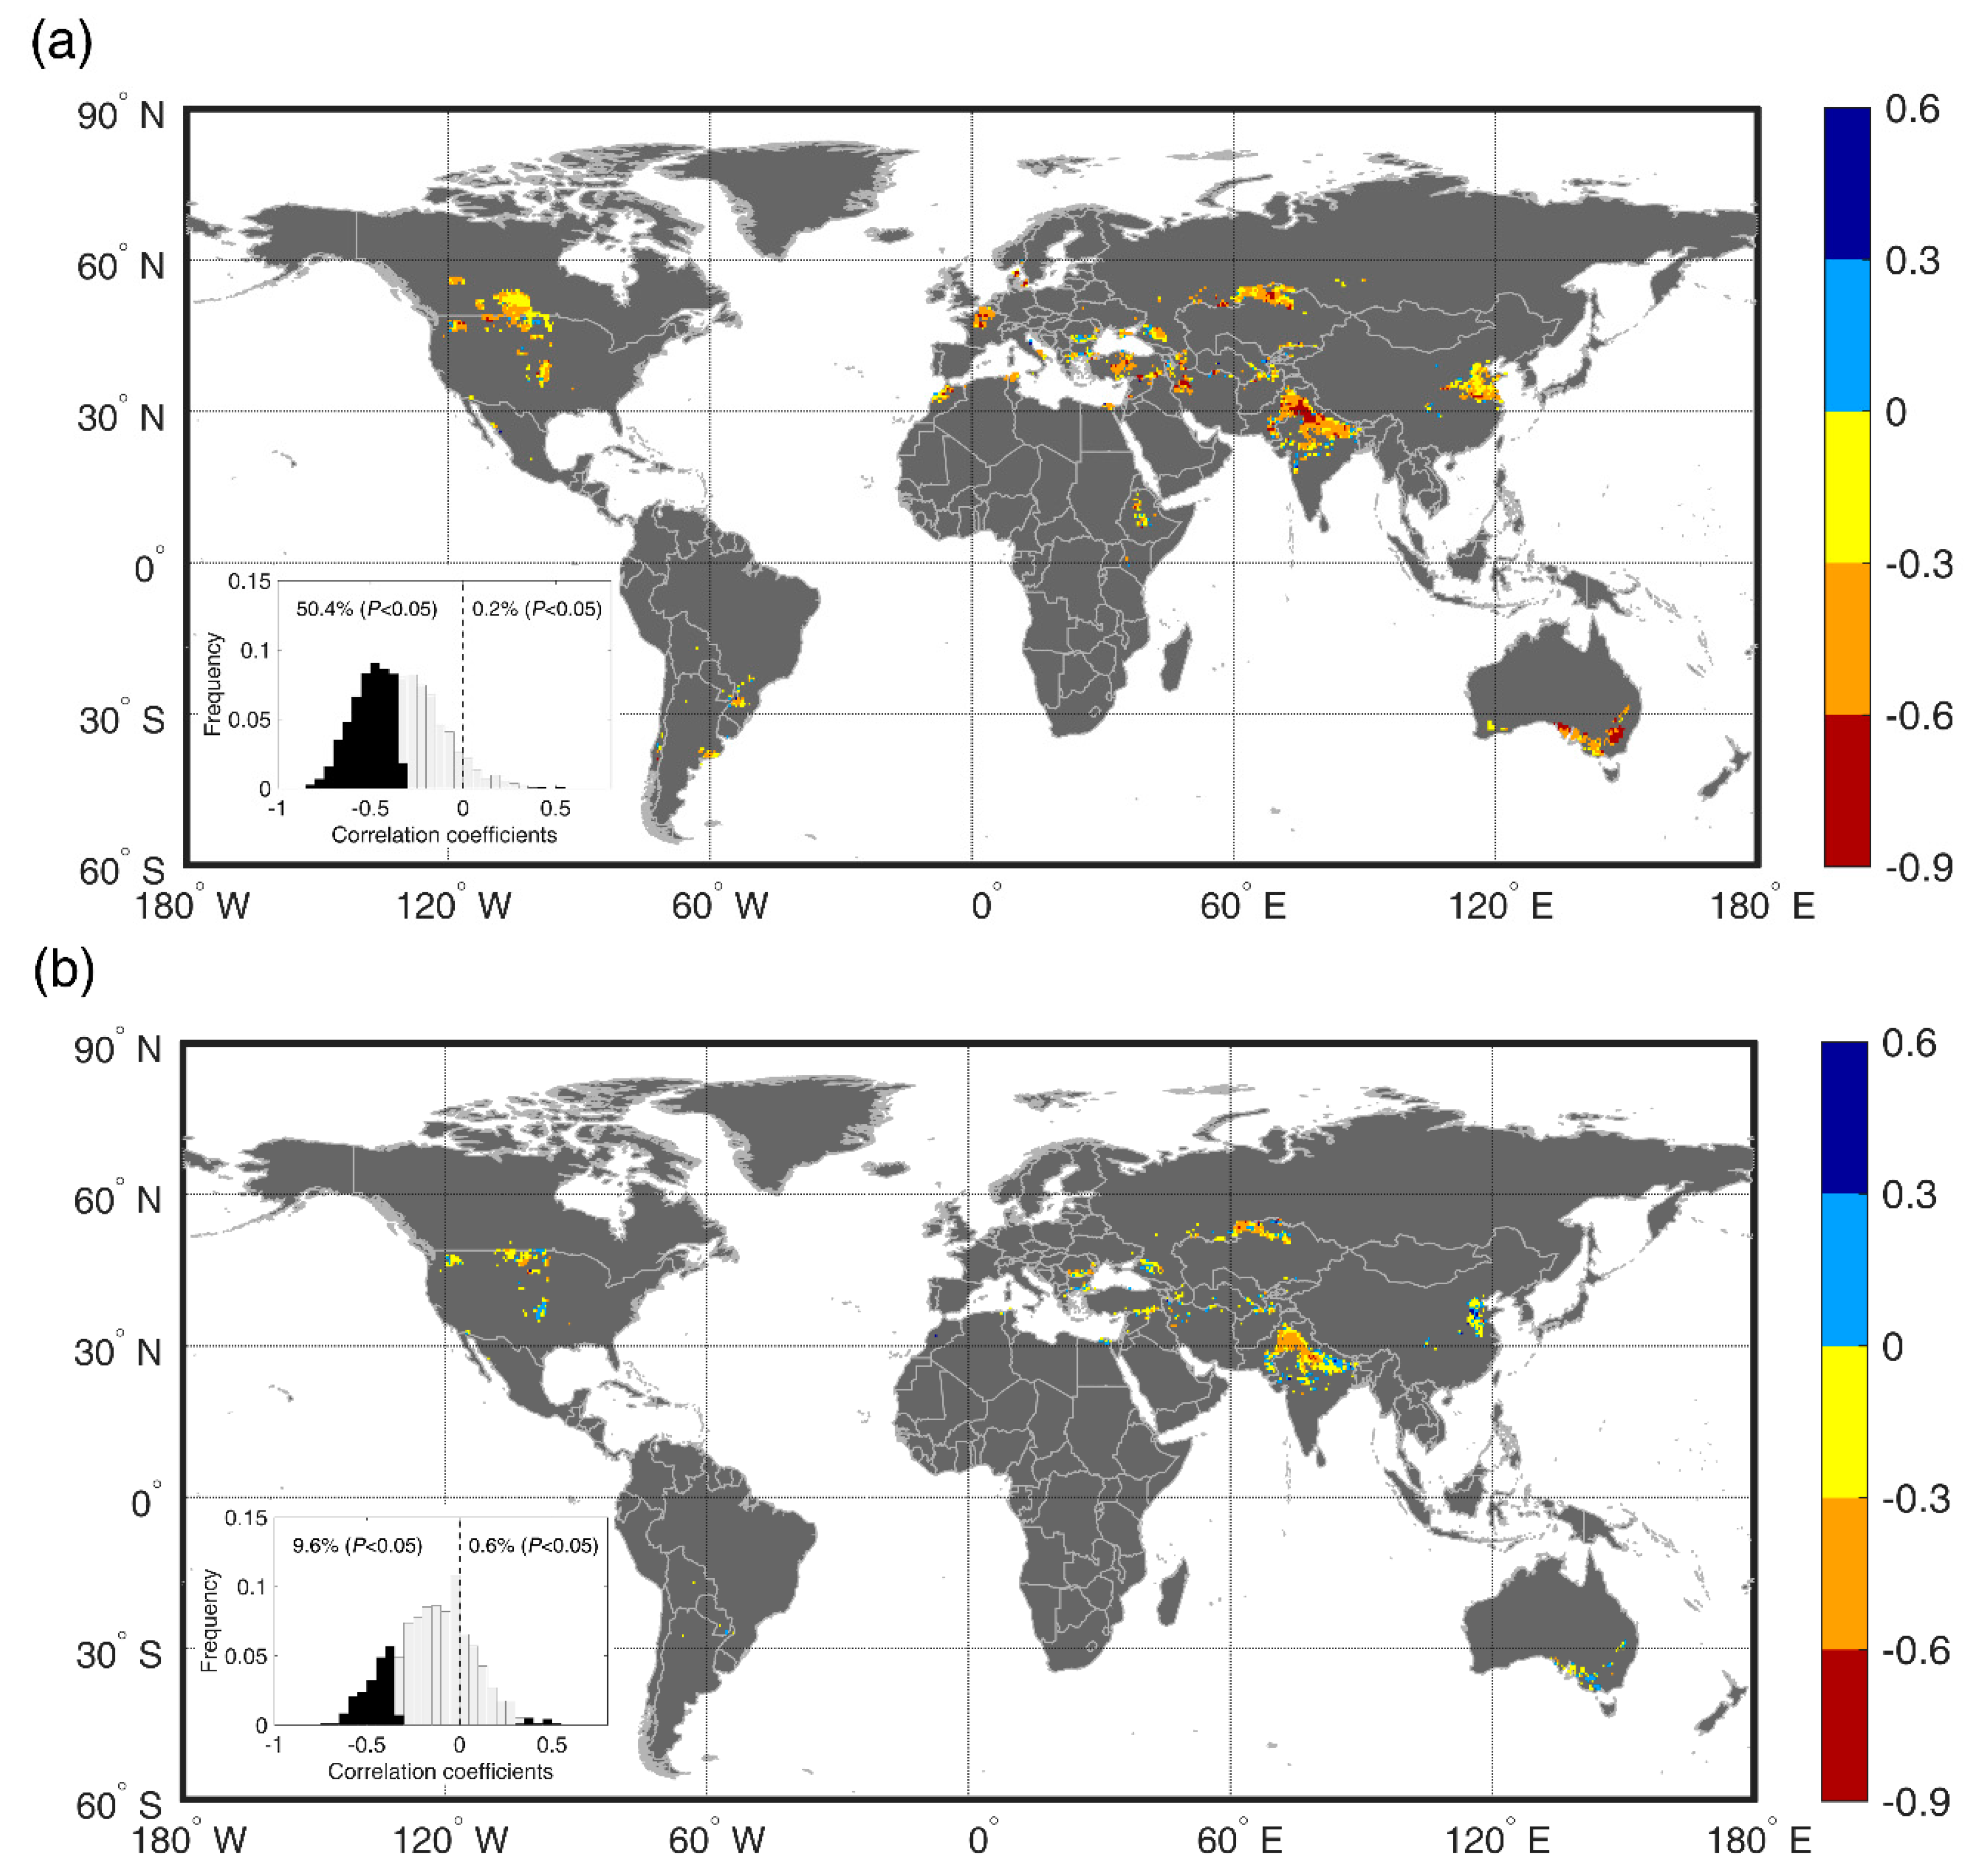
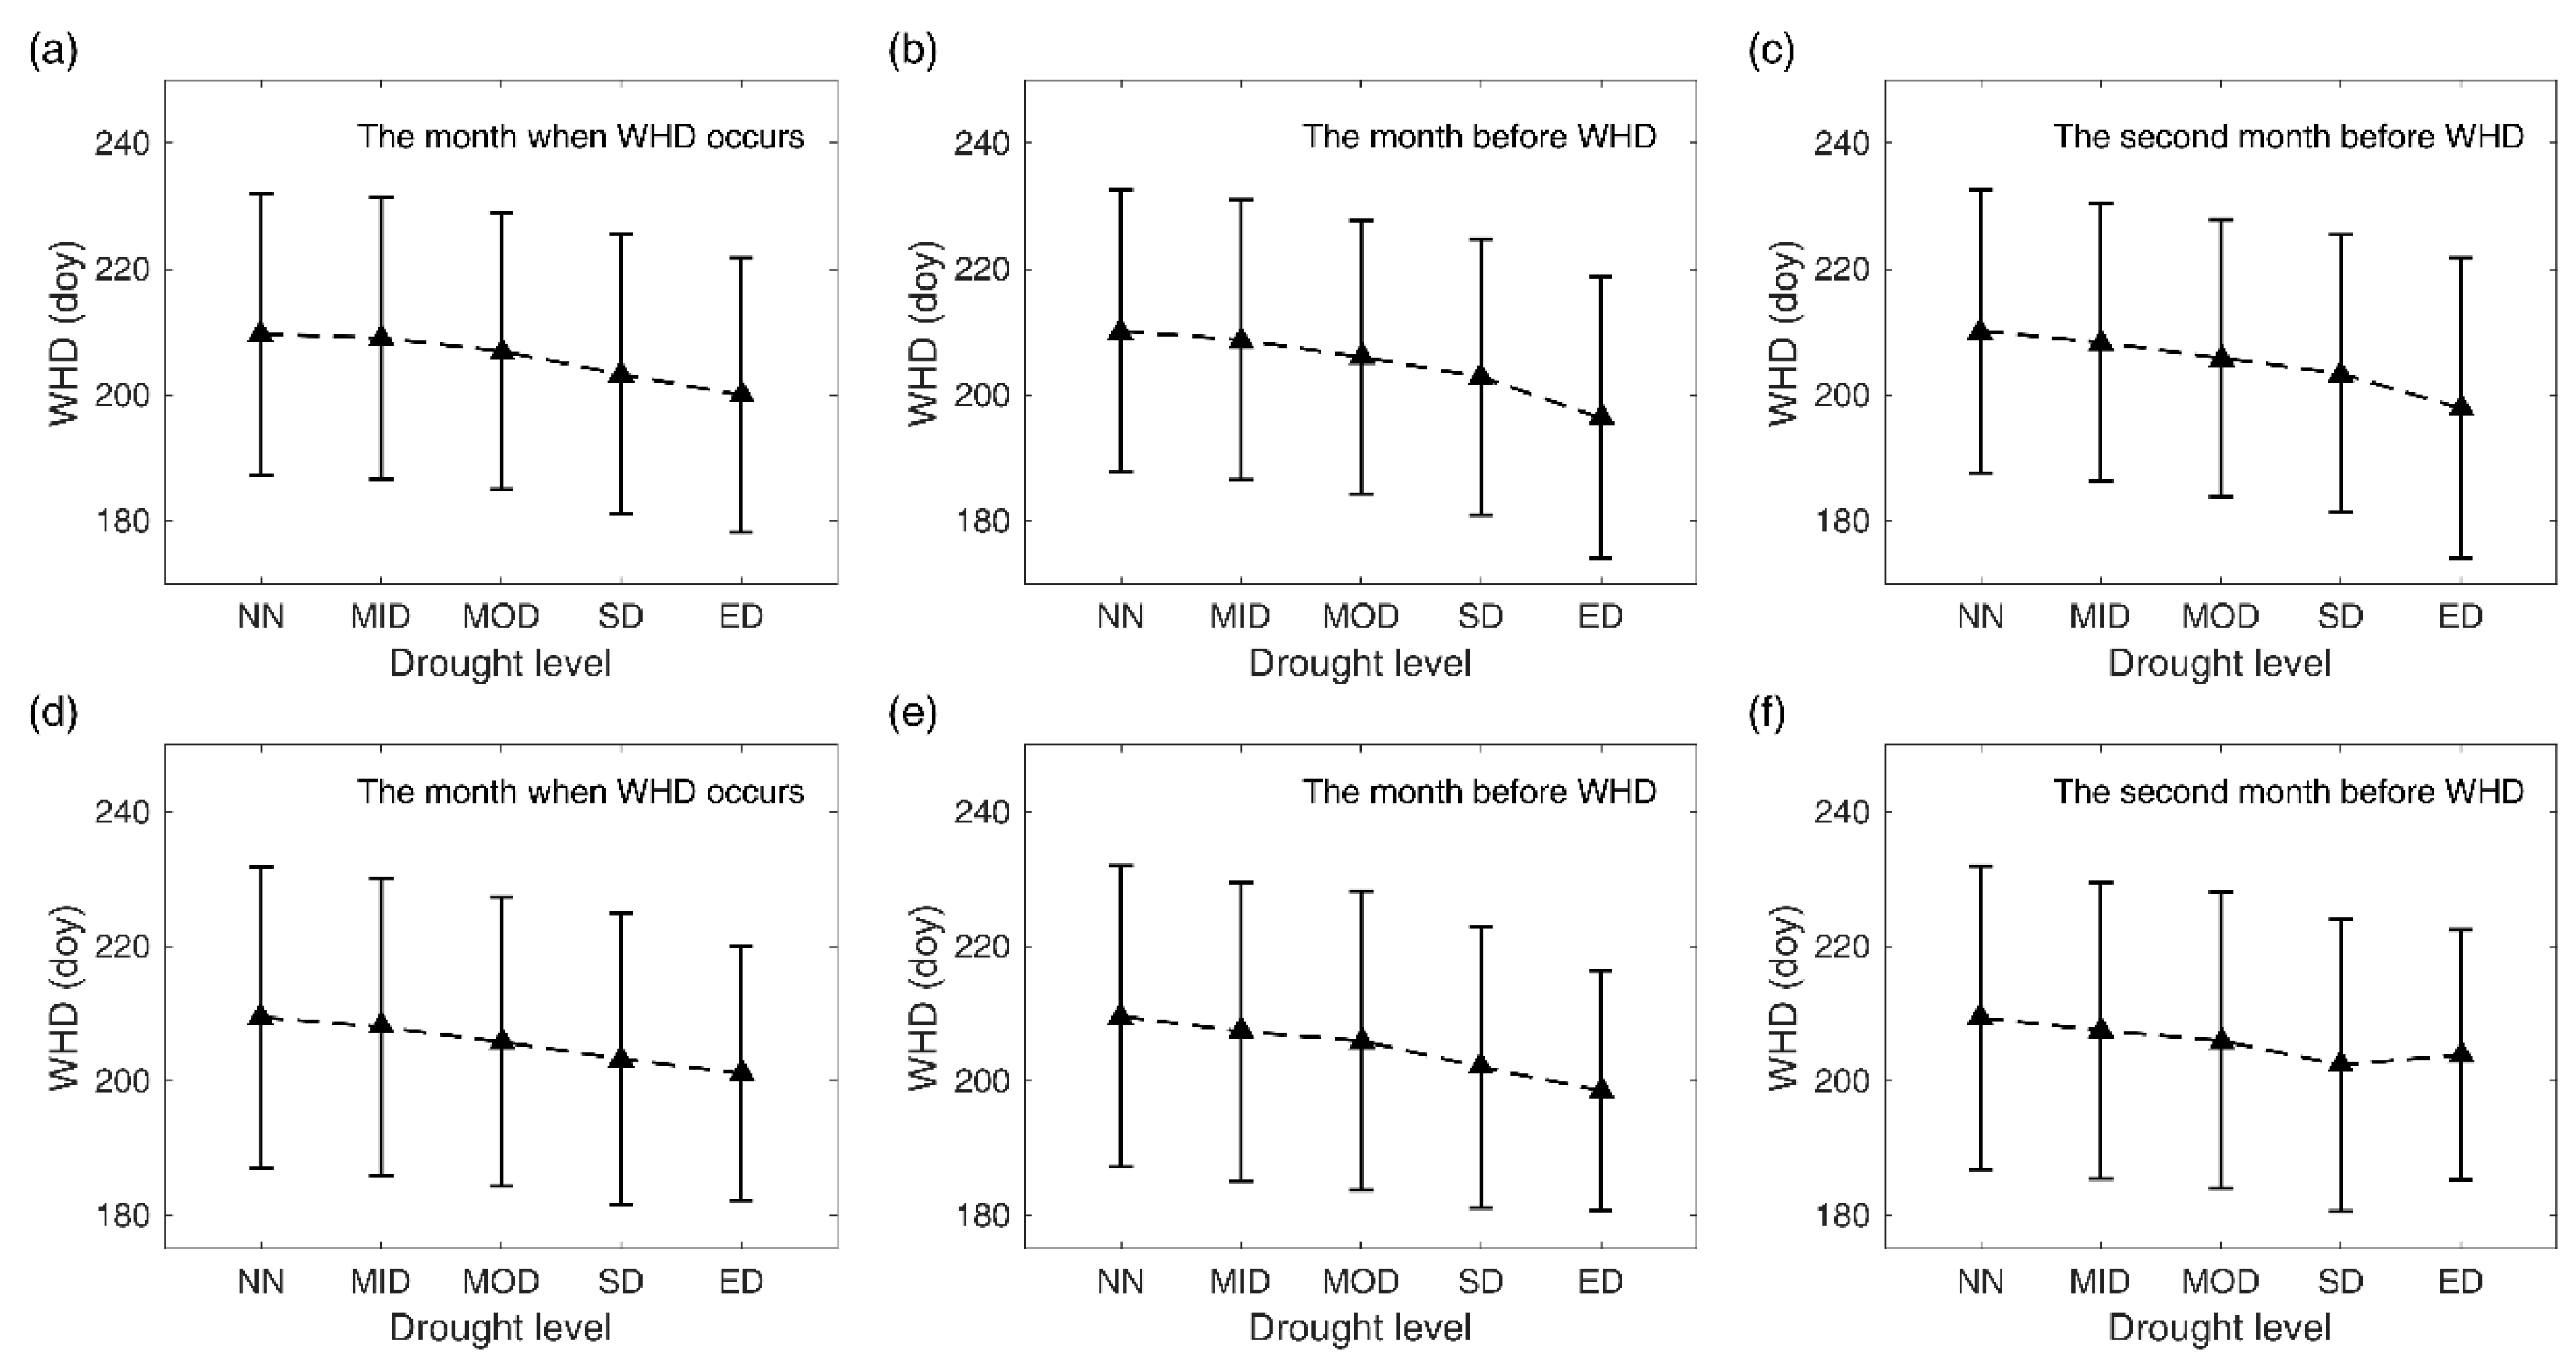
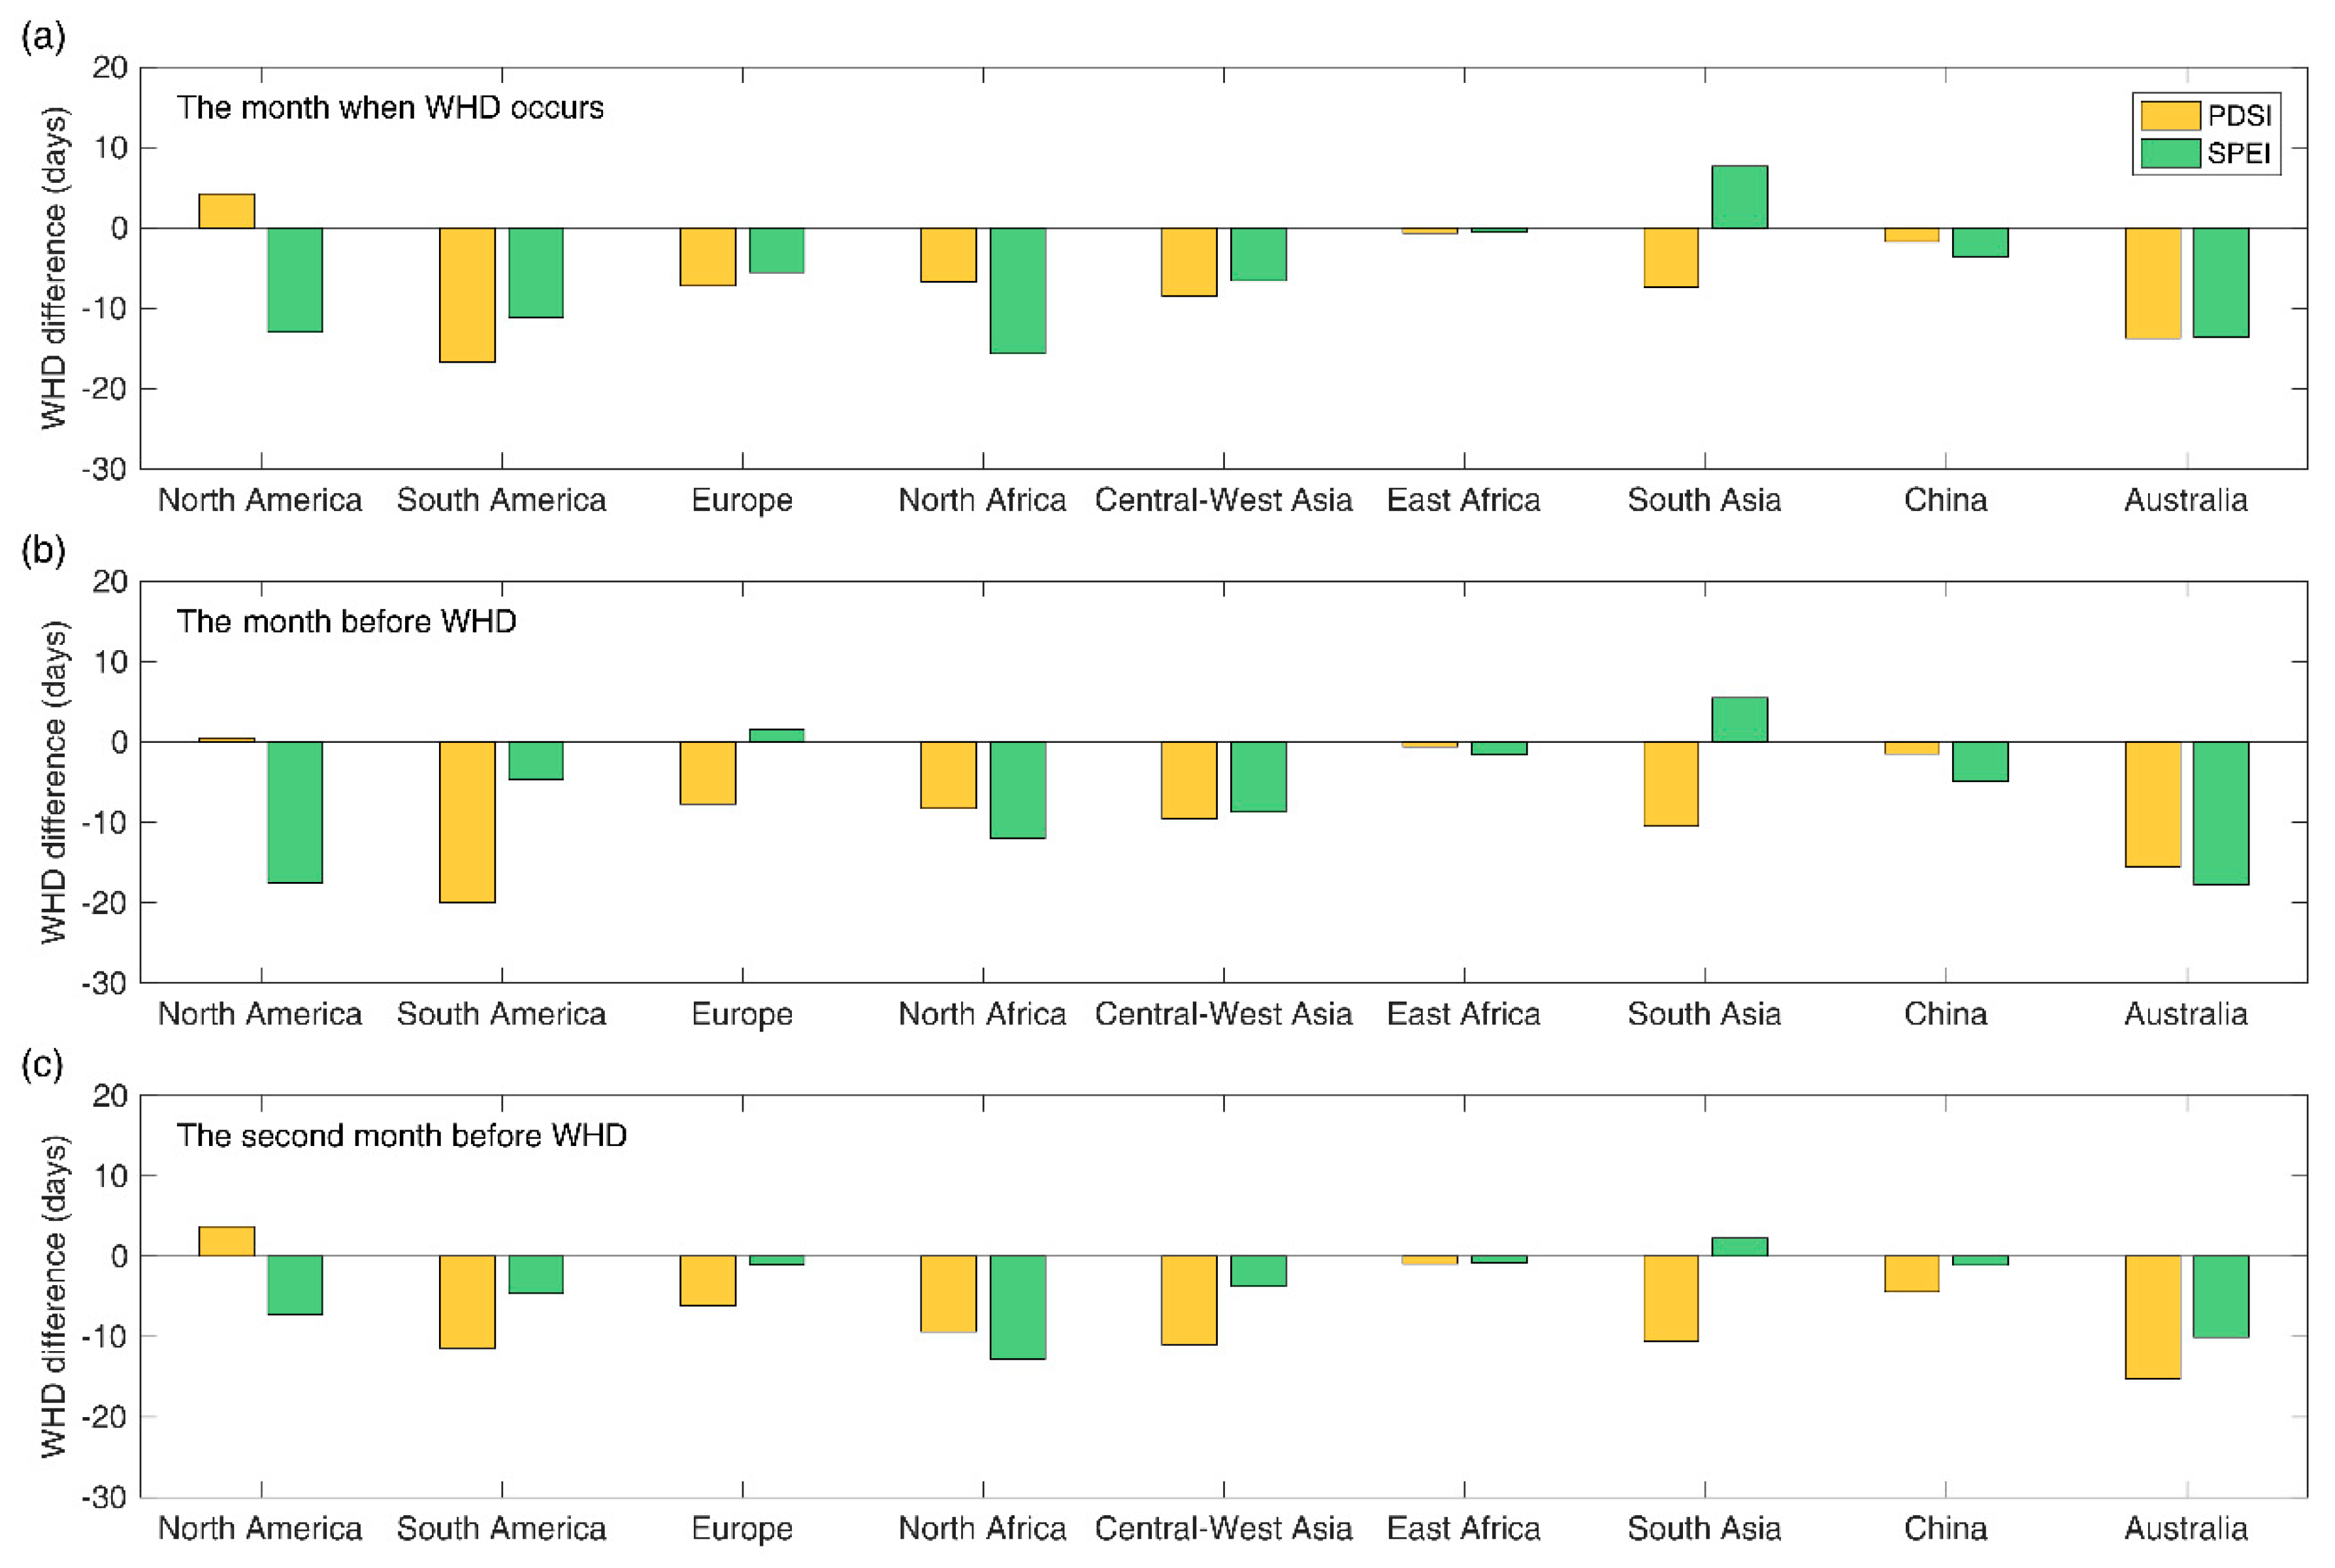
3.4. Effect of Drought on WHD

According to the PDSI, the frequency of serious drought events (from moderate to extreme drought) which occurred in the current month, in the month prior to WHD, and in the second month prior to WHD was 25%, 25%, and 23.8% during 1981–2014, respectively (Figure S3a–c). Spatially, places that were easily affected by serious drought events were primarily distributed in northwestern North America, southern India, Central-West Asia, and western Australia. For serious drought events measured based on SPEI, the frequency of serious drought events occurred in the current month, in the month prior to WHD, and in the second month prior to WHD was 15%, 15.6%, and 15.6%, respectively (Figure S3d–f). After comparing the spatial patterns (across the whole study region) of SPEI- and PDSI-derived serious drought events based on correlation analysis (Figure S4), we found the spatial distribution of SPEI-derived serious drought events for the month when WHD occurred was similar with that based on PDSI. For the second month before WHD, however, all South Asia and China were often impacted by serious drought events, while serious drought events scarcely took place in North America.
By averaging WHD values for each drought level, we found that WHD gradually occurred earlier as drought level increased. Extreme drought occurring in the current month forced wheat harvest timing to advance by about 9 days for PDSI and 8.1 days for SPEI compared to normal conditions (Figure 6a,d). Simultaneously, extreme drought occurred in the last/second month before WHD caused it to advance by about 13.8/12.2 days for PDSI and 10.8/5.3 days for SPEI compared to normal years (Figure 6b,c,e,f). Similar results were also detected in most of the nine wheat-growing areas (Figure 7). Except for a slightly delayed WHD (1.5 days) triggered by severe drought (SPEI) in the last month before WHD in Europe, severe drought occurring in the current month when WHD occurred to the second month before WHD caused it to advance by 0.6–20 days compared to normal years in South America, Europe, North Africa, Central-West Asia, East Africa, China, and Australia. In North America, delayed WHD values (0.5–4.2 days) were observed under an extremely arid climate measured by PDSI, whereas advanced WHD (7.3–17.6 days) occurred under severe drought conditions measured by SPEI. On the contrary, in South Asia we identified advanced WHD values (7.4–10.6 days) in extremely dry years calculated by PDSI but delayed WHD (2.2–7.6 days) in extremely dry years calculated by SPEI.

4. Discussion

This study revealed a dominant advancing trend of global WHD during 1981–2014, as observed in other studies based on ground observations and modelling results [6,11,12,38]. Unlike the gradual delay in wheat harvest timing detected in North America from 1981 to 2014, WHDs gradually occurred earlier in other wheat-growing regions, which were closely connected with spatial differences in heat and drought conditions (Figure S2). The delayed wheat harvest timing in North America may have been caused by a significant increase in moisture (Figure S2c,d). Many studies based on field experiments and statistical analysis have demonstrated the delaying effects of more water availability on wheat phenology occurrence [18]. Meanwhile, declining NDD in central North America may have strengthened the delay in WHD (Figure S2a), as a larger time span was needed to satisfy the heat requirement for wheat to mature [39]. In most of the eight other wheat-planting areas, however, the increased NDD was primarily responsible for the advance in WHD, especially in Eurasian wheat-planting areas (Figure S2a). The aggravated drought from 1981–2014 may have further contributed to advanced wheat development in West Asia, central India, and Australia (Figure S2c,d). Specifically, extreme high temperature events characterized by EDD were more frequent from 1981 to 2014 in northern South Asia and southern Central-West Asia, which may have further forced wheat into earlier senescence beyond the effects of NDD (Figure S2b).
A significant negative correlation between interannual WHD and NDD variability was observed in almost half of the study region, which indicates that wheat matured earlier in years with higher NDD. Heat condition is the primary factor controlling wheat growth and is usually correlated positively with wheat growth rate. Without considering the effects of other environmental factors, more heat in a previous period facilitates wheat photosynthesis and reduces the time span needed to accumulate enough heat to move wheat growth into the next stage [35]. On the contrary, extreme heat exposure can inhibit wheat growth, increase leaf senescence, and shorten the duration of wheat growth by slowing down photosynthesis (closing the stomata and reducing CO2 input) [40]. However, excessive exposure to extremely high temperatures was only detected in specific regions (mainly South Asia and northern Kazakhstan), so most regions did not suffer severe heatwaves. Nevertheless, the effects of extremely high temperatures on wheat growth were weaker than those of normal temperatures, which differed from the stronger impacts of extremely high temperature stress found in India by Lobell et al. [14]. Increased temperatures, including overall temperature rise and frequent high-temperature events, may also intensify plant and soil evapotranspiration, and thus indirectly influence wheat growth by regulating the water supply. According to the projected results, air temperatures will continue to rise and simultaneously increase the frequency of high temperature events in the future [41]. Therefore, wheat growth will face serious challenges under future climate warming.
Water supply is another critical limitation on plant growth in agricultural systems. The severity of drought in previous periods had significant impacts on wheat harvest timing. When drought severity increased over the prior three months, the wheat maturity date gradually advanced (5.3–13.8 days) in most wheat-growing areas. This was in agreement with results from field experiments carried out in Syria, in which mid- and late-season moisture stress shortened the grain-filling period by 10–11 days [42]. Drought can reduce leaf expansion and longevity, stomatal conductance, and the light-saturated rate of photosynthesis [43]. In addition, transpiration is also significantly reduced under drought stress; this in turn slows leaf heat loss and increases leaf temperature [44]. As a result, increased CO2 concentrations and photosynthesis can promote wheat development. It is worth noting that the effects of drought stress on wheat harvesting varied across the different developmental stages. In addition, the impacts of extreme drought on WHD were different across the nine wheat-growing areas, which may be closely linked to the difference in drought tolerance of wheat cultivars in different regions [38,45]. As drought is projected to be more frequent and serious in 2080–2099 than 1981–1999 for global wheat-growing areas (especially in North America, Europe, and Australia), more attention should be paid to drought impacts on wheat growth [46].
It should be noted that there are still some uncertainties in this study. First of all, because there were no published annual wheat distribution maps available, we were forced to use the 2005 wheat extent map to determine the range of wheat distribution for all the years. However, in fact, the crop planting system is very complicated. In some places, farmers may grow wheat this year, but switch to another crop next year. For a particular pixel, the percentage of wheat may vary from 1981 to 2014. It is urgent to produce annual wheat distribution maps for a more accurate temporal pattern analysis of wheat phenology. Second, we defined the percentage of wheat grown >30% as wheat pixels. Thus, the estimated wheat harvest timing was inevitably affected by other crops or land covers. Given the relatively coarse spatial resolution of the pixels in this study, only a few pixels have a wheat-planting percentage >50%. Future research is best done on pixels with a higher percentage of wheat grown or even on pure wheat pixels.

5. Conclusions

In this study, we assessed the impacts of thermal conditions (including normal and extreme conditions) and drought stress on wheat harvest timing with remote sensing data and gridded temperature, and drought data at a global scale. The results demonstrated that increases in normal-growing-degree-days and extreme-growing-degree-days can both significantly advance wheat harvest date. Normal thermal conditions had stronger impacts on wheat harvest timing worldwide, while extremely high temperatures only showed a weaker influence on wheat growth in limited areas. Serious drought could also notably advance the timing of global wheat harvest. Overall, we highlight the advancing effects of heat and drought stress on wheat development across most wheat-planting areas and suggest to focus on strategies to address future climate change impacts on wheat development.

Supplementary Materials

The following are available online at https://www.mdpi.com/2072-4292/11/8/971/s1, Figure S1. Spatial distribution of multi-year average WHD values estimated by the (a) threshold-based method, (b) logistic-based method, and (c) shape-based method. doy in the color bar denotes the day of year. Figure S2. Variation trends in (a) NDD and (b) EDD for the three months before WHD; (c) PDSI and (d) SPEI from the second month before WHD to the current month. Figure S3. Frequency of serious drought events. (a)–(c): PDSI; (d)–(f): SPEI. Figure S4. Correlation of spatial pattern of serious drought events measured by PDSI and SPEI for (a) the month when WHD occurs, (b) the month before WHD, and (c) the second month before WHD.

Author Contributions

Conceptualization, S.R., Q.Q. and H.R.; Data curation, S.R.; Formal analysis, S.R.; Writing – original draft, S.R., Q.Q. and H.R.; Writing – review & editing, J.S. and Y.Z.

Funding

This study was supported by the National High-Resolution Earth Observation Project (11-Y20A16-9001-17/18) and the National Natural Science Foundation (41771371).

Acknowledgments

We would like to thank the Vegetation Index and Phenology Lab., University of Arizona for providing high-quality EVI2 data.

Conflicts of Interest

The authors declare no conflicts of interest.

References

  1. Cleland, E.E.; Chiariello, N.R.; Loarie, S.R.; Mooney, H.A.; Field, C.B. Diverse responses of phenology to global changes in a grassland ecosystem. Proc. Natl. Acad. Sci. USA 2006, 103, 13740–13744. [Google Scholar] [CrossRef] [Green Version]
  2. Penuelas, J.; Rutishauser, T.; Filella, I. Phenology feedbacks on climate change. Science 2009, 324, 887–888. [Google Scholar] [CrossRef]
  3. Richardson, A.D.; Keenan, T.F.; Migliavacca, M.; Ryu, Y.; Sonnentag, O.; Toomey, M. Climate change, phenology, and phenological control of vegetation feedbacks to the climate system. Agric. For. Meteorol. 2013, 169, 156–173. [Google Scholar] [CrossRef]
  4. Piao, S.; Ciais, P.; Friedlingstein, P.; Peylin, P.; Reichstein, M.; Luyssaert, S.; Margolis, H.; Fang, J.; Barr, A.; Chen, A. Net carbon dioxide losses of northern ecosystems in response to autumn warming. Nature 2008, 451, 49–52. [Google Scholar] [CrossRef]
  5. Estrella, N.; Sparks, T.H.; Menzel, A. Effects of temperature, phase type and timing, location, and human density on plant phenological responses in europe. Clim. Res. 2009, 39, 235–248. [Google Scholar] [CrossRef]
  6. Hu, Q.; Weiss, A.; Feng, S.; Baenziger, P.S. Earlier winter wheat heading dates and warmer spring in the U.S. Great plains. Agric. For. Meteorol. 2005, 135, 284–290. [Google Scholar] [CrossRef]
  7. Siebert, S.; Ewert, F. Spatio-temporal patterns of phenological development in germany in relation to temperature and day length. Agric. For. Meteorol. 2012, 152, 44–57. [Google Scholar] [CrossRef]
  8. Tao, F.; Yokozawa, M.; Xu, Y.; Hayashi, Y.; Zhang, Z. Climate changes and trends in phenology and yields of field crops in China, 1981–2000. Agric. For. Meteorol. 2006, 138, 82–92. [Google Scholar] [CrossRef]
  9. Asseng, S.; Ewert, F.; Martre, P.; Rötter, R.P.; Lobell, D.; Cammarano, D.; Kimball, B.; Ottman, M.; Wall, G.; White, J.W. Rising temperatures reduce global wheat production. Nat. Clim. Chang. 2015, 5, 143–147. [Google Scholar] [CrossRef]
  10. Lokupitiya, E.; Denning, S.; Paustian, K.; Baker, I.; Schaefer, K.; Verma, S.; Meyers, T.; Bernacchi, C.; Suyker, A.; Fischer, M. Incorporation of crop phenology in simple biosphere model (sibcrop) to improve land-atmosphere carbon exchanges from croplands. Biogeosciences 2009, 6, 969–986. [Google Scholar] [CrossRef]
  11. Estrella, N.; Sparks, T.H.; Menzel, A. Trends and temperature response in the phenology of crops in Germany. Glob. Chang. Biol. 2007, 13, 1737–1747. [Google Scholar] [CrossRef]
  12. Liu, Y.J.; Chen, Q.M.; Ge, Q.S.; Dai, J.H.; Qin, Y.; Dai, L.; Zou, X.T.; Chen, J. Modelling the impacts of climate change and crop management on phenological trends of spring and winter wheat in China. Agric. For. Meteorol. 2018, 248, 518–526. [Google Scholar] [CrossRef]
  13. Xiao, D.; Moiwo, J.P.; Tao, F.; Yang, Y.; Shen, Y.; Xu, Q.; Liu, J.; Zhang, H.; Liu, F. Spatiotemporal variability of winter wheat phenology in response to weather and climate variability in China. Mitig. Adapt. Strateg. Glob. Chang. 2015, 20, 1191–1202. [Google Scholar] [CrossRef]
  14. Lobell, D.B.; Sibley, A.; Ivan Ortiz-Monasterio, J. Extreme heat effects on wheat senescence in India. Nat. Clim. Chang. 2012, 2, 186–189. [Google Scholar] [CrossRef]
  15. White, M.A.; De Beurs, K.M.; Didan, K.; Inouye, D.W.; Richardson, A.D.; Jensen, O.P.; O’Keefe, J.; Zhang, G.; Nemani, R.R.; Van Leeuwen, W.J.D.; et al. Intercomparison, interpretation, and assessment of spring phenology in North America estimated from remote sensing for 1982-2006. Glob. Chang. Biol. 2009, 15, 2335–2359. [Google Scholar] [CrossRef]
  16. Iturbe-Ormaetxe, I.; Escuredo, P.R.; Arrese-Igor, C.; Becana, M. Oxidative damage in pea plants exposed to water deficit or paraquat. Plant Physiol. 1998, 116, 173–181. [Google Scholar] [CrossRef]
  17. Monakhova, O.; Chernyad’ev, I. Protective role of kartolin-4 in wheat plants exposed to soil draught. Appl. Biochem. Microbiol. 2002, 38, 373–380. [Google Scholar] [CrossRef]
  18. McMaster, G.; Wilhelm, W. Phenological responses of wheat and barley to water and temperature: Improving simulation models. J. Agric. Sci. 2003, 141, 129–147. [Google Scholar] [CrossRef]
  19. You, L.Z.; Wood, S.; Wood-Sichra, U.; Wu, W.B. Generating global crop distribution maps: From census to grid. Agric. Syst. 2014, 127, 53–60. [Google Scholar] [CrossRef] [Green Version]
  20. Didan, K.; Barreto, A.; Miura, T.; Tsend-Ayush, J.; Zhang, X.; Friedl, M.; Gray, J.; Van Leeuwen, W.; Czapla-Myers, J.; Doman Bennett, S. Multi-Sensor Vegetation Index and Phenology Earth Science Data Records: Algorithm Theoretical Basis Document and User Guide Version 4.0; The Vegetation and Index Phenology Lab.: University of Arizona, Tucson, USA, 2016. [Google Scholar]
  21. USDA. Major World Crop Areas and Climatic Profiles; Agricultural Handbook No. 664; United States Department of Agriculture: Washington, DC, USA, 1994.
  22. Shen, M.; Zhang, G.; Cong, N.; Wang, S.; Kong, W.; Piao, S. Increasing altitudinal gradient of spring vegetation phenology during the last decade on the Qinghai–Tibetan Plateau. Agric. For. Meteorol. 2014, 189–190, 71–80. [Google Scholar] [CrossRef]
  23. Beck, P.S.A.; Atzberger, C.; Høgda, K.A.; Johansen, B.; Skidmore, A.K. Improved monitoring of vegetation dynamics at very high latitudes: A new method using MODIS NDVI. Remote Sens. Environ. 2006, 100, 321–334. [Google Scholar] [CrossRef]
  24. Busetto, L.; Colombo, R.; Migliavacca, M.; Cremonese, E.; Meroni, M.; Galvagno, M.; Rossini, M.; Siniscalco, C.; Morra Di Cella, U.; Pari, E. Remote sensing of larch phenological cycle and analysis of relationships with climate in the alpine region. Glob. Chang. Biol. 2010, 16, 2504–2517. [Google Scholar] [CrossRef]
  25. Fisher, J.I.; Mustard, J.F.; Vadeboncoeur, M.A. Green leaf phenology at Landsat resolution: Scaling from the field to the satellite. Remote Sens. Environ. 2006, 100, 265–279. [Google Scholar] [CrossRef]
  26. Zhang, X.; Friedl, M.A.; Schaaf, C.B.; Strahler, A.H.; Hodges, J.C.F.; Gao, F.; Reed, B.C.; Huete, A. Monitoring vegetation phenology using MODIS. Remote Sens. Environ. 2003, 84, 471–475. [Google Scholar] [CrossRef]
  27. Sakamoto, T.; Wardlow, B.D.; Gitelson, A.A.; Verma, S.B.; Suyker, A.E.; Arkebauer, T.J. A two-step filtering approach for detecting maize and soybean phenology with time-series modis data. Remote Sens. Environ. 2010, 114, 2146–2159. [Google Scholar] [CrossRef]
  28. Weedon, G.P.; Balsamo, G.; Bellouin, N.; Gomes, S.; Best, M.J.; Viterbo, P. The WFDEI meteorological forcing data set: Watch Forcing Data methodology applied to ERA-Interim reanalysis data. Water Resour. Res. 2014, 50, 7505–7514. [Google Scholar] [CrossRef]
  29. Stacke, T.; Hagemann, S. Development and evaluation of a global dynamical wetlands extent scheme. Hydrol. Earth Syst. Sci. 2012, 16, 2915. [Google Scholar] [CrossRef]
  30. Wayne, C.P. Meteorological drought. Res. Pap. 1965, 45, 58. [Google Scholar]
  31. Wells, N.; Goddard, S.; Hayes, M.J. A self-calibrating palmer drought severity index. J. Clim. 2004, 17, 2335–2351. [Google Scholar] [CrossRef]
  32. Van der Schrier, G.; Barichivich, J.; Briffa, K.; Jones, P. A scpdsi-based global data set of dry and wet spells for 1901–2009. J. Geophys. Res. Atmos. 2013, 118, 4025–4048. [Google Scholar] [CrossRef]
  33. Vicente-Serrano, S.M.; Beguería, S.; López-Moreno, J.I. A multiscalar drought index sensitive to global warming: The standardized precipitation evapotranspiration index. J. Clim. 2010, 23, 1696–1718. [Google Scholar] [CrossRef]
  34. Nam, W.-H.; Hayes, M.J.; Svoboda, M.D.; Tadesse, T.; Wilhite, D.A. Drought hazard assessment in the context of climate change for South Korea. Agric. Water Manag. 2015, 160, 106–117. [Google Scholar] [CrossRef]
  35. Porter, J.R.; Gawith, M. Temperatures and the growth and development of wheat: A review. Eur. J. Agron. 1999, 10, 23–36. [Google Scholar] [CrossRef]
  36. Sen, P.K. Estimates of the regression coefficient based on kendall’s tau. J. Am. Stat. Assoc. 1968, 63, 1379–1389. [Google Scholar] [CrossRef]
  37. Theil, H. A rank-invariant method of linear and polynomial regression analysis, i, ii, and iii. Nederlandsche Akad. Wetenschappen Proc. 1950, 58, 386–392. [Google Scholar]
  38. Tao, F.; Zhang, S.; Zhang, Z. Spatiotemporal changes of wheat phenology in China under the effects of temperature, day length and cultivar thermal characteristics. Eur. J. Agron. 2012, 43, 201–212. [Google Scholar] [CrossRef]
  39. McMaster, G.S.; Smika, D.E. Estimation and evaluation of winter wheat phenology in the central great plains. Agric. For. Meteorol. 1988, 43, 1–18. [Google Scholar] [CrossRef]
  40. Asseng, S.; Foster, I.; Turner, N.C. The impact of temperature variability on wheat yields. Glob. Chang. Biol. 2011, 17, 997–1012. [Google Scholar] [CrossRef]
  41. Stocker, T. Climate Change 2013: The Physical Science Basis: Working Group I Contribution to the Fifth Assessment Report of the Intergovernmental Panel on Climate Change; Cambridge University Press: Cambridge, UK, 2014. [Google Scholar]
  42. Simane, B.; Peacock, J.; Struik, P. Differences in developmental plasticity and growth rate among drought-resistant and susceptible cultivars of durum wheat (triticum turgidum L. Var. Durum). Plant Soil 1993, 157, 155–166. [Google Scholar] [CrossRef]
  43. Ewert, F.; Rodriguez, D.; Jamieson, P.; Semenov, M.; Mitchell, R.; Goudriaan, J.; Porter, J.; Kimball, B.; Pinter, P., Jr.; Manderscheid, R. Effects of elevated CO2 and drought on wheat: Testing crop simulation models for different experimental and climatic conditions. Agric. Ecosyst. Environ. 2002, 93, 249–266. [Google Scholar] [CrossRef]
  44. Rosenberg, N.J.; Kimball, B.; Martin, P.; Cooper, C. From climate and CO2 enrichment to evapotranspiration. In Climate Change and US Water Resources; Wiley: New York, NY, USA, 1990; pp. 151–175. [Google Scholar]
  45. Szegletes, Z.; Erdei, L.; Tari, I.; Cseuz, L. Accumulation of osmoprotectants in wheat cultivars of different drought tolerance. Cereal Res. Commun. 2000, 28, 403–410. [Google Scholar]
  46. Dai, A. Increasing drought under global warming in observations and models. Nat. Clim. Chang. 2013, 3, 52. [Google Scholar] [CrossRef]
Figure 1. Global wheat (green dots) distribution map. (i)–(ix) represent the nine major wheat-planting regions, i.e., North America, South America, Europe, North Africa, Central-West Asia, East Africa, South Asia, China, and Australia.
Remotesensing 11 00971 g001
Figure 2. The spatial distribution of multiyear and multimethod average wheat harvest date (WHD). The “doy” in the color bar denotes the day of year.
Remotesensing 11 00971 g002
Figure 3. The frequency of WHD variation trends. The black bars indicate significant trends at the significance level of 0.05.
Remotesensing 11 00971 g003
Figure 4. The WHD variation trends for nine wheat-planting areas. The solid black line indicates the linear trend, while the dashed black line indicates the 5-year moving average.
Remotesensing 11 00971 g004
Figure 5. The spatial patterns of correlation coefficients (a) between WHD and NDD, and (b) between WHD and EDD. The inset is correlation coefficient frequency.
Remotesensing 11 00971 g005
Figure 6. Wheat harvest date comparison at different drought levels in the month when WHD occurs, in the month before WHD, and in the second month before WHD. (a)–(c): PDSI; (d)–(f): SPEI. NN: near normal; MID: mild drought; MOD: moderate drought; SD: severe drought; ED: extreme drought.
Remotesensing 11 00971 g006
Figure 7. Difference in WHD between extreme-drought years and normal years based on PDSI (yellow) and SPEI (green). (a) Drought conditions in the month when WHD occurs; (b) drought conditions in the month before WHD; (c) drought conditions in the second month before WHD.
Remotesensing 11 00971 g007
Table 1. Drought level classification according to PDSI and SPEI.
Drought levelPDSISPEI
Near normal (NN)−0.99 to 0.99−0.49 to 0.49
Mild drought (MID)−1.99 to −1.00−0.99 to −0.50
Moderate drought (MOD)−2.99 to −2.00−1.49 to −1.00
Severe drought (SD)−3.99 to −3.00−1.99 to −1.50
Extreme drought (ED)Less than −4.00Less than −2.00

