Relative Radiometric Calibration of Airborne LiDAR Data for Archaeological Applications


Abstract
:
1. Introduction
2. Radiometric Data from LiDAR: Theoretical Background and History in Archaeological Research
2.1. LiDAR and Radiometric Data
- The distance of the laser scanner to the reflecting object. This is the basic information gathered from the runtime of the laser pulse (therefore, the underlying principle is called “light detection and ranging”, i.e., LiDAR). With the addition of the exact location and orientation of the scanner and the laser pulse direction, coordinates can be assigned to the reflecting object.
- Radiometric information and laser pulse characteristics. This information includes the strength of the received signal at the scanner, called amplitude. In FWF ALS systems, additional parameters such as the echo-width can be derived from the digitized waveform.
2.2. Radiometric Calibration
2.2.1. Amplitude
2.2.2. Reflectance
| Backscatter cross section | |
| Directionality of scattering | |
| Reflectance | |
| Area illuminated by the laser beam |
2.2.3. Calibration to Derive Reflectance
2.2.4. Absolute and Relative Calibration
- Absolute calibration uses in-situ measurements of the reflectance from ground targets that are measured in concert with the ALS acquisition.
- Relative calibration uses approximate reflectance values from well-known surfaces that exhibit nearly Lambertian backscatter characteristics.
2.3. Radiometric Data and Calibration in Archaeological Research
3. Methodology
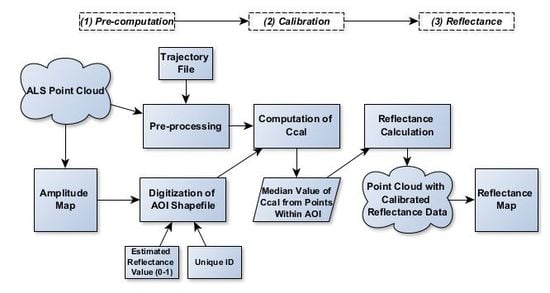
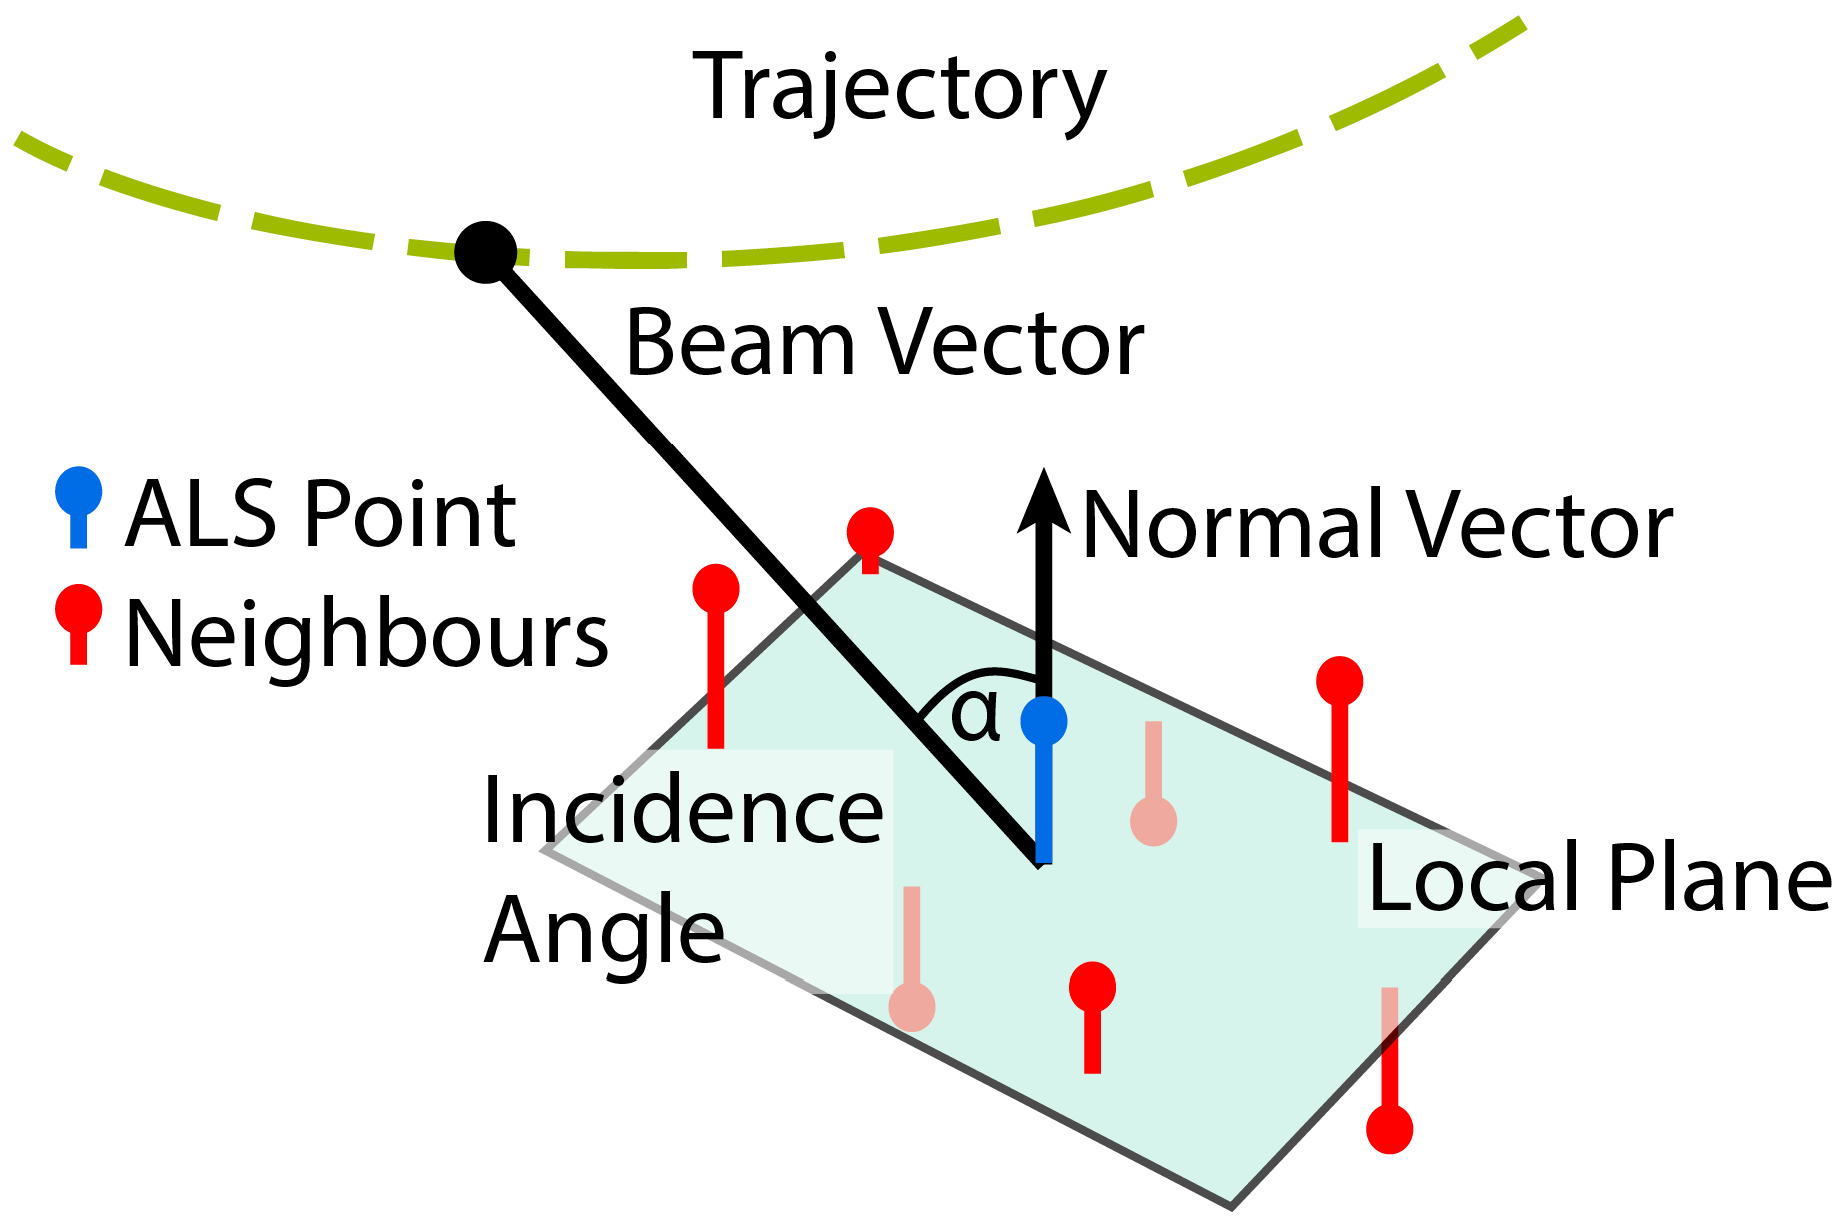
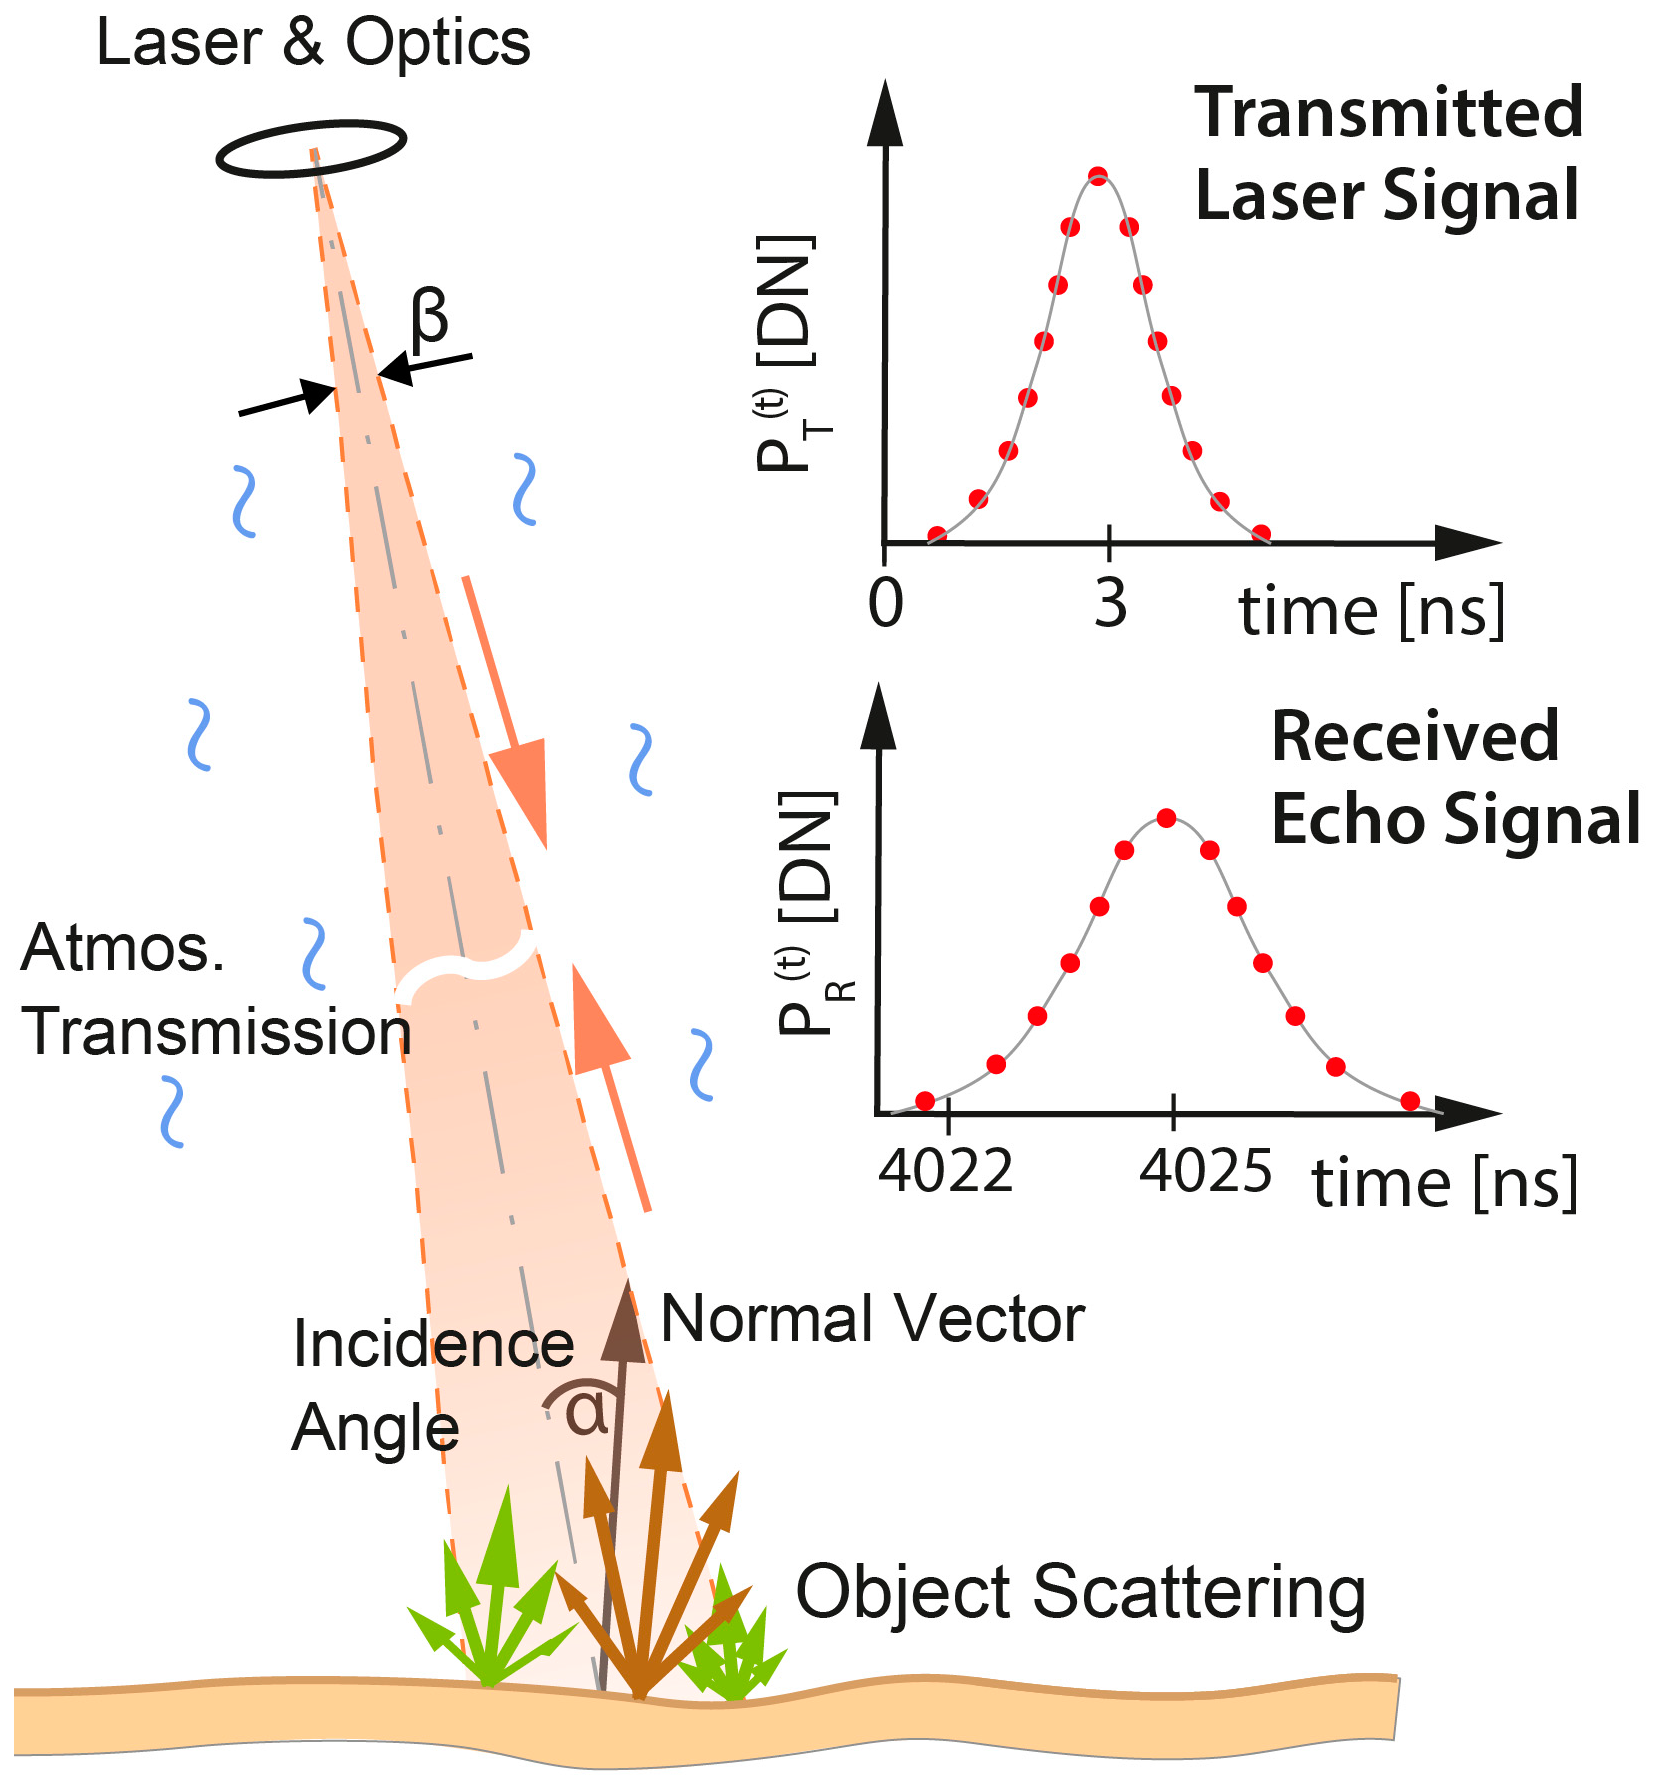
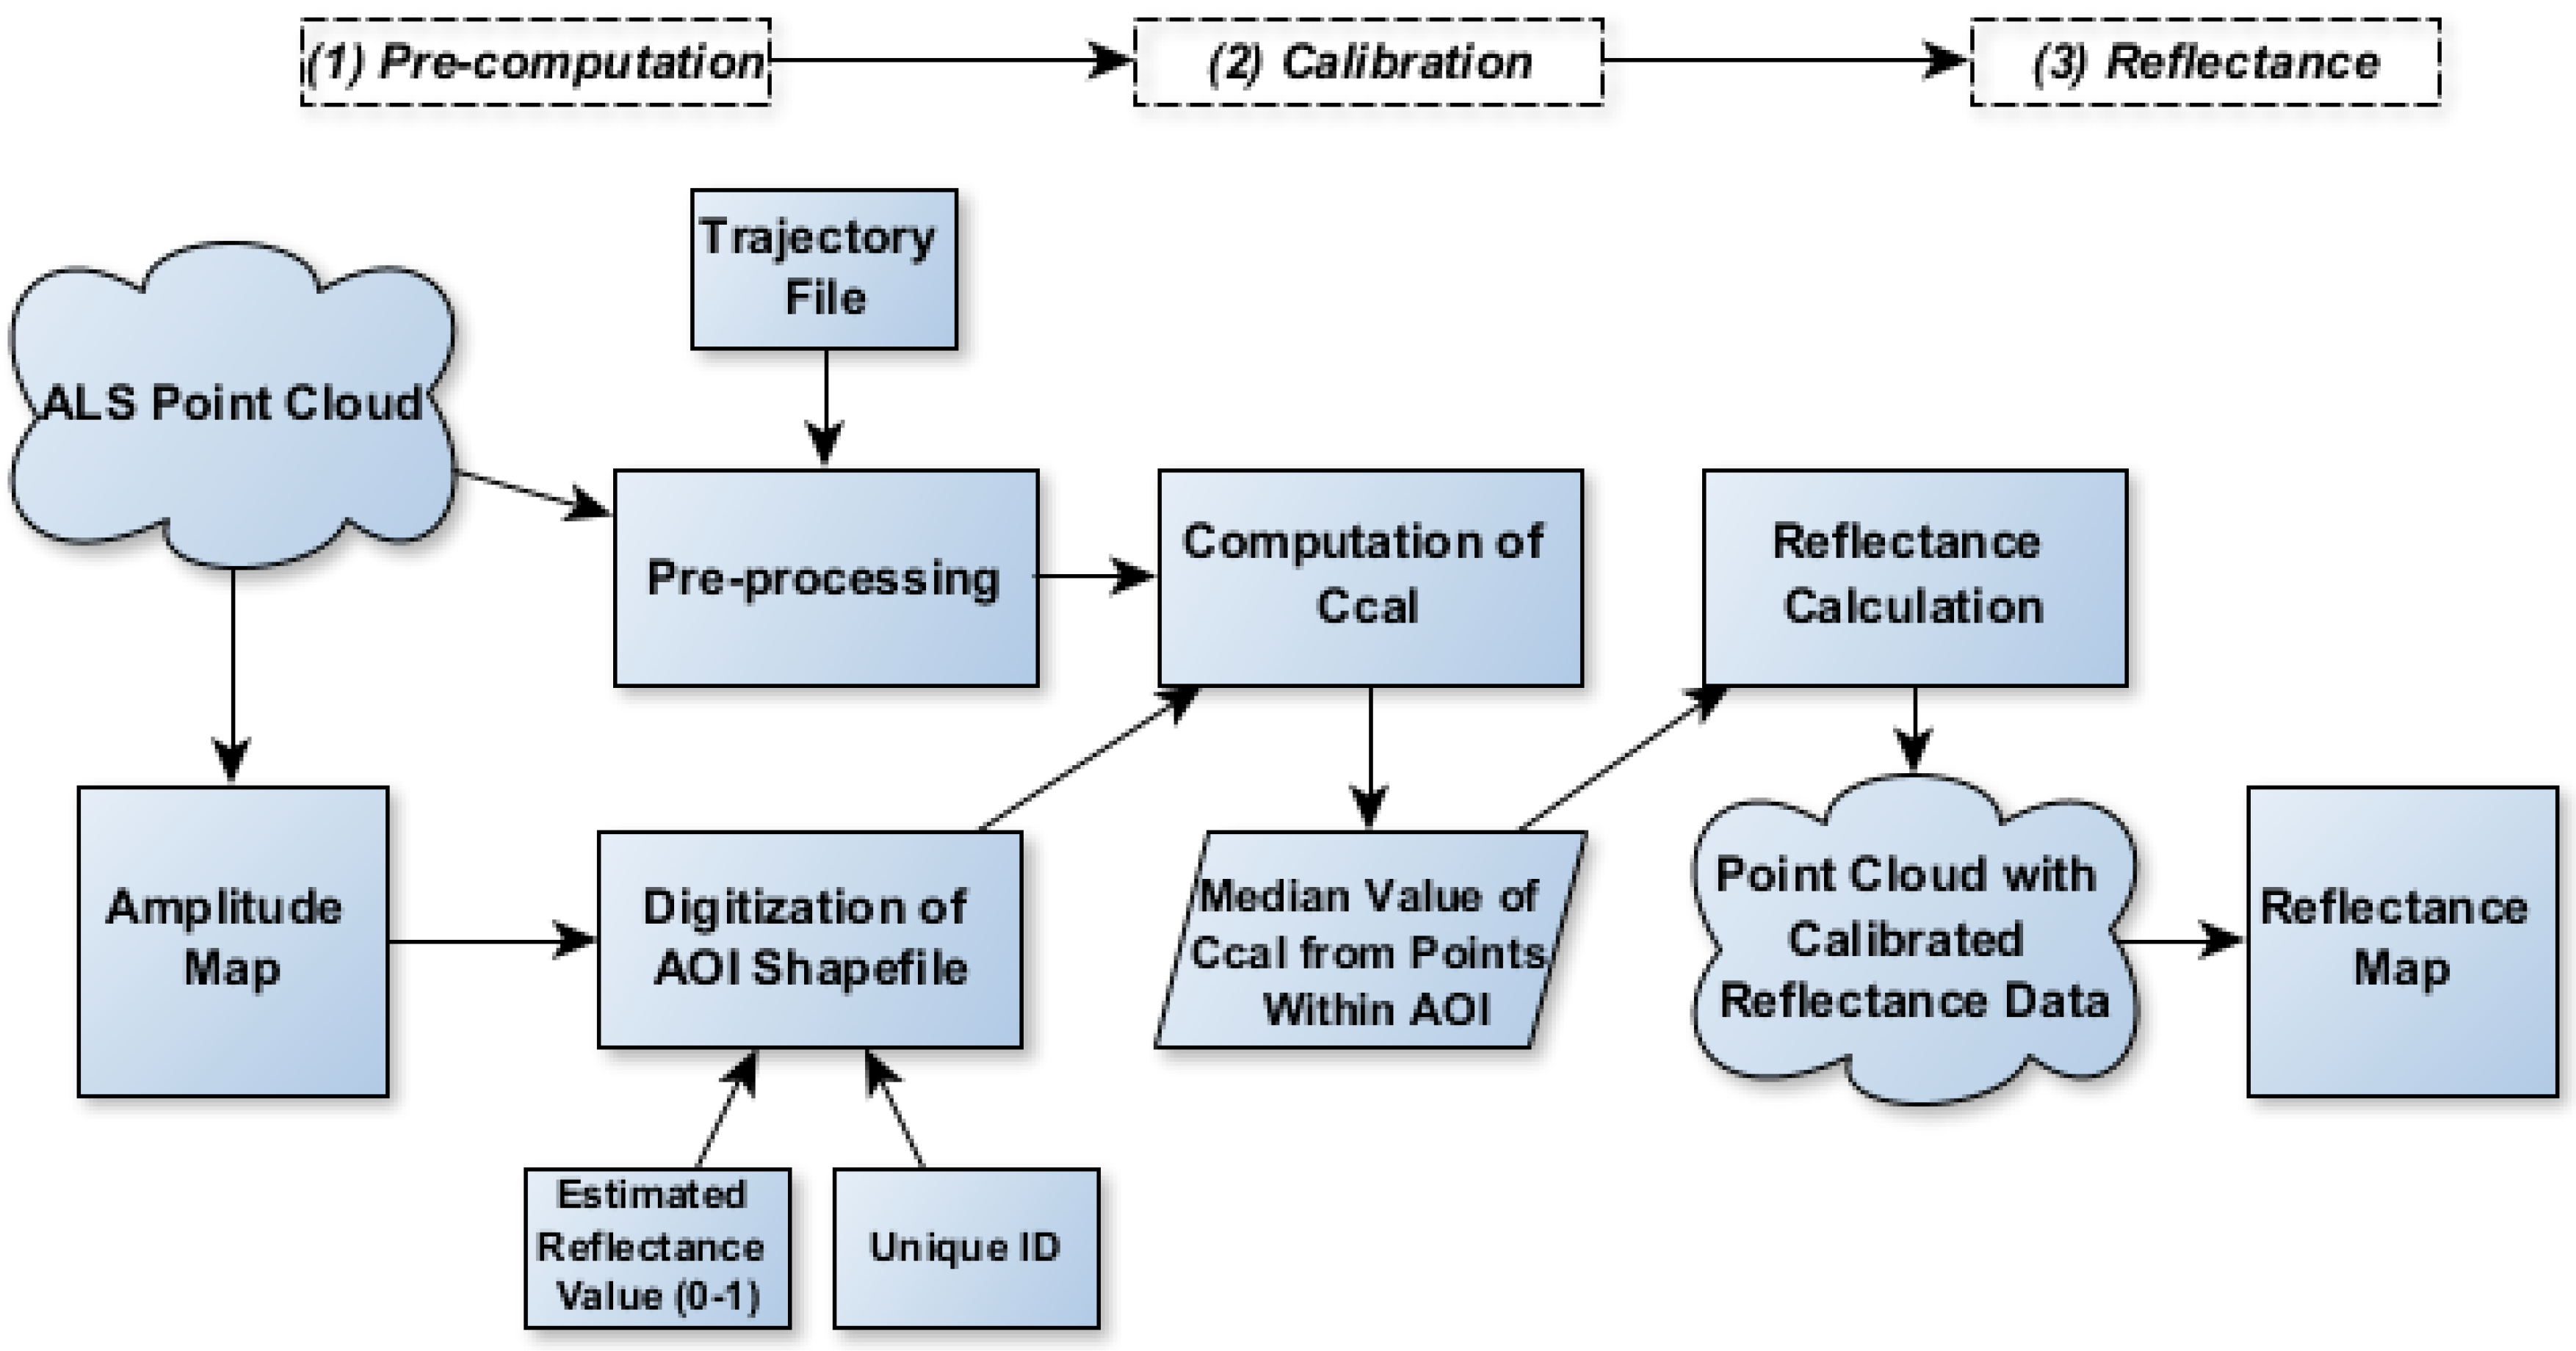
- Pre-computation: As described in Section 2.2, there are specific attributes that need to be calculated for each echo prior to derivation of the calibration constant. The principal attributes needed are the range of the laser beam and its incidence angle. The range is calculated by using the trajectory file generated during the laser scan, while the calculation of the incidence angle requires the beam vector and the local plane normal vector (Figure 5), using a robust plane interpolation of neighboring points based on the point cloud derived from the laser scan.
- Derivation of the Calibration Constant (): The calibration constant is derived by defining areas of similar, known reflectance (e.g., roofs, asphalt, or concrete), using the uncalibrated amplitude data in the form of a raster image as a guide. The areas are usually identified and chosen from on-site knowledge or, if available, from the orthoimages acquired simultaneously with the laser scan or satellite imagery. These AOIs are created as a shapefile containing the geometry of the AOI and an estimation of the surface reflectance. If the surface reflectance value is not known, values for individual material types can be acquired from online sources such as the USGS Spectral Library [26,27]. The calibration constant is calculated using the values defined in the AOI shapefile and the pre-computation data. is estimated for every point within each shape polygon, and the median value of the estimations is used for the reflectance calculation.
- Reflectance Calculation: Once the radiometric calibration constant is obtained, the reflectance attribute is calculated for all echoes. A raster grid is calculated from the output using the median values of reflectance for each cell.
4. Case Study and Data Acquisition
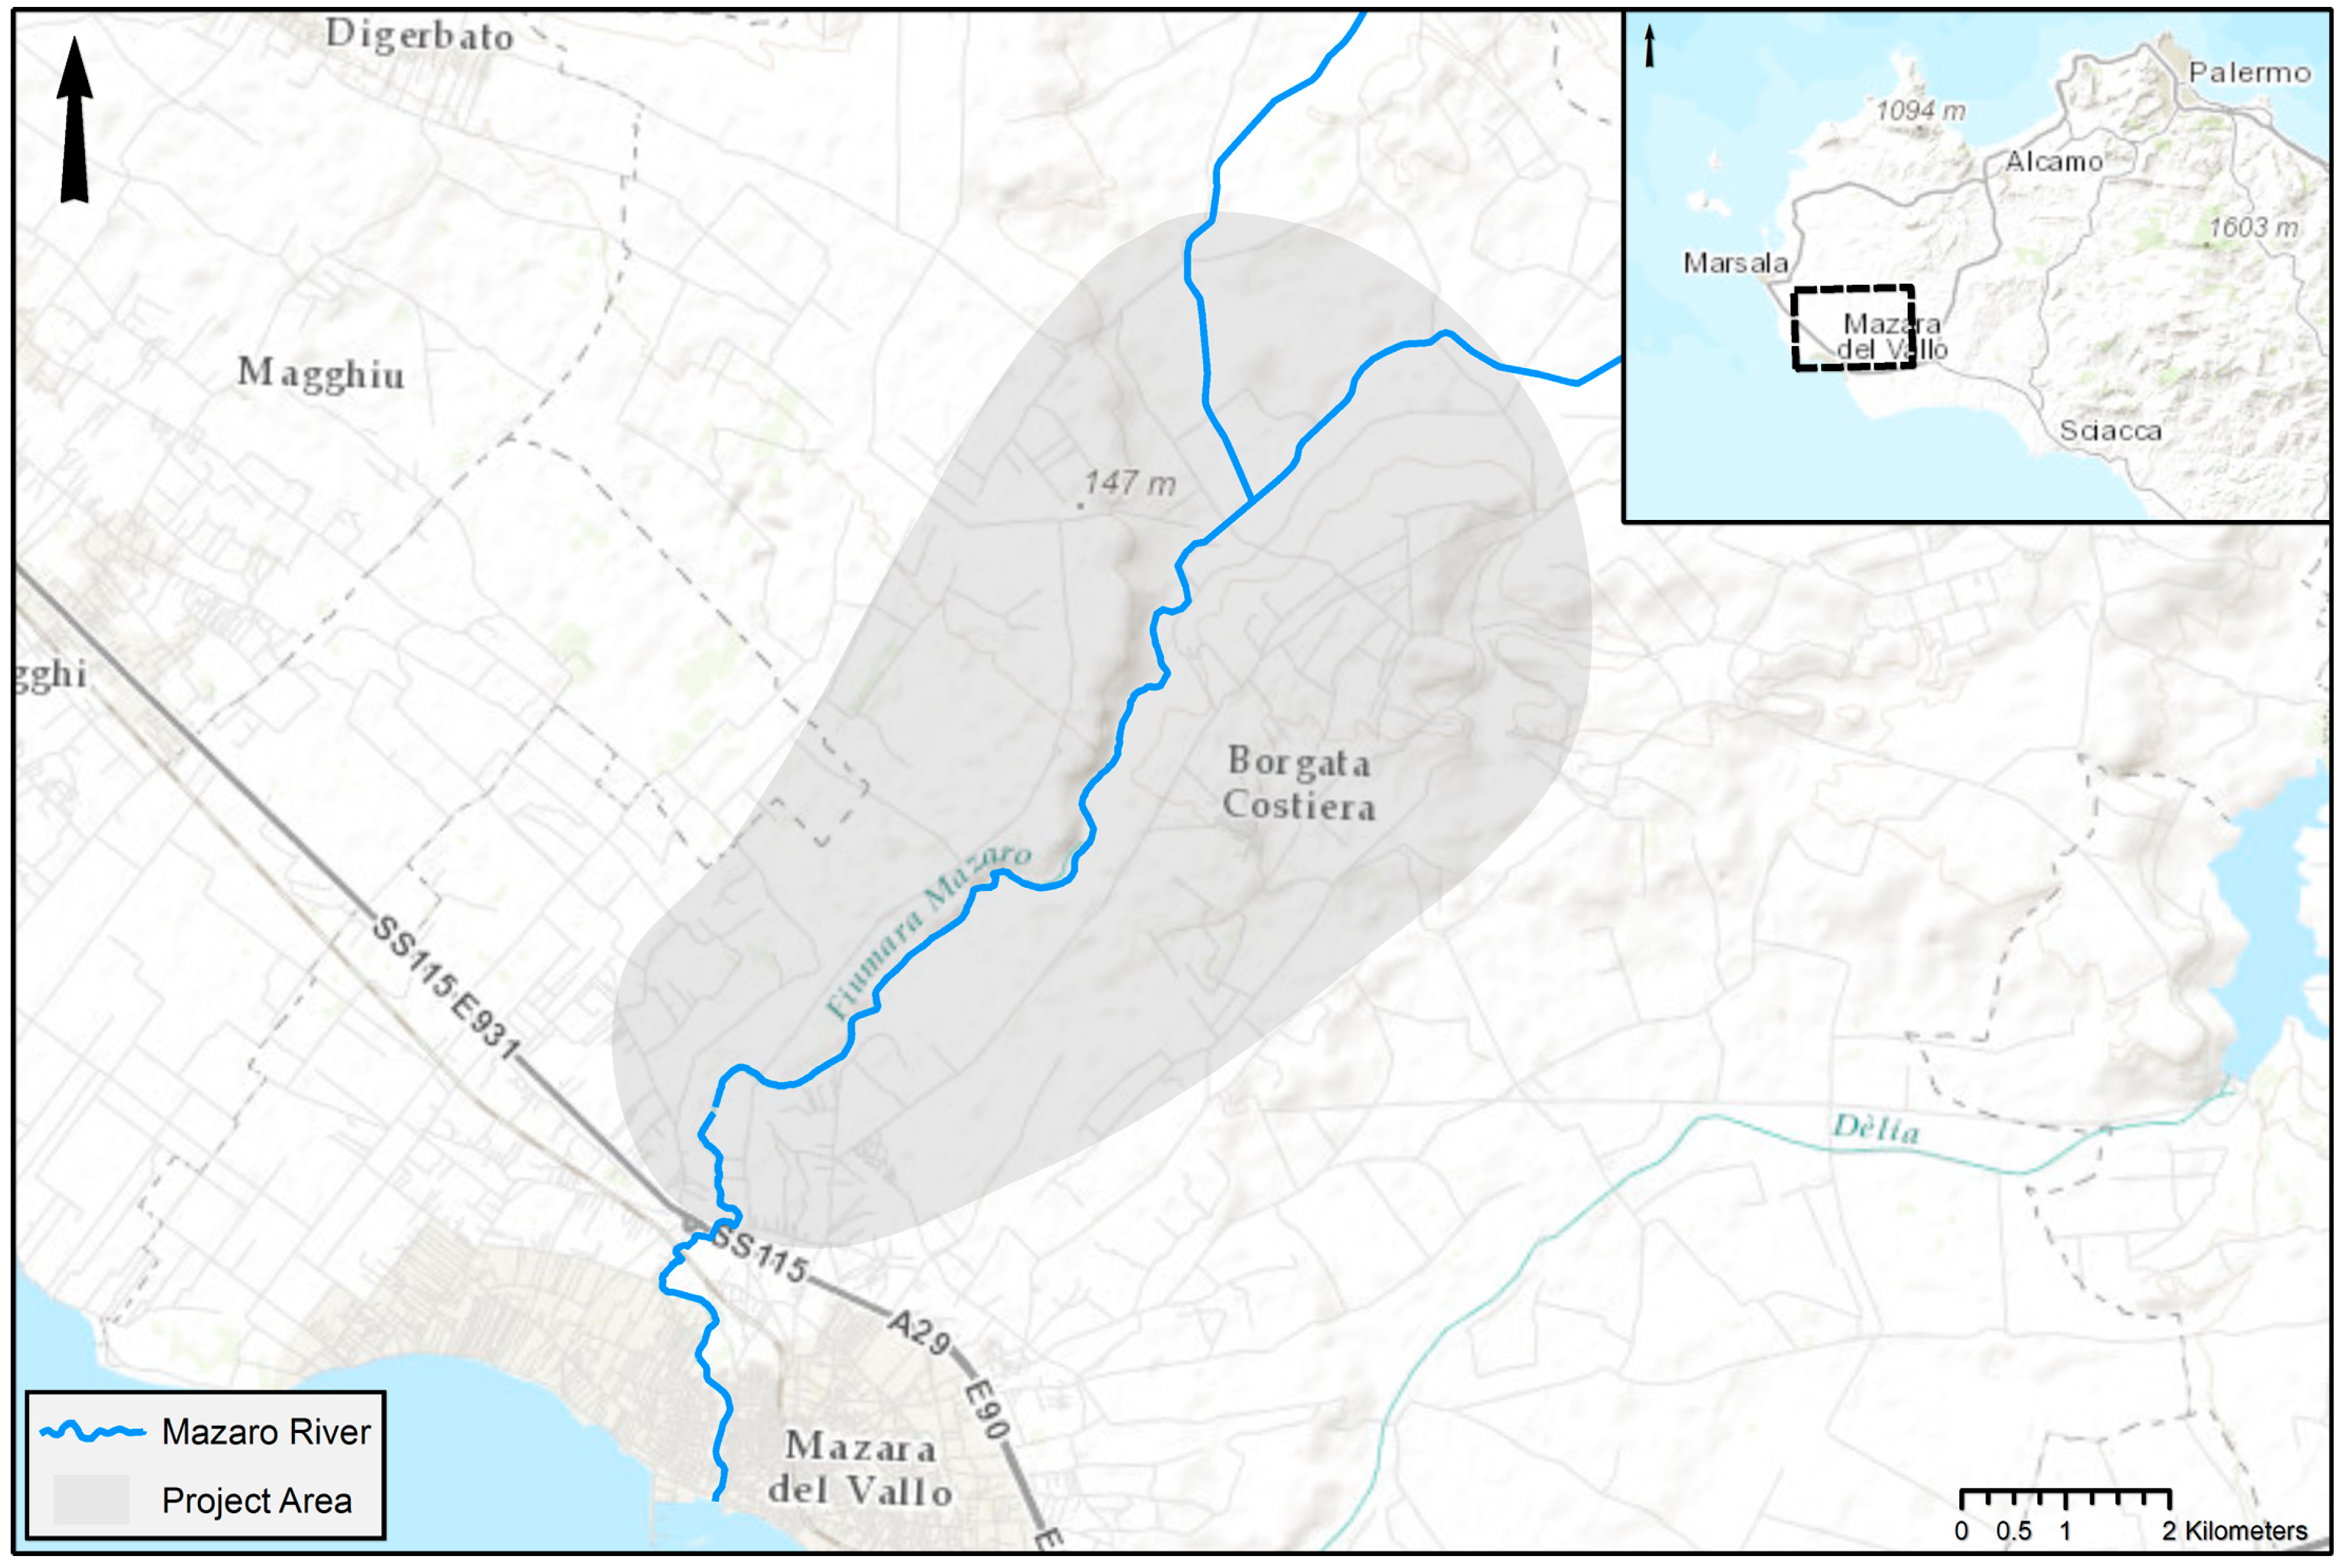
4.1. The Mazaro River Corridor, Western Sicily
4.2. Data Sets
5. Application and Results
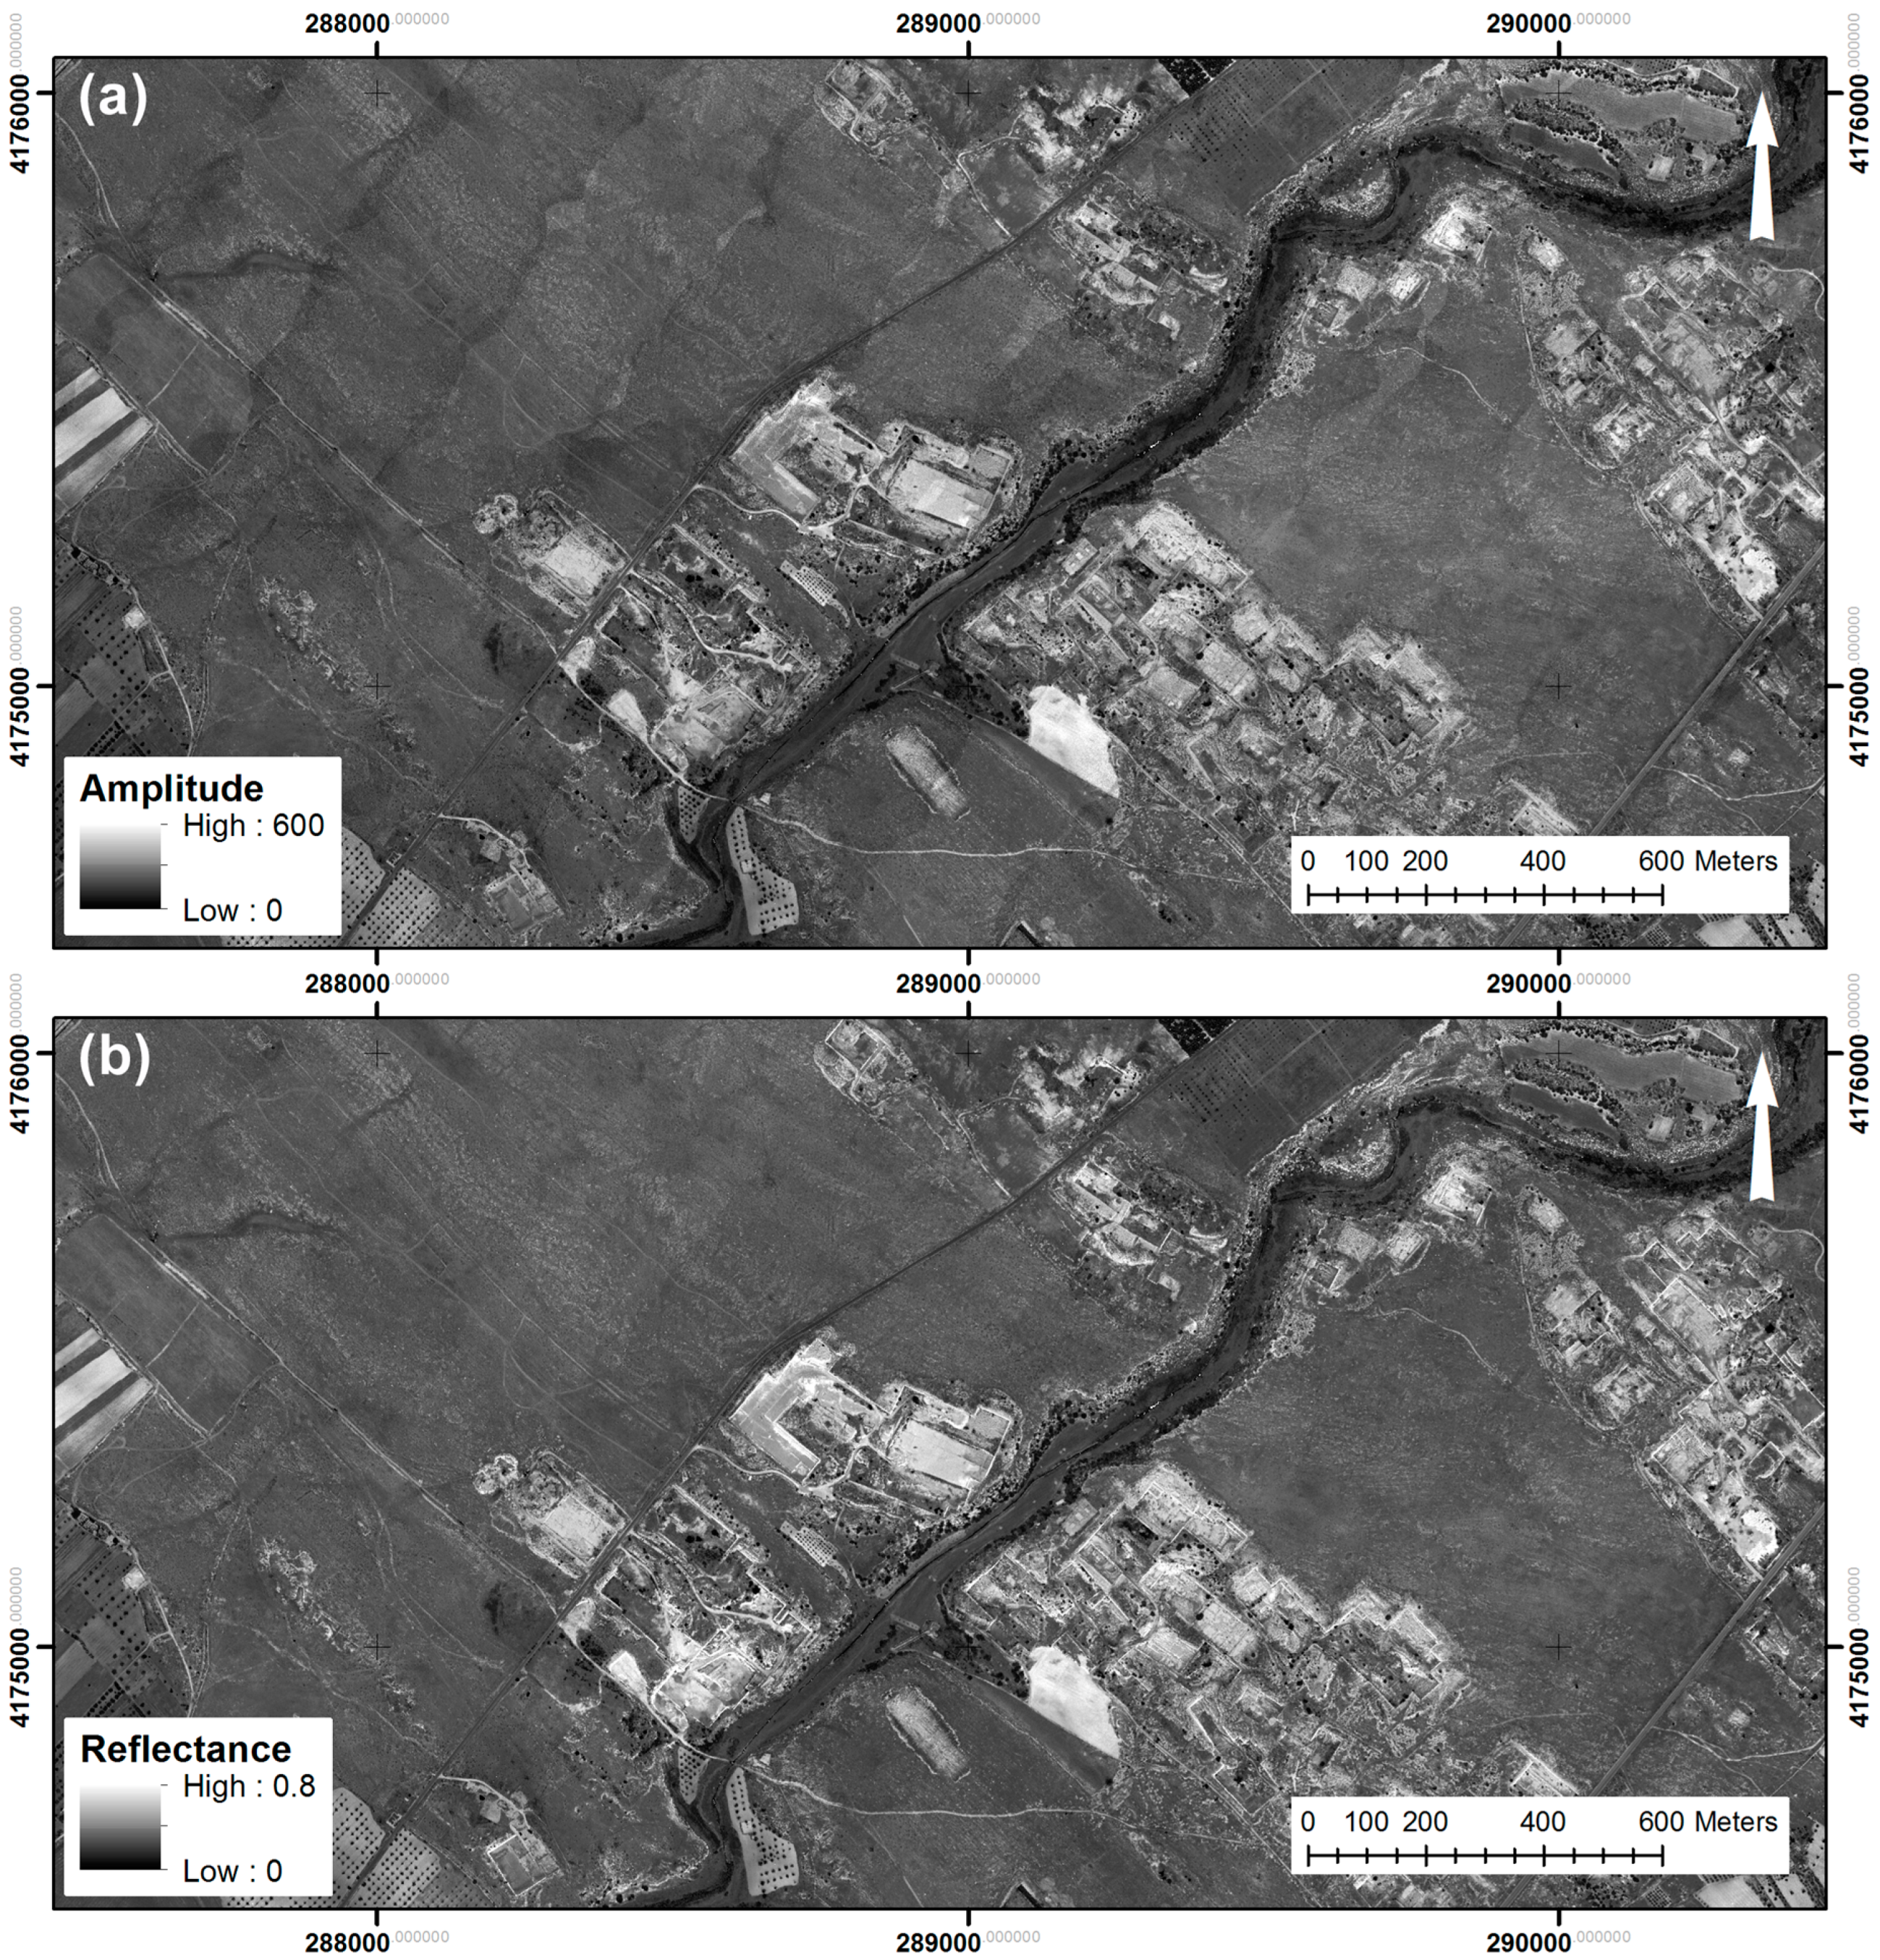
5.1. Results of the Calibration Process
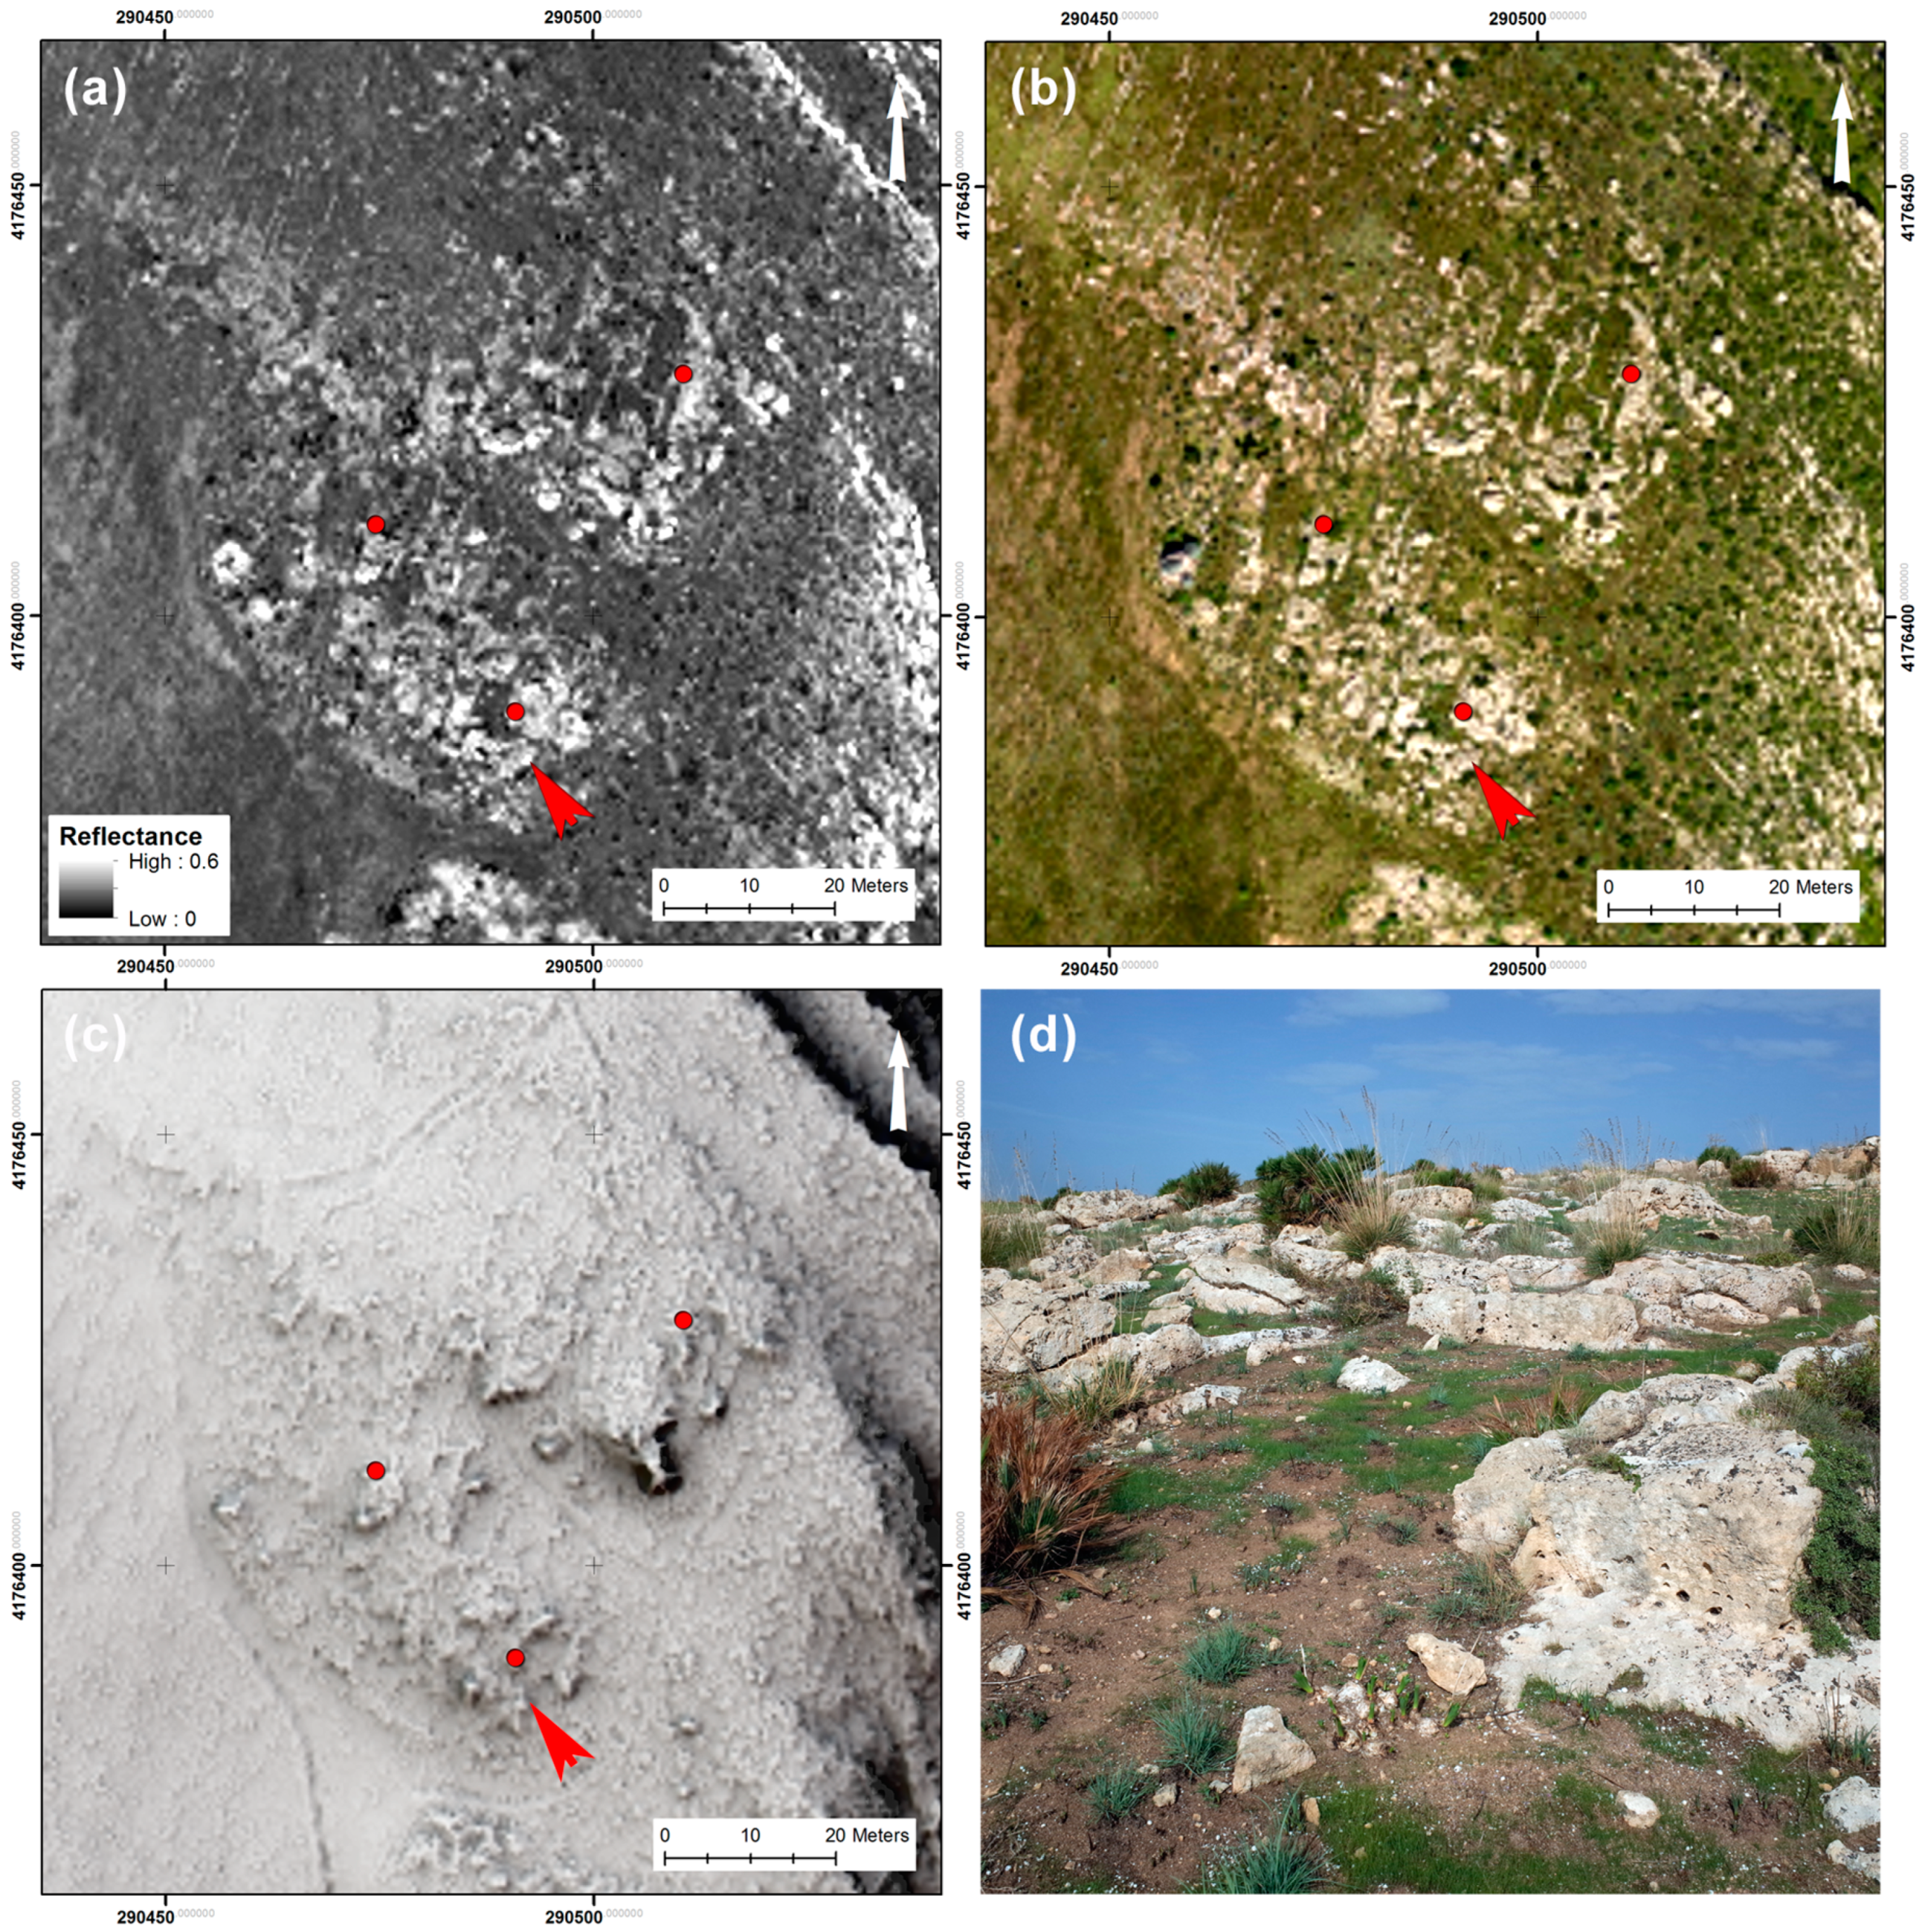
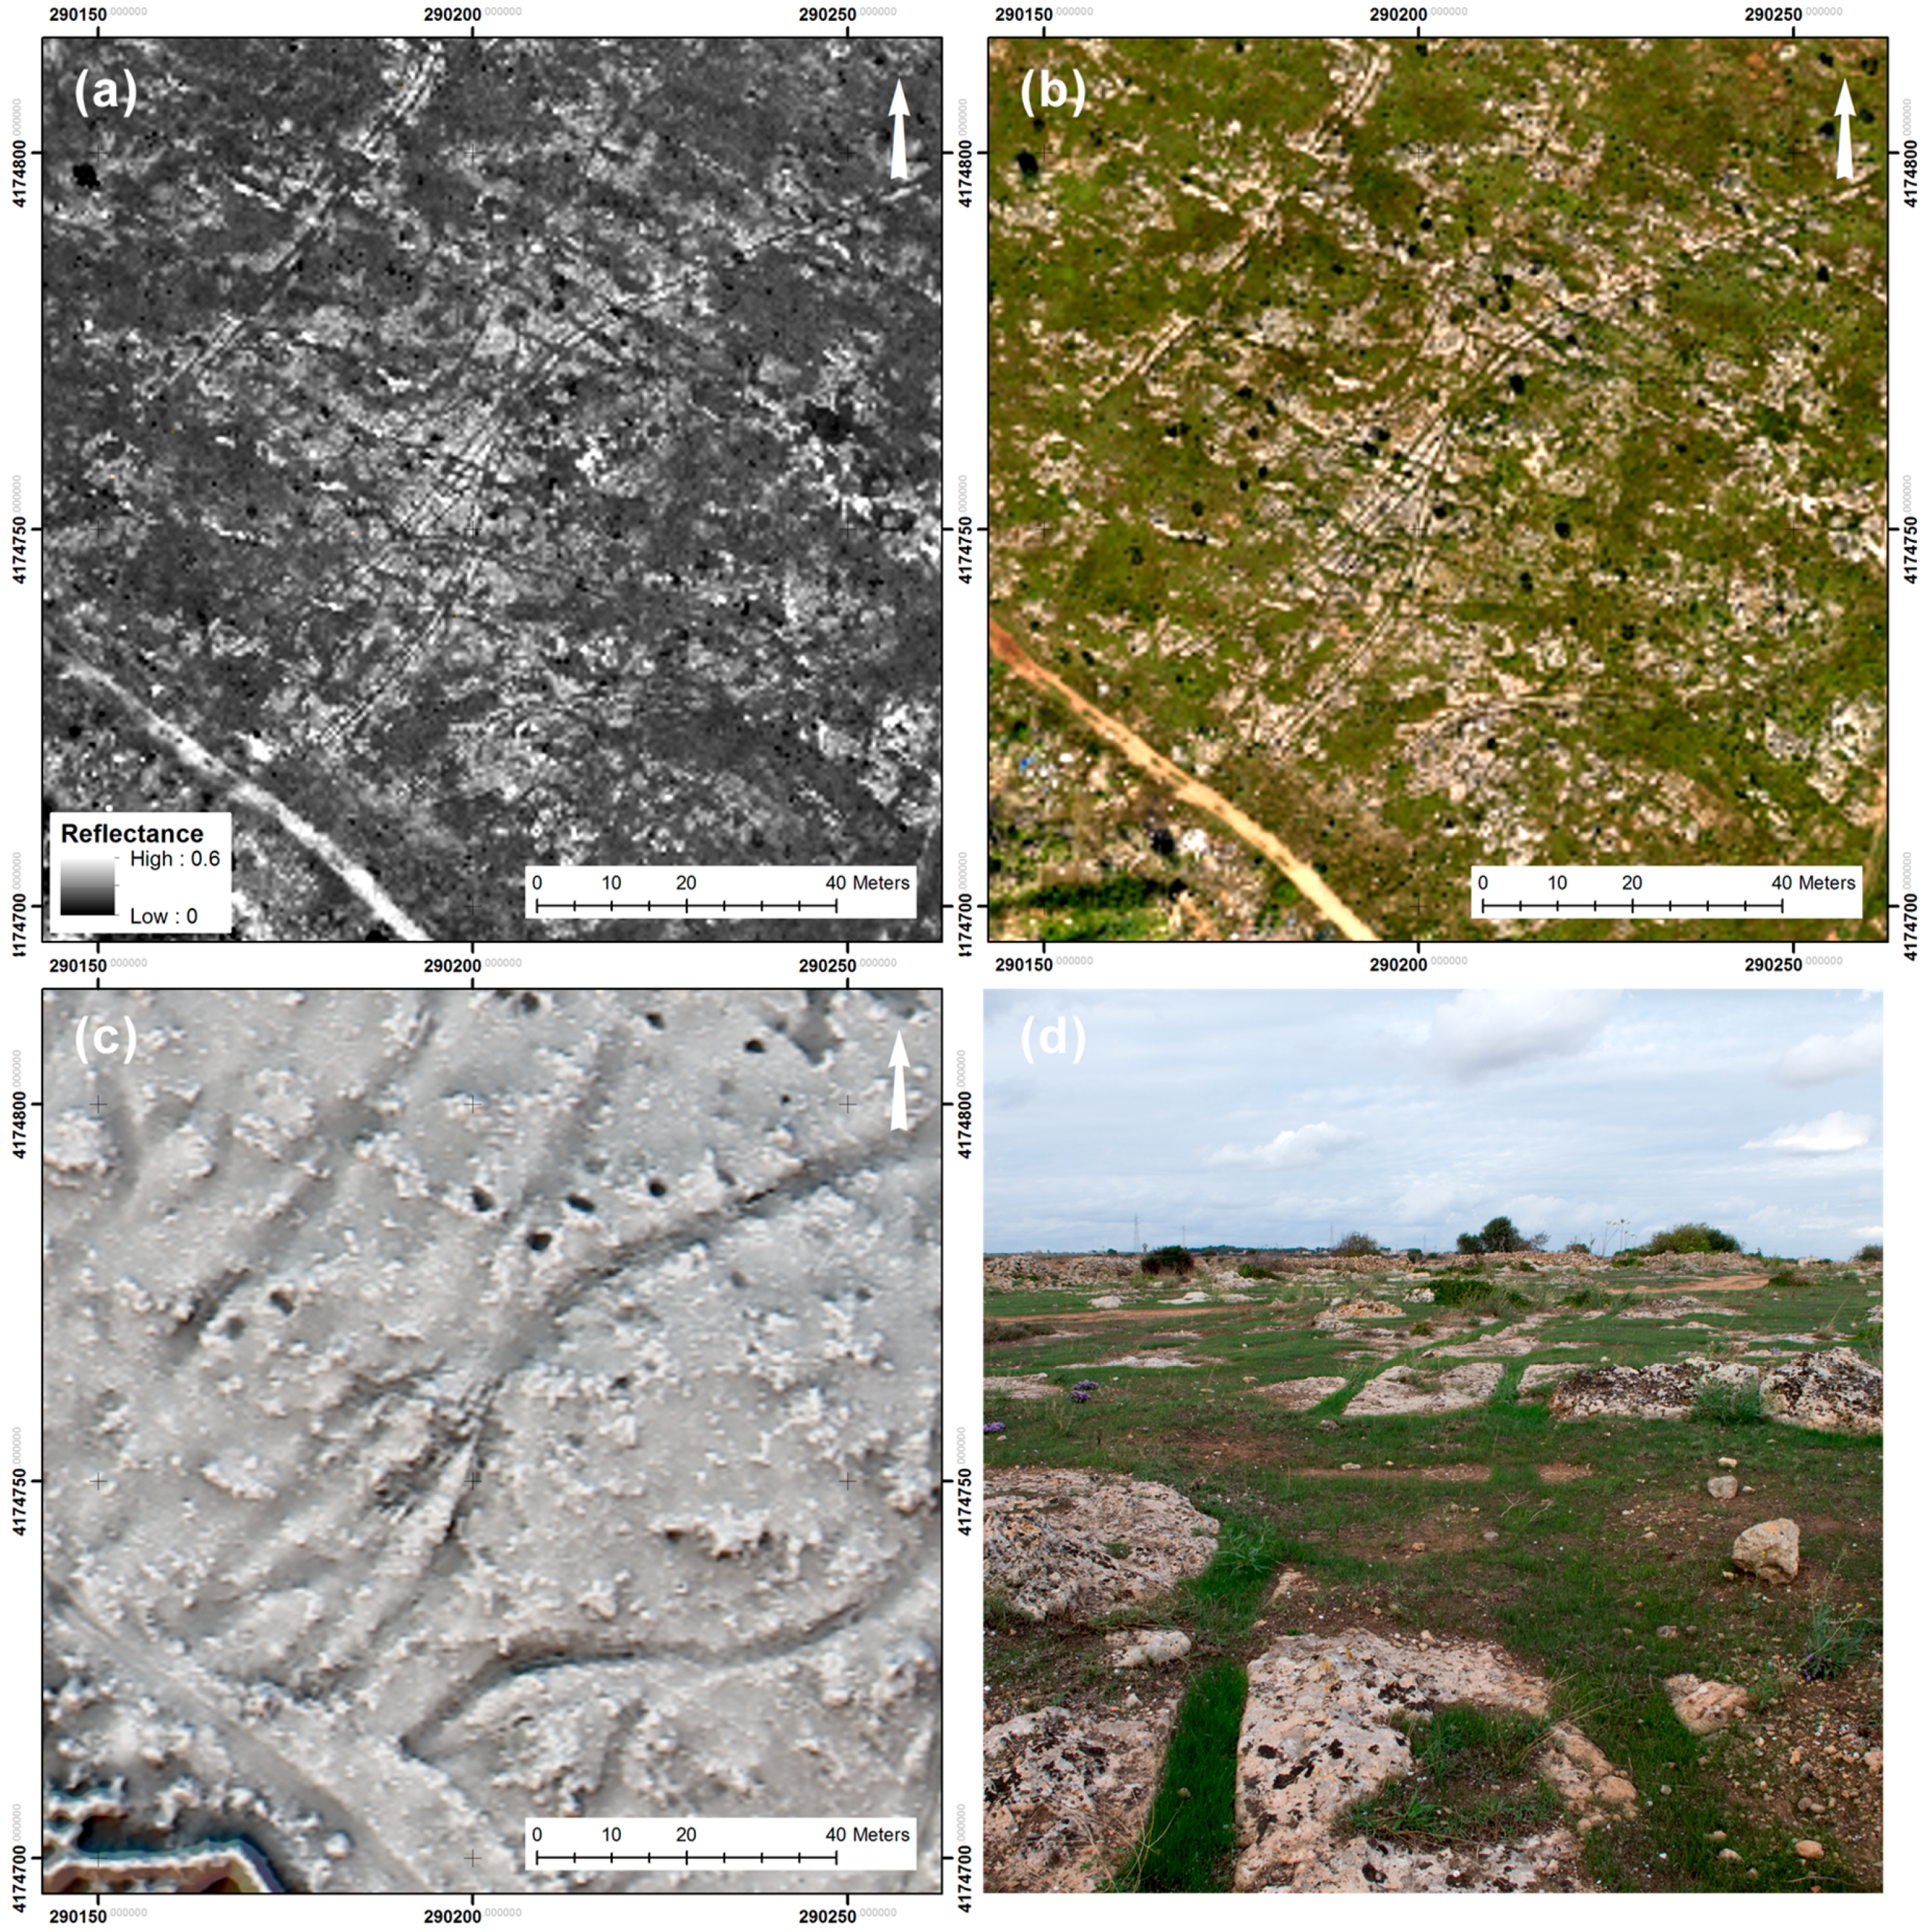
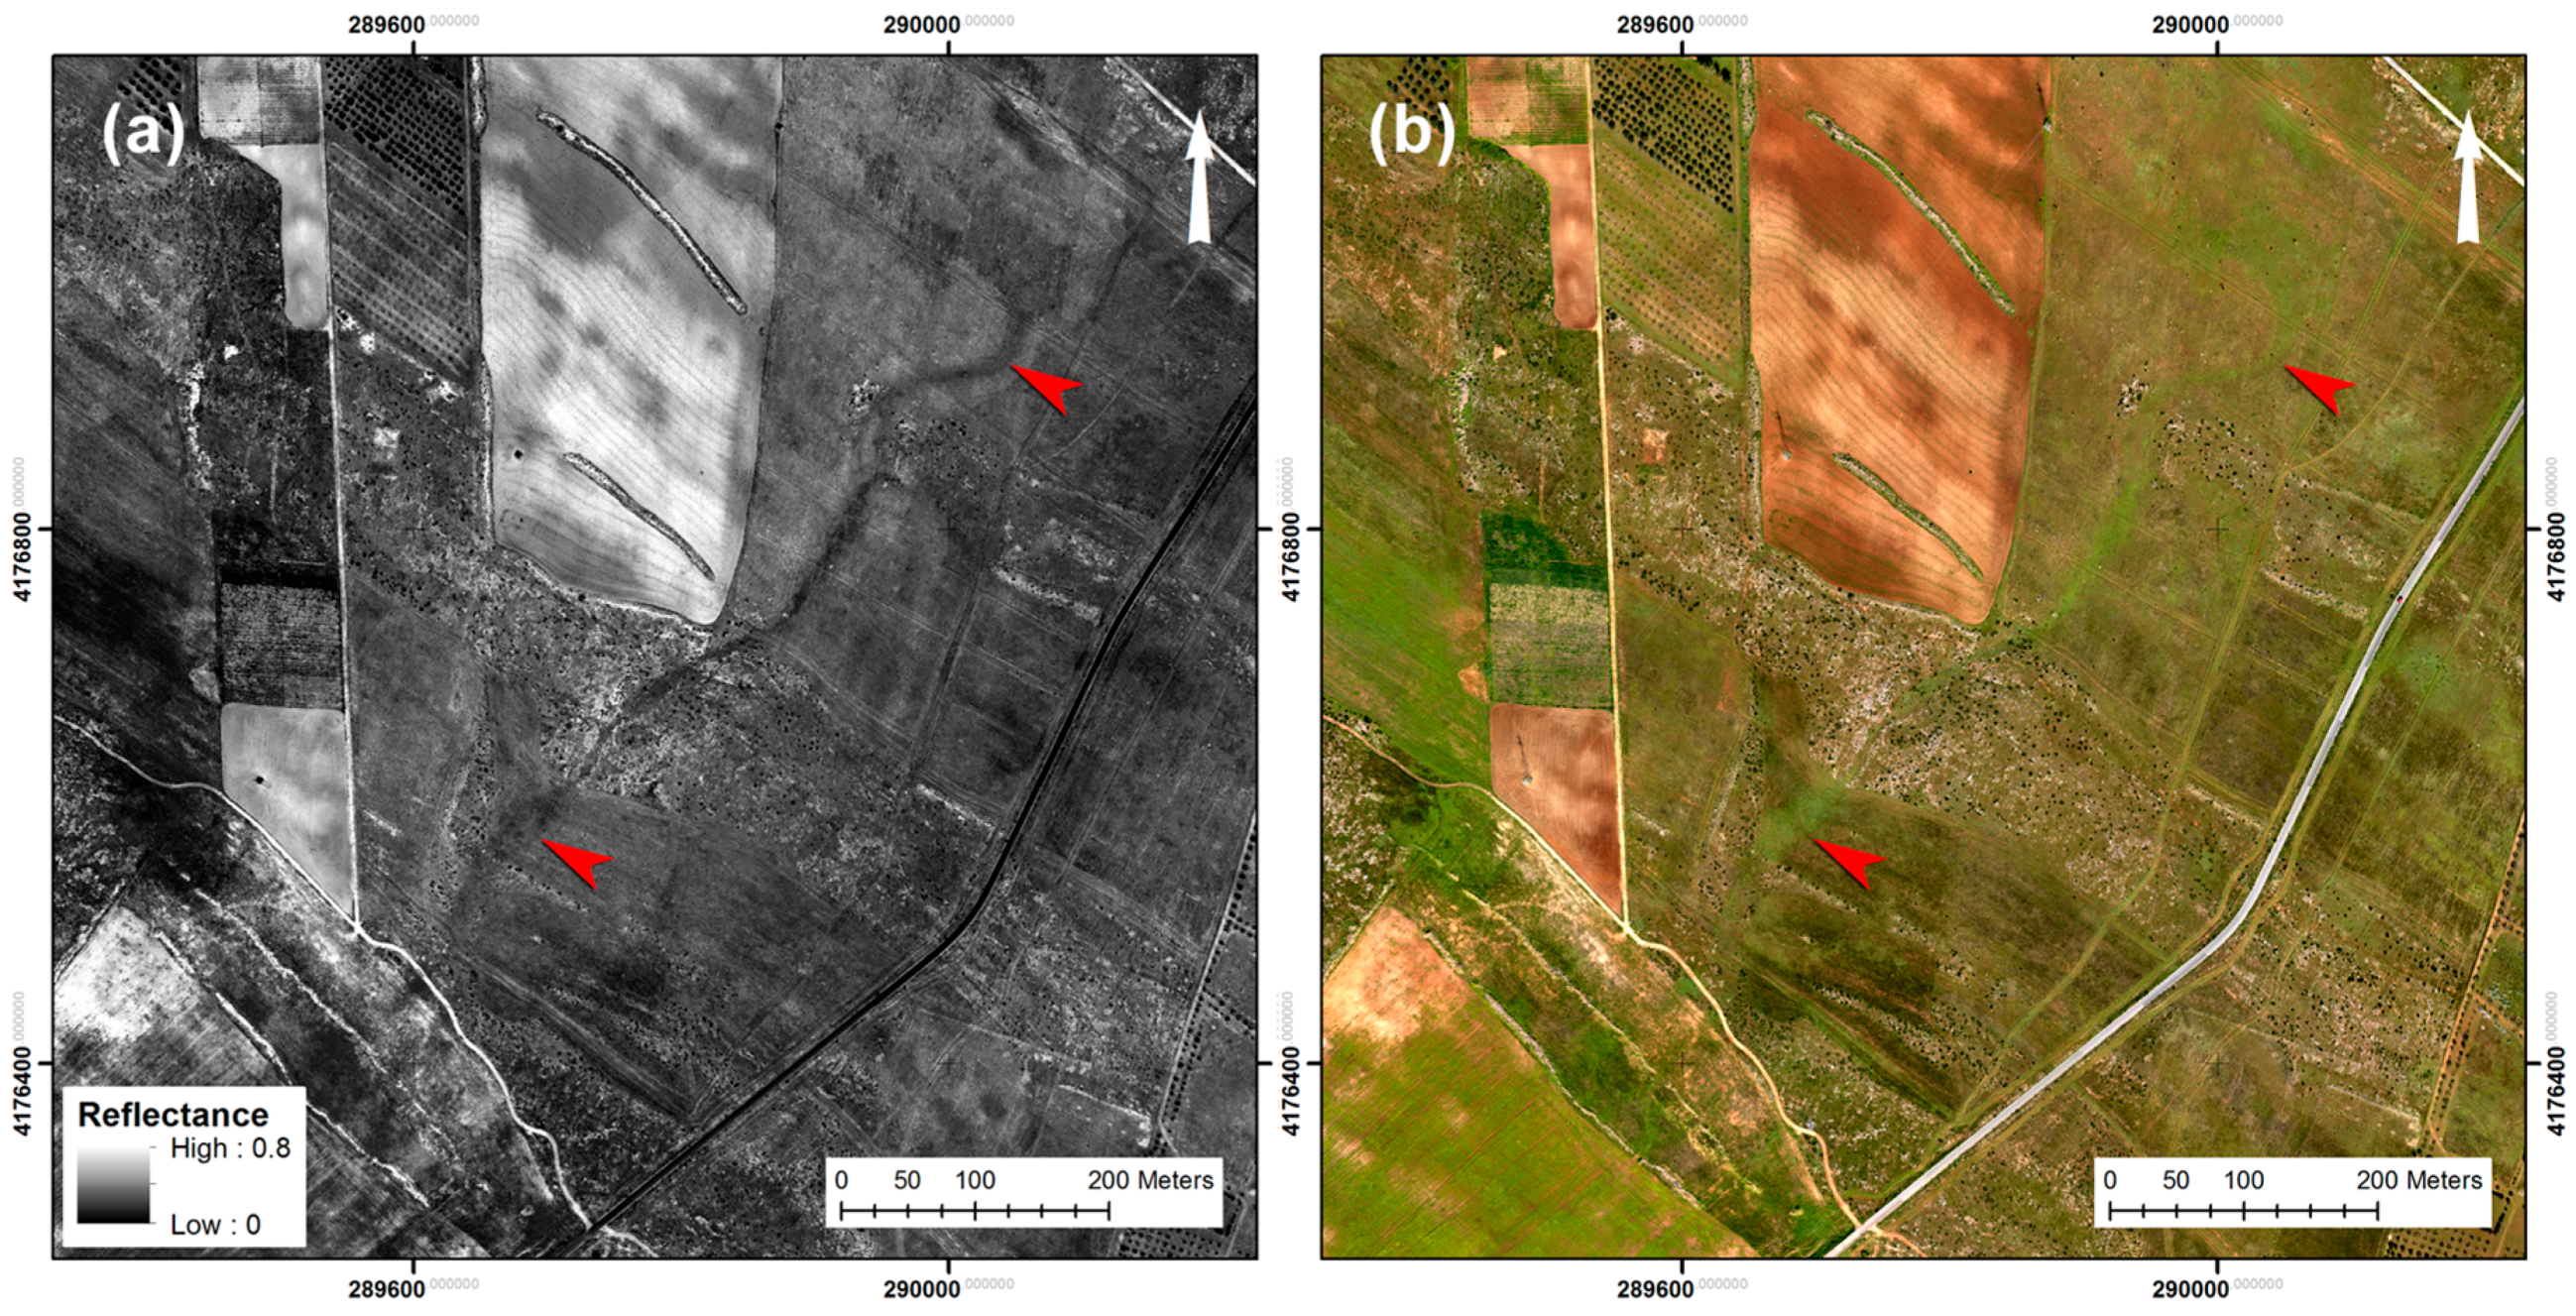
5.2. Archaeological Applications
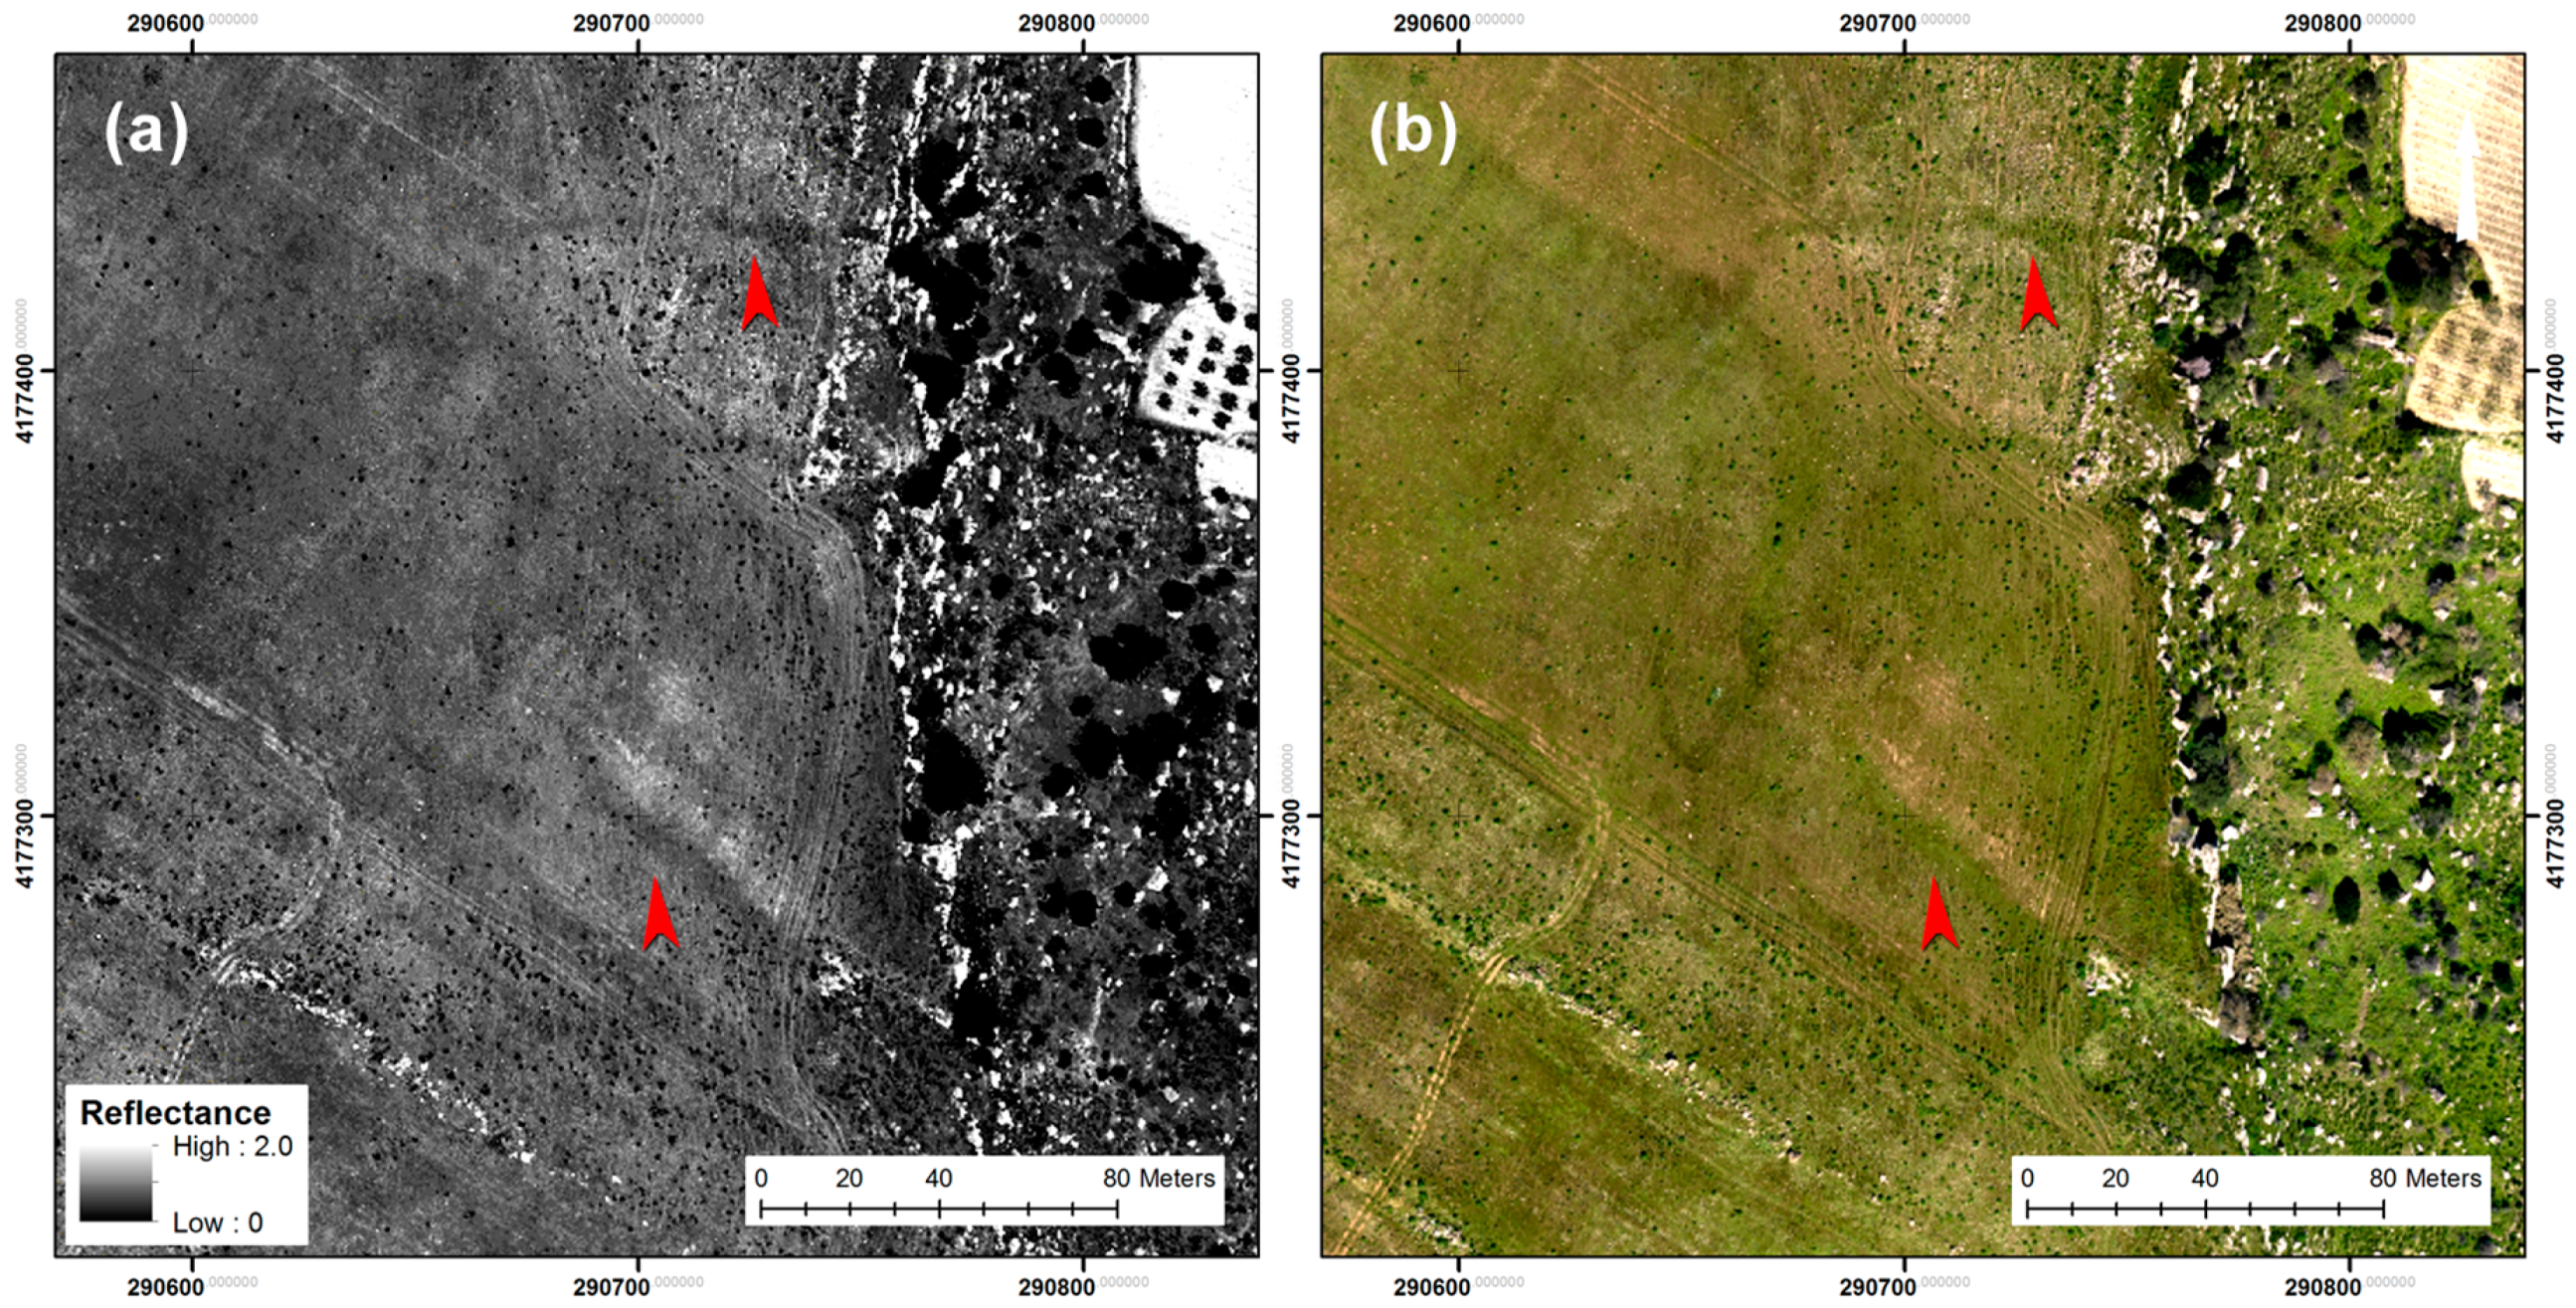
5.3. Paleoenvironmental Applications
6. Discussion and Future Research
6.1. Merits and Limits of the Calibration Approach
6.2. Archaeological and Environmental Potential
6.3. Reflections on the Future of Radiometric Data in Archaeological Research
7. Conclusions
Author Contributions
Funding
Acknowledgments
Conflicts of Interest
Appendix A
References
- Beraldin, J.; Blais, F.; Lohr, U. Laser Scanning Technology. In Airborne and Terrestrial Laser Scanning; Vosselman, G., Maas, H.-G., Eds.; Whittles Publishing: Dunbeath, Scotland, 2010; pp. 1–44. [Google Scholar]
- Briese, C.; Pfennigbauer, M.; Lehner, H.; Ullrich, A.; Wagner, W.; Pfeifer, N. Radiometric Calibration of Multi-Wavelength Airborne Laser Scanning Data. In Proceedings of the XXII ISPRS Congress—ISPRS Annals of the Photogrammetry, Remote Sensing and Spatial Information Sciences, Melbourne, Australia, 25 August–1 September 2012; pp. 335–340. [Google Scholar] [CrossRef]
- Höfle, B.; Pfeifer, N. Correction of laser scanning intensity data: Data and model-driven approaches. ISPRS J. Photogramm. Remote Sens. 2007, 62, 415–422. [Google Scholar] [CrossRef]
- Wagner, W. Radiometric calibration of small-footprint full-waveform airborne laser scanner measurements: Basic physical concepts. ISPRS J. Photogramm. Remote Sens. 2010, 65, 505–513. [Google Scholar] [CrossRef]
- Briese, C.; Pfennigbauer, M.; Ullrich, A.; Doneus, M. Radiometric Information from Airborne Laser Scanning for Archaeological Prospection. Int. J. Herit. Digit. Era 2014, 3, 159–178. [Google Scholar] [CrossRef]
- Challis, K. Airborne Lidar Intensity and Geoarchaeological Prospection in River Valley Floors. Archaeol. Prospect. 2011, 18, 1–13. [Google Scholar] [CrossRef]
- Challis, K.; Howard, A.J. The role of lidar intensity data in interpreting environmental and cultural archaeological landscapes. In Interpreting Archaeological Topography. Airborne Laser Scanning, 3D Data and Ground Observation; Opitz, R., Cowley, D., Eds.; Oxbow Books: Oxford, UK, 2013; pp. 161–170. [Google Scholar]
- Challis, K.; Howard, A.J.; Moscrop, D.; Gearey, B.; Smith, D.; Carey, C.; Thompson, A. Using airborne LiDAR intensity to predict the organic preservation of waterlogged deposits. In From Space to Place: 2nd International Conference on Remote Sensing in Archaeology. Proceedings of the 2nd International Workshop, CNR, Rome, Italy, 4–7 December 2006; Campana, S., Forte, M., Eds.; Archaeopress: Oxford, UK, 2006; pp. 93–98. [Google Scholar]
- Challis, K.; Kincey, M.; Carey, C.; Howard, A.J. Assessing the preservation potential of temperate, lowland alluvial sediments using airborne lidar intensity. J. Archaeol. Sci. 2011, 38, 301–311. [Google Scholar] [CrossRef]
- Kraus, K. Photogrammetry: Geometry from Images and Laser Scans, 2nd ed.; De Gruyter: Berlin, Germany, 2007. [Google Scholar]
- Vosselman, G.; Klein, R. Visualisation and Structuring of Point Clouds. In Airborne and Terrestrial Laser Scanning; Vosselman, G., Maas, H.-G., Eds.; Whittles Publishing: Dunbeath, Scotland, 2010; pp. 45–82. [Google Scholar]
- OPALS: Orientation and Processing of Airborne Laser Scanning Data. Available online: https://opals.geo.tuwien.ac.at/html/stable/index.html (accessed on 7 April 2019).
- Eitel, J.U.H.; Höfle, B.; Vierling, L.A.; Abellán, A.; Asner, G.P.; Deems, J.S.; Glennie, C.L.; Joerg, P.C.; LeWinter, A.; Magney, T.S.; et al. Beyond 3-D: The new spectrum of lidar applications for earth and ecological sciences. Remote Sens. Environ. 2016, 186, 372–392. [Google Scholar] [CrossRef]
- Verhoeven, G. Near-Infrared Aerial Crop Mark Archaeology: From its Historical Use to Current Digital Implementations. J. Archaeol. Method Theory 2011, 19, 132–160. [Google Scholar] [CrossRef]
- Wagner, W.; Ullrich, A.; Ducic, V.; Melzer, T.; Studnicka, N. Gaussian decomposition and calibration of a novel small-footprint full-waveform digitising airborne laser scanner. ISPRS J. Photogramm. Remote Sens. 2006, 60, 100–112. [Google Scholar] [CrossRef]
- Jelalian, A.V. Laser Radar Systems; Artech House: Boston, MA, USA, 1992. [Google Scholar]
- Koppal, S.J. Lambertian Reflectance. In Computer Vision; Ikeuchi, K., Ed.; Springer: Boston, MA, USA, 2014. [Google Scholar]
- Lambert, J.H. Photometria Sive de Mensura de Gratibus Luminis. Colorum et Umbrae. Sumptibus Viduae.; E. Klett: Augsburg, Germany, 1760. [Google Scholar]
- Doneus, M.; Briese, C.; Fera, M.; Fornwagner, U.; Griebl, M.; Janner, M.; Zingerle, M.-C. Documentation and Analysis of Archaeological Sites Using Aerial Reconnaissance and Airborne Laser Scanning. In Proceedings of the XXI International CIPA Symposium, Athens, Greece, 1–6 October 2007. [Google Scholar]
- Doneus, M.; Briese, C.; Studnicka, N. Analysis of Full-Waveform ALS Data by Simultaneously Acquired TLS Data: Towards an Advanced DTM Generation in Wooded Areas. In Proceedings of the ISPRS TC VII Symposium, Vienna, Austria, 5–7 July 2010; Wagner, W., Székely, B., Eds.; Ernst Becvar Ges.mbH: Vienna, Austria, 2010. [Google Scholar]
- Lasaponara, R.; Masini, N. Full-waveform Airborne Laser Scanning for the detection of medieval archaeological microtopographic relief. J. Cult. Herit. 2009, 10, 78–82. [Google Scholar] [CrossRef]
- Lasaponara, R.; Coluzzi, R.; Masini, N. Flights into the past: Full-waveform airborne laser scanning data for archaeological investigation. J. Archaeol. Sci. 2011, 38, 2061–2070. [Google Scholar] [CrossRef]
- Opitz, R.; Cowley, D.C. (Eds.) Interpreting Archaeological Topography; Oxbow Books: Oxford, UK, 2013. [Google Scholar]
- Coren, F.; Visintini, D.; Prearo, G.; Sterzai, P. Integrating LiDAR intensity measures and hyperspectral data for extracting of cultural heritage. In Proceedings of the Italy–Canada 2005 Workshop on 3D Digital Imaging and Modeling: Applications of Heritage, Industry, Medicine and Land, Padova, Italy, 17–18 May 2005. [Google Scholar]
- Luzum, B.; Starek, M.; Slatton, K.C. 2004 Normalizing ALSM Intensities; Geosensing Engineering and Mapping (GEM) Center Report No. Rep_2004-07-01; Civil and Coastal Engineering Department, University of Florida: Gainesville, FL, USA, 2004. [Google Scholar]
- Kokaly, R.F.; Clark, R.N.; Swayze, G.A.; Livo, K.E.; Hoefen, T.M.; Pearson, N.C.; Wise, R.A.; Benzel, W.M.; Lowers, H.A.; Driscoll, R.L.; et al. USGS Spectral Library Version 7: U.S. Geological Survey Data Series 1035; United States Geological Survey: Reston, VA, USA, 2017. [CrossRef]
- United States Geological Survey Spectral Library Version 7. Available online: https://speclab.cr.usgs.gov/spectral-lib.html (accessed on 27 February 2019).
- United States Geological Survey Spectral Library Version 7: Asphalt GDS376 Black_Road Old ASDFRa AREF. Available online: https://crustal.usgs.gov/speclab/data/GIFplots/GIFplots_splib07a/ChapterA_ArtificialMaterials/splib07a_Asphalt_GDS376_Blck_Road_old_ASDFRa_AREF.gif (accessed on 27 February 2019).
- OPALS: Orientation and Processing of Airborne Laser Scanning Data: Module RadioCal. Available online: https://opals.geo.tuwien.ac.at/html/stable/ModuleRadioCal.html (accessed on 7 April 2019).
- OPALS: Orientation and Processing of Airborne Laser Scanning Data: Module Cell. Available online: https://opals.geo.tuwien.ac.at/html/stable/ModuleCell.html (accessed on 7 April 2019).
- The Prospecting Boundaries Project. Available online: http://mazaro.univie.ac.at (accessed on 27 February 2019).
- Calafato, B.; Tusa, S.; Mammina, G. Uomo e Ambiente Nella Storia di Mazara del Vallo—Indagine Topografica Nell’agro Mazarese; Grafistampa Palermo: Palermo, Italy, 2001. [Google Scholar]
- Di Stefano, C.A. Testimonianze archeologiche di età Arcaica e Classica da Mazara del Vallo. Kokalos 2016, LIII, 35–52. [Google Scholar] [CrossRef]
- Fentress, E.; Kennet, D.; Valenti, I. A Sicilian Villa and its Landscape. Opus 1986, 5, 75–95. [Google Scholar]
- Leighton, R. Sicily before History: An Archaeological Survey from the Palaeolithic to the Iron Age; Duckworth: London, UK, 1999. [Google Scholar]
- Mannino, G. Appunti di ricognizioni archeologiche. Sicil. Archeol. 1971, 4, 41–46. [Google Scholar]
- Tusa, S. La Sicilia Nella Preistoria, 2nd ed.; Sellerio Editore: Palermo, Italy, 1999. [Google Scholar]
- Tusa, S. Fenici, Indigeni ed Elimi alla luce delle nuove scoperte. In Proceedings of the Atti del V Congresso Internazionale di Studi Fenici e Punici, Marsala, Palermo, 2–8 October 2005; pp. 533–549. [Google Scholar]
- Blake, E.; Schon, R. The Marsala Hinterland Survey: Preliminary Report. Etruscan Stud. 2010, 13, 49–66. [Google Scholar] [CrossRef]
- Spanò Giammellaro, A.; Spatafora, F.; van Dommelen, P. Sicily and Malta: Between Sea and Countryside. In Rural Landscapes of the Punic World; van Dommelen, P., Gómez Bellard, C., Eds.; Equinox: Landon, UK, 2008; pp. 129–158. [Google Scholar]
- Sevara, C.; Doneus, M.; Draganits, E.; Cusumano, R.; Frazzetta, C.; Palermo, B.; Pisciotta, F.; Stallone, R.; Totschnig, R.; Tusa, S.; et al. Testing Boundaries: Integrated Prospection from Site to Landscape in Western Sicily. In Proceedings of the AP2017: 12th International Conference of Archaeological Prospection, Bradford, UK, 12–16 September 2017; Jennings, B., Gaffney, C., Sparrow, T., Gaffney, S., Eds.; Archaeopress: Oxford, UK, 2017; pp. 230–232. [Google Scholar]
- Sevara, C.; Verhoeven, G.; Doneus, M.; Draganits, E. Surfaces from the Visual Past: Recovering High-Resolution Terrain Data from Historic Aerial Imagery for Multitemporal Landscape Analysis. J. Archaeol. Method Theory 2018, 25, 611–642. [Google Scholar] [CrossRef] [PubMed]
- Riegl LMS-Q680i: Long-Range Airborne Laser Scanner for Full Waveform Analysis. Available online: http://www.riegl.com/uploads/tx_pxpriegldownloads/10_DataSheet_LMS-Q680i_28-09-2012_01.pdf (accessed on 27 February 2019).
- Terrasolid Ltd. Terrascan—Software for LiDAR Data Processing and 3D Vector Data Creation. Available online: http://www.terrasolid.com/products/terrascanpage.php (accessed on 27 February 2019).
- Mottershead, D.; Pearson, A.; Schaefer, M. The cart ruts of Malta: An applied geomorphology approach. Antiquity 2008, 82, 1065–1079. [Google Scholar] [CrossRef]
- Trump, D.H.; Cilia, D. Cart-Ruts and Their Impact on the Maltese Landscape; Heritage Books: Sta. Venera, Malta, 2008. [Google Scholar]
- Rodrigues, F.; Madruga, J.; Martins, N.; Cardoso, F. Dating the Cart-Ruts of Terceira Island, Azores, Portugal. Archaeol. Discov. 2018, 6, 279–299. [Google Scholar] [CrossRef]
- Doneus, M. Aerial archaeology in the area of Mazara del Vallo, Sicily. Report of the reconnaissance seasons 2003–2004. Archeol. AereaStudi Di Aerotopografia Aerea 2007, 2, 269–284. [Google Scholar]
- University of Vienna Aerial Archive, Resources Page. Available online: https://luftbildarchiv.univie.ac.at/resources/ (accessed on 7 April 2019).
- University of Vienna Aerial Archive, Radiometric Calibration of ALS Data. Available online: https://luftbildarchiv.univie.ac.at/resources/software/radiometric-calibration-of-als-data/ (accessed on 12 April 2019).
- Brugioni, D.A. The Serendipity Effect of Aerial Reconnaissance. Interdiscip. Sci. Rev. 1989, 14, 16–28. [Google Scholar] [CrossRef]
- Hug, C.; Wehr, A. Detecting and identifying topographic objects in laser altimeter data. Int. Arch. Photogramm. Remote Sens. Spat. Inf. Sci. 1997, 32, 19–26. [Google Scholar]
- Verhoeven, G.; Nowak, M.; Nowak, R. Pixel-level image fusion for archaeological interpretative mapping. In Proceedings of the 8th International Congress on Archaeology, Computer Graphics, Cultural Heritage and Innovation, Valencia, Spain, 5–7 September 2016; Lerma, J.L., Cabrelles, M., Eds.; Editorial Universitat Politècnica de València: València, Spain, 2016; pp. 404–407. [Google Scholar]
- Rottensteiner, F.; Trinder, J.; Clode, S.; Kubik, K. Using the Dempster-Shafer method for the fusion of LIDAR data and multi-spectral images for building detection. Inf. Fus. 2005, 6, 283–300. [Google Scholar] [CrossRef]
- Verhoeven, G. BRDF and its Impact on Aerial Archaeological Photography. Archaeol. Prospect. 2017, 24, 133–140. [Google Scholar] [CrossRef]


| Laser Scanner: Riegl LMS-Q680i Full Waveform | RGB Camera: IGI Digicam H-39 | ||
|---|---|---|---|
| Unfiltered Point-Density (per m2) | 16 | Array Size | 39 MP |
| Strip Overlap | 20% | Detector Pitch | 6.8 µm |
| Scan angle (whole FOV) | 60° | Image Size | 7216 × 5412 px |
| Flying height (AGL) | 511 m | Focal Length | 50 mm |
| Speed of aircraft (TAS) | 110 knots | Ground Sample Distance | 8 cm |
| Laser Pulse Rate | 400,000 Hz | Overlap (Side/Forward) | 30/60% |
| Measurement Rate (max) | 266,000 Hz | Exposure Time (s) | 1/750 |
| Scan Lines per second | 169 | Aperture | f/5 |
| Laser Wavelength | 1550 nm (SWIR) | Image Color Mode | RGB |
| Strip Adjustment/Error | Yes, 0.0128 m (std. deviation) | ||
| Filtering | Robust interpolation (OPALS) | ||
| Reflectance Image Resolution | 50 cm | ||
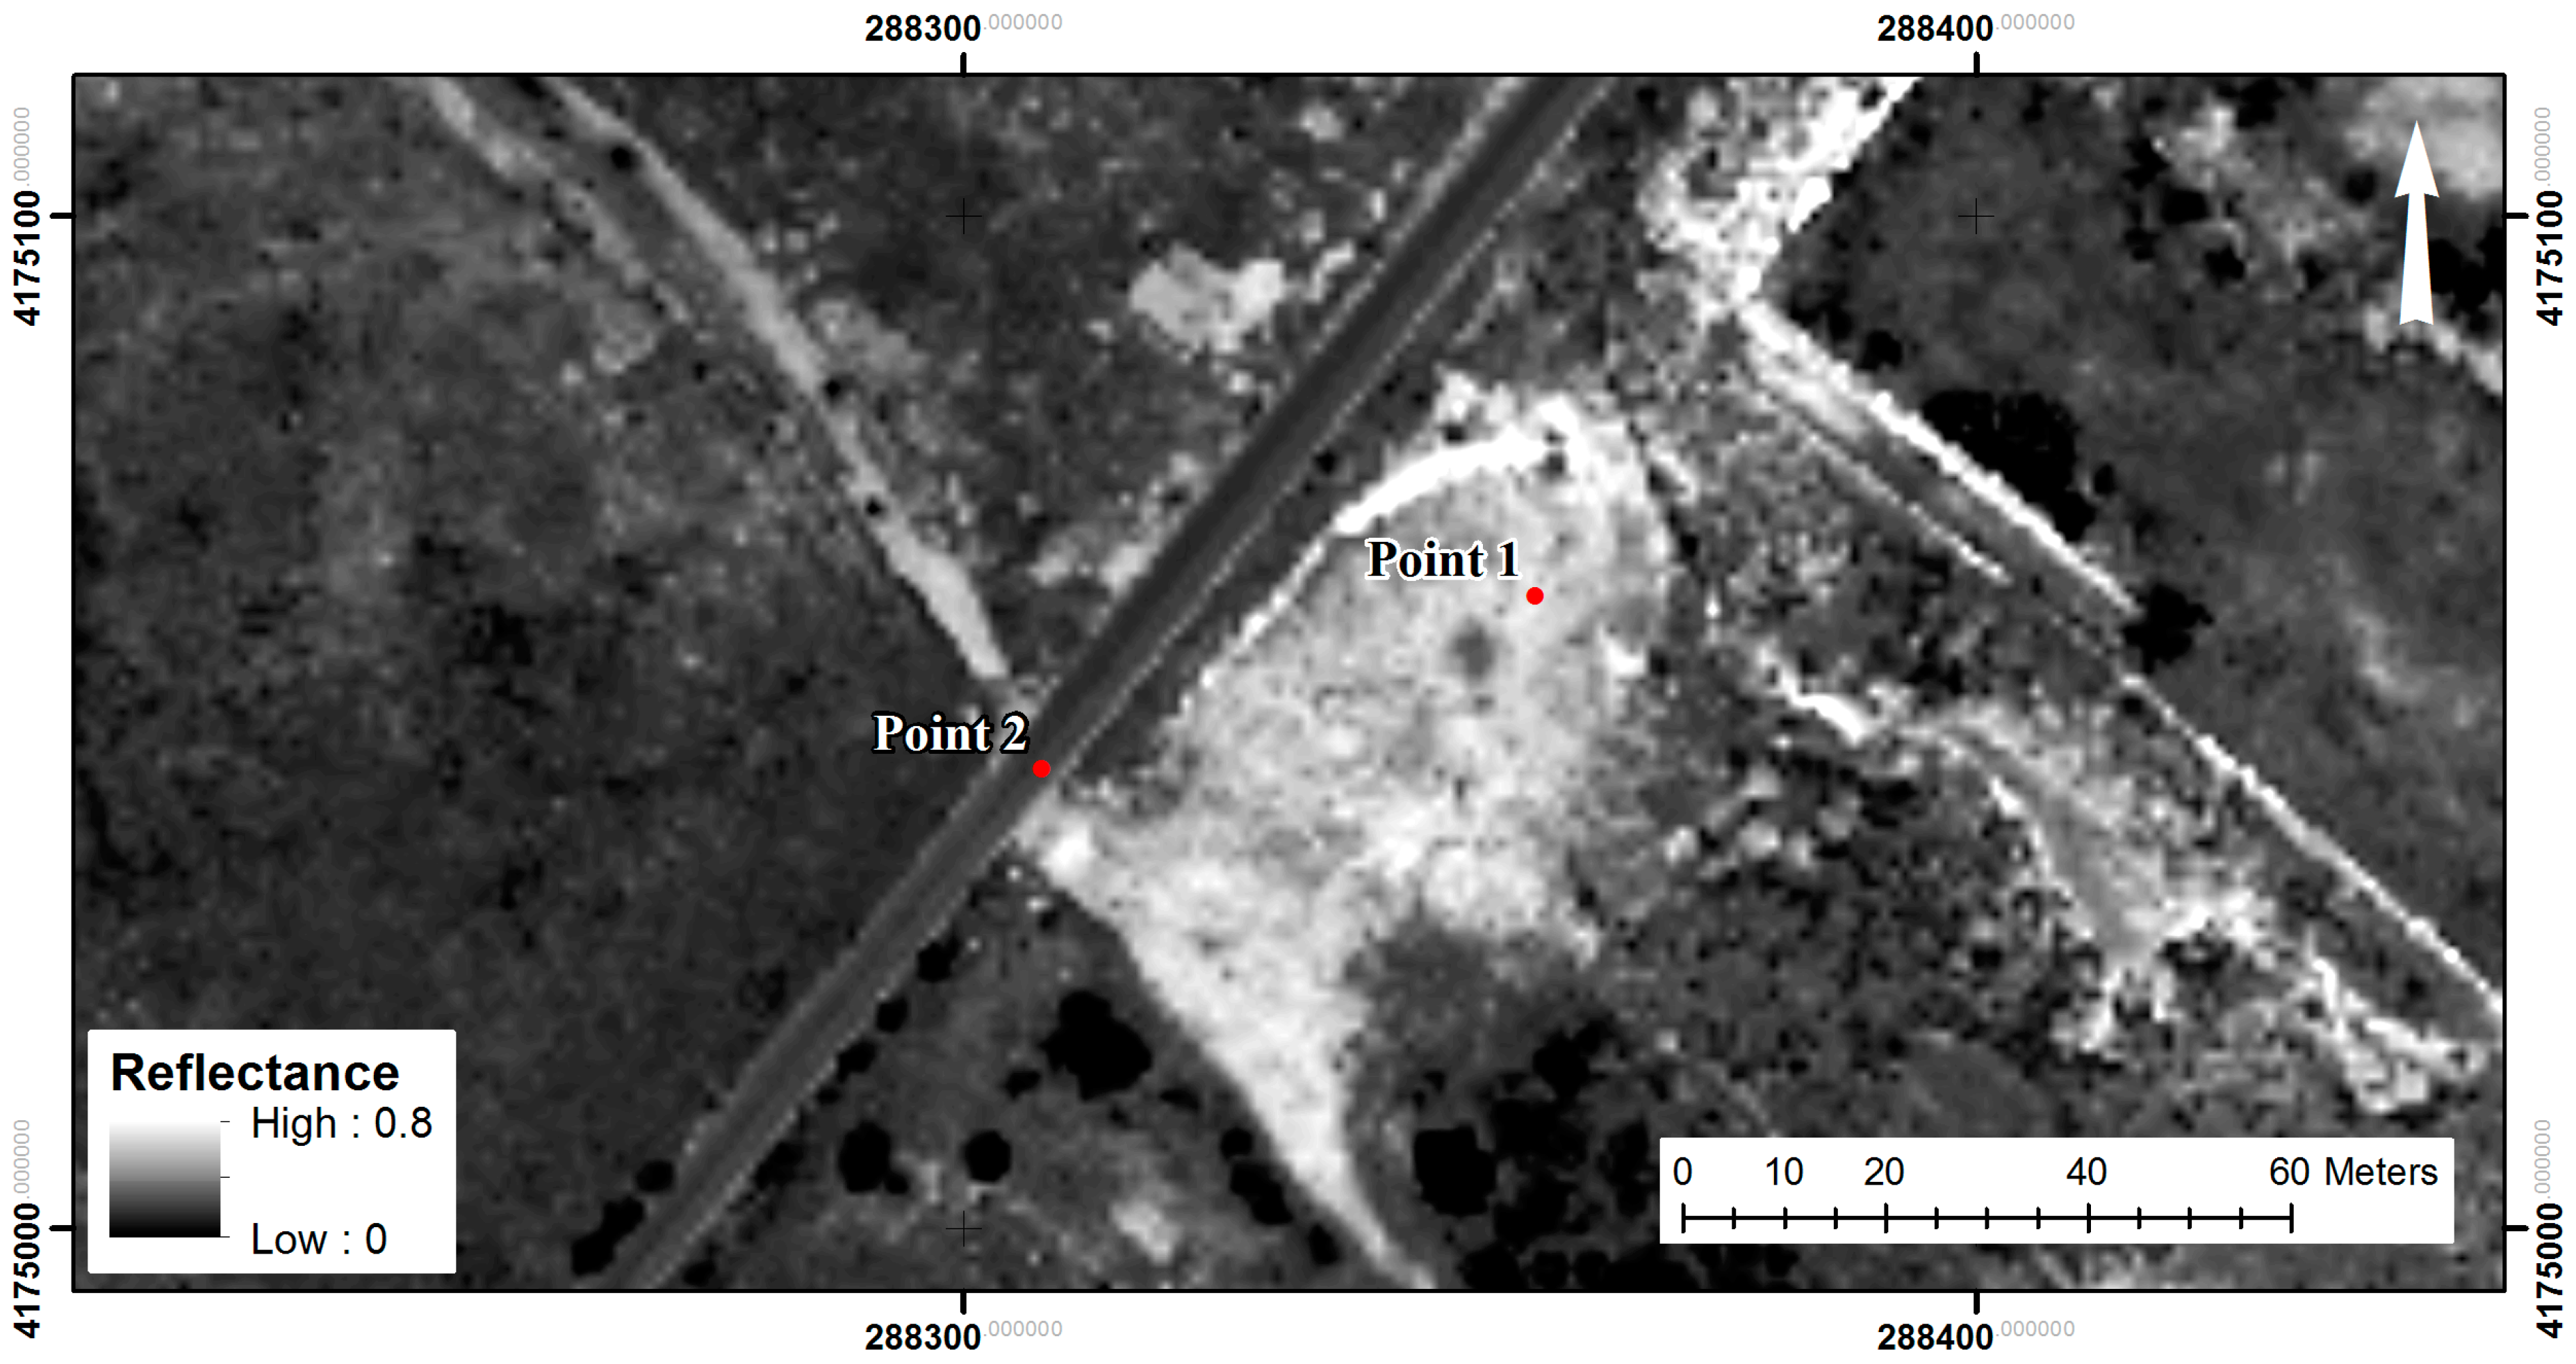
| Strip 1 | Strip 2 | Strip 3 | ||
|---|---|---|---|---|
| Point 1 | Amplitude | 477.0 | 451.5 | 357.0 |
| Reflectance | 0.51 | 0.49 | 0.54 | |
| Range | Amplitude: 119.5/scaled by 600: 0.20 Reflectance: 0.06 | |||
| Point 2 | Amplitude | 215.0 | 190.0 | 179.5 |
| Reflectance | 0.22 | 0.23 | 0.25 | |
| Range | Amplitude: 35.5/scaled by 600: 0.06 Reflectance: 0.03 | |||
© 2019 by the authors. Licensee MDPI, Basel, Switzerland. This article is an open access article distributed under the terms and conditions of the Creative Commons Attribution (CC BY) license (http://creativecommons.org/licenses/by/4.0/).
Share and Cite
Sevara, C.; Wieser, M.; Doneus, M.; Pfeifer, N. Relative Radiometric Calibration of Airborne LiDAR Data for Archaeological Applications. Remote Sens. 2019, 11, 945. https://doi.org/10.3390/rs11080945
Sevara C, Wieser M, Doneus M, Pfeifer N. Relative Radiometric Calibration of Airborne LiDAR Data for Archaeological Applications. Remote Sensing. 2019; 11(8):945. https://doi.org/10.3390/rs11080945
Chicago/Turabian StyleSevara, Christopher, Martin Wieser, Michael Doneus, and Norbert Pfeifer. 2019. "Relative Radiometric Calibration of Airborne LiDAR Data for Archaeological Applications" Remote Sensing 11, no. 8: 945. https://doi.org/10.3390/rs11080945
APA StyleSevara, C., Wieser, M., Doneus, M., & Pfeifer, N. (2019). Relative Radiometric Calibration of Airborne LiDAR Data for Archaeological Applications. Remote Sensing, 11(8), 945. https://doi.org/10.3390/rs11080945