Spatio-Temporal Analysis of Vegetation Dynamics as a Response to Climate Variability and Drought Patterns in the Semiarid Region, Eritrea

 ,
, 

 ,
,  ,
,
Abstract
1. Introduction
2. Data and Methods
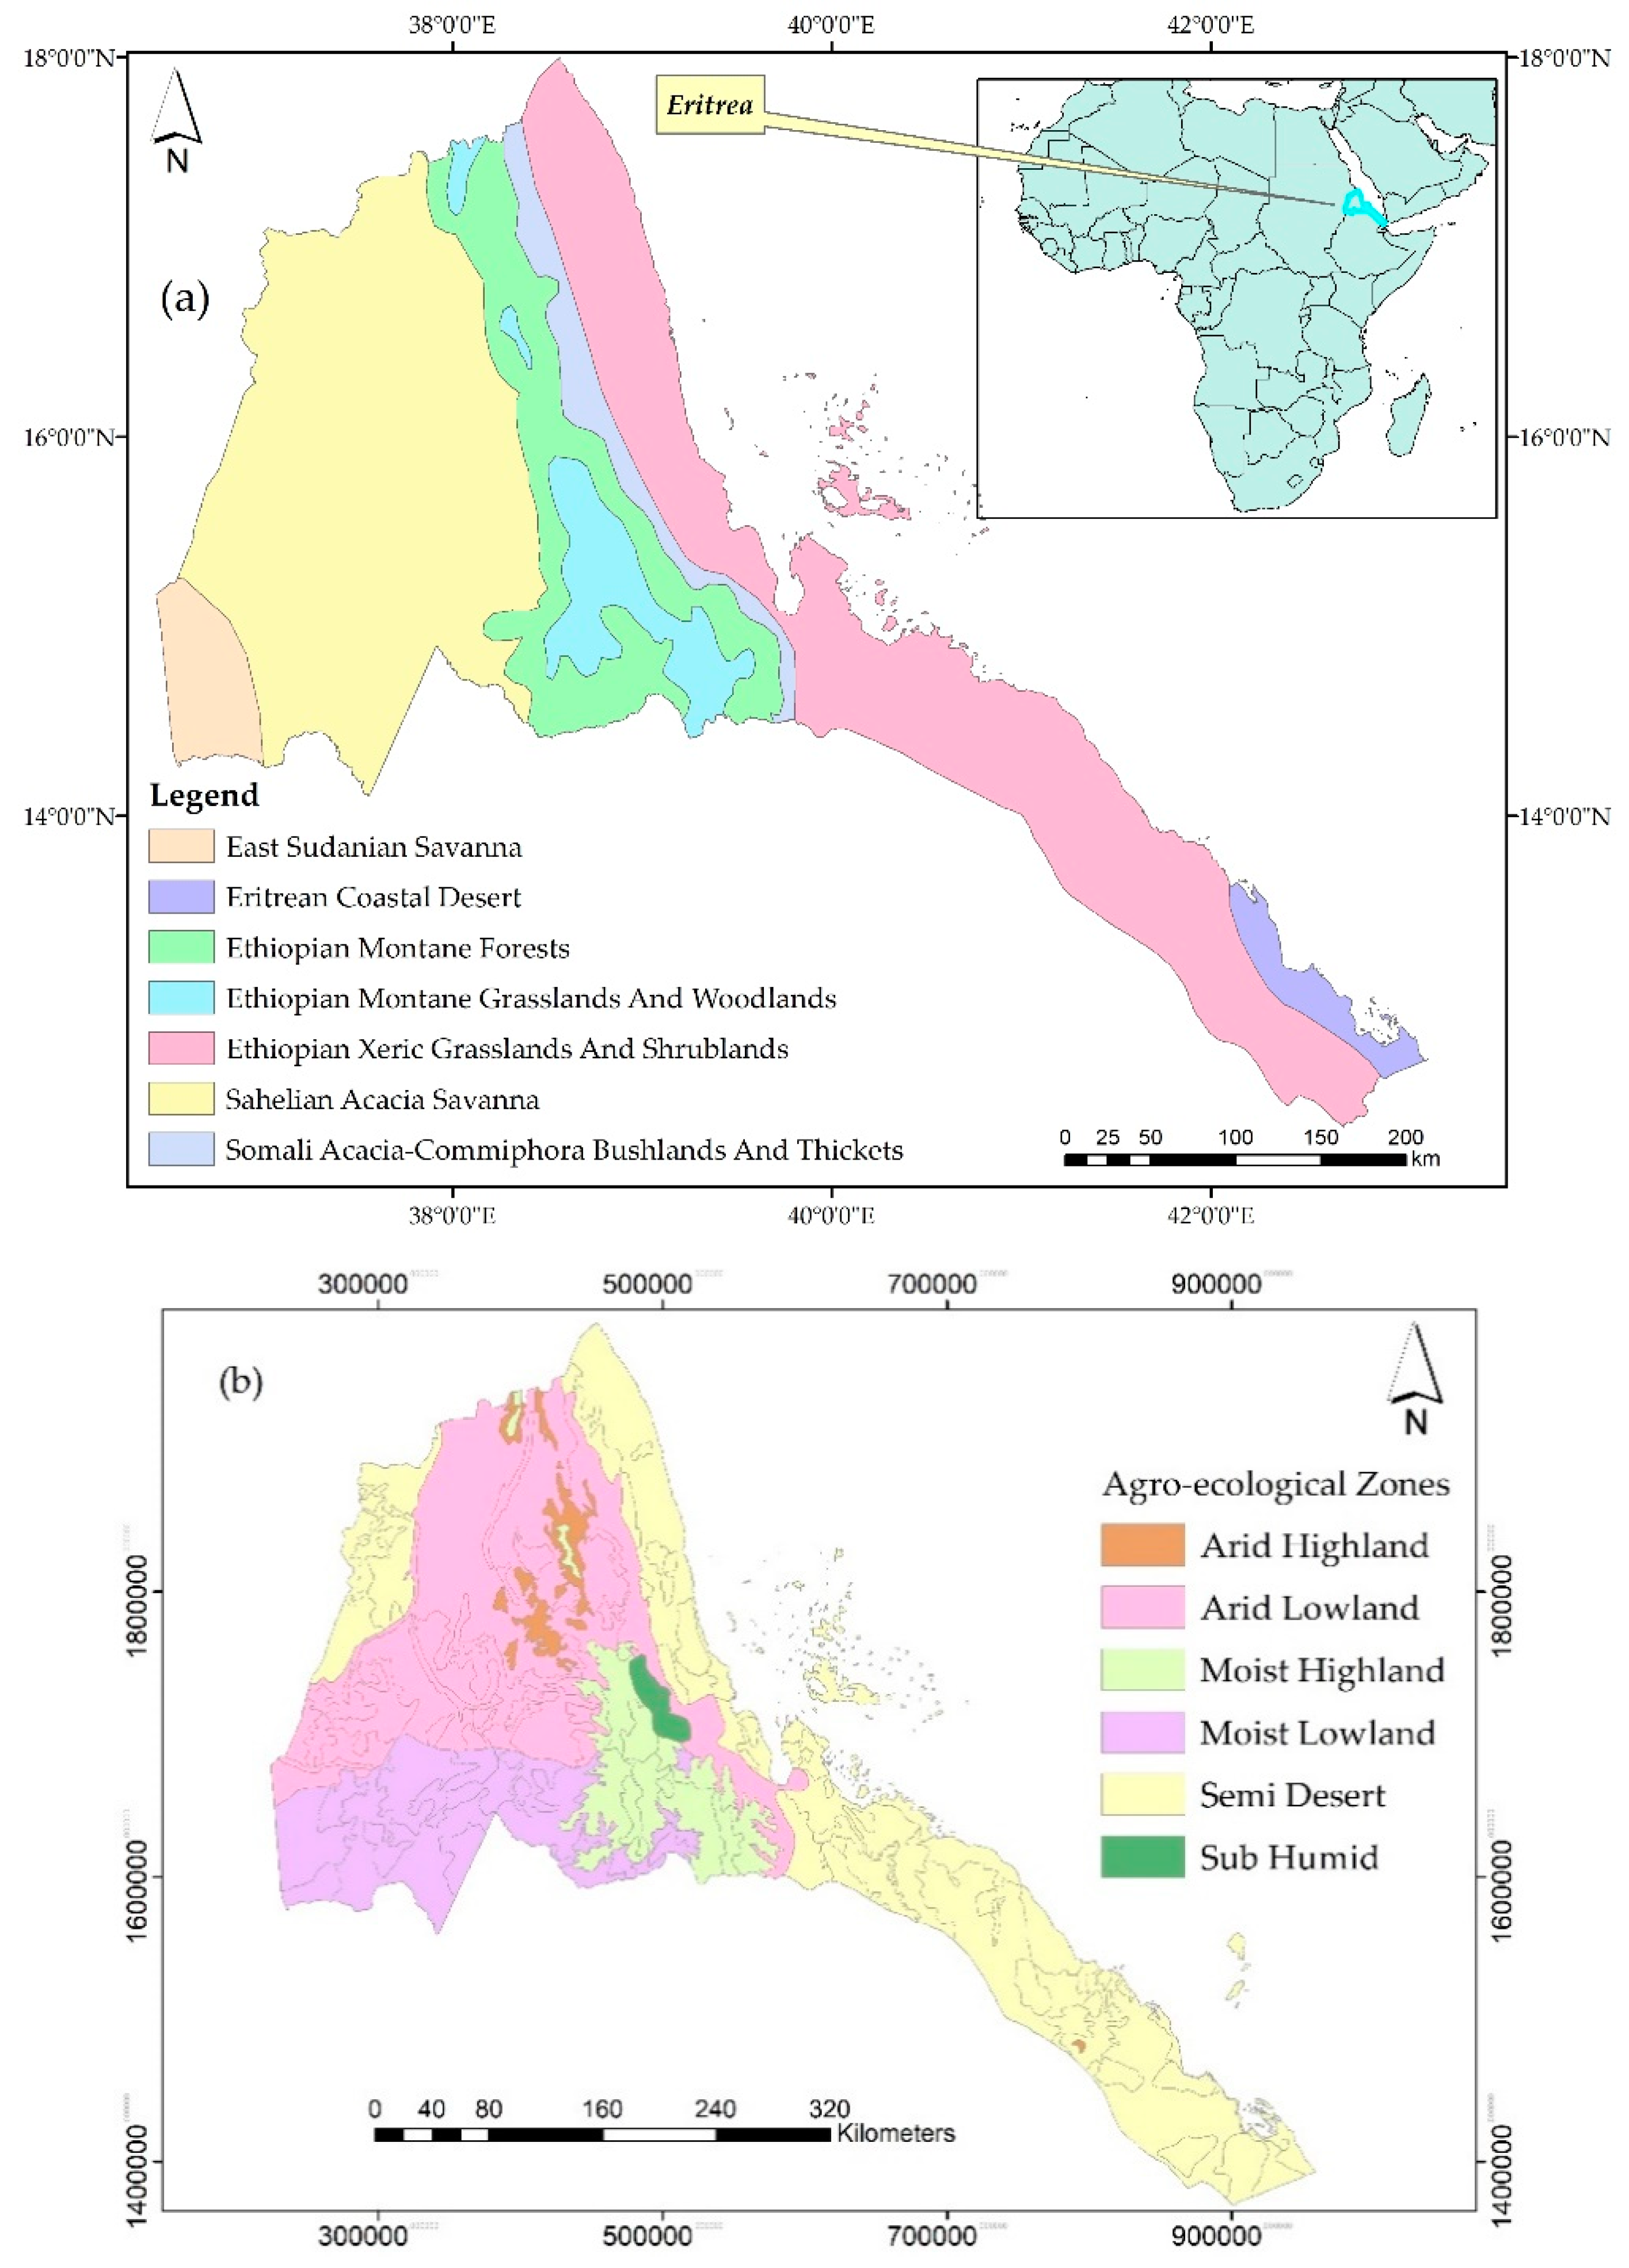
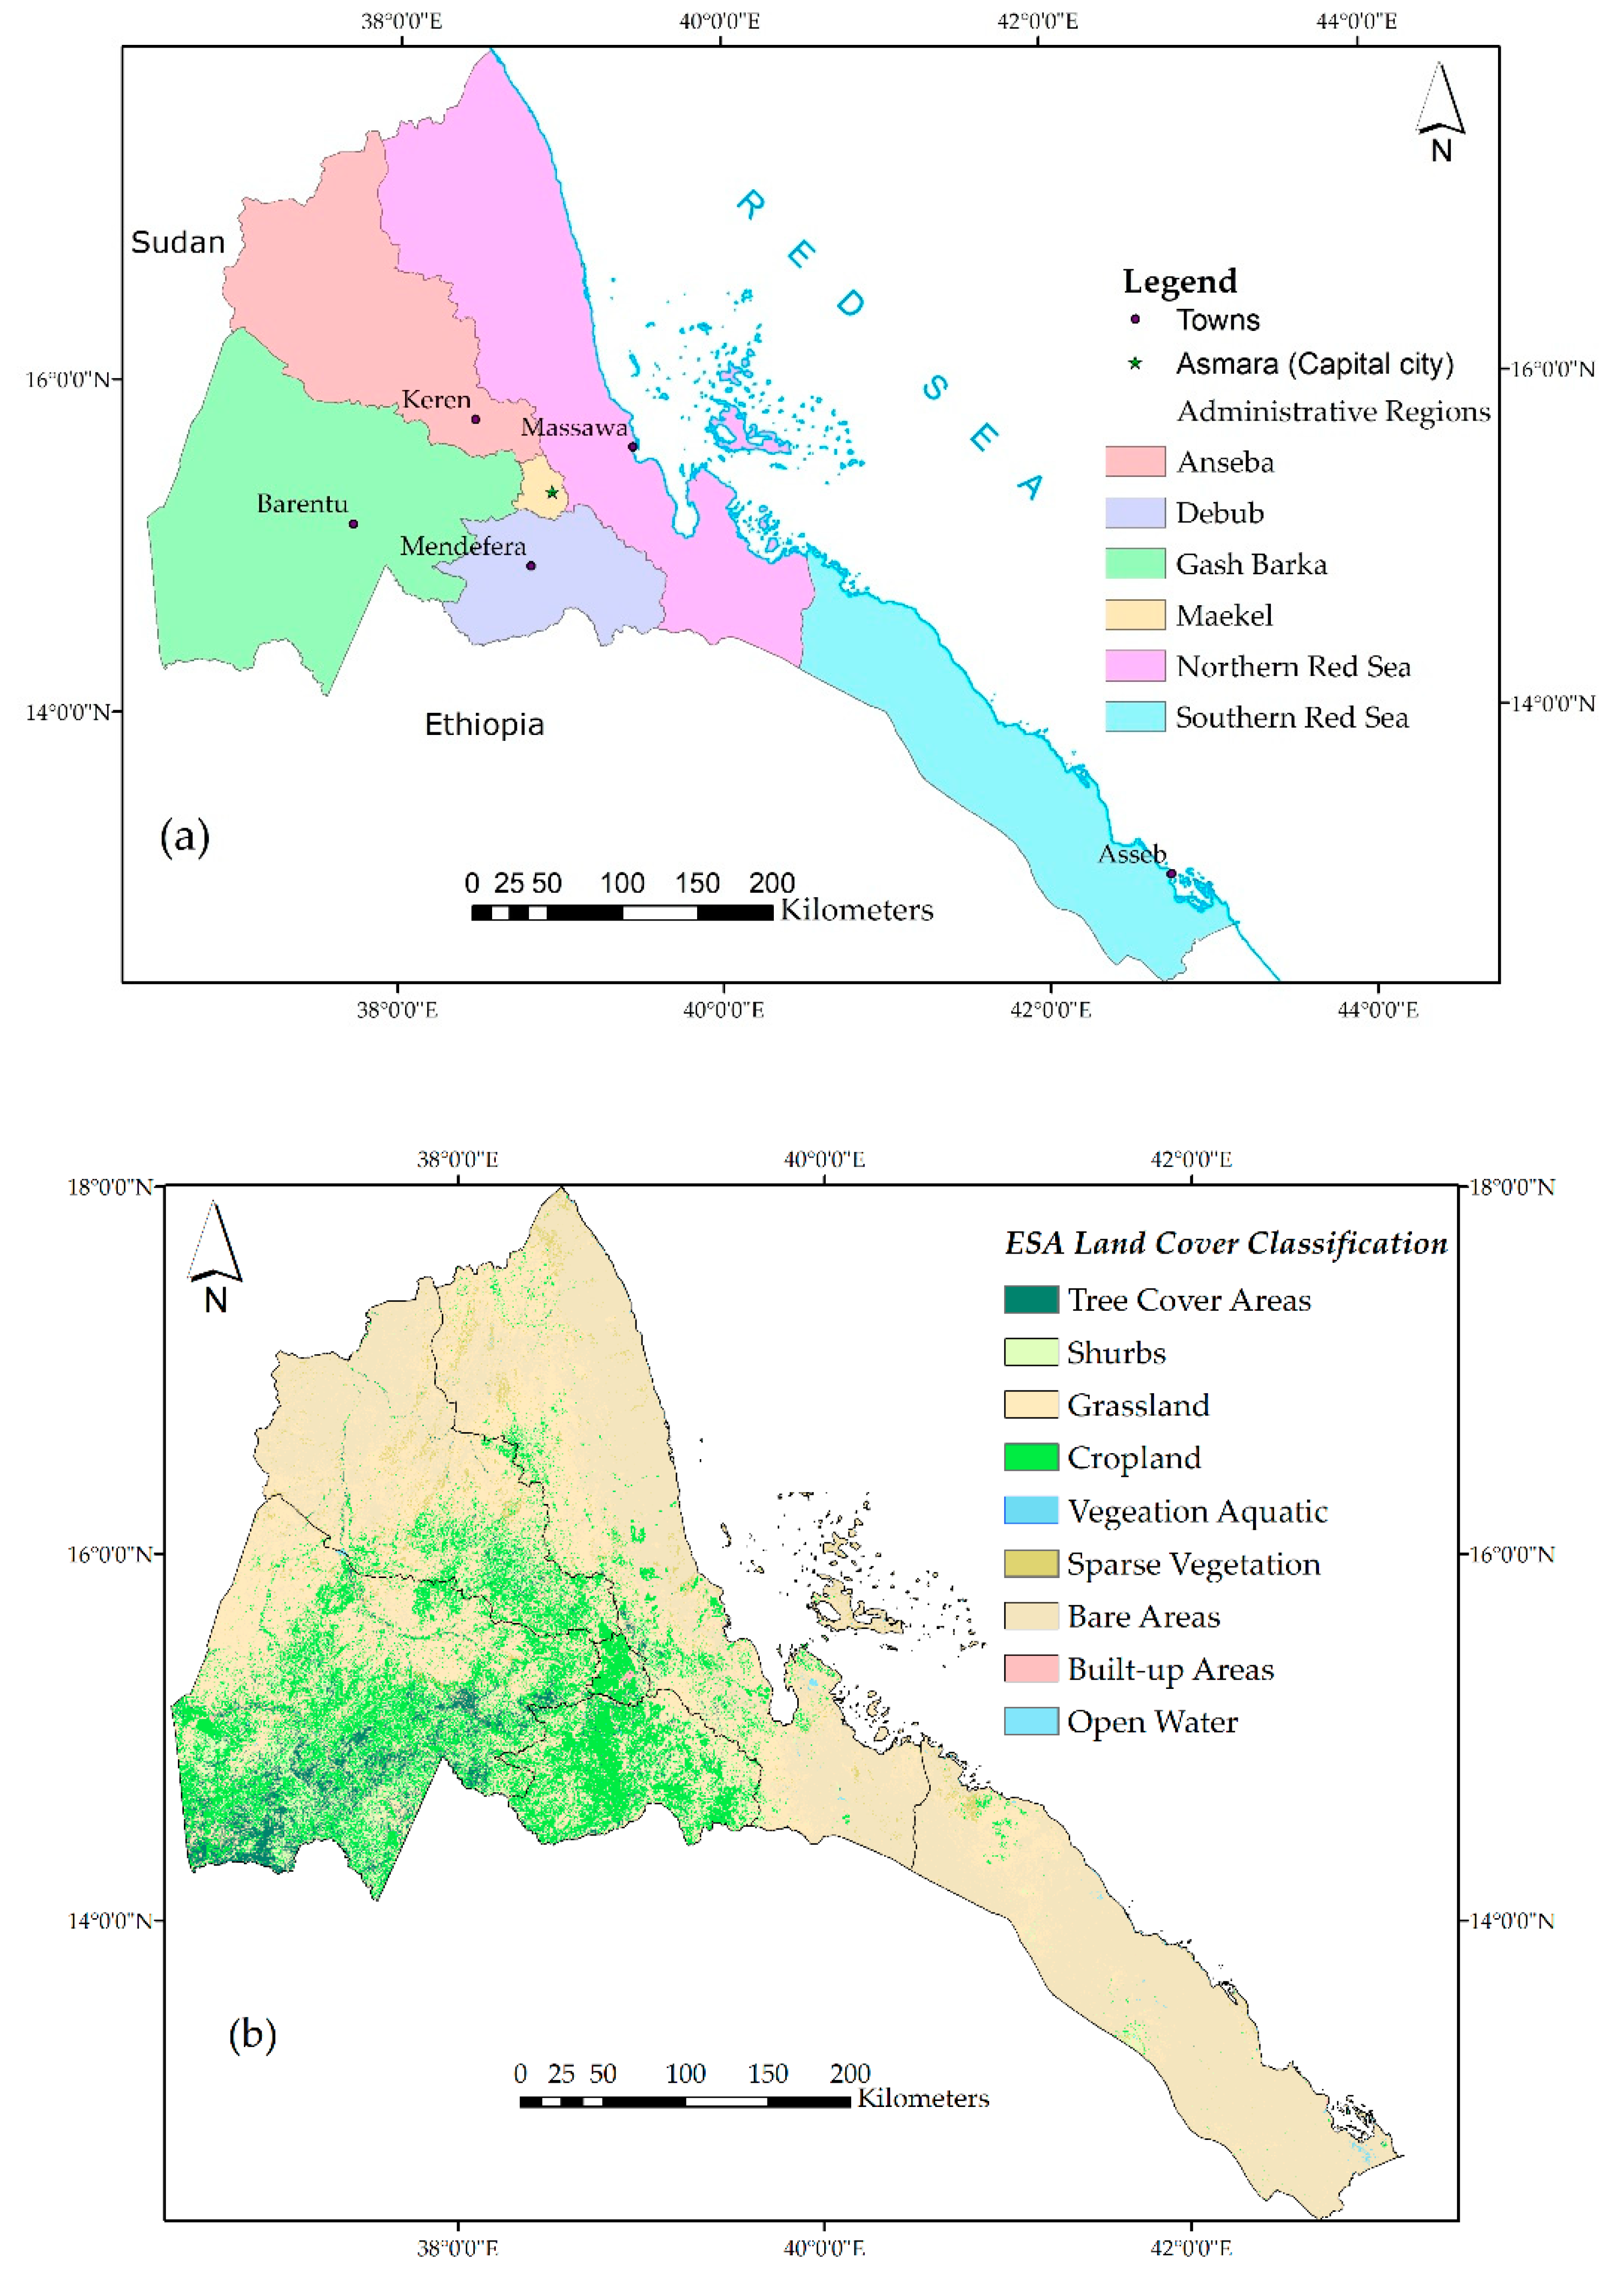
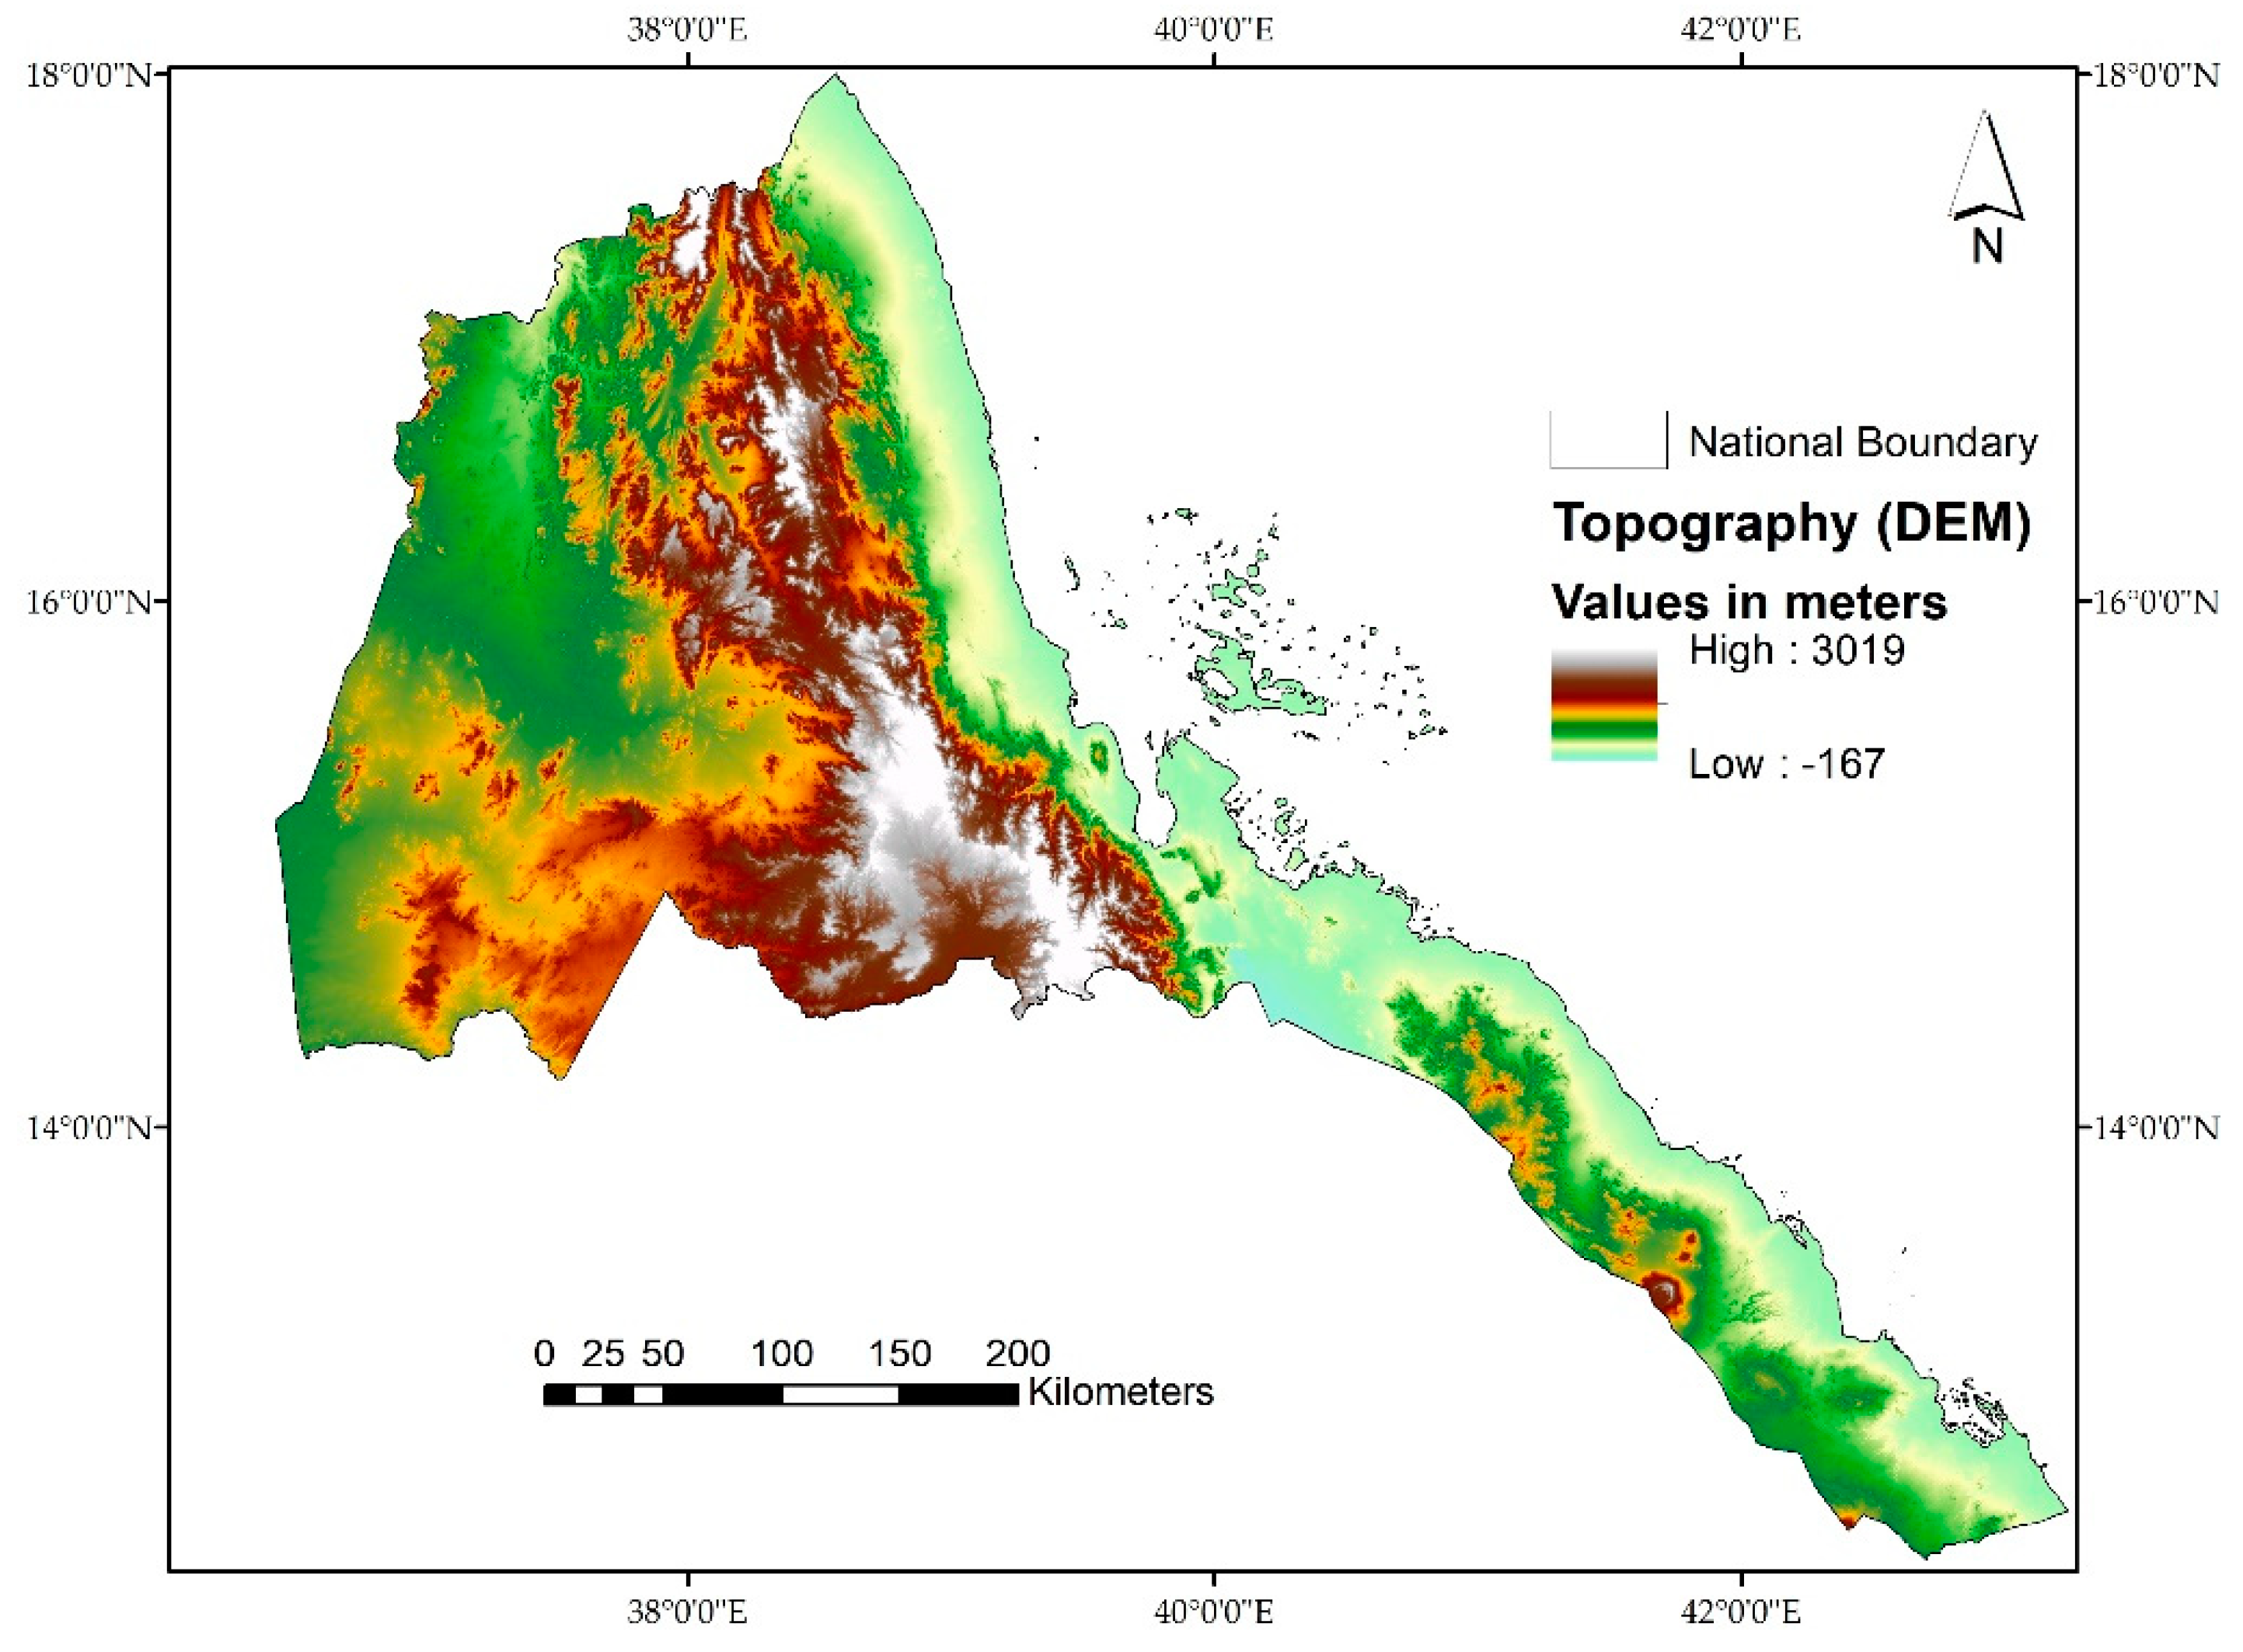
2.1. Study Area
2.2. Datasets
2.3. Methods
2.3.1. Linear Regression Model
2.3.2. Pearson Correlation Coefficient
2.3.3. Vegetation Condition Index and Standard Precipitation Index
3. Results
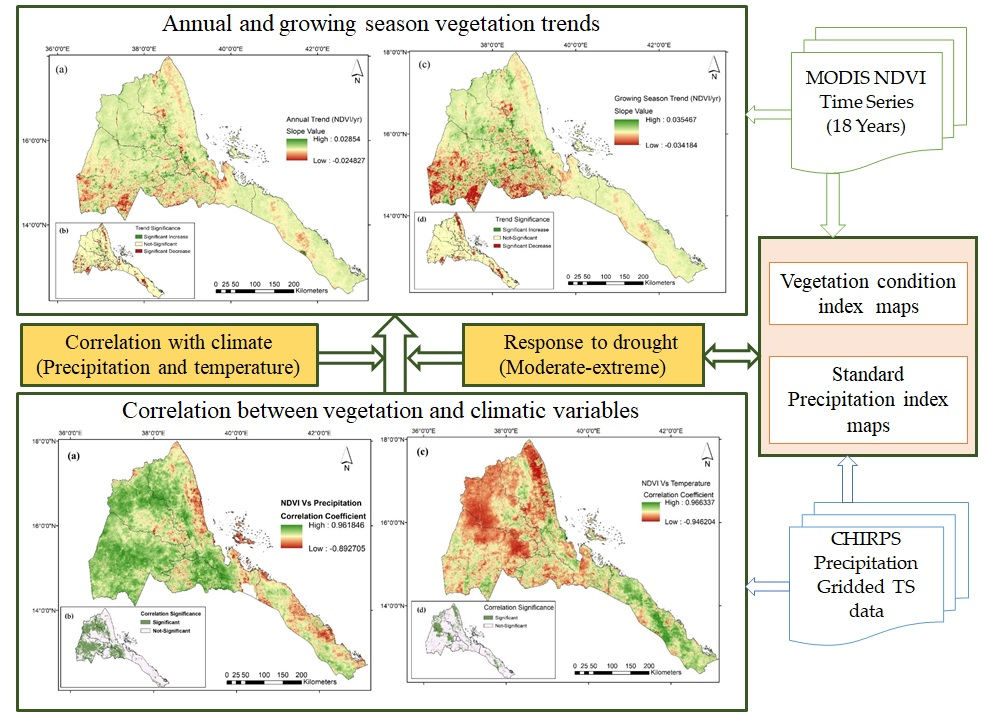
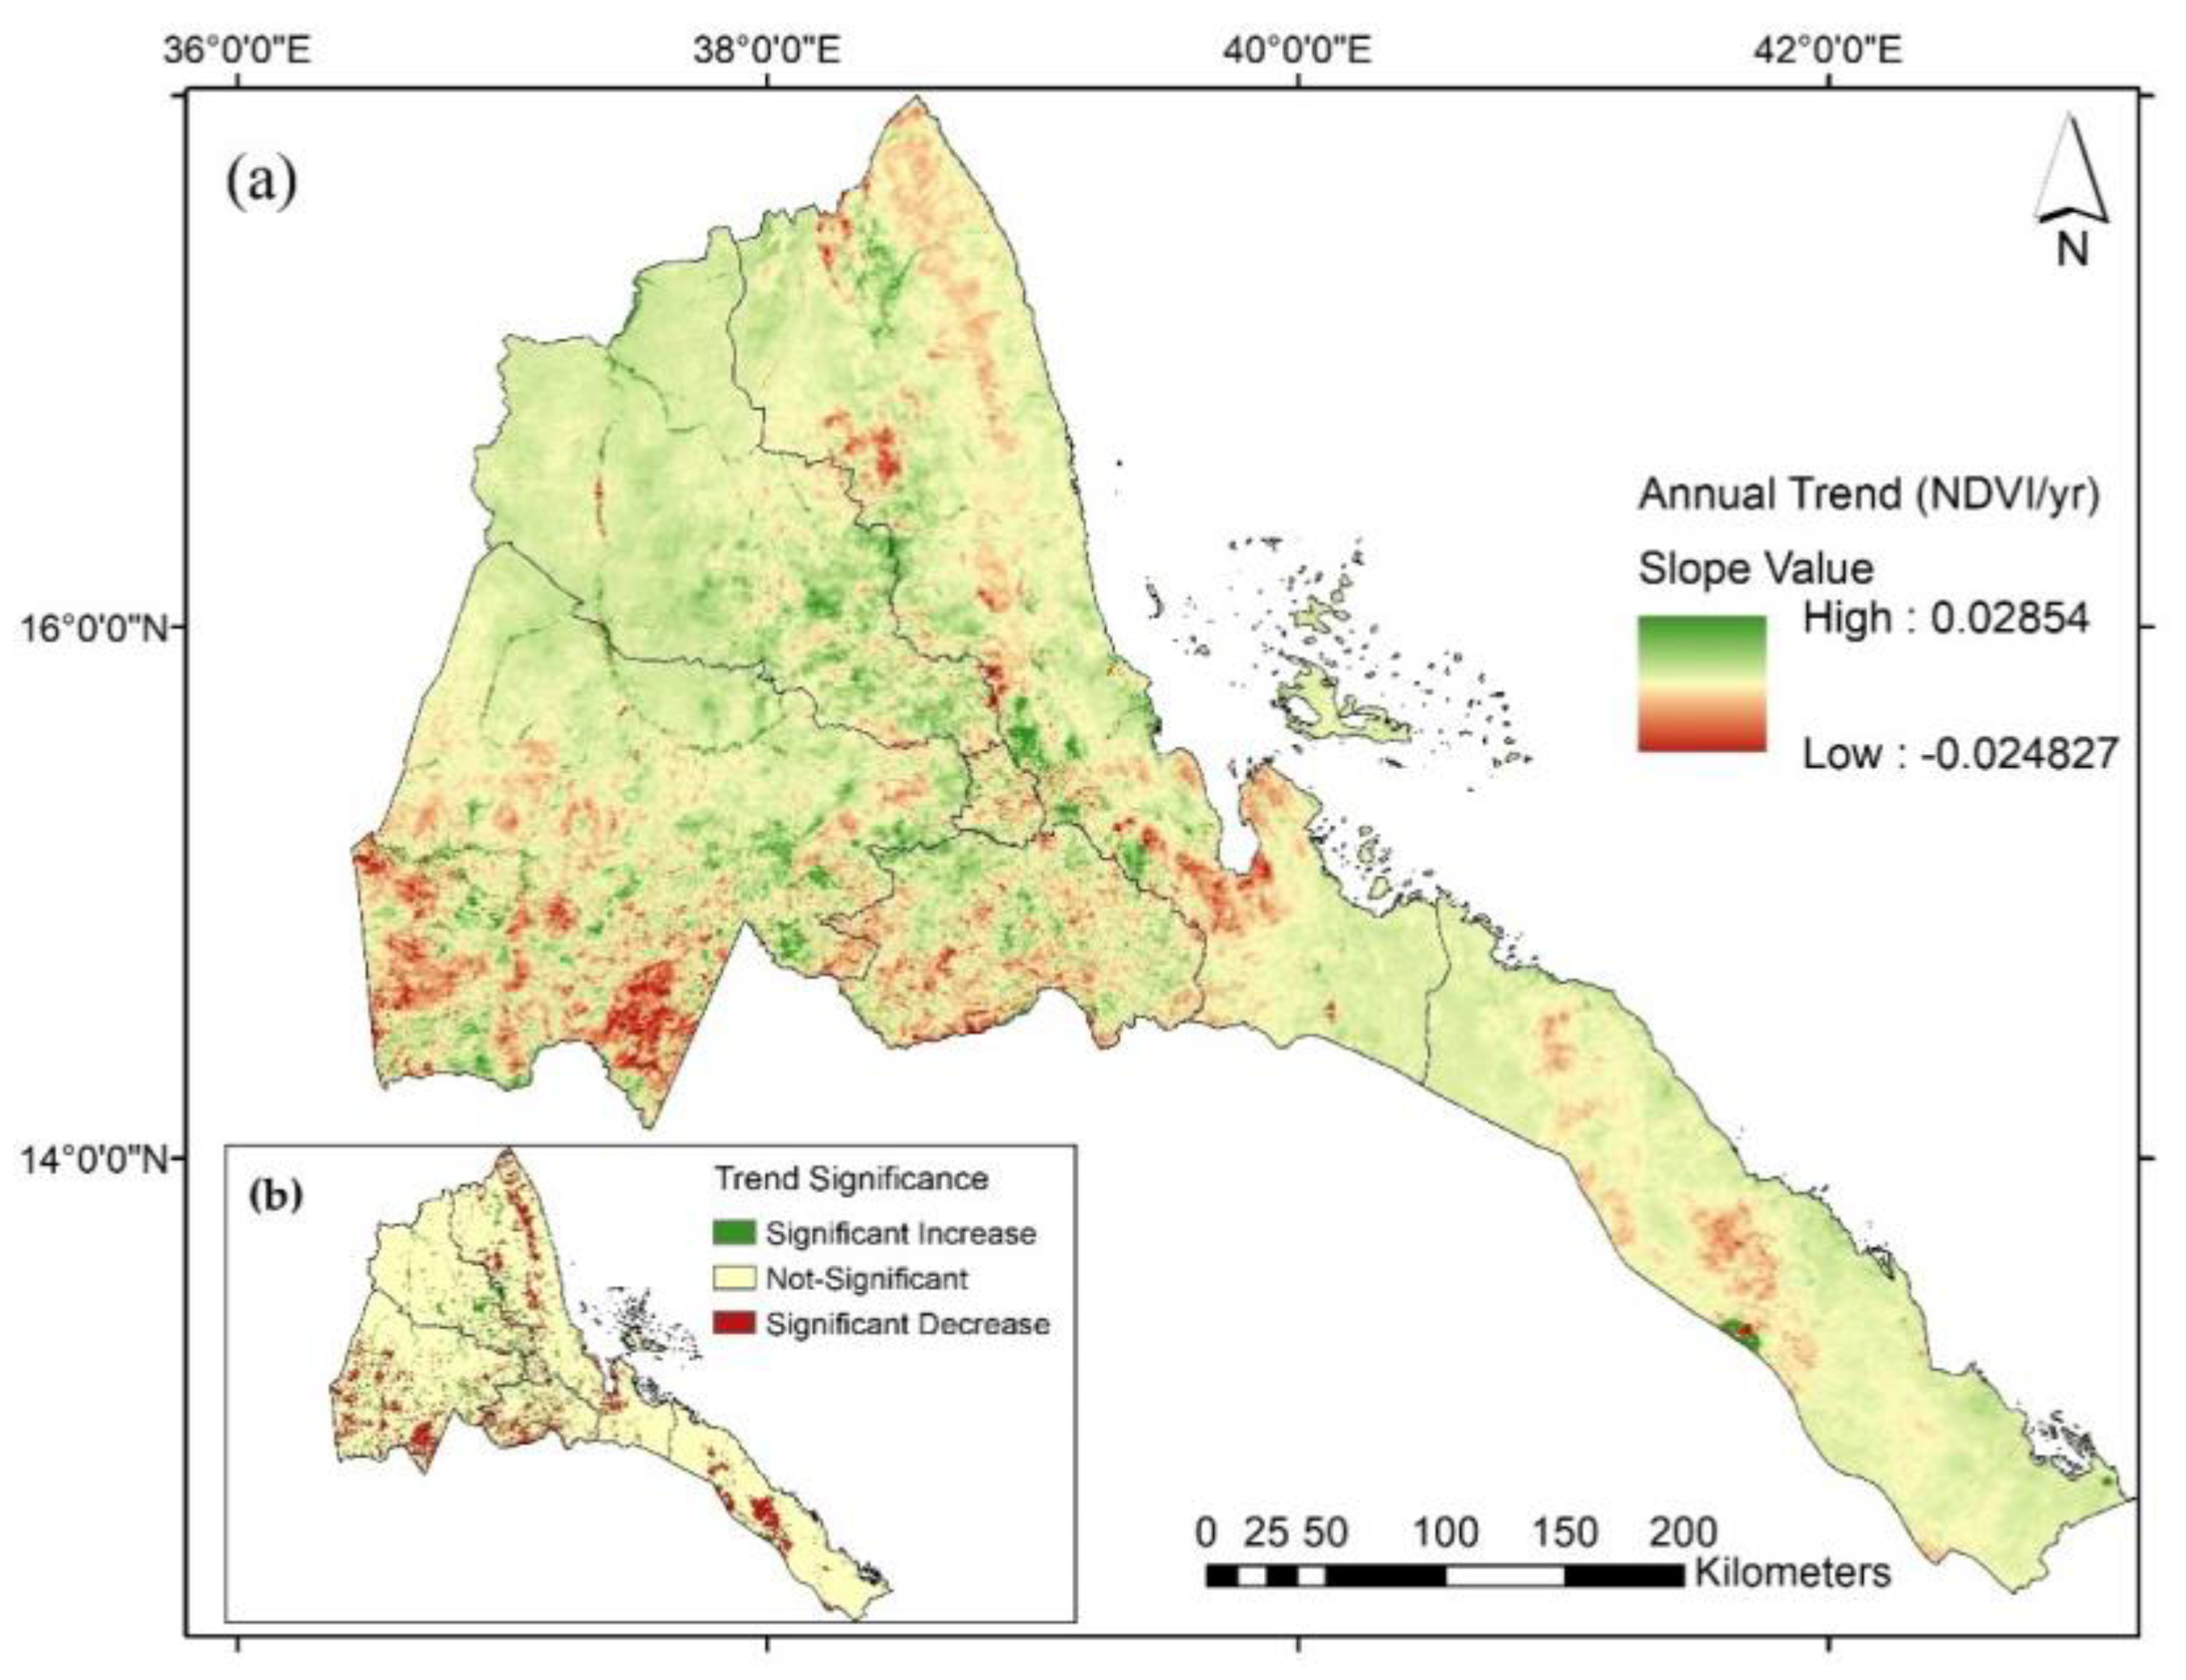
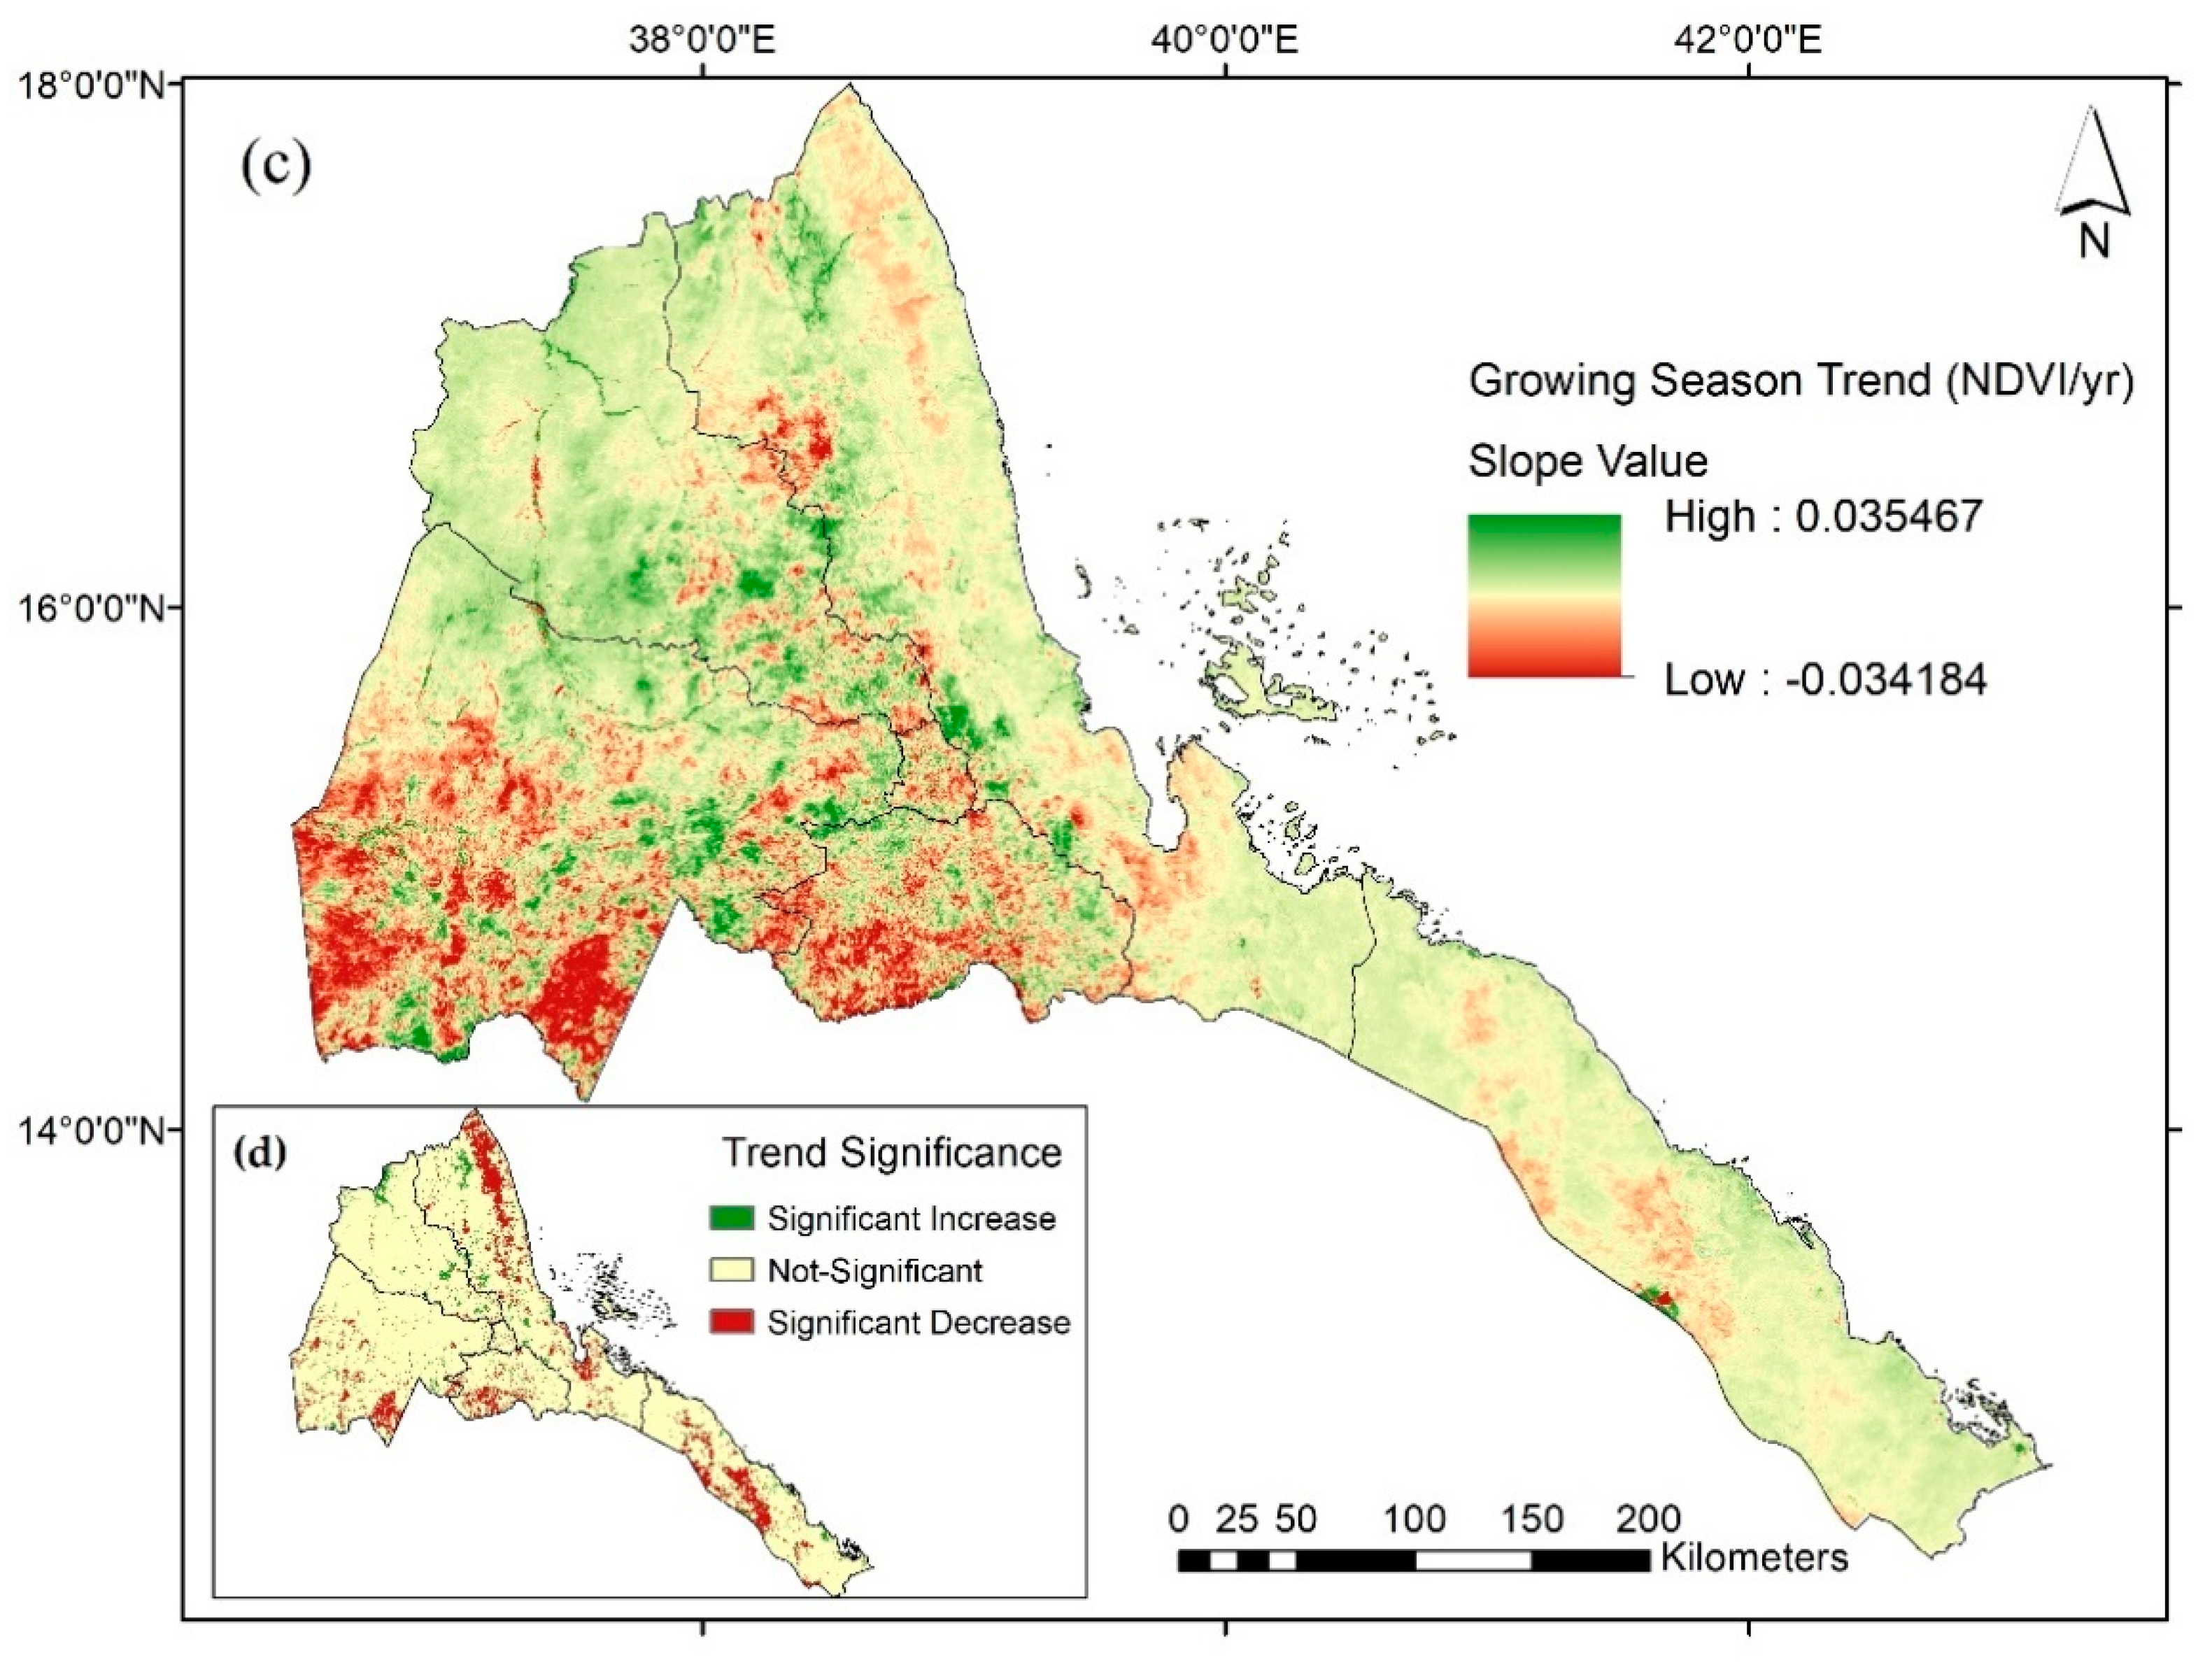
3.1. Spatial and Temporal Trends in Vegetation Cover
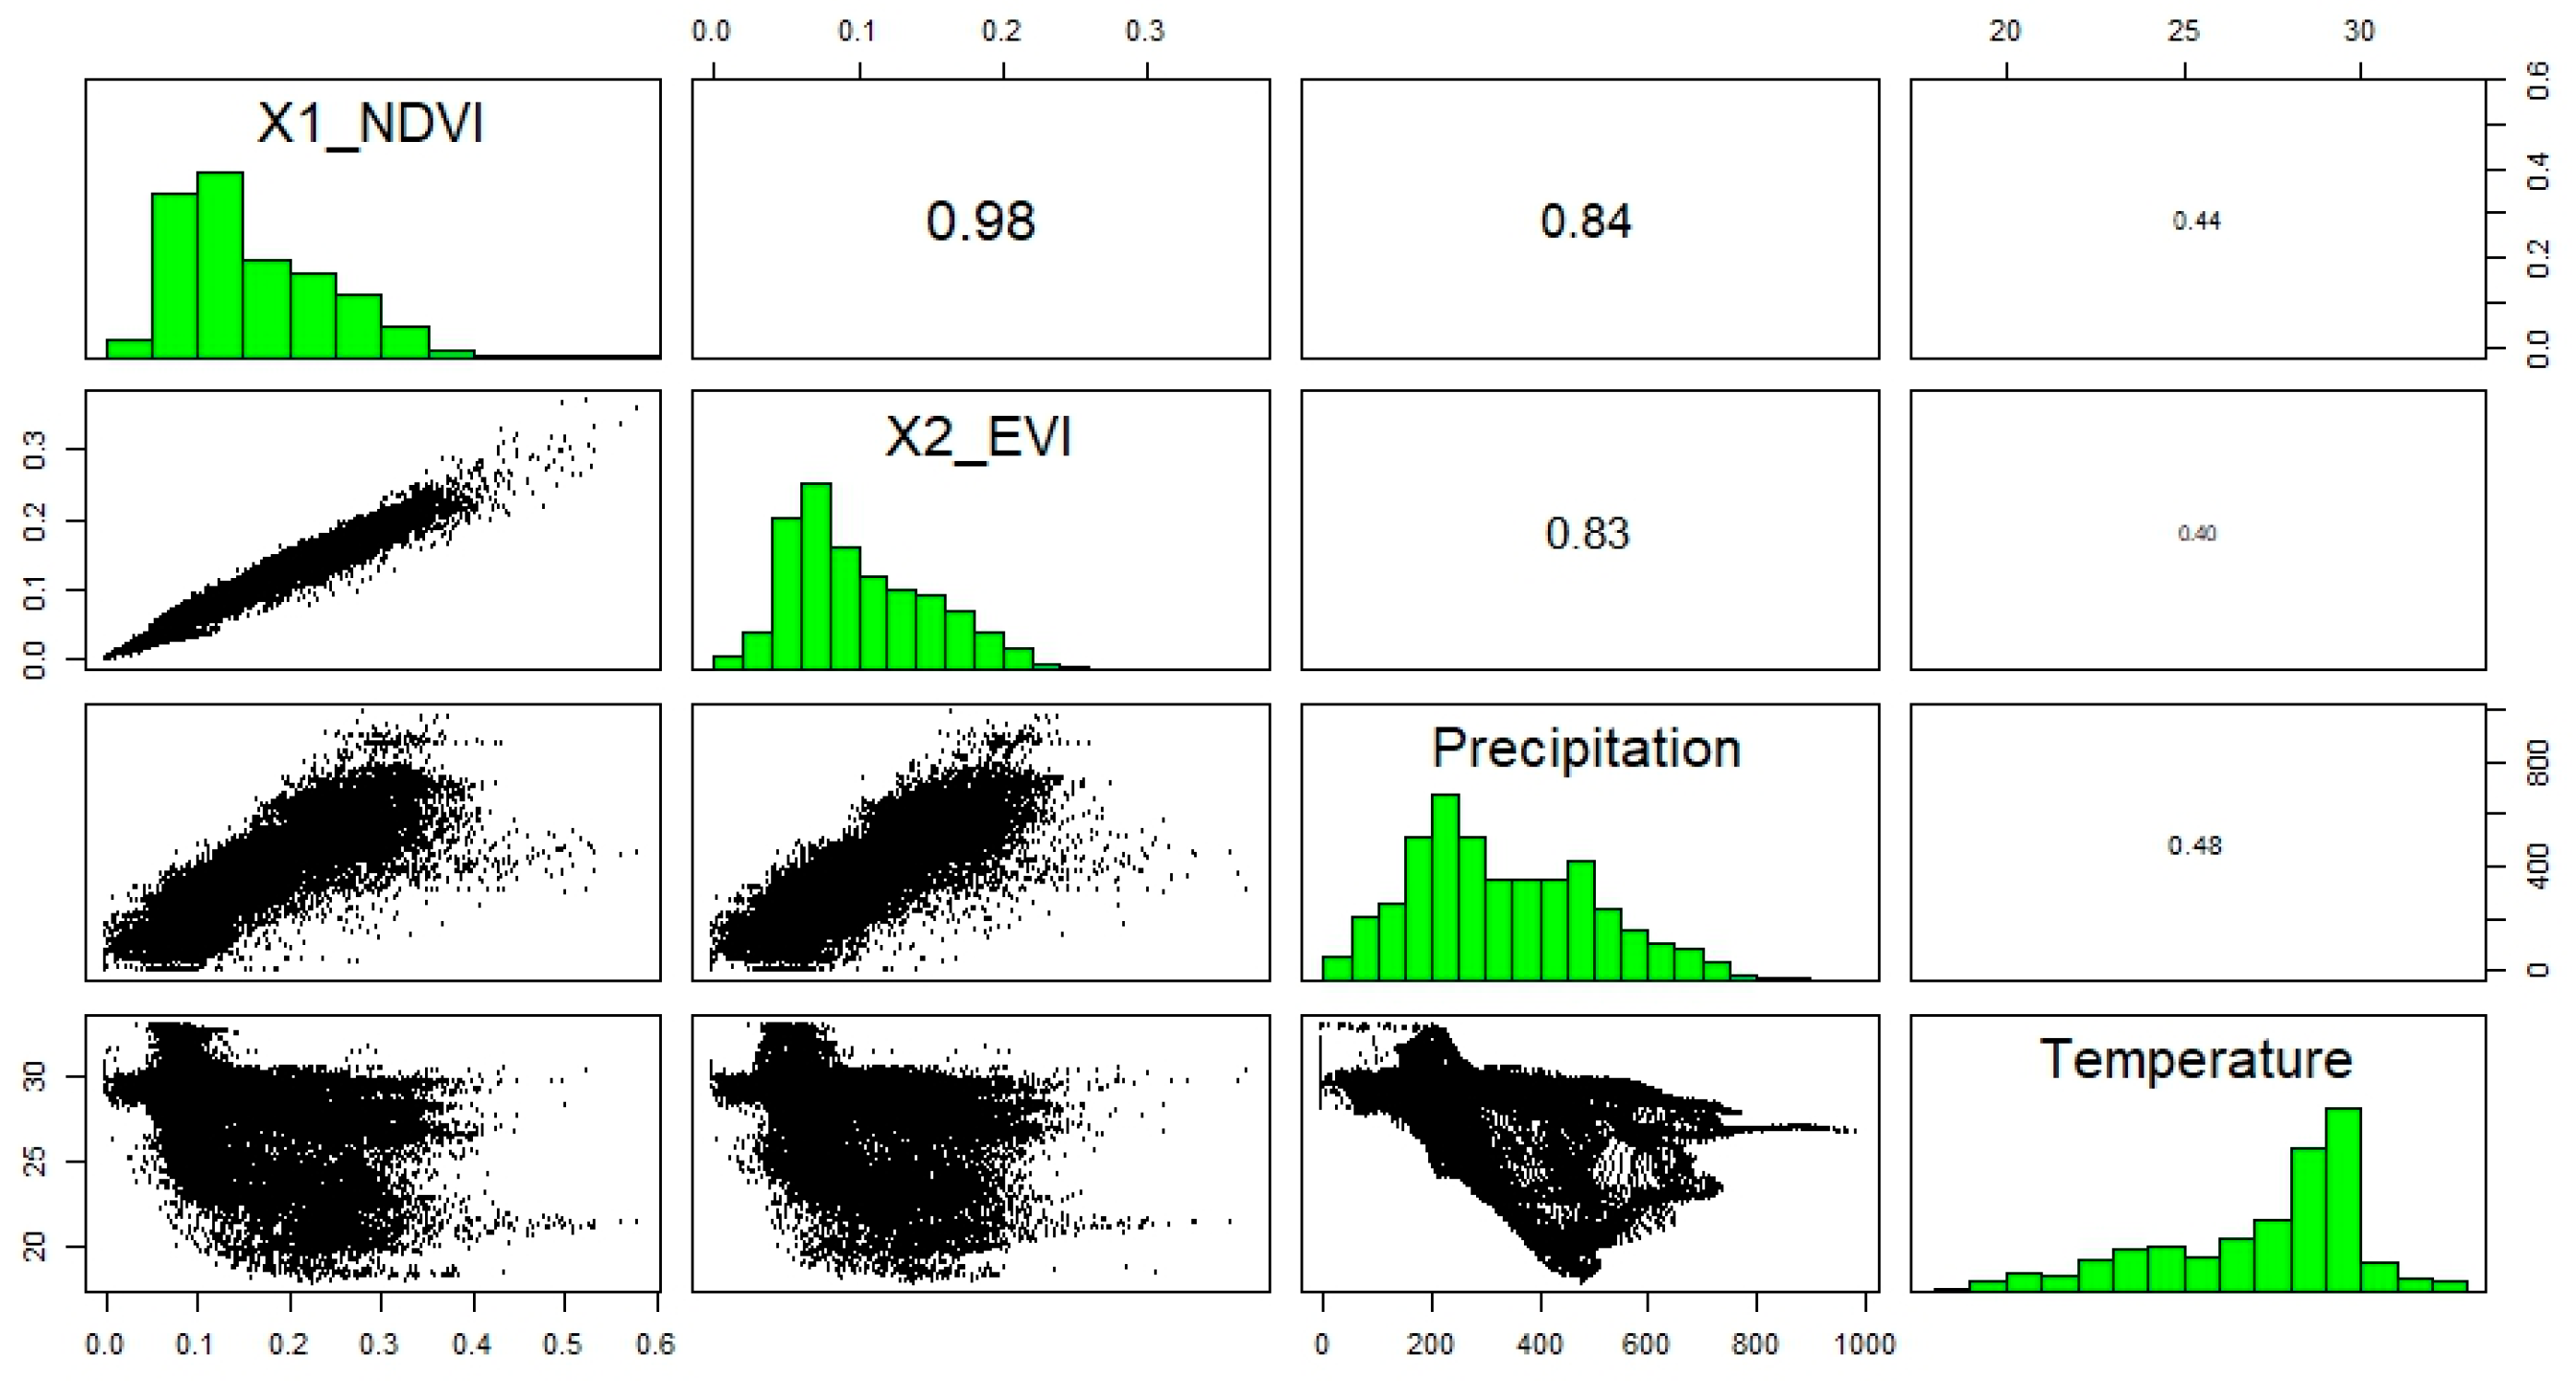
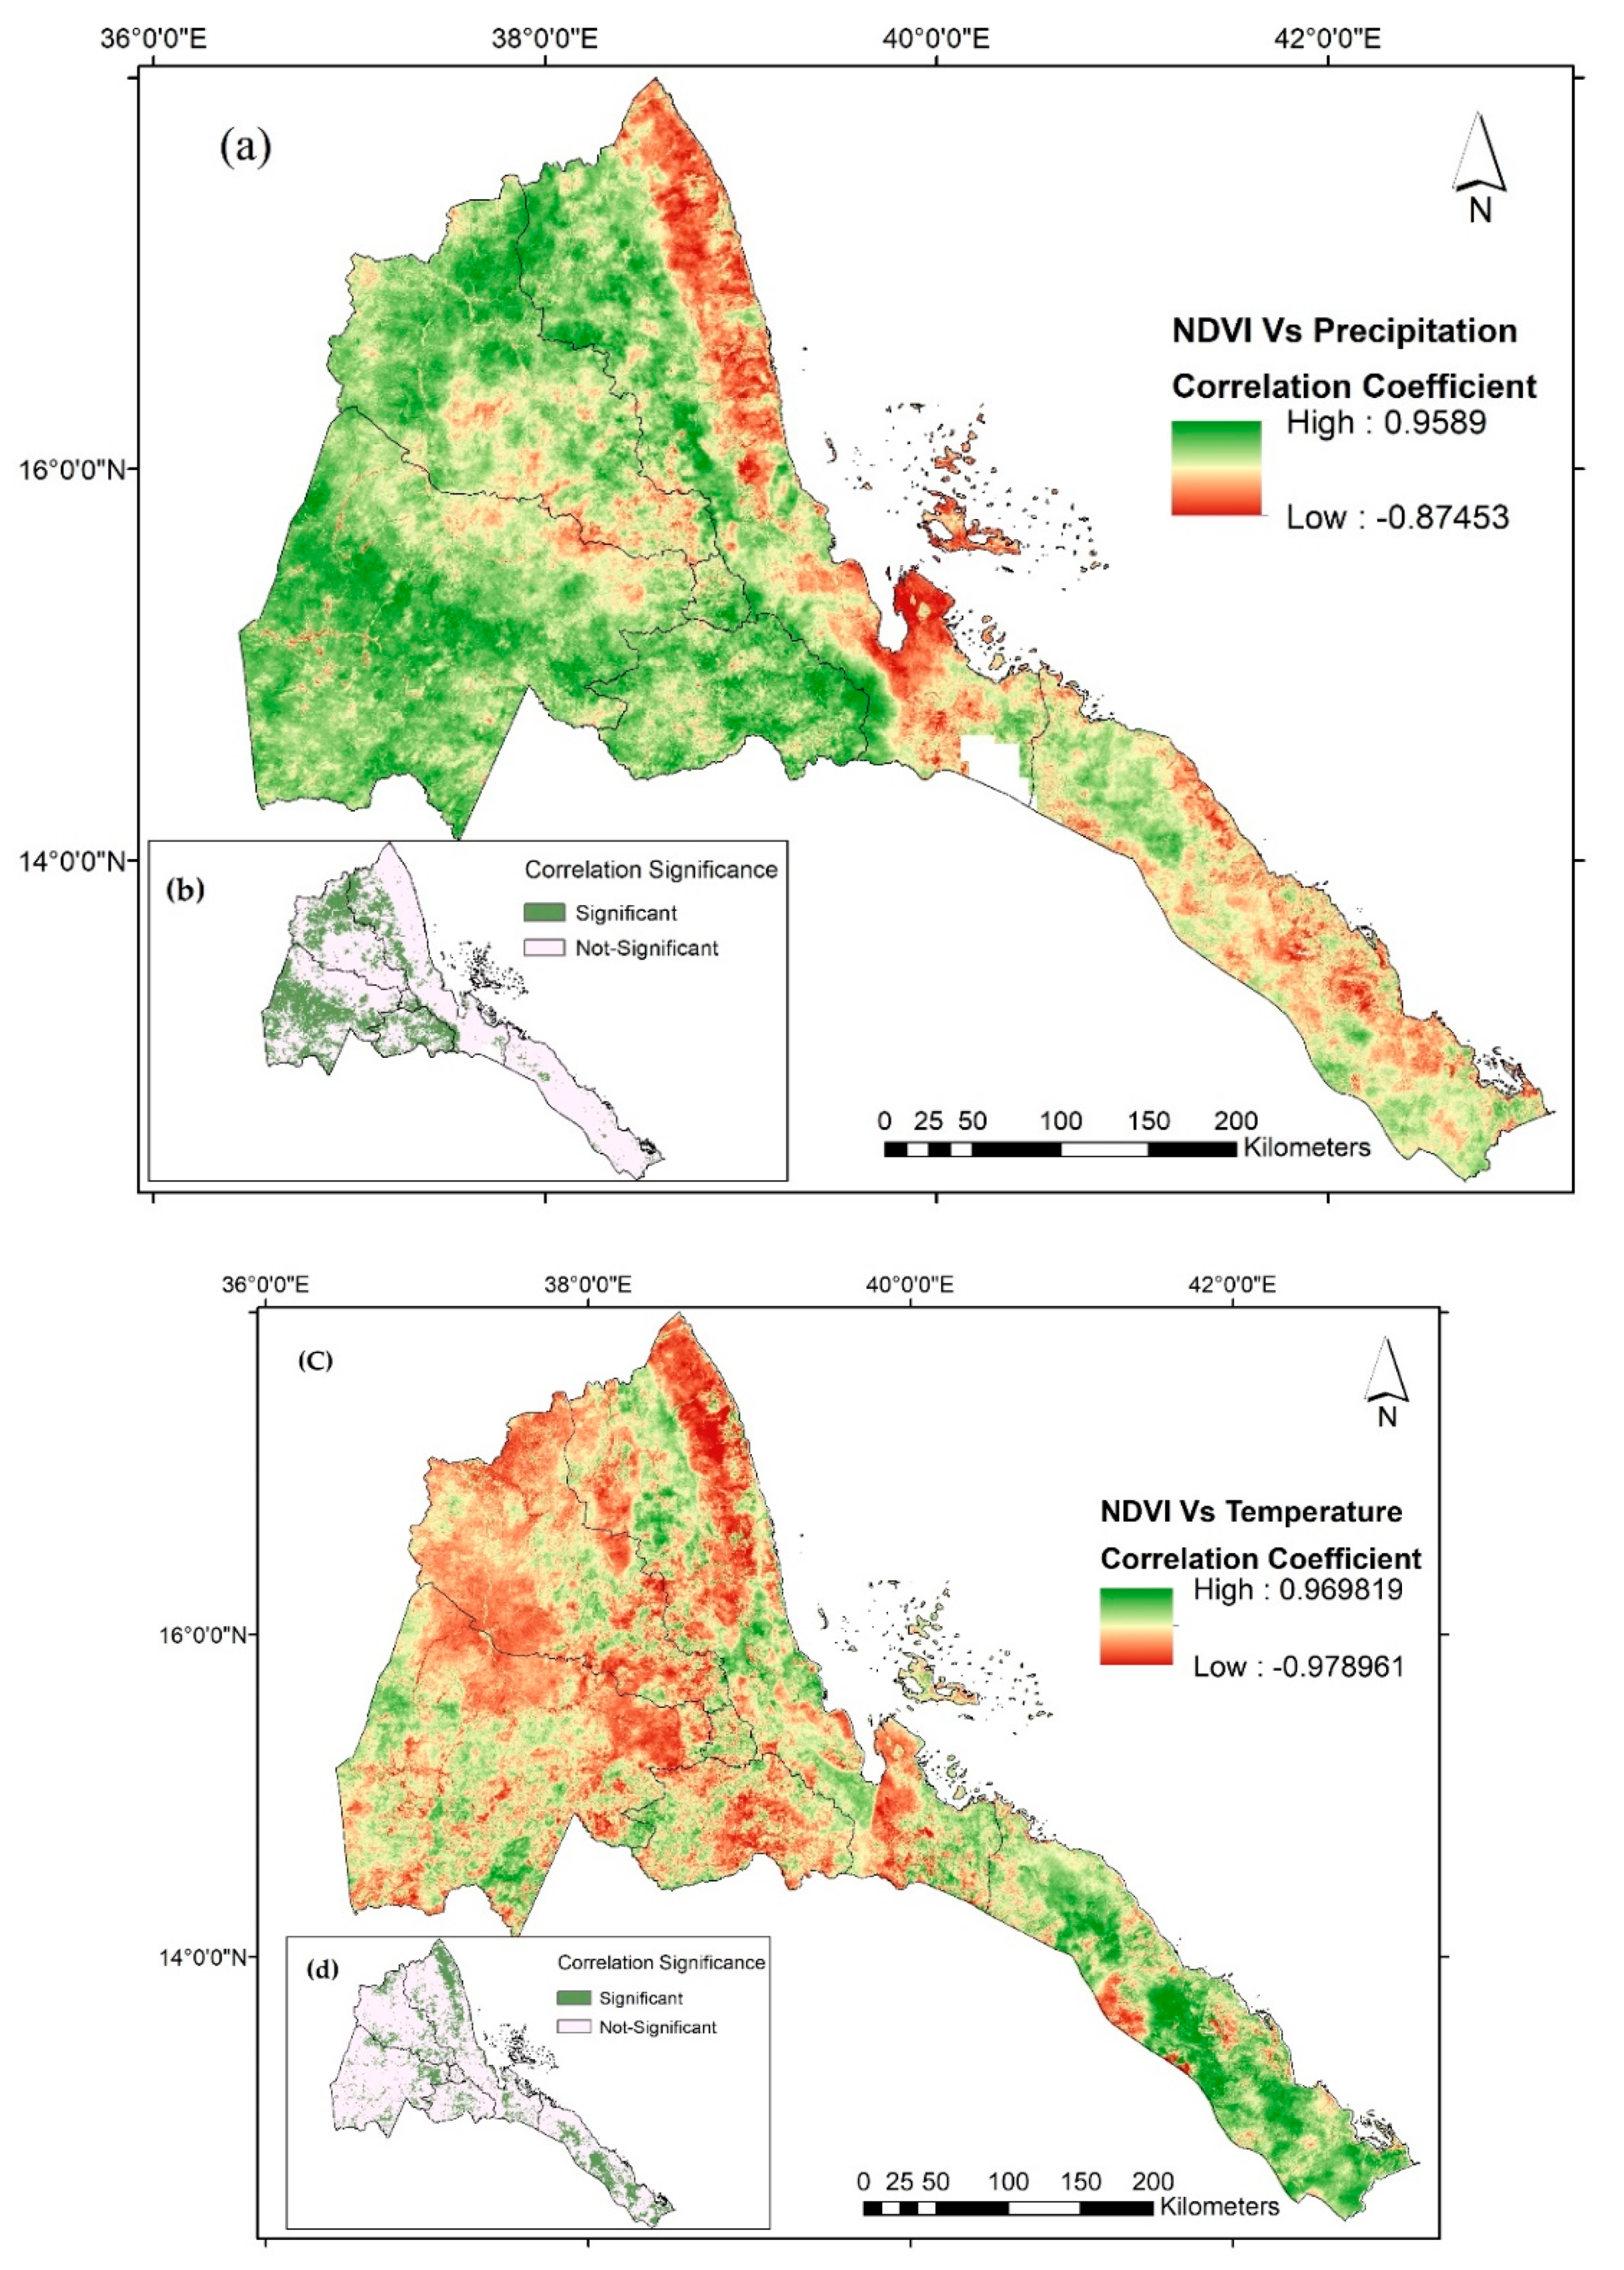
3.2. Time-Series Correlation Between NDVI and Climatic Factors
3.3. Spatial and Temporal Drought Patterns Based on VCI and SPI
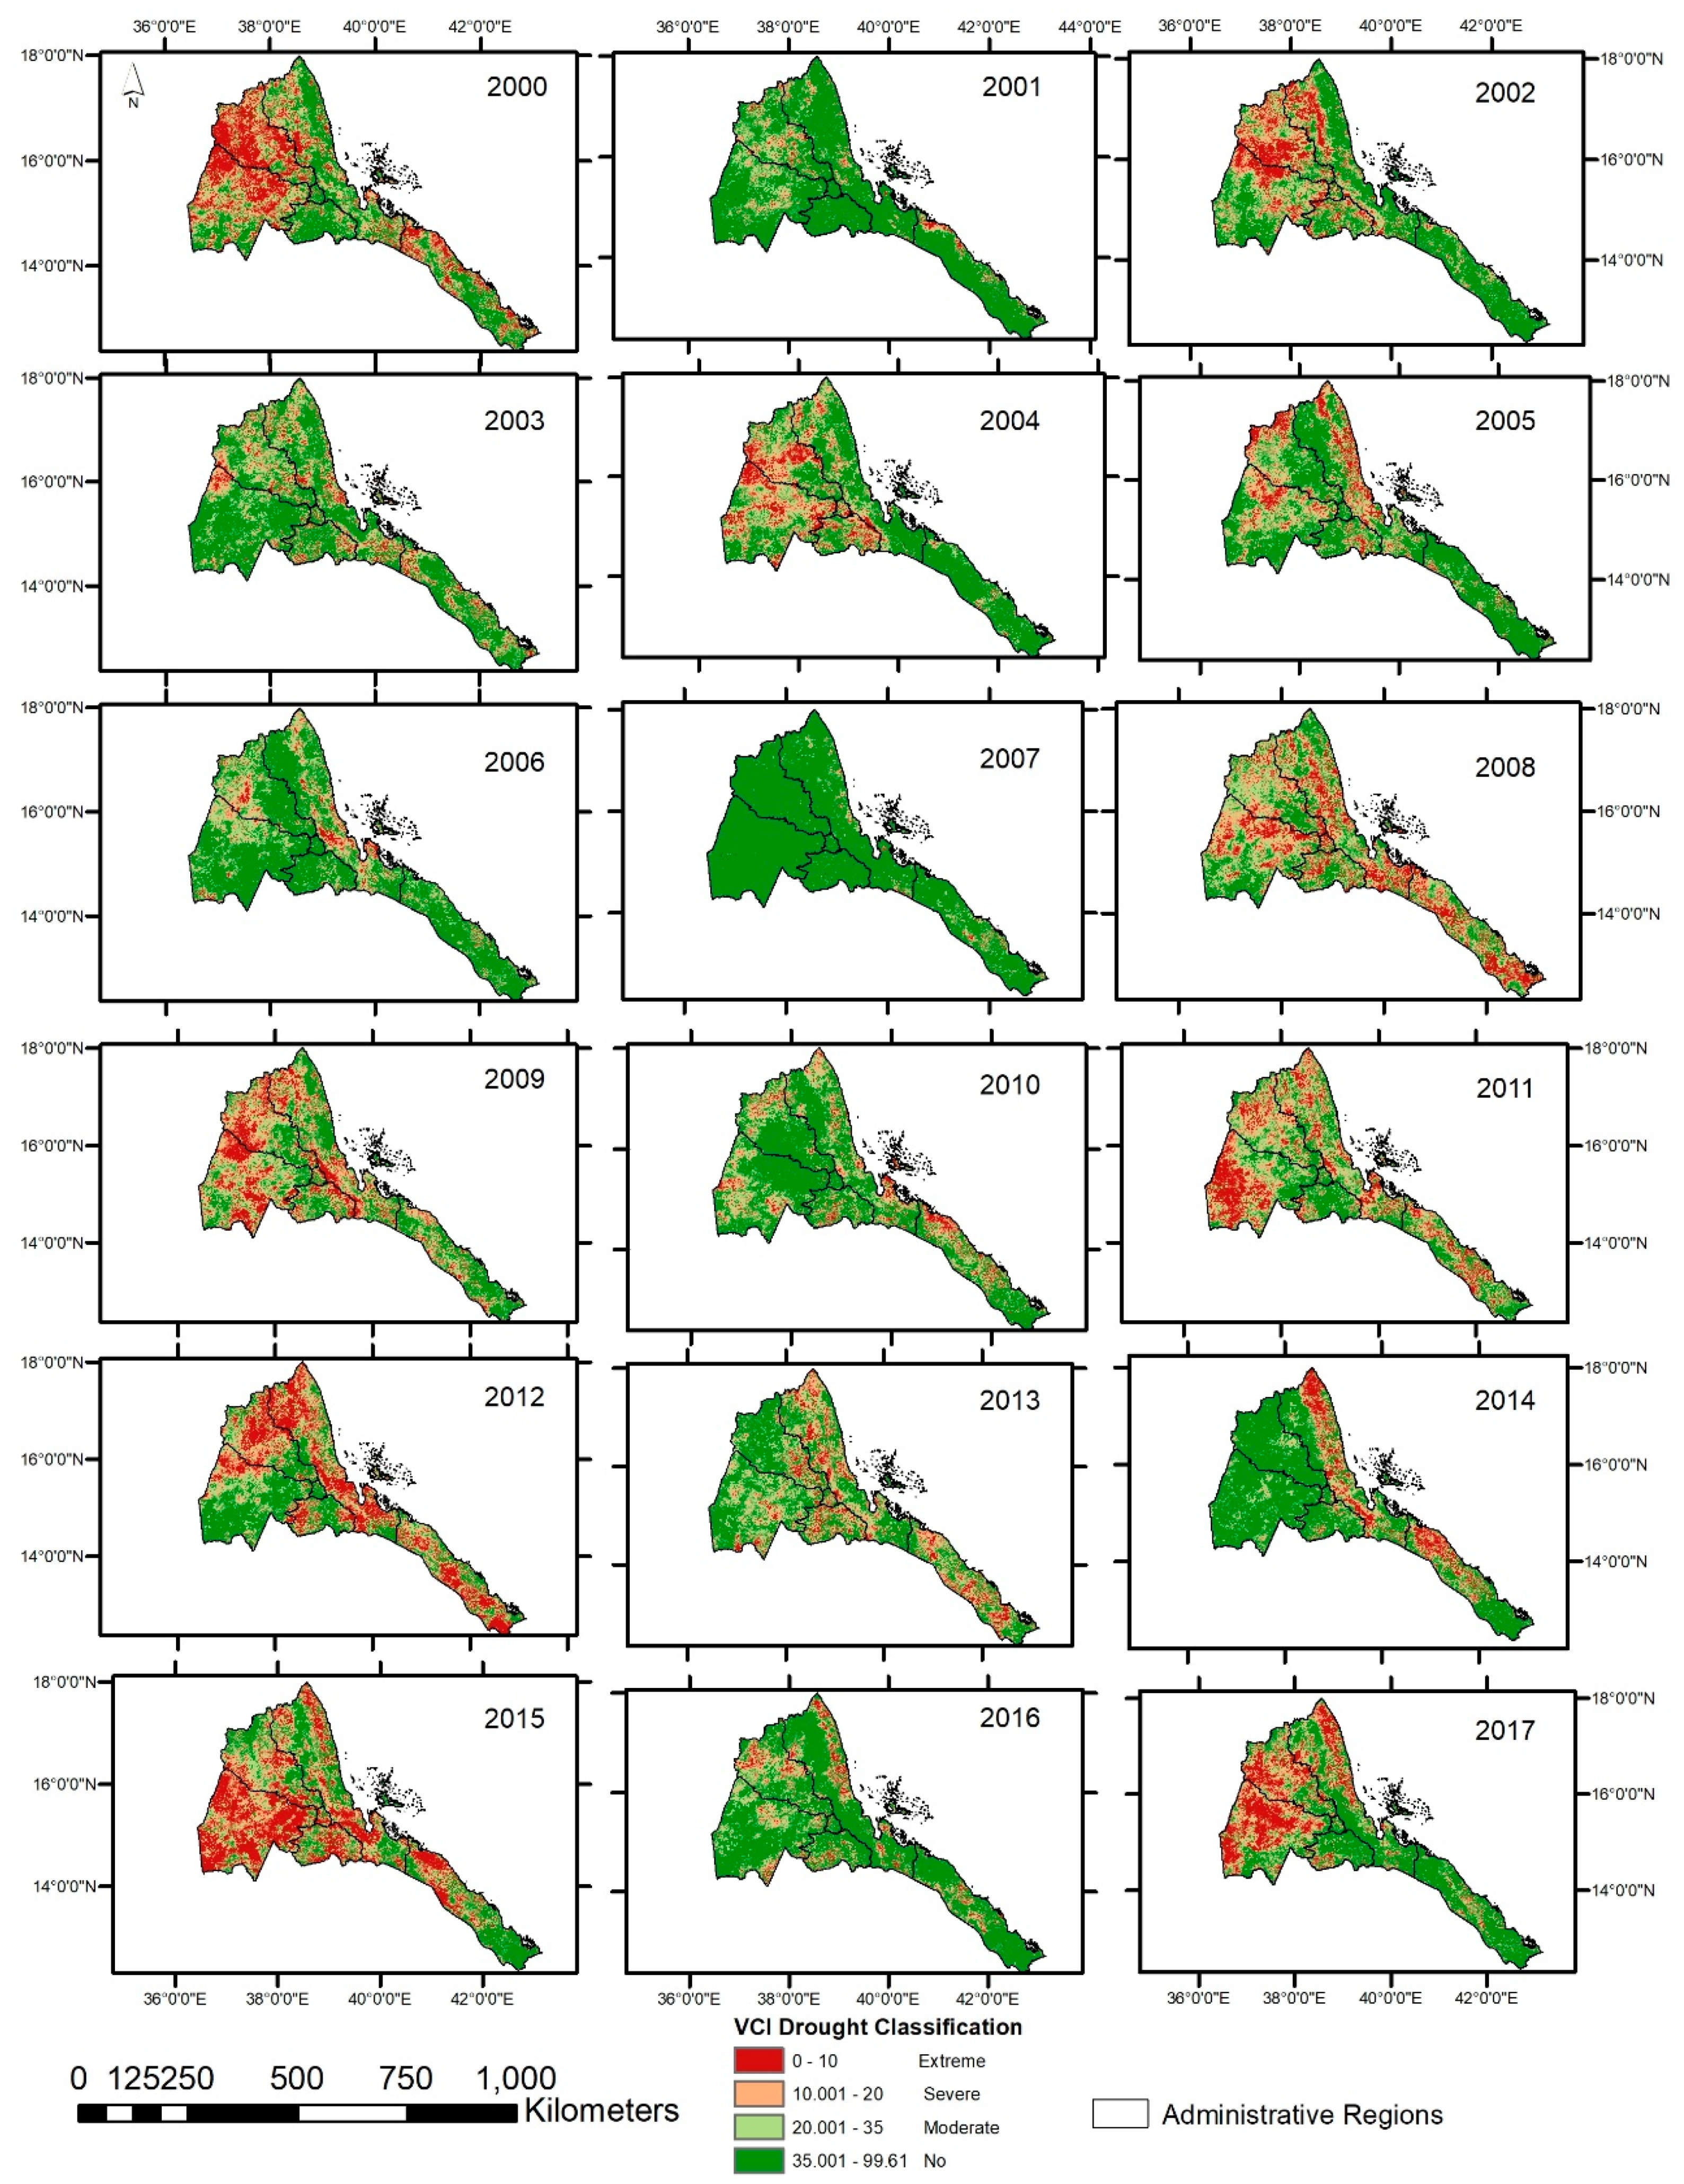
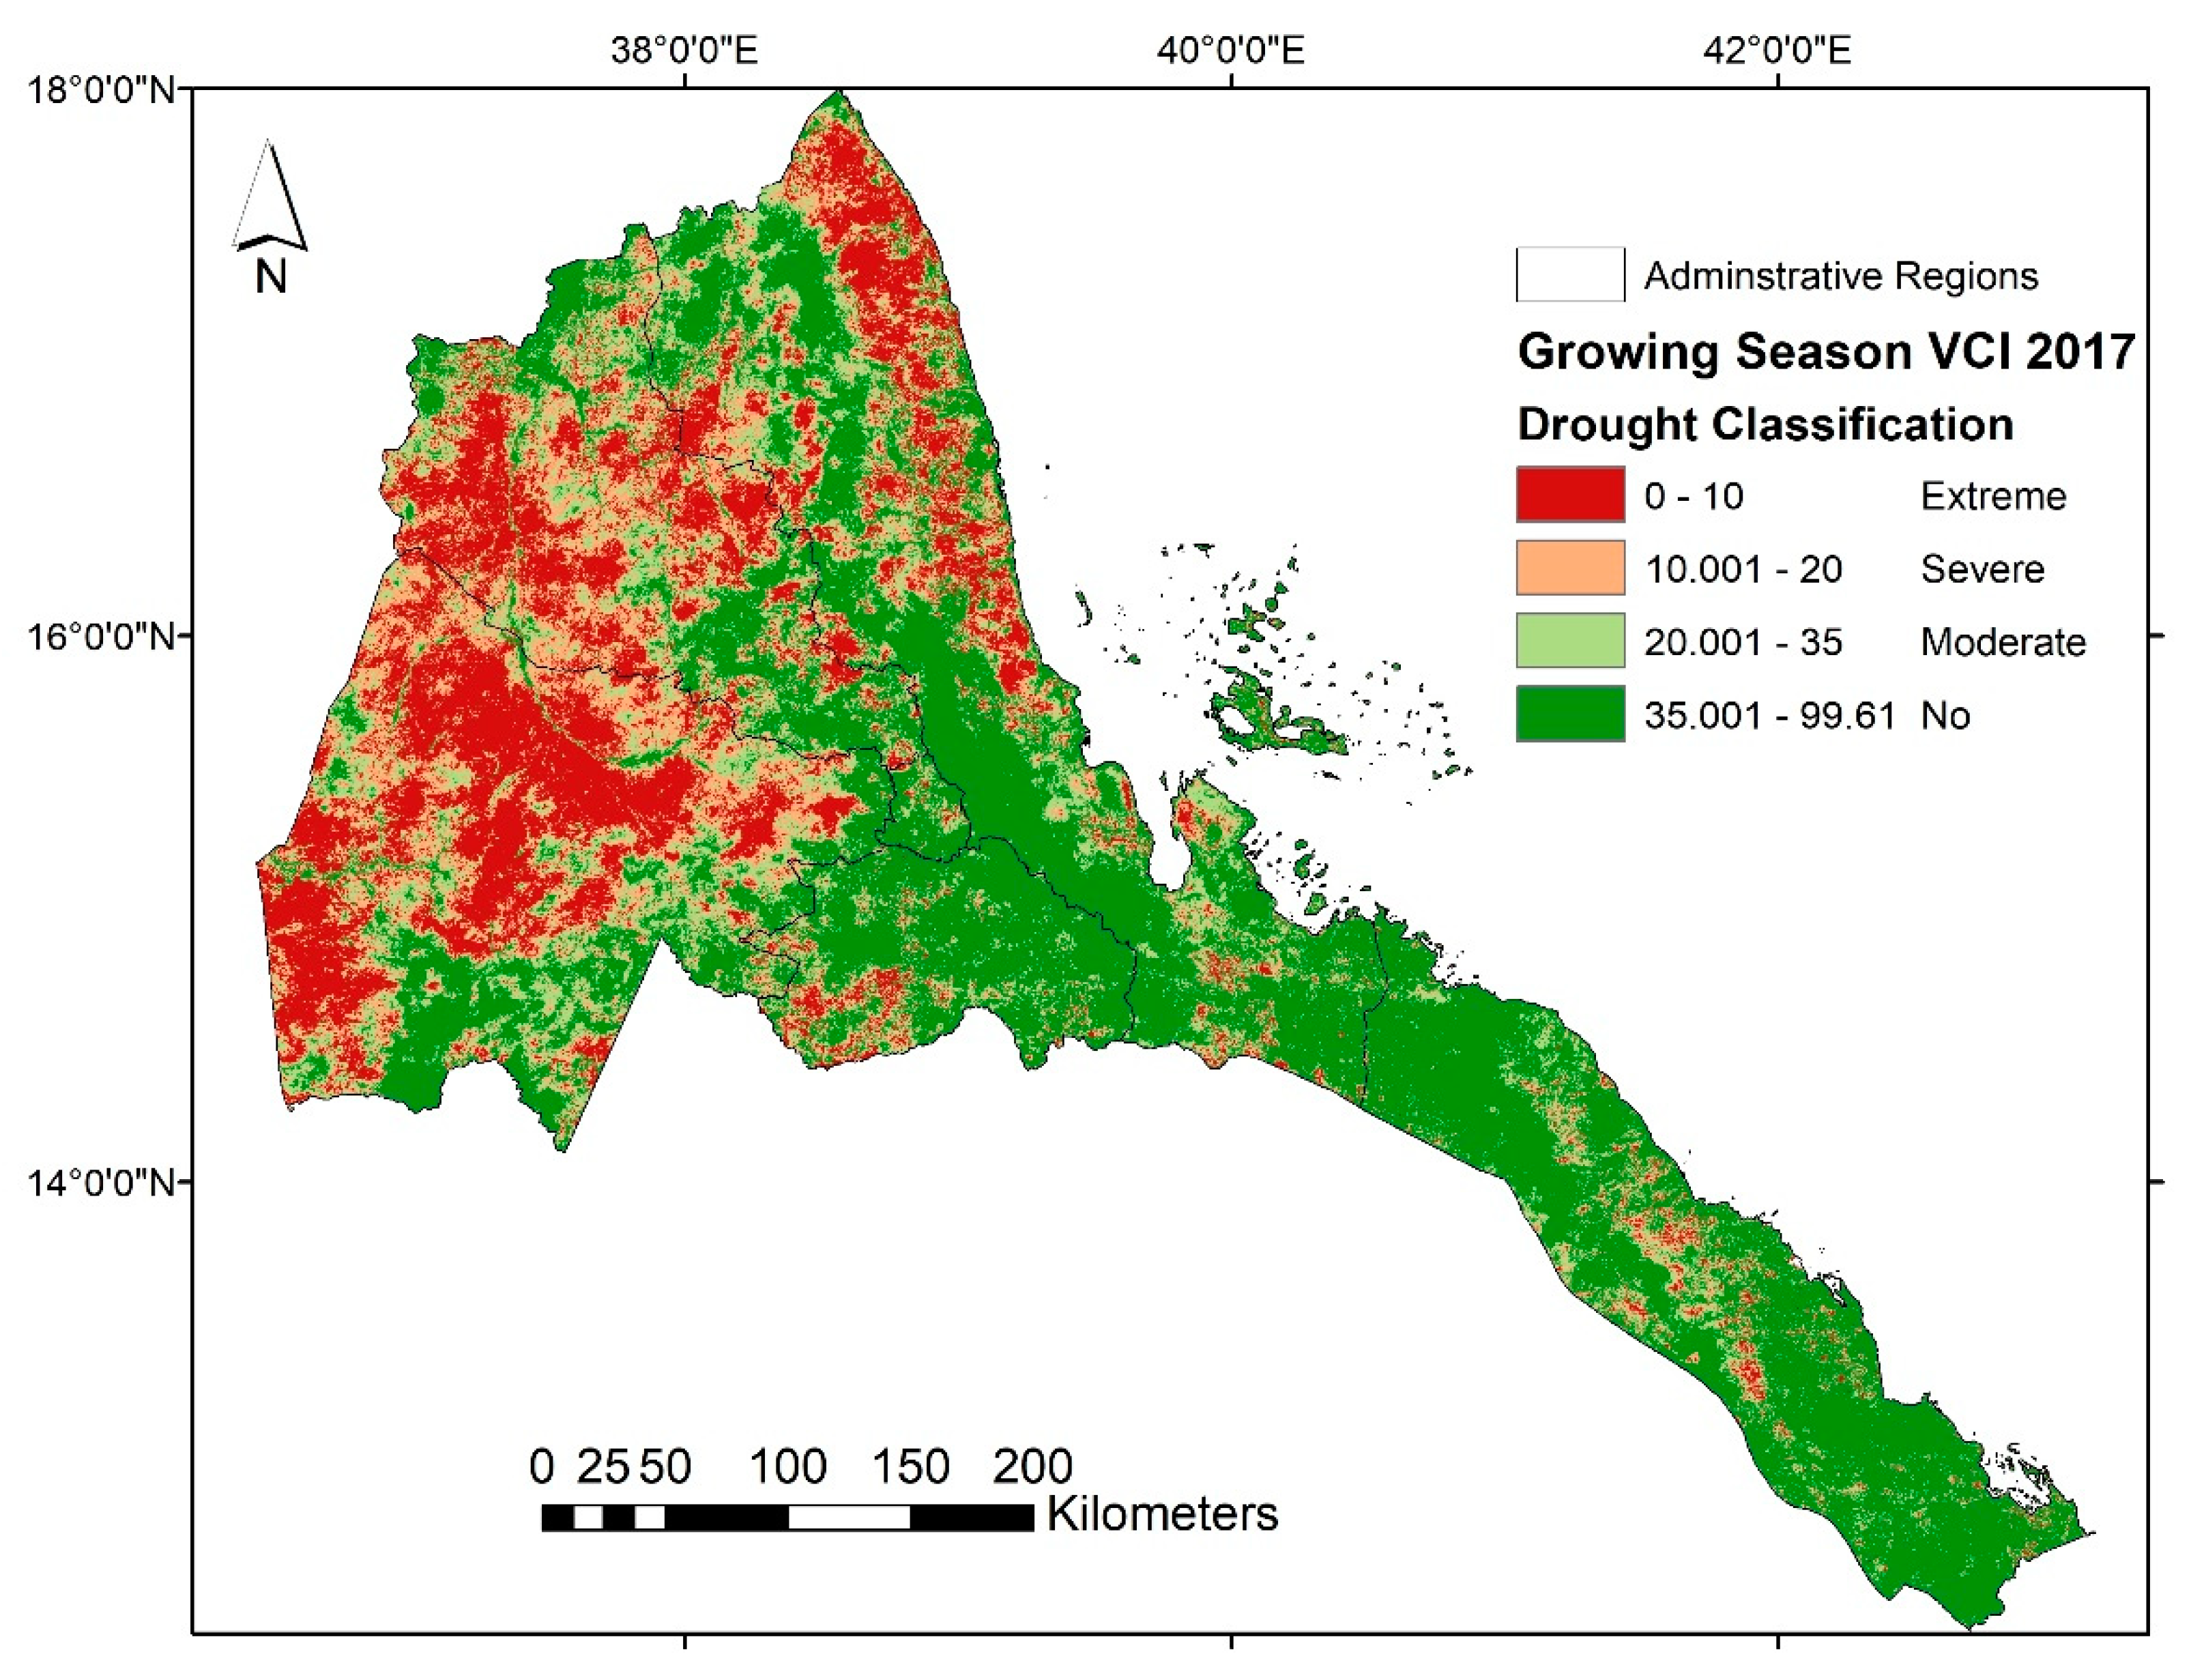
3.3.1. VCI and Drought Patterns
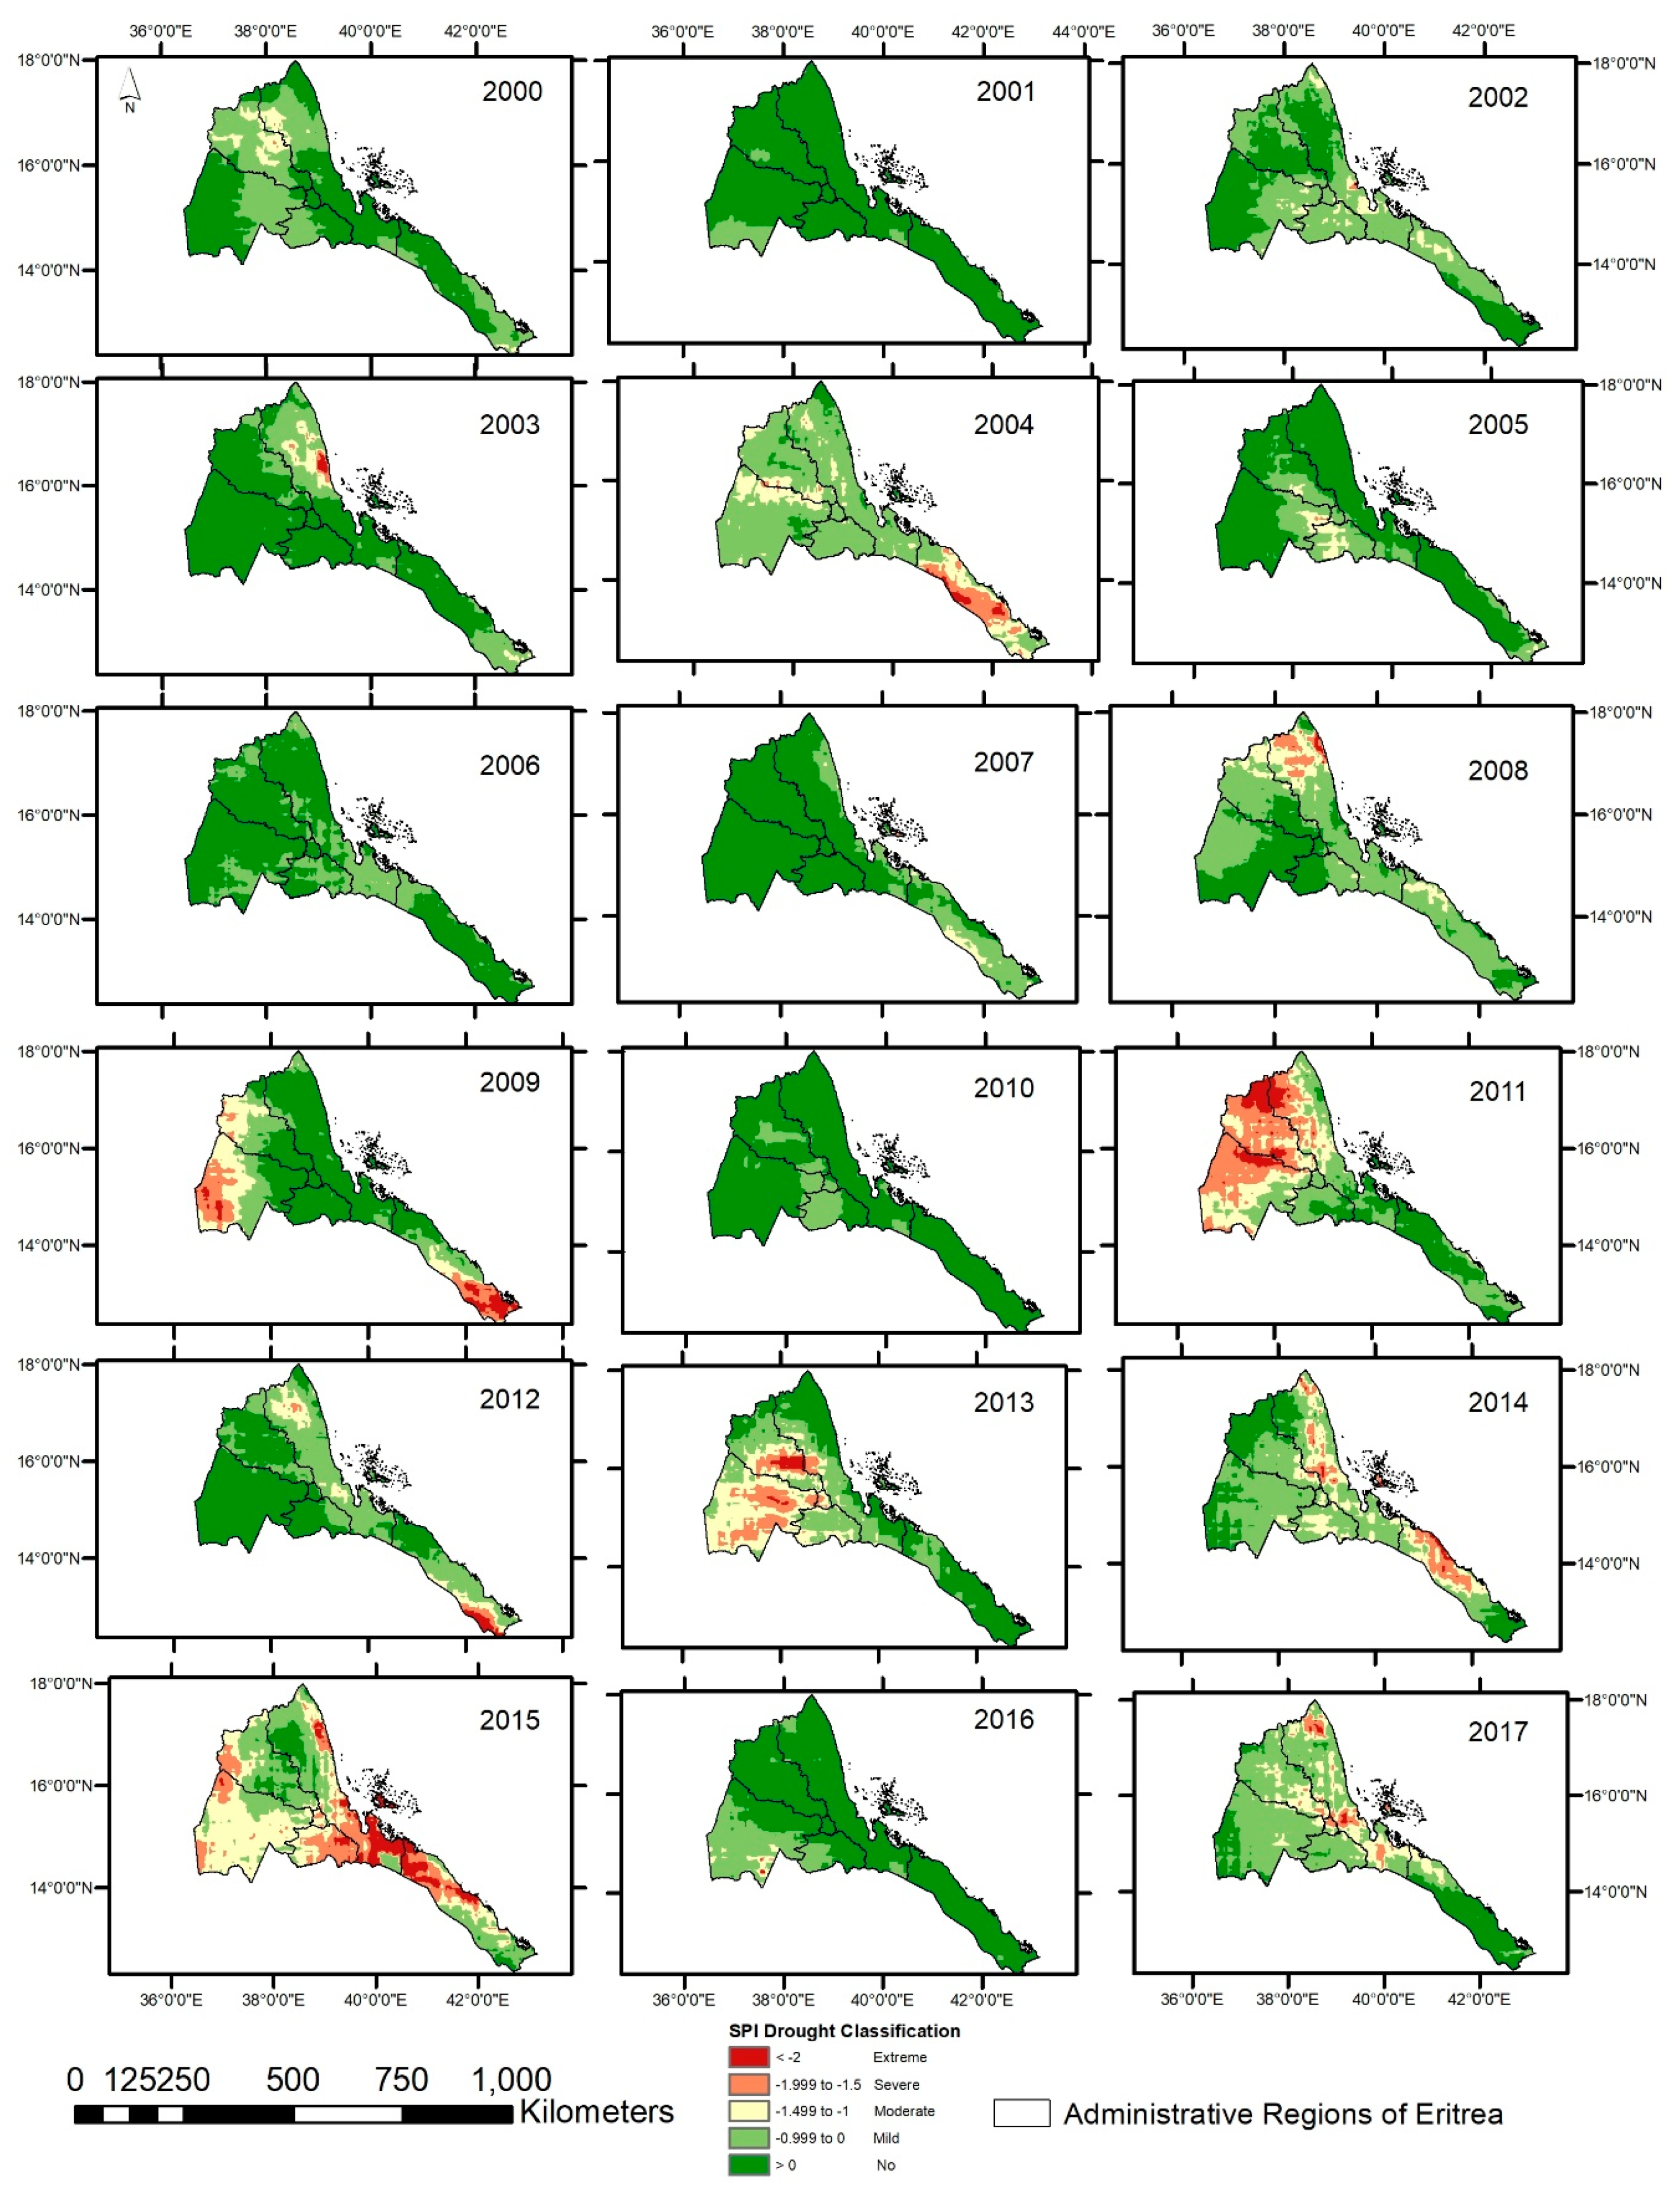
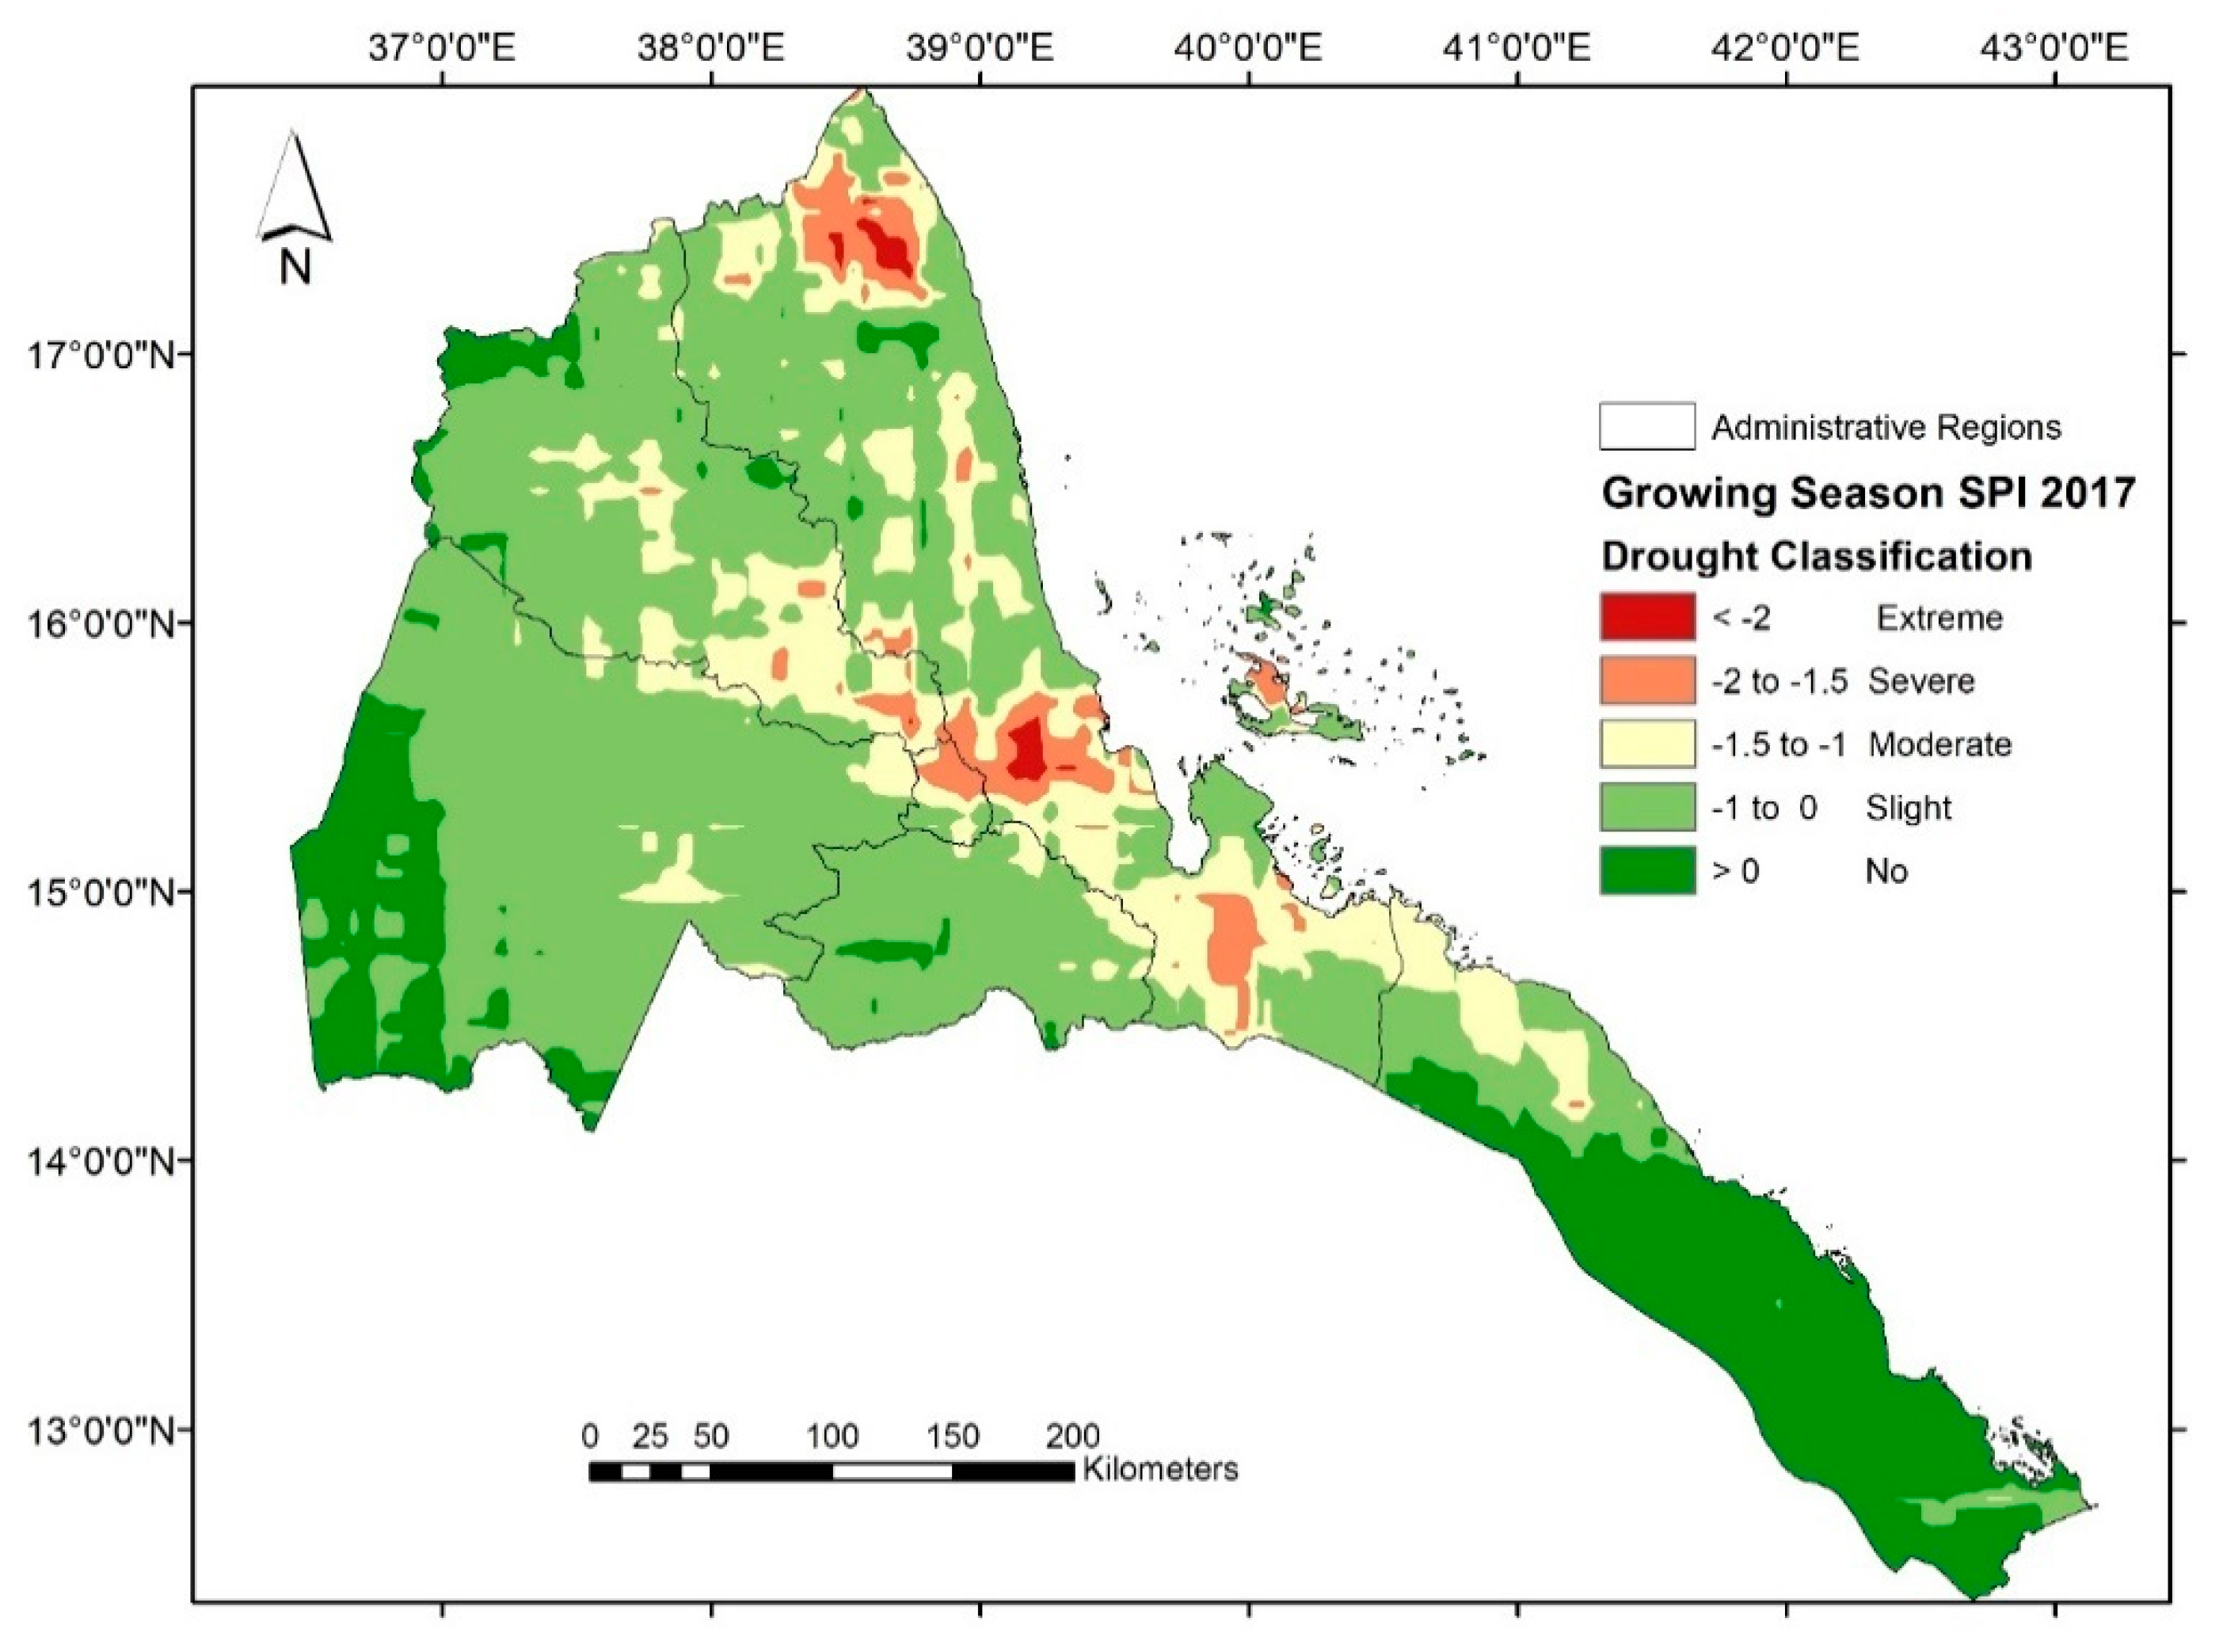
3.3.2. SPI and Drought Patterns
4. Discussion
5. Conclusions
Author Contributions
Funding
Acknowledgments
Conflicts of Interest
References
- Sykes, M.T. Climate Change Impacts: Vegetation. Encycl. Life Sci. 2009. [Google Scholar] [CrossRef]
- Na-U-Dom, T.; Mo, X.; Garcίa, M. Assessing the Climatic Effects on Vegetation Dynamics in the Mekong River Basin. Environments 2017, 4, 17. [Google Scholar] [CrossRef]
- Niang, I.; Ruppel, O.C.; Abdrabo, M.A.; Essel, A.; Lennard, C.; Padgham, J.; Africa, P.U. Climate Change 2014: Impacts, Adaptation, and Vulnerability; Dube, P., Leary, N., Eds.; Cambridge University Press: Cambridge, UK; New York, NY, USA, 2014; Volume 22, pp. 1199–1265. [Google Scholar]
- Bao, G.; Qin, Z.; Bao, Y.; Zhou, Y.; Li, W.; Sanjjav, A. NDVI-based long-term vegetation dynamics and its response to climatic change in the Mongolian plateau. Remote Sens. 2014, 6, 8337–8358. [Google Scholar] [CrossRef]
- Anderson, L.O.; Malhi, Y.; Arag o, L.E.O.C.; Ladle, R.; Arai, E.; Barbier, N.; Phillips, O. Remote sensing detection of droughts in Amazonian forest canopies. New Phytol. 2010, 187, 733–750. [Google Scholar] [CrossRef] [PubMed]
- Xie, B.; Jia, X.; Qin, Z.; Shen, J.; Chang, Q. Vegetation dynamics and climate change on the Loess Plateau, China: 1982–2011. Reg. Environ. Chang. 2015, 16, 1583–1594. [Google Scholar] [CrossRef]
- Xie, Y.; Sha, Z.; Yu, M. Remote sensing imagery in vegetation mapping: A review. J. Plant Ecol. 2008, 1, 9–23. [Google Scholar] [CrossRef]
- Zhong, L.; Ma, Y.; Salama, M.S.; Su, Z. Assessment of vegetation dynamics and their response to variations in precipitation and temperature in the Tibetan Plateau. Clim. Chang. 2010, 103, 519–535. [Google Scholar] [CrossRef]
- Fang, X.; Zhu, Q.; Chen, H.; Ma, Z.; Wang, W.; Song, X.; Zhao, P.; Peng, C. Analysis of vegetation dynamics and climatic variability impacts on greenness across Canada using remotely sensed data from 2000 to 2009. J. Appl. Remote Sens. 2014, 8, 083666. [Google Scholar] [CrossRef]
- Thenkabail, P.S.; Gamage, M.S.D.N.; Smakhtin, V.U. The Use of Remote-Sensing Data for Drought Assessment and Monitoring in Southwest Asia; Research Report 85; International Water Management Institute: Colombo, Sri Lanka, 2004; ISBN 9290905751. [Google Scholar]
- Suryabhagavan, K.V. GIS-based climate variability and drought characterization in Ethiopia over three decades. Weather Clim. Extremes 2017, 15, 11–23. [Google Scholar] [CrossRef]
- AghaKouchak, A.; Farahmand, A.; Melton, F.S.; Teixeira, J.; Anderson, M.C.; Wardlow, B.D.; Hain, C.R. Remote sensing of drought: Progress, challenges and opportunities. Rev. Geophys. 2015, 53, 452–480. [Google Scholar] [CrossRef]
- Quiring, S.M.; Ganesh, S. Evaluating the utility of the Vegetation Condition Index (VCI) for monitoring meteorological drought in Texas. Agric. For. Meteorol. 2010, 150, 330–339. [Google Scholar] [CrossRef]
- Linés, C.; Werner, M.; Bastiaanssen, W. The predictability of reported drought events and impacts in the Ebro Basin using six different remote sensing data sets. Hydrol. Earth Syst. Sci. 2017, 21, 4747–4765. [Google Scholar] [CrossRef]
- Rosso, C.C.; Hochrainer-stigler, S.; Pflug, G.; Condori, B. Early warning and drought risk assessment for the Bolivian Altiplano agriculture using high resolution satellite imagery data. Nat. Hazards Earth Syst. Scie. Discuss. 2018, 1–23. [Google Scholar] [CrossRef]
- Ayana, E.K.; Ceccato, P.; Fisher, J.R.B.; DeFries, R. Examining the relationship between environmental factors and conflict in pastoralist areas of East Africa. Sci. Total Environ. 2016, 557–558, 601–611. [Google Scholar] [CrossRef]
- Ministry of Land, Water and Environment (MoLWE). Eitrea’s Intended Nationally Determined Contribution (INDCs) Report; Ministry of Land, Water and Environment (MoLWE): Asmara, Eritrea, 2015.
- Ghebrezgabher, M.G.; Yang, T.; Yang, X.; Wang, X.; Khan, M. Extracting and analyzing forest and woodland cover change in Eritrea based on landsat data using supervised classification. Egypt. J. Remote Sens. Space Sci. 2016, 19, 37–47. [Google Scholar] [CrossRef]
- African Development Bank. Eritrea Interim Country Strategy Paper (I-CSP) 2014–2016; East Africa Regional Resource Center (EARC): Abidjan, Côte d’Ivoire, 2014. [Google Scholar]
- EM-DAT 2015 Eritrea—Disaster & amp; Risk Profile|PreventionWeb.net. Available online: https://www.preventionweb.net/countries/eri/data/ (accessed on 26 October 2018).
- Food and Agriculture Organization (FAO) WATER REPKORTS. AQUASTAT Survey 2005. Irrigation in Africa in Figures; Frenken, K., Ed.; FAO Land and Water Development Division, Food And Agriculture Organization of the United Nations: Rome, Italy, 2005; Volume 29, ISBN 92-5-105414-2. [Google Scholar]
- Didan, K. MOD13Q1 V006|LP DAAC::NASA Land Data Products and Services. Available online: https://lpdaac.usgs.gov/node/844 (accessed on 17 September 2018).
- Huntington, J.L.; Hegewisch, K.C.; Daudert, B.; Morton, C.G.; Abatzoglou, J.T.; McEvoy, D.J.; Erickson, T. Climate engine: Cloud computing and visualization of climate and remote sensing data for advanced natural resource monitoring and process understanding. Bull. Am. Meteorol. Soc. 2017, 98, 2397–2409. [Google Scholar] [CrossRef]
- Funk, C.; Peterson, P.; Landsfeld, M.; Pedreros, D.; Verdin, J.; Shukla, S.; Husak, G.; Rowland, J.; Harrison, L.; Hoell, A.; et al. The climate hazards infrared precipitation with stations—A new environmental record for monitoring extremes. Sci. Data 2015, 2, 1–21. [Google Scholar] [CrossRef] [PubMed]
- Kang, C.H.; Zhang, Y.; Wang, Z.; Liu, L.; Zhang, H.; Jo, Y. The driving force analysis of NDVI dynamics in the trans-boundary Tumen River Basin between 2000 and 2015. Sustainbility 2017, 9, 2350. [Google Scholar] [CrossRef]
- Jiang, L.; Jiapaer, G.; Bao, A.; Guo, H.; Ndayisaba, F. Vegetation dynamics and responses to climate change and human activities in Central Asia. Sci. Total Environ. 2017, 599–600, 967–980. [Google Scholar] [CrossRef]
- Baniya, B.; Tang, Q. Spatial and Temporal Variation of NDVI in Response to Climate Change and the Implication for Carbon Dynamics in Nepal. Forests 2018, 9, 329. [Google Scholar] [CrossRef]
- Weatherhead, E.C.; Reinsel, G.C.; Tiao, G.C.; Meng, X.-L.; Choi, D.; Cheang, W.-K.; Keller, T.; DeLuisi, J.; Wuebbles, D.J.; Kerr, J.B.; et al. Factors affecting the detections of trends: Statistical considerations and applications to environmental data. J. Geophys. Res. Atmos. 1998, 103, 17149–17161. [Google Scholar] [CrossRef]
- Eckert, S.; Hüsler, F.; Liniger, H.; Hodel, E. Trend analysis of MODIS NDVI time series for detecting land degradation and regeneration in Mongolia. J. Arid Environ. 2015, 113, 16–28. [Google Scholar] [CrossRef]
- Sun, J.; Qin, X. Precipitation and temperature regulate the seasonal changes of NDVI across the Tibetan Plateau. Environ. Earth Sci. 2016, 75, 1–9. [Google Scholar] [CrossRef]
- Guo, W.; Ni, X.; Jing, D.; Li, S. Spatial-temporal patterns of vegetation dynamics and their relationships to climate variations in Qinghai Lake Basin using MODIS time-series data. J. Geogr. Sci. 2014, 24, 1009–1021. [Google Scholar] [CrossRef]
- Graw, V.; Ghazaryan, G.; Dall, K.; Gómez, A.D.; Abdel-Hamid, A.; Jordaan, A.; Piroska, R.; Post, J.; Szarzynski, J.; Walz, Y.; et al. Drought dynamics and vegetation productivity in different land management systems of Eastern Cape, South Africa-A remote sensing perspective. Sustainbility 2017, 9, 1728. [Google Scholar] [CrossRef]
- Winkler, K.; Gessner, U.; Hochschild, V. Identifying droughts affecting agriculture in Africa based on remote sensing time series between 2000–2016: Rainfall anomalies and vegetation condition in the context of ENSO. Remote Sens. 2017, 9, 831. [Google Scholar] [CrossRef]
- Kogan, F.; Spivak, L.; Gitelson, A.; Zakarin, E.; Lebed, L. AVHRR-Based Spectral Vegetation Index for Quantitative Assessment of Vegetation State and Productivity: Calibration and Validation AVHRR-Based Spectral Vegetation Index for Quantitative Assessment of Vegetation State and Productivity: Calibration and Va. Photogramm. Eng. Remote Sens. 2003, 69, 899–906. [Google Scholar] [CrossRef]
- Klisch, A.; Atzberger, C. Operational drought monitoring in Kenya using MODIS NDVI time series. Remote Sens. 2016, 8, 267. [Google Scholar] [CrossRef]
- Mckee, T.B.; Doesken, N.J.; Kleist, J. The relationship of drought frequency and duration to time scales. In Proceedings of the 8th Conference on Applied Climatology; American Meteorological Society: Boston, MA, USA, 1993; pp. 17–22. [Google Scholar]
- Ren, G.; Zhou, Y.; Chu, Z.; Zhou, J.; Zhang, A.; Guo, J.; Liu, X. Standardized Precipitation Index User Guide. J. Clim. 2008, 21, 1333–1348. [Google Scholar] [CrossRef]
- Pellikka, P.; Alshaikh, A.Y. Remote sensing of the decrease of juniper woodlands in the mountains of Southwestern Saudi Arabia—Reasons and consequences. Arab. J. Geosci. 2016, 9, 457. [Google Scholar] [CrossRef]
- Soysal, Ö.M.; Schneider, H.; Shrestha, A.; Guempel, C.D.; Li, P. Zonal Statistics to Identify Hot-Regions of Traffic Accidents. In Proceedings of the 9th International Conference on Modeling, Simulation and Visualization Methods (MSV’12), Las Vegas, NV, USA, 16–19 July 2012. WORLDCOMP’12. [Google Scholar]
- Ghebrezgabher, M.G.; Yang, T.; Yang, X. Remote Sensing and GIS Analysis of Deforestation and Desertification in Central Highland and Eastern Region of Eritrea (1972–2014). Int. J. Sci. Basic Appl. Res. 2014, 18, 161–176. [Google Scholar]
- Jamali, S.; Seaquist, J.; Eklundh, L.; Ardö, J. Comparing parametric and non-parametric approaches for estimating trends in multi-year NDVI. In 1st EARSeL Workshop on Temporal Analysis of Satellite Images; Department of Physical Geography and Ecosystem Science: Mykonos, Greece, 2012; p. 6. [Google Scholar]
- Waithaka, M.; Nelson, G.C.; Thomas, T.S.; Kyotalimye, M. East African Agriculture and Climate Change: A Comprehensive Analysis; International Food Policy Research Institute: Washington, DC, USA, 2013; ISBN 9780896292055. [Google Scholar]
- Tesfaye, G.A. Monitoring Trends of Greenness and LULC (Land Use/Land Cover) Change in Addis Ababa and Its Surrounding Using MODIS Time-Series and LANDSAT Data. Master’s Thesis, Department of Physical Geography and Ecosystem Science, Lund University, Lund, Sweden, 2017. [Google Scholar]
- Fessehaye, M.; Abdul-Wahab, S.A.; Savage, M.J.; Kohler, T.; Gherezghiher, T.; Hurni, H. Assessment of fog-water collection on the eastern escarpment of Eritrea. Water Int. 2017, 42, 1022–1036. [Google Scholar] [CrossRef]
- Eman, E.A. Eritrea Forest Genetic Resources Working Papers State of Forest Genetic Resources in Eritrea. Sub-Regional Workshop FAO/IPGRI/ICRAF on the Conservation, Management, Sustainable Utilization and Enhancement of Forest Genetic Resources in Sahelian and North-Sudanian Africa, Ouagadougou, Burkina Faso, 22–24 September 1998. [Google Scholar]
- Iyob, B. Mapping Vegetation Using Landsat TM and ETM+ in Eritrea. Master’s Thesis, Department of Geosciences, Oregon State University, Corvallis, OR, USA, 2005. [Google Scholar]
- Abera, T.A.; Heiskanen, J.; Pellikka, P.; Maeda, E.E. Rainfall–vegetation interaction regulates temperature anomalies during extreme dry events in the Horn of Africa. Glob. Planet. Chang. 2018, 167, 35–45. [Google Scholar] [CrossRef]
- National Food Information System (NFIS) of Eritrea, Ministry of Agriculture. Monthly Food Security Outlook, Kremti Season Special Edition; National Food Information System (NFIS) of Eritrea, Ministry of Agriculture: Asmara, Eritrea, 2004. [Google Scholar]
- Gholinejad, B.; Farajollahi, A.; Pouzesh, H. Environmental factors affecting on distribution of plant communities in semi- arid area (Case study: Kamyaran rangelands, Iran). Ann. Biol. Res. 2012, 3, 3990–3993. [Google Scholar]
- Ghebrezgabher, M.G.; Yang, T.; Yang, X. Long-term trend of climate change and drought assessment in the Horn of Africa. Adv. Meteorol. 2016, 2016, 8057641. [Google Scholar] [CrossRef]
- Environment and Energy of United Nations Development Programme (UNDP), Case Study of Eritrea. Climate Change Adaptation Project Report in Water and Agriculture in Anseba Region, Keren, Eritrea, 2012; Environment and Energy of United Nations Development Programme: New York, NY, USA, 2012.
- Heiskanen, J.; Rautiainen, M.; Maeda, E.E.; Abera, T.A.; Pellikka, P. Clarifying the role of radiative mechanisms in the spatio-temporal changes of land surface temperature across the Horn of Africa. Remote Sens. Environ. 2018, 221, 210–224. [Google Scholar] [CrossRef]
- Hwan, M.; Eun, L.; Im, S.; Bae, D.H. A comparative assessment of climate change impacts on drought over Korea based on multiple climate projections and multiple drought indices. Clim. Dyn. 2019. [Google Scholar] [CrossRef]


| VCI Percentage | Drought Severity Level |
|---|---|
| >35 | No drought |
| 20 to 35 | Moderate drought |
| 10 to 20 | Severe drought |
| <10 | Extreme drought |
| SPI Range | Drought Severity Level |
|---|---|
| >0 | No drought |
| −1 to 0 | Mild drought |
| −1.5 to −1 | Moderate drought |
| −1.5 to − 2 | Severe drought |
| <−2 | Extreme drought |
© 2019 by the authors. Licensee MDPI, Basel, Switzerland. This article is an open access article distributed under the terms and conditions of the Creative Commons Attribution (CC BY) license (http://creativecommons.org/licenses/by/4.0/).
Share and Cite
Measho, S.; Chen, B.; Trisurat, Y.; Pellikka, P.; Guo, L.; Arunyawat, S.; Tuankrua, V.; Ogbazghi, W.; Yemane, T. Spatio-Temporal Analysis of Vegetation Dynamics as a Response to Climate Variability and Drought Patterns in the Semiarid Region, Eritrea. Remote Sens. 2019, 11, 724. https://doi.org/10.3390/rs11060724
Measho S, Chen B, Trisurat Y, Pellikka P, Guo L, Arunyawat S, Tuankrua V, Ogbazghi W, Yemane T. Spatio-Temporal Analysis of Vegetation Dynamics as a Response to Climate Variability and Drought Patterns in the Semiarid Region, Eritrea. Remote Sensing. 2019; 11(6):724. https://doi.org/10.3390/rs11060724
Chicago/Turabian StyleMeasho, Simon, Baozhang Chen, Yongyut Trisurat, Petri Pellikka, Lifeng Guo, Sunsanee Arunyawat, Venus Tuankrua, Woldeselassie Ogbazghi, and Tecle Yemane. 2019. "Spatio-Temporal Analysis of Vegetation Dynamics as a Response to Climate Variability and Drought Patterns in the Semiarid Region, Eritrea" Remote Sensing 11, no. 6: 724. https://doi.org/10.3390/rs11060724
APA StyleMeasho, S., Chen, B., Trisurat, Y., Pellikka, P., Guo, L., Arunyawat, S., Tuankrua, V., Ogbazghi, W., & Yemane, T. (2019). Spatio-Temporal Analysis of Vegetation Dynamics as a Response to Climate Variability and Drought Patterns in the Semiarid Region, Eritrea. Remote Sensing, 11(6), 724. https://doi.org/10.3390/rs11060724