Dramatic Loss of Agricultural Land Due to Urban Expansion Threatens Food Security in the Nile Delta, Egypt


Abstract
:
1. Introduction
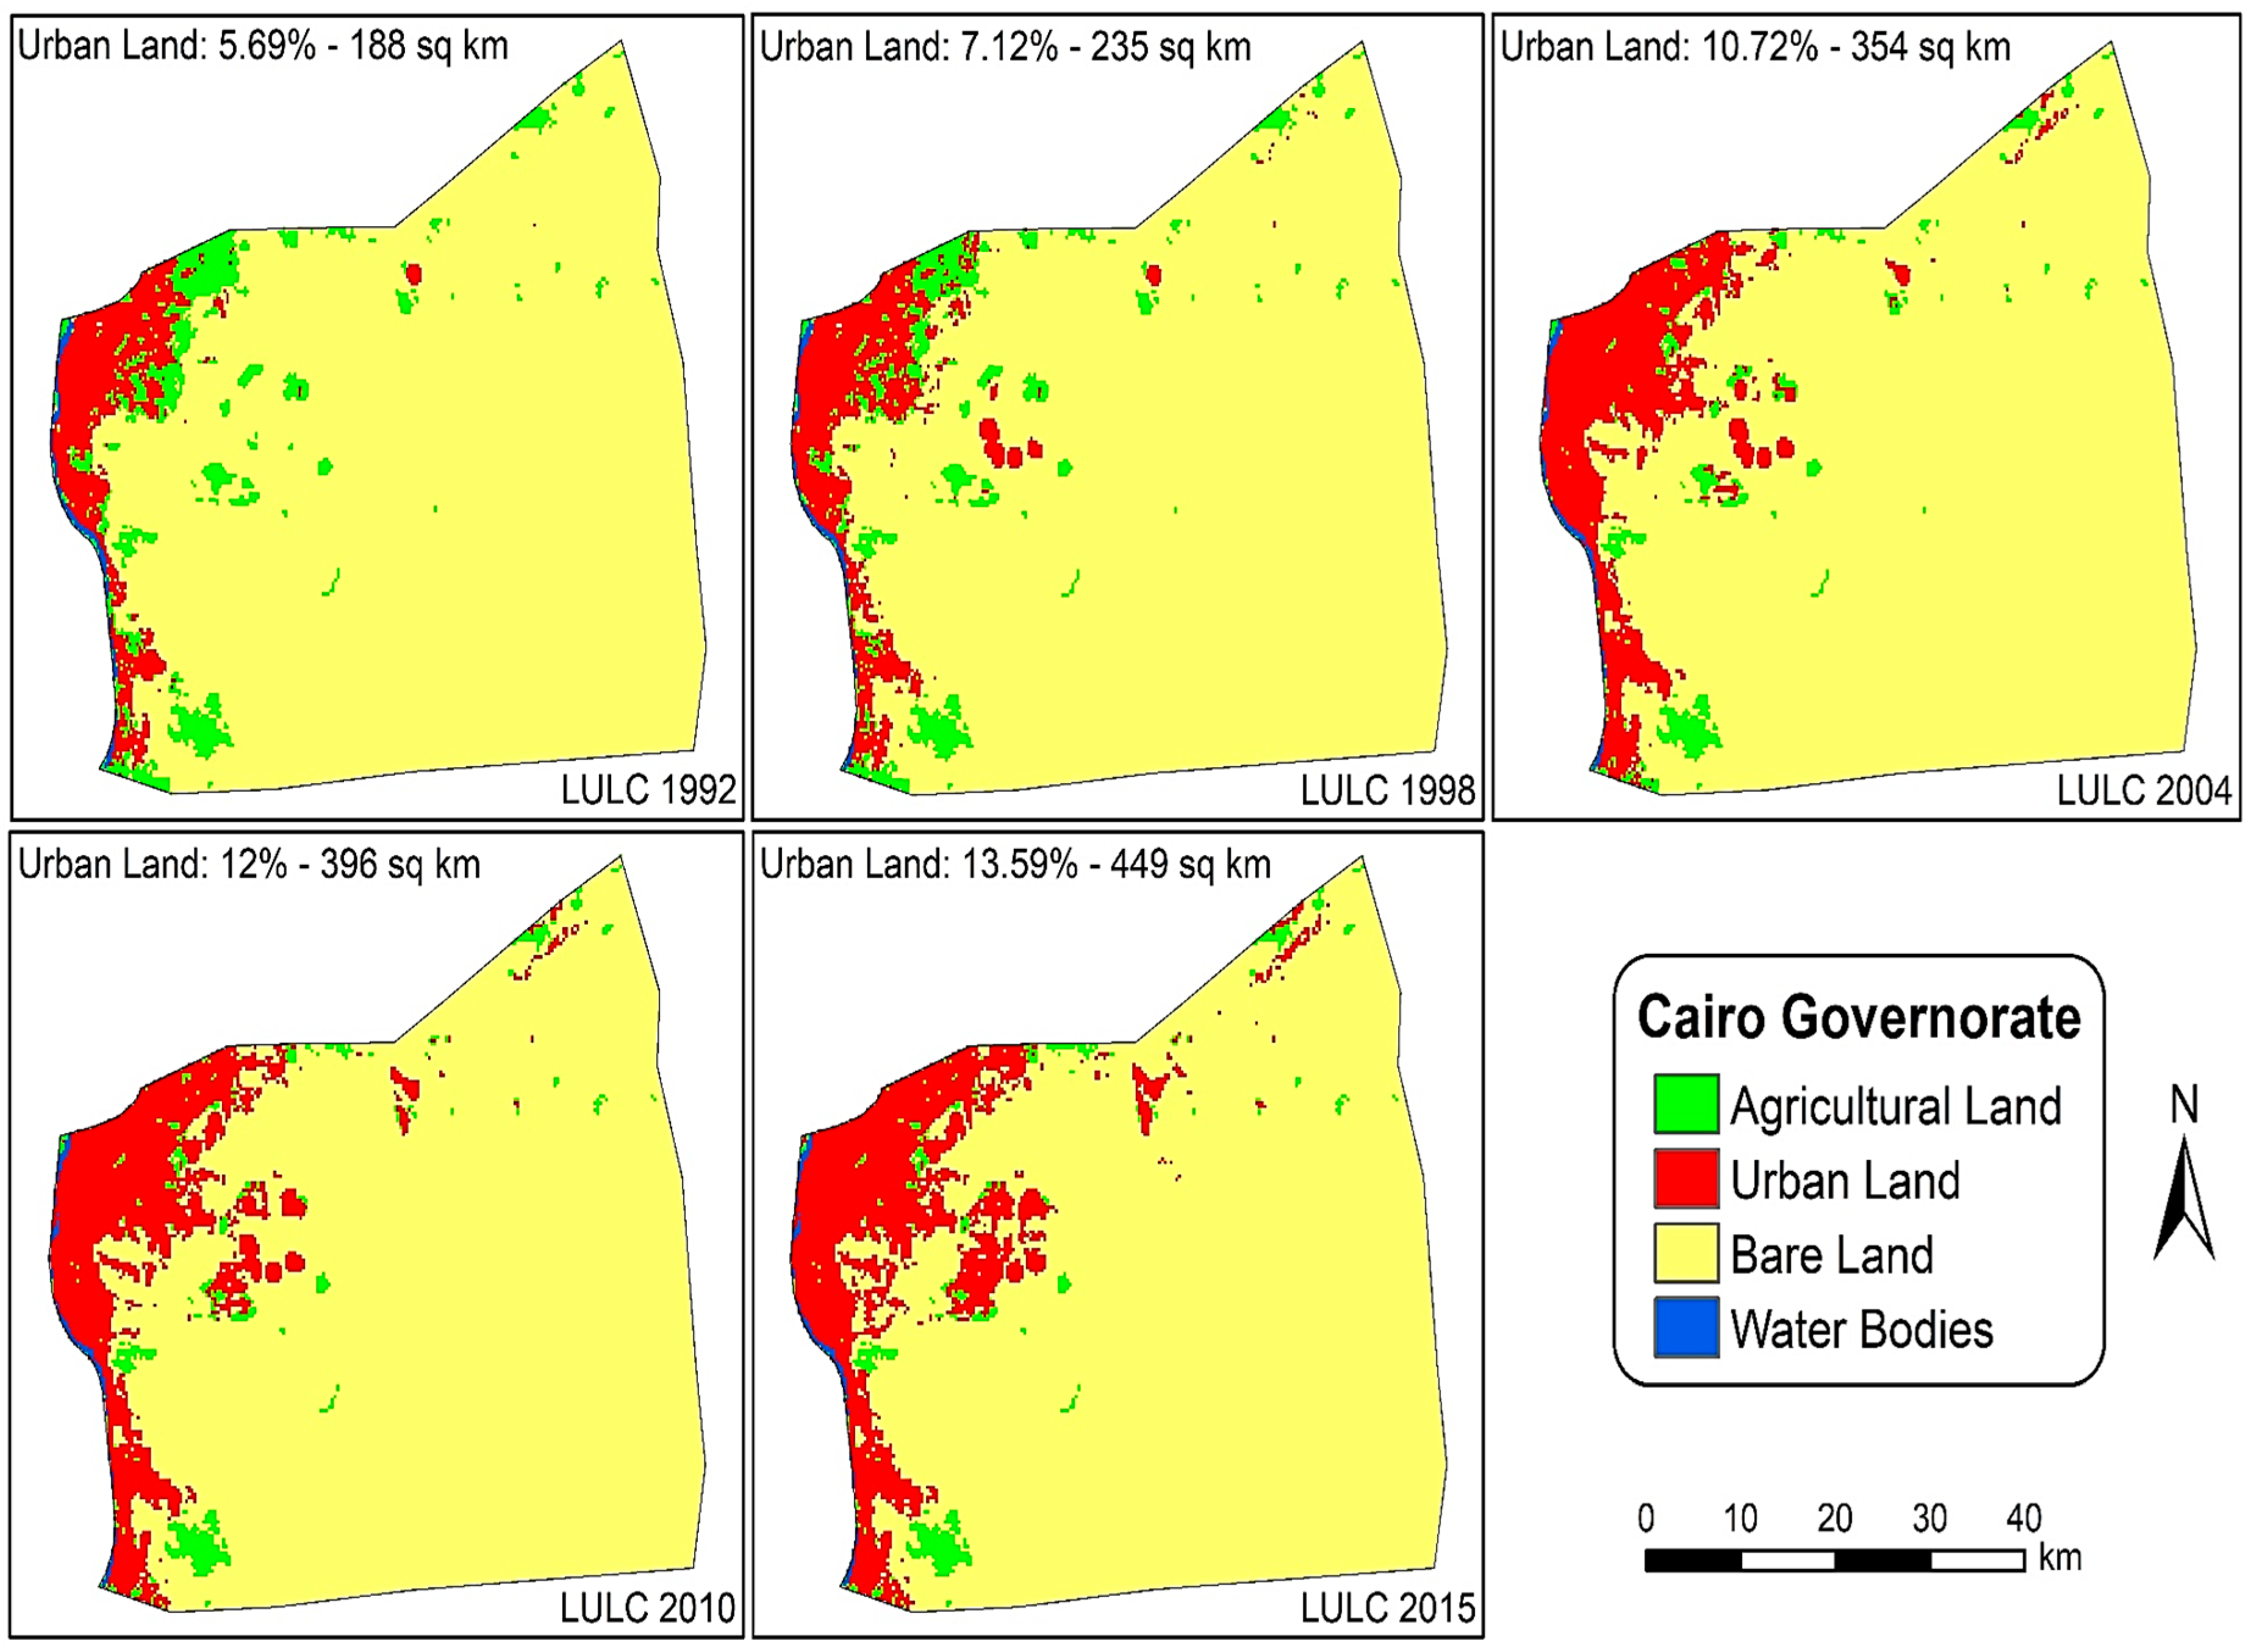
- Monitor historic changes in LULC in the Nile Delta from 1992 to 2015;
- Quantify the rates and types of LULC transitions that have occurred;
- Evaluate the extent of urban sprawl and its implications for the loss of productive agricultural land in the Nile Delta;
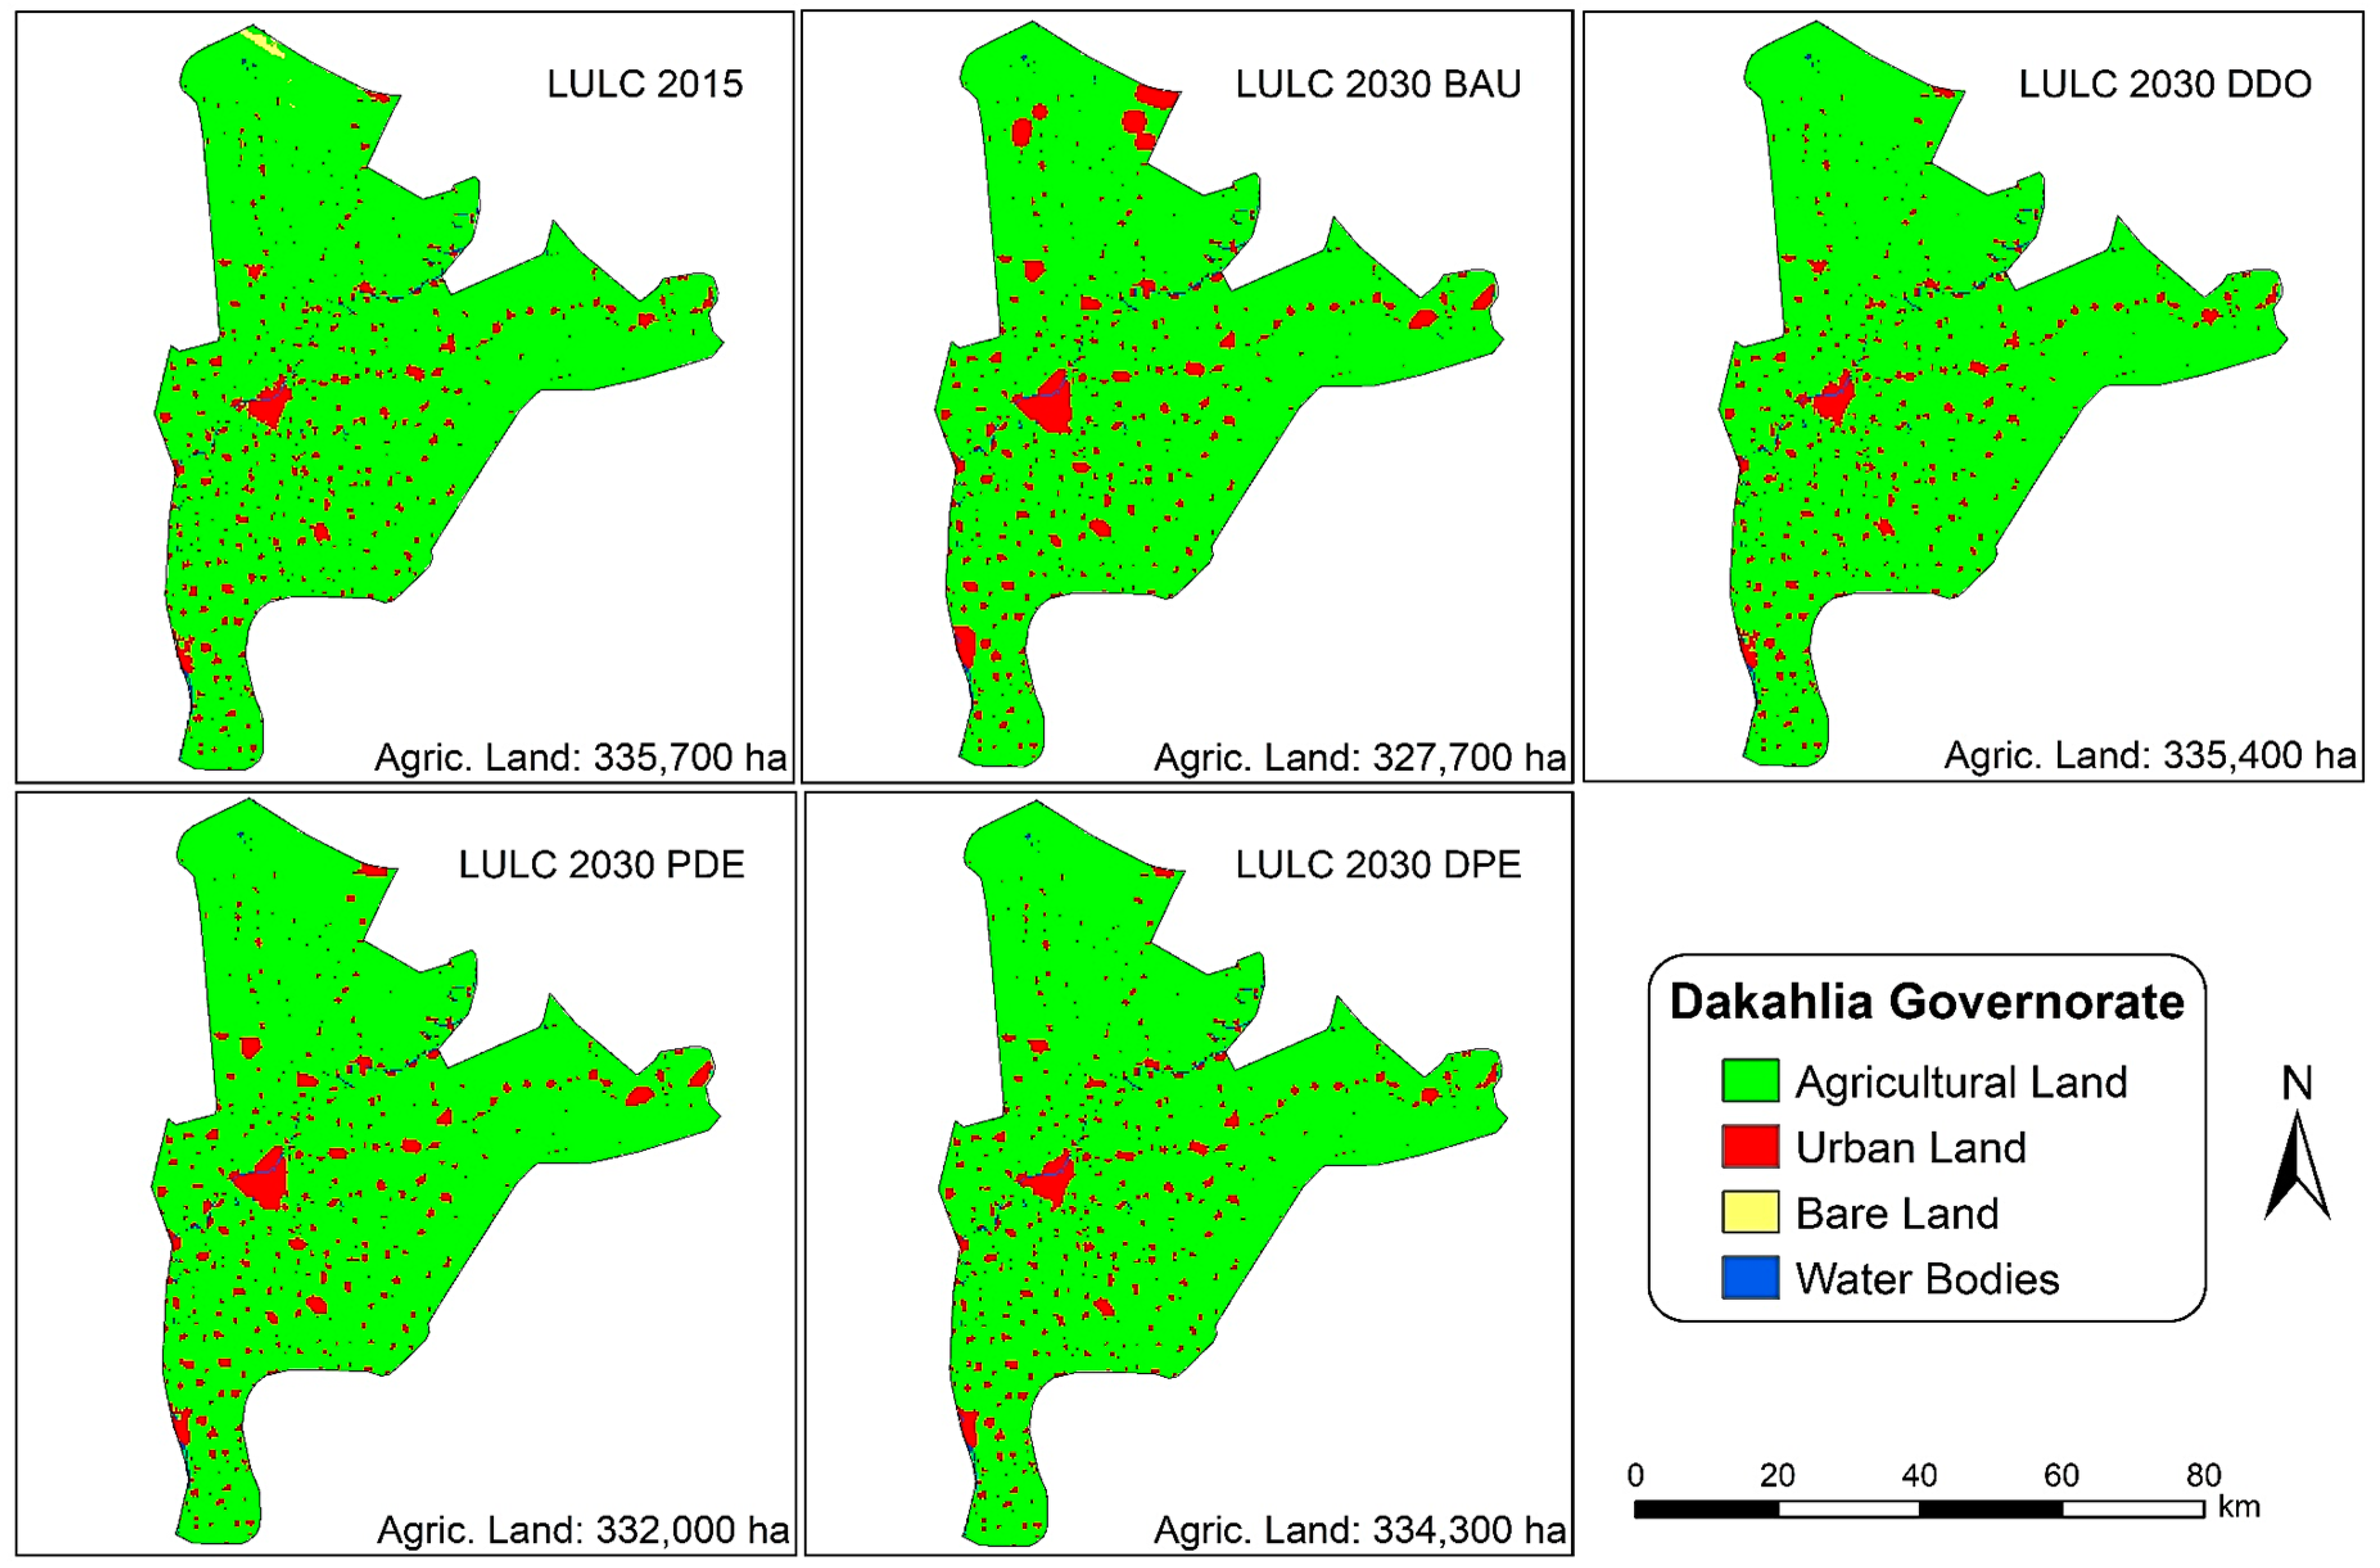
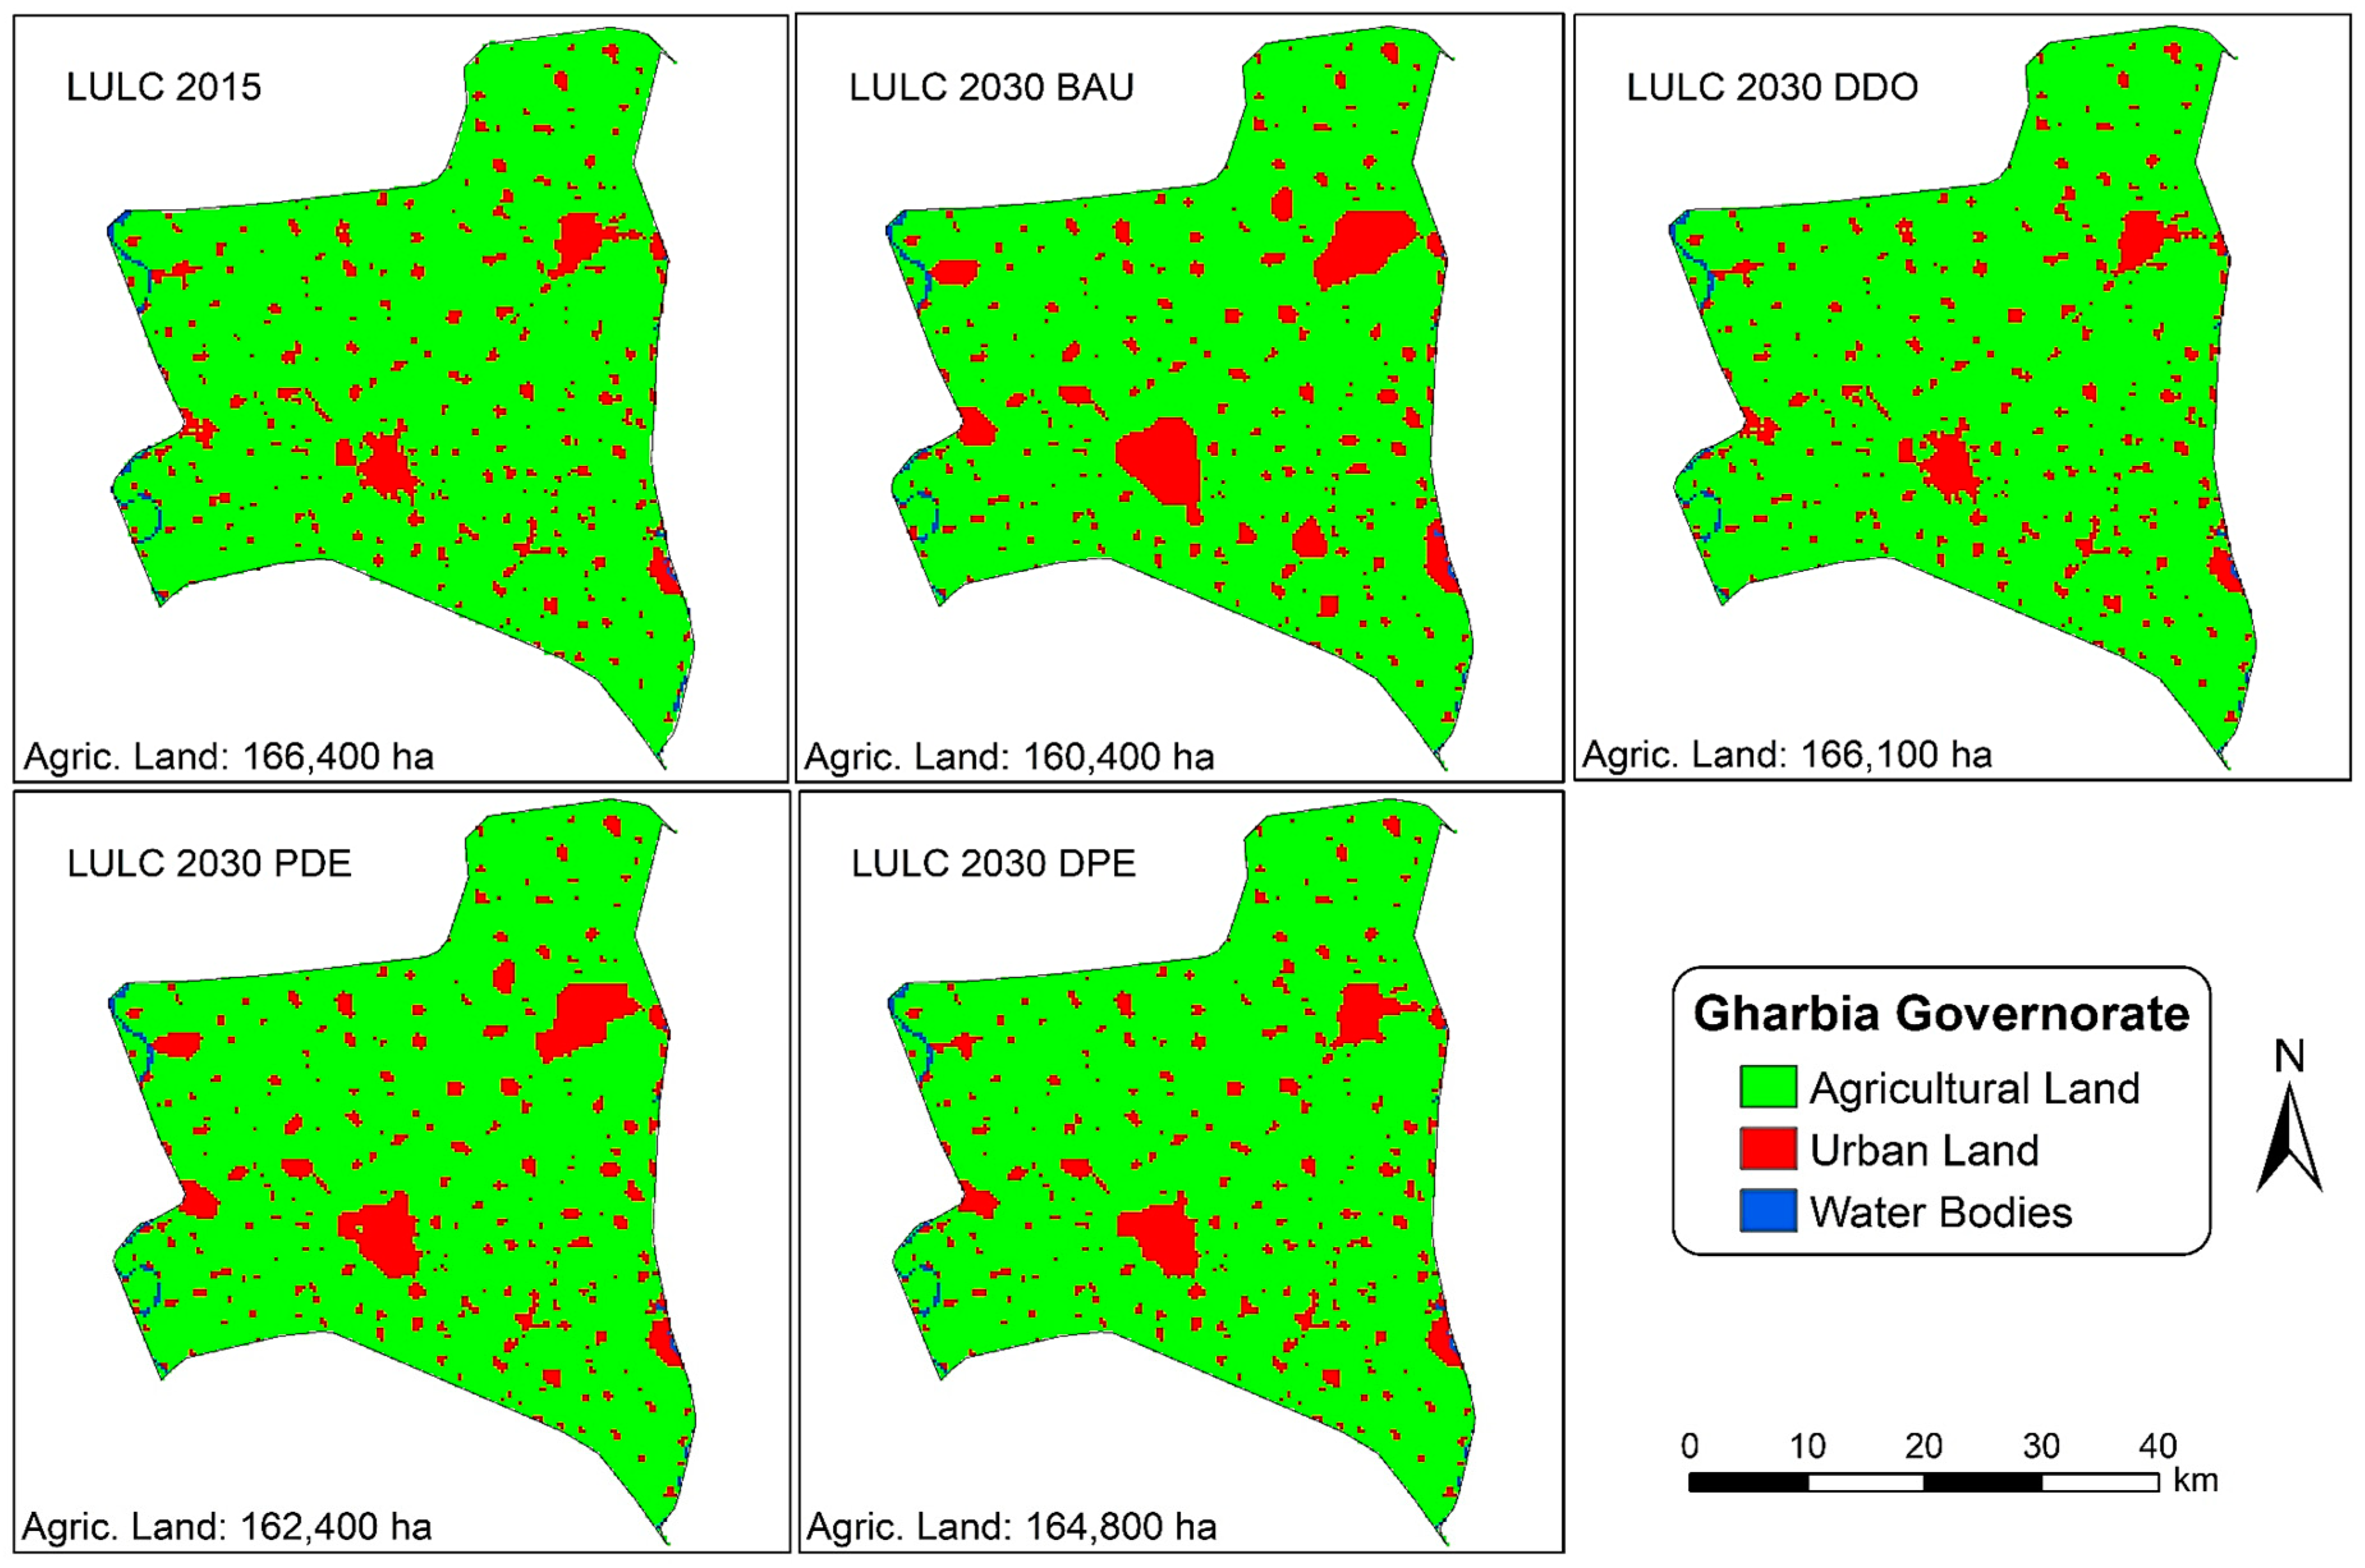
- Simulate LULC changes to 2030 for a series of different scenarios designed to reduce the amount of fertile land lost to urban development in the Nile Delta.
2. Materials and Methods
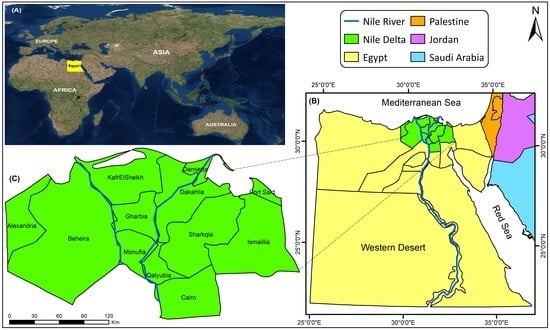
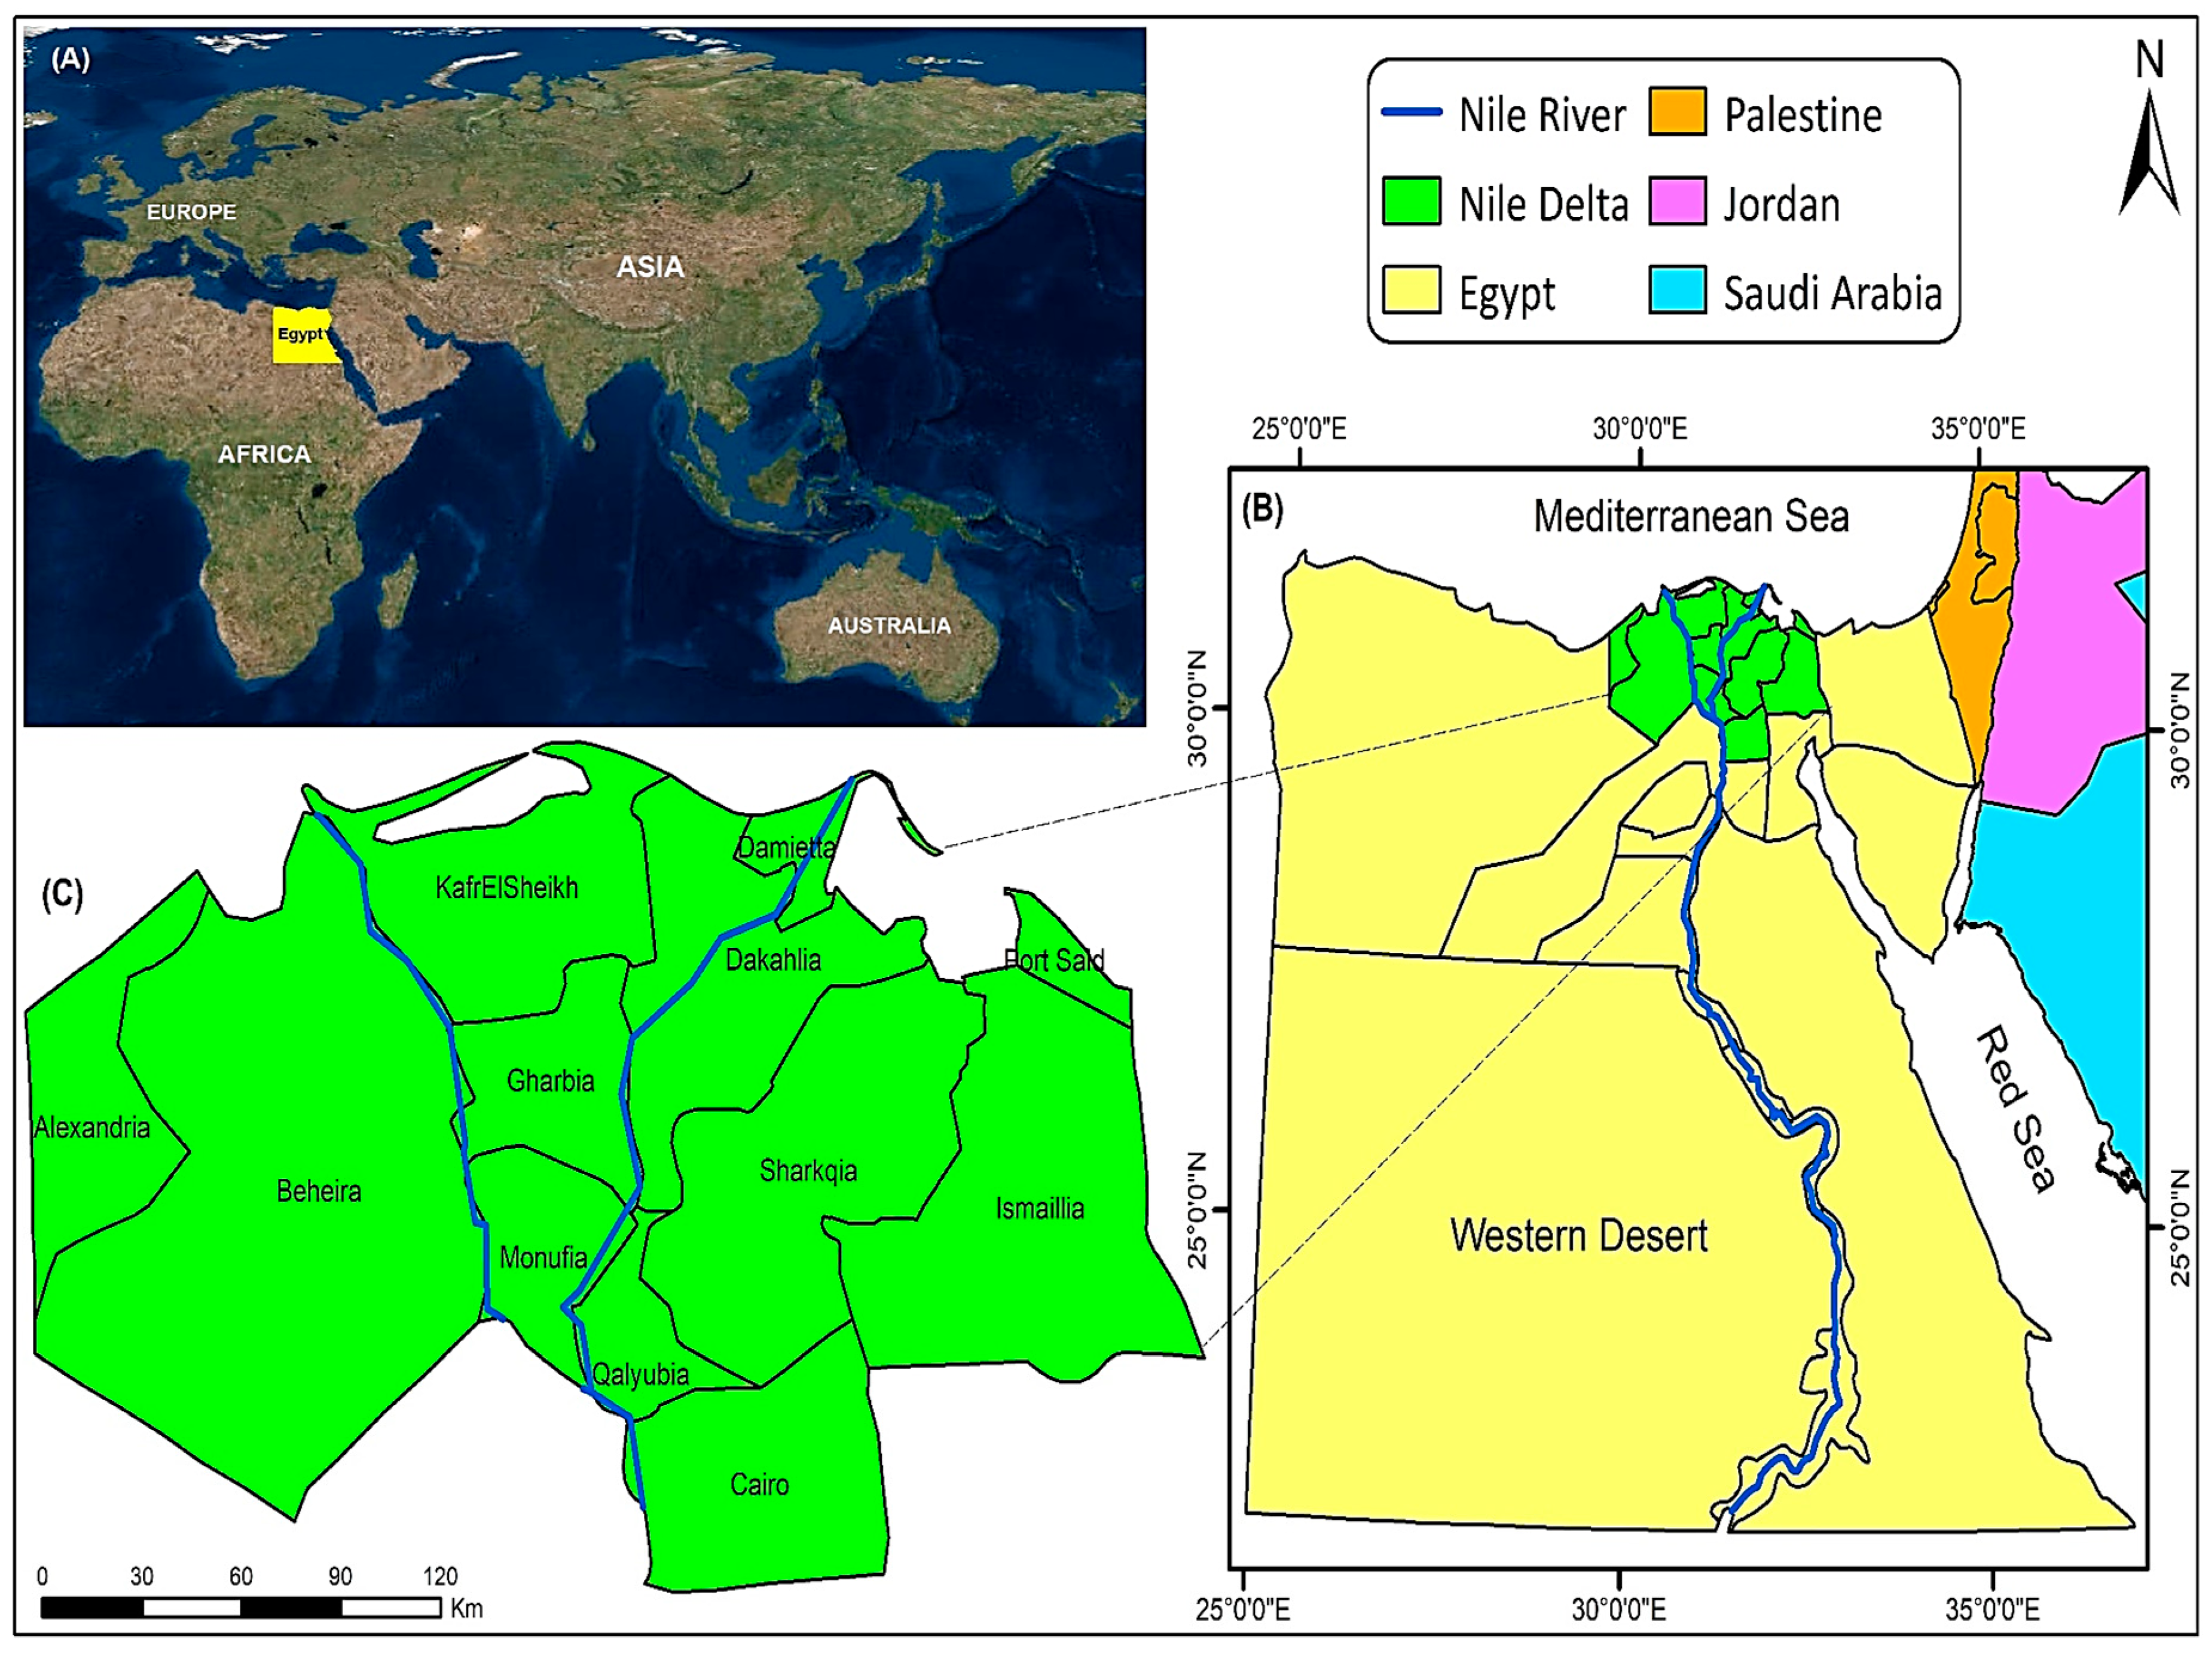
2.1. Study Area
2.2. Data Collection and Processing
2.2.1. Land Use/Land Cover (LULC) Change Analysis
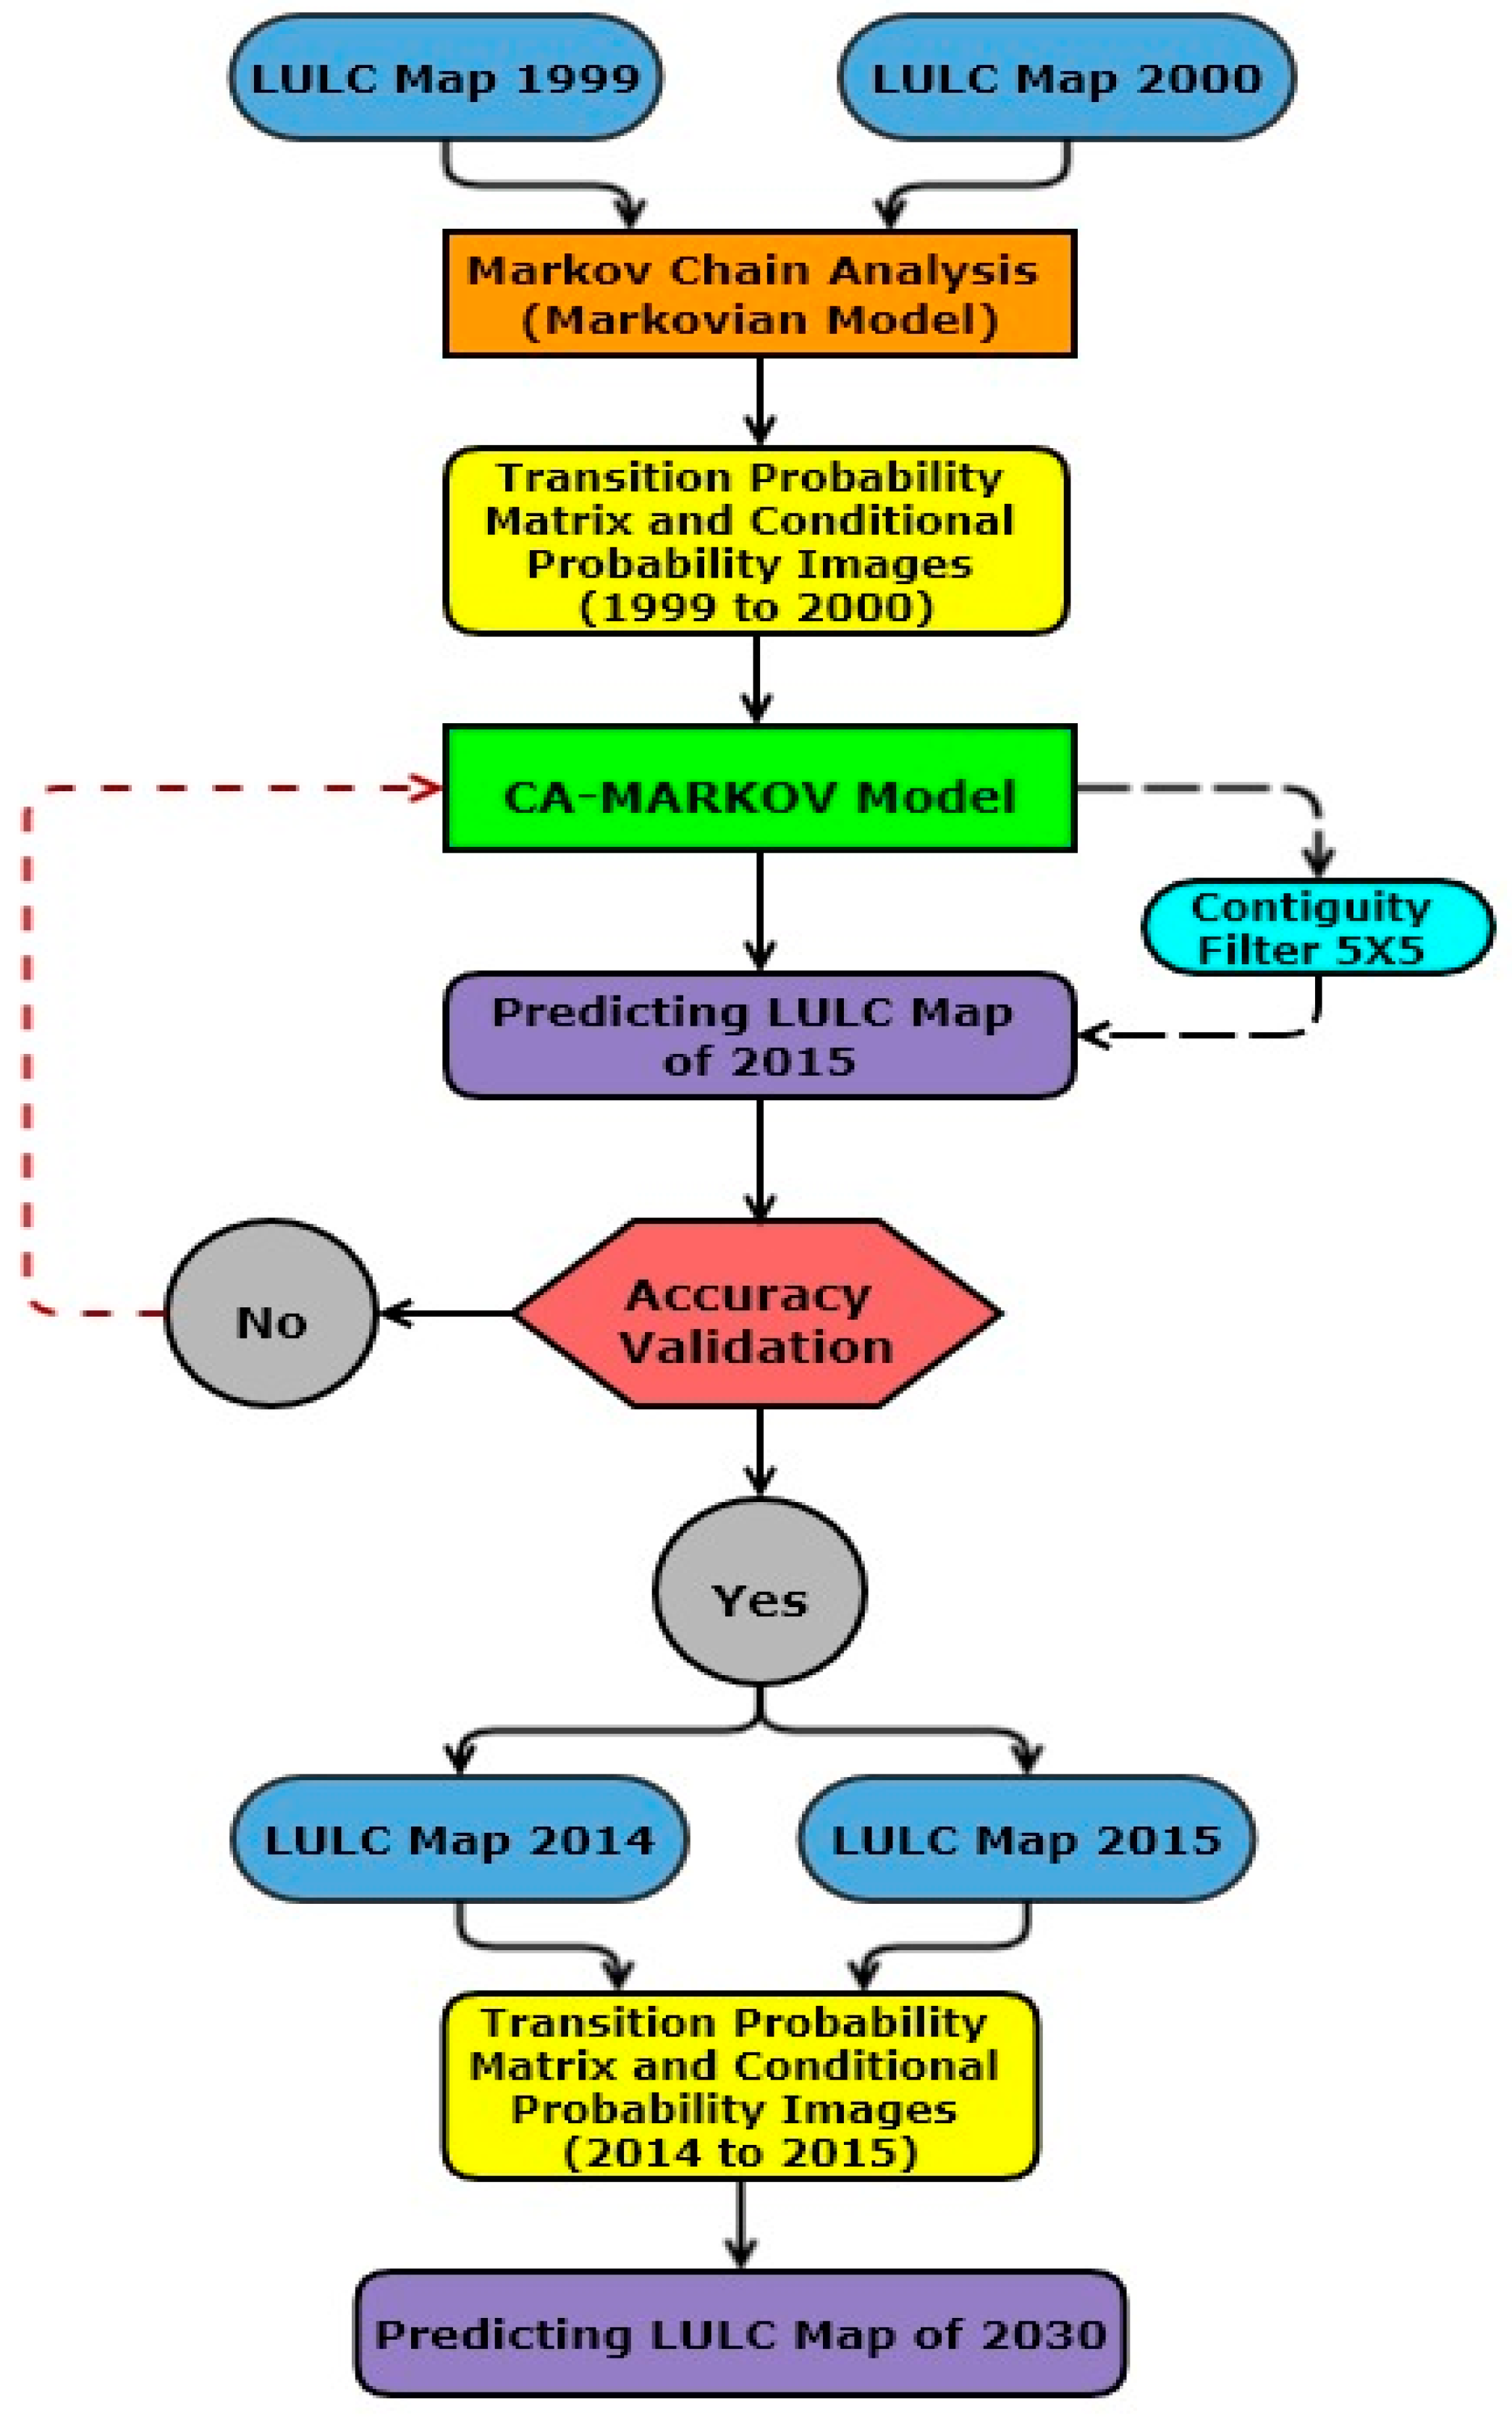
2.2.2. Simulation of Future LULC Changes under Different Urban Growth Scenarios
3. Results
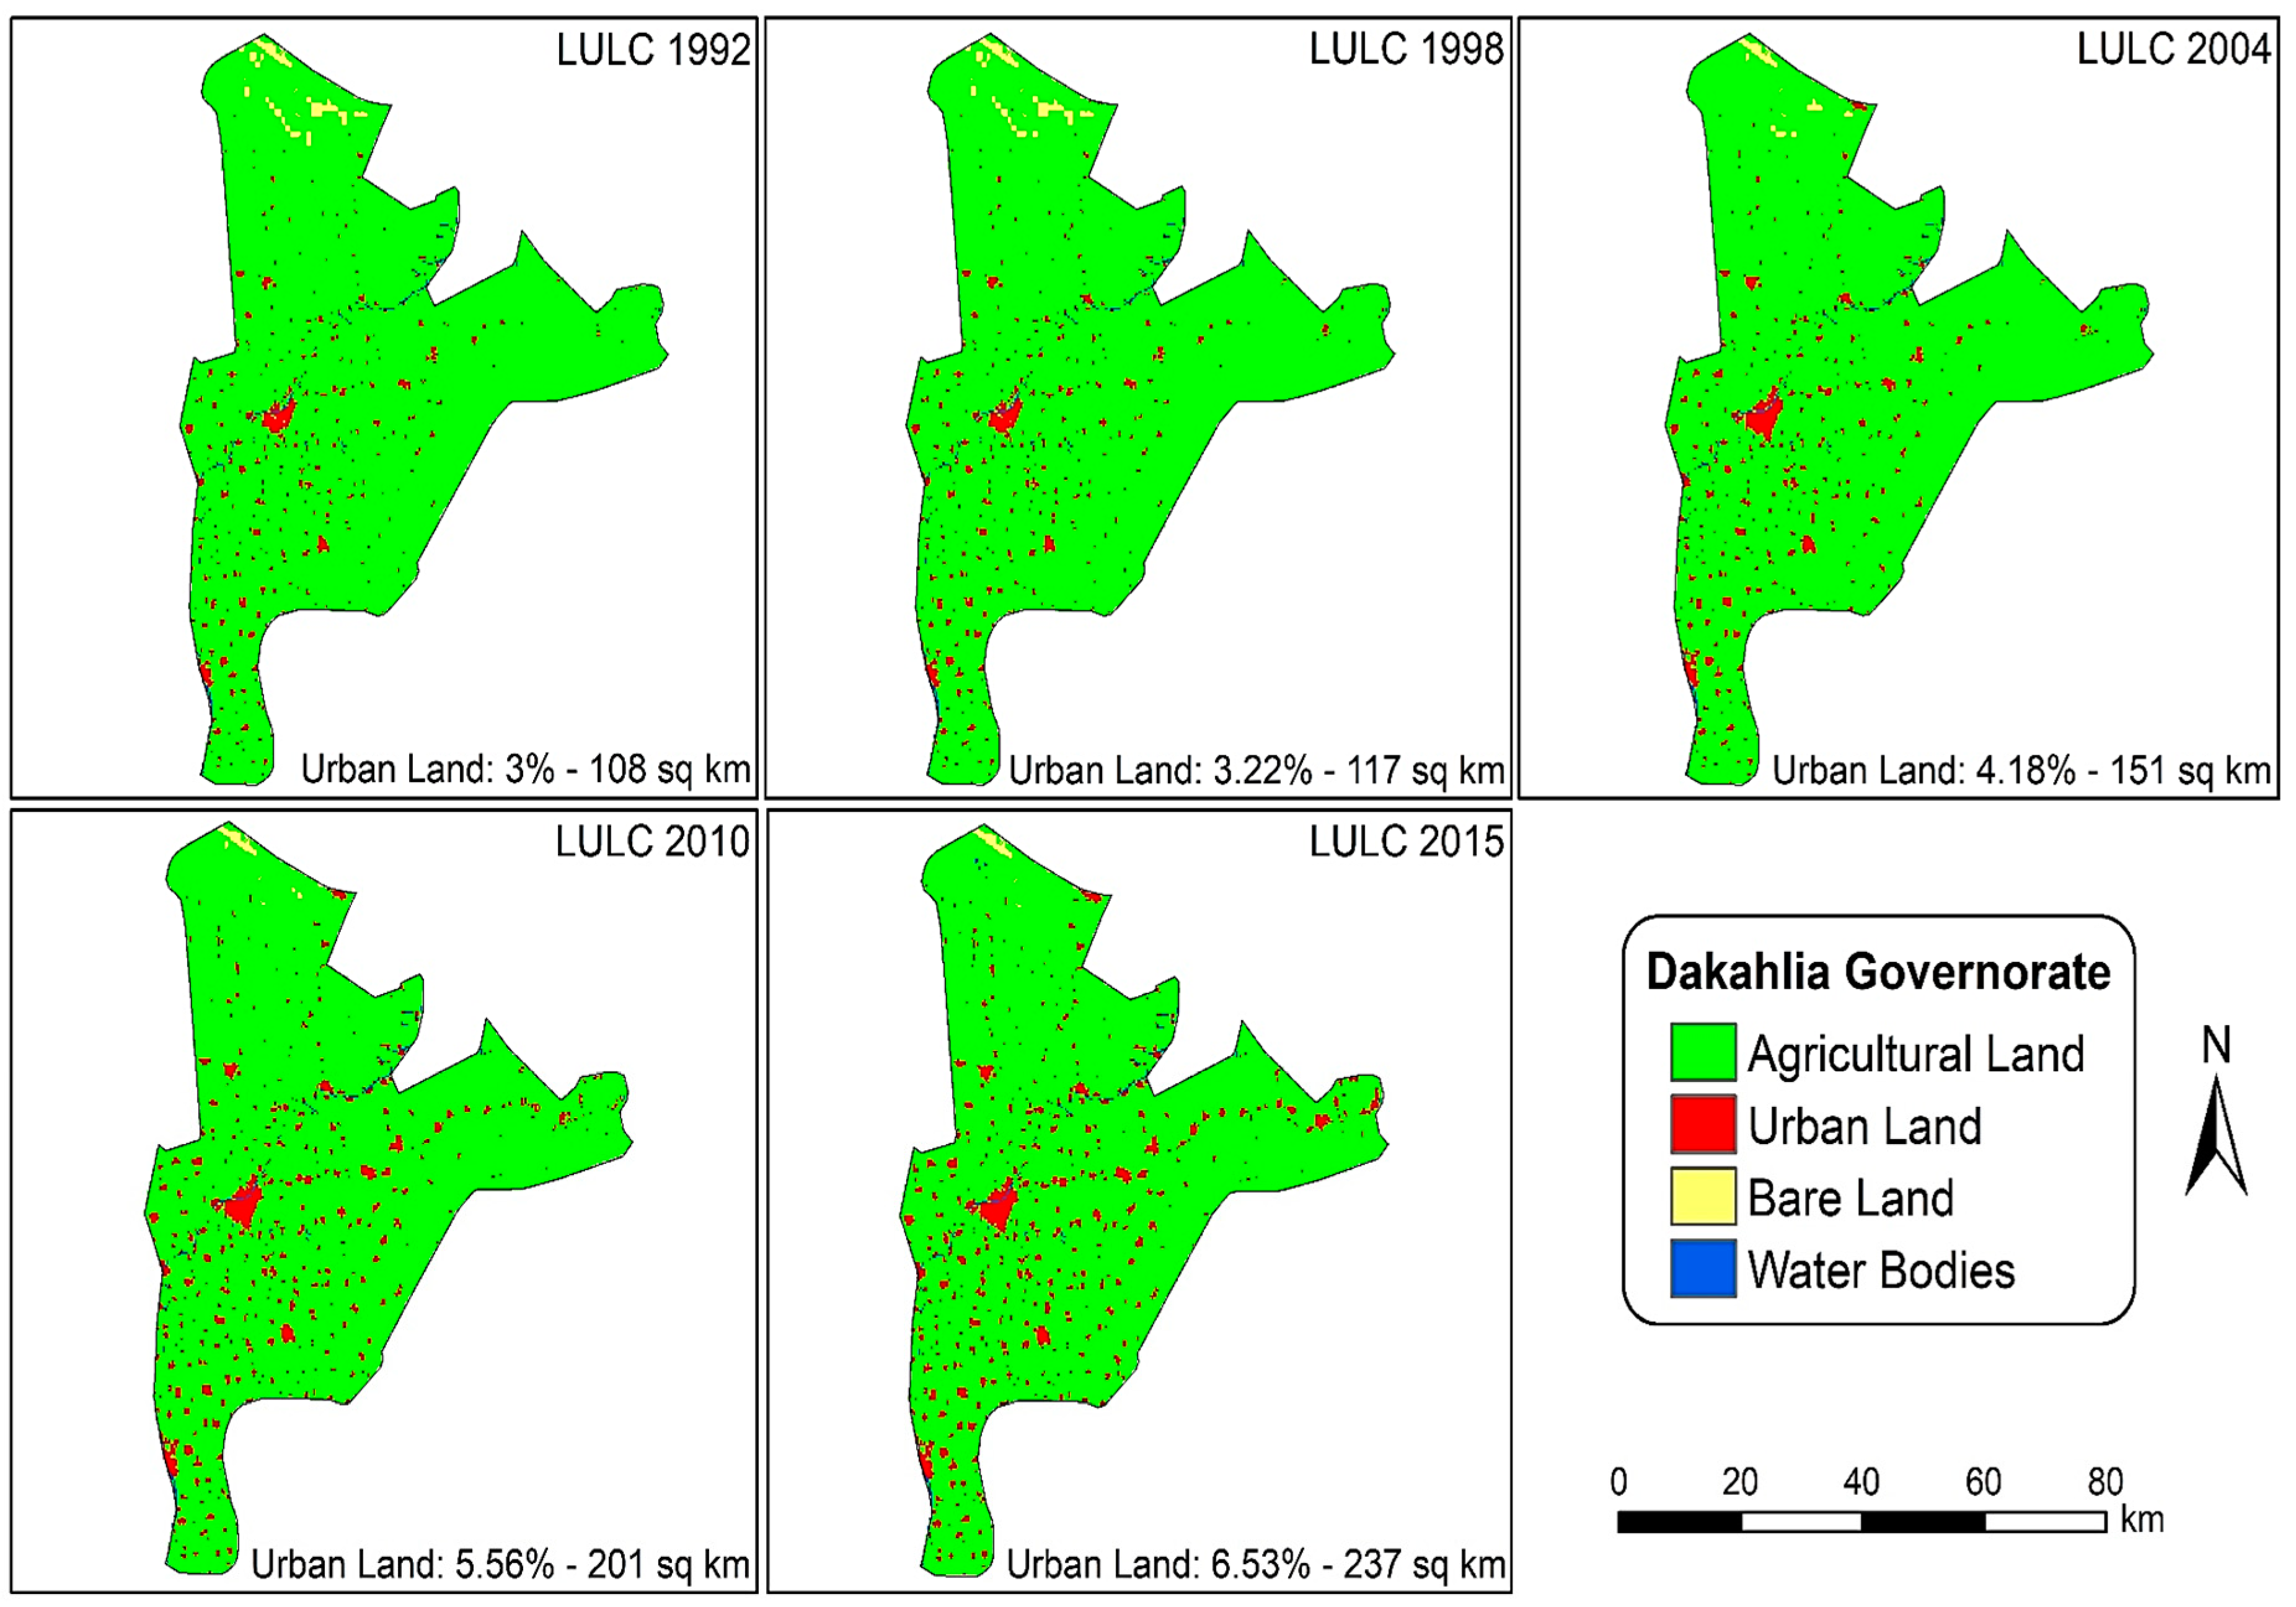
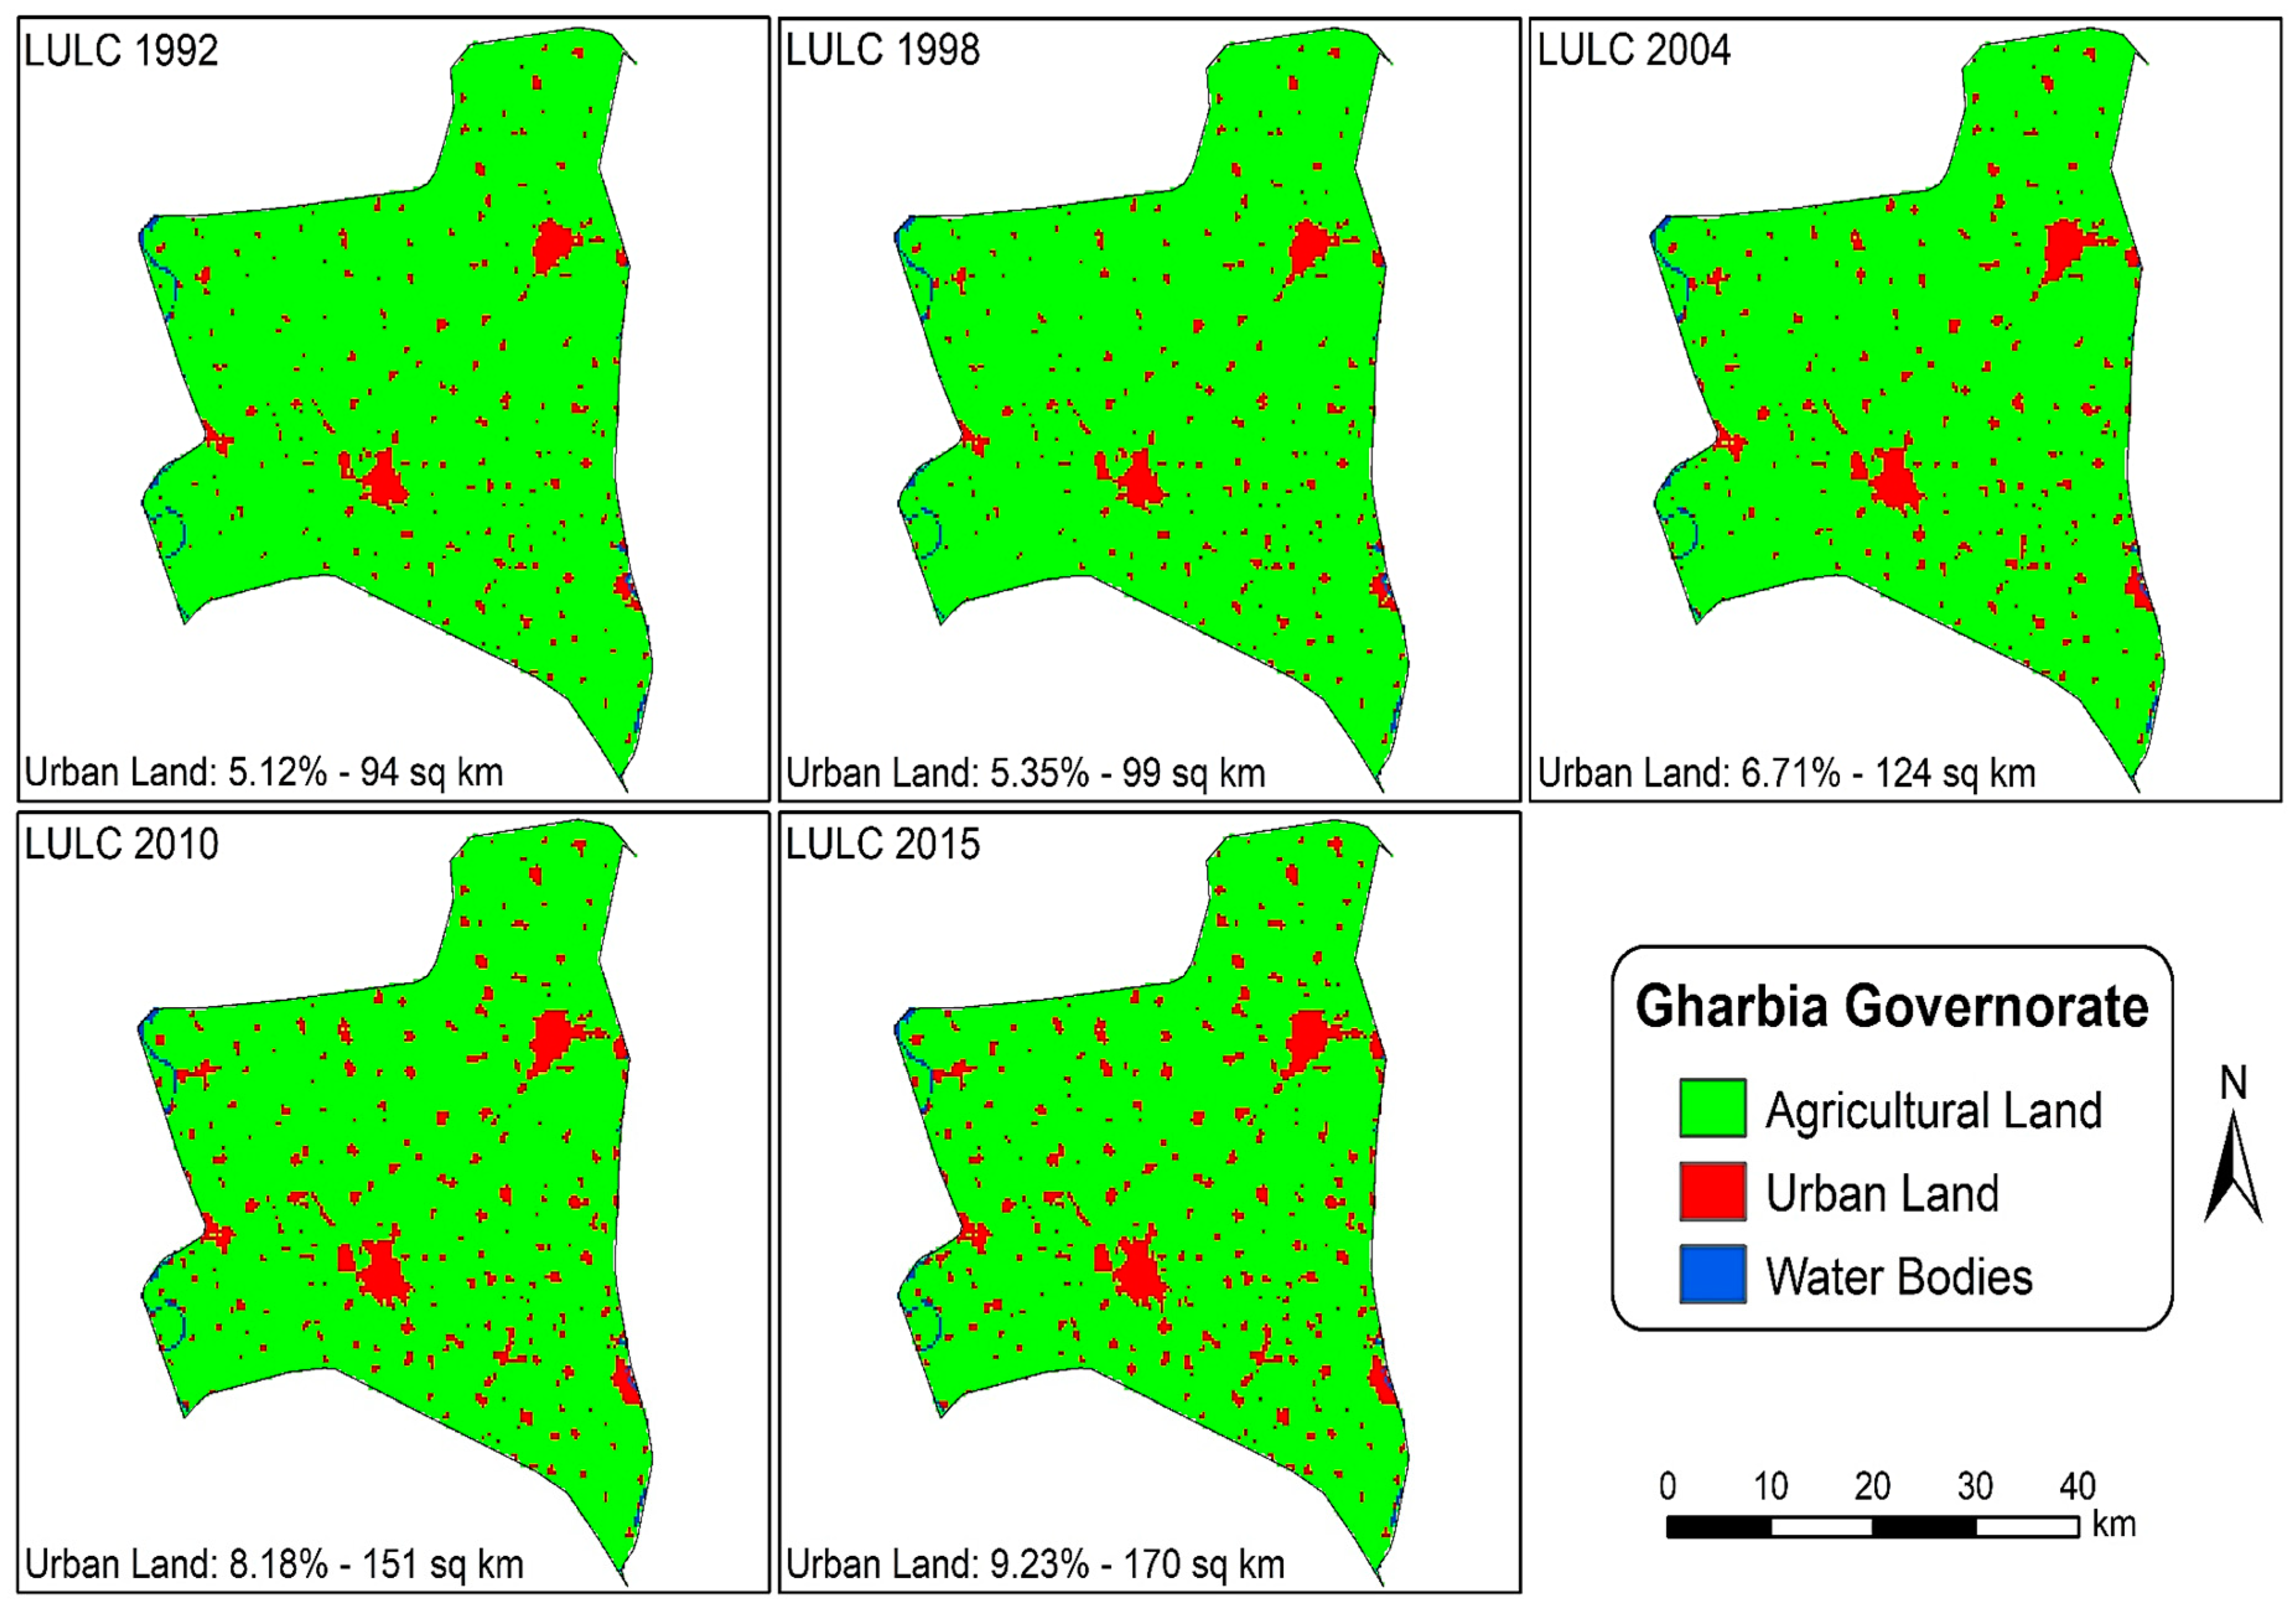
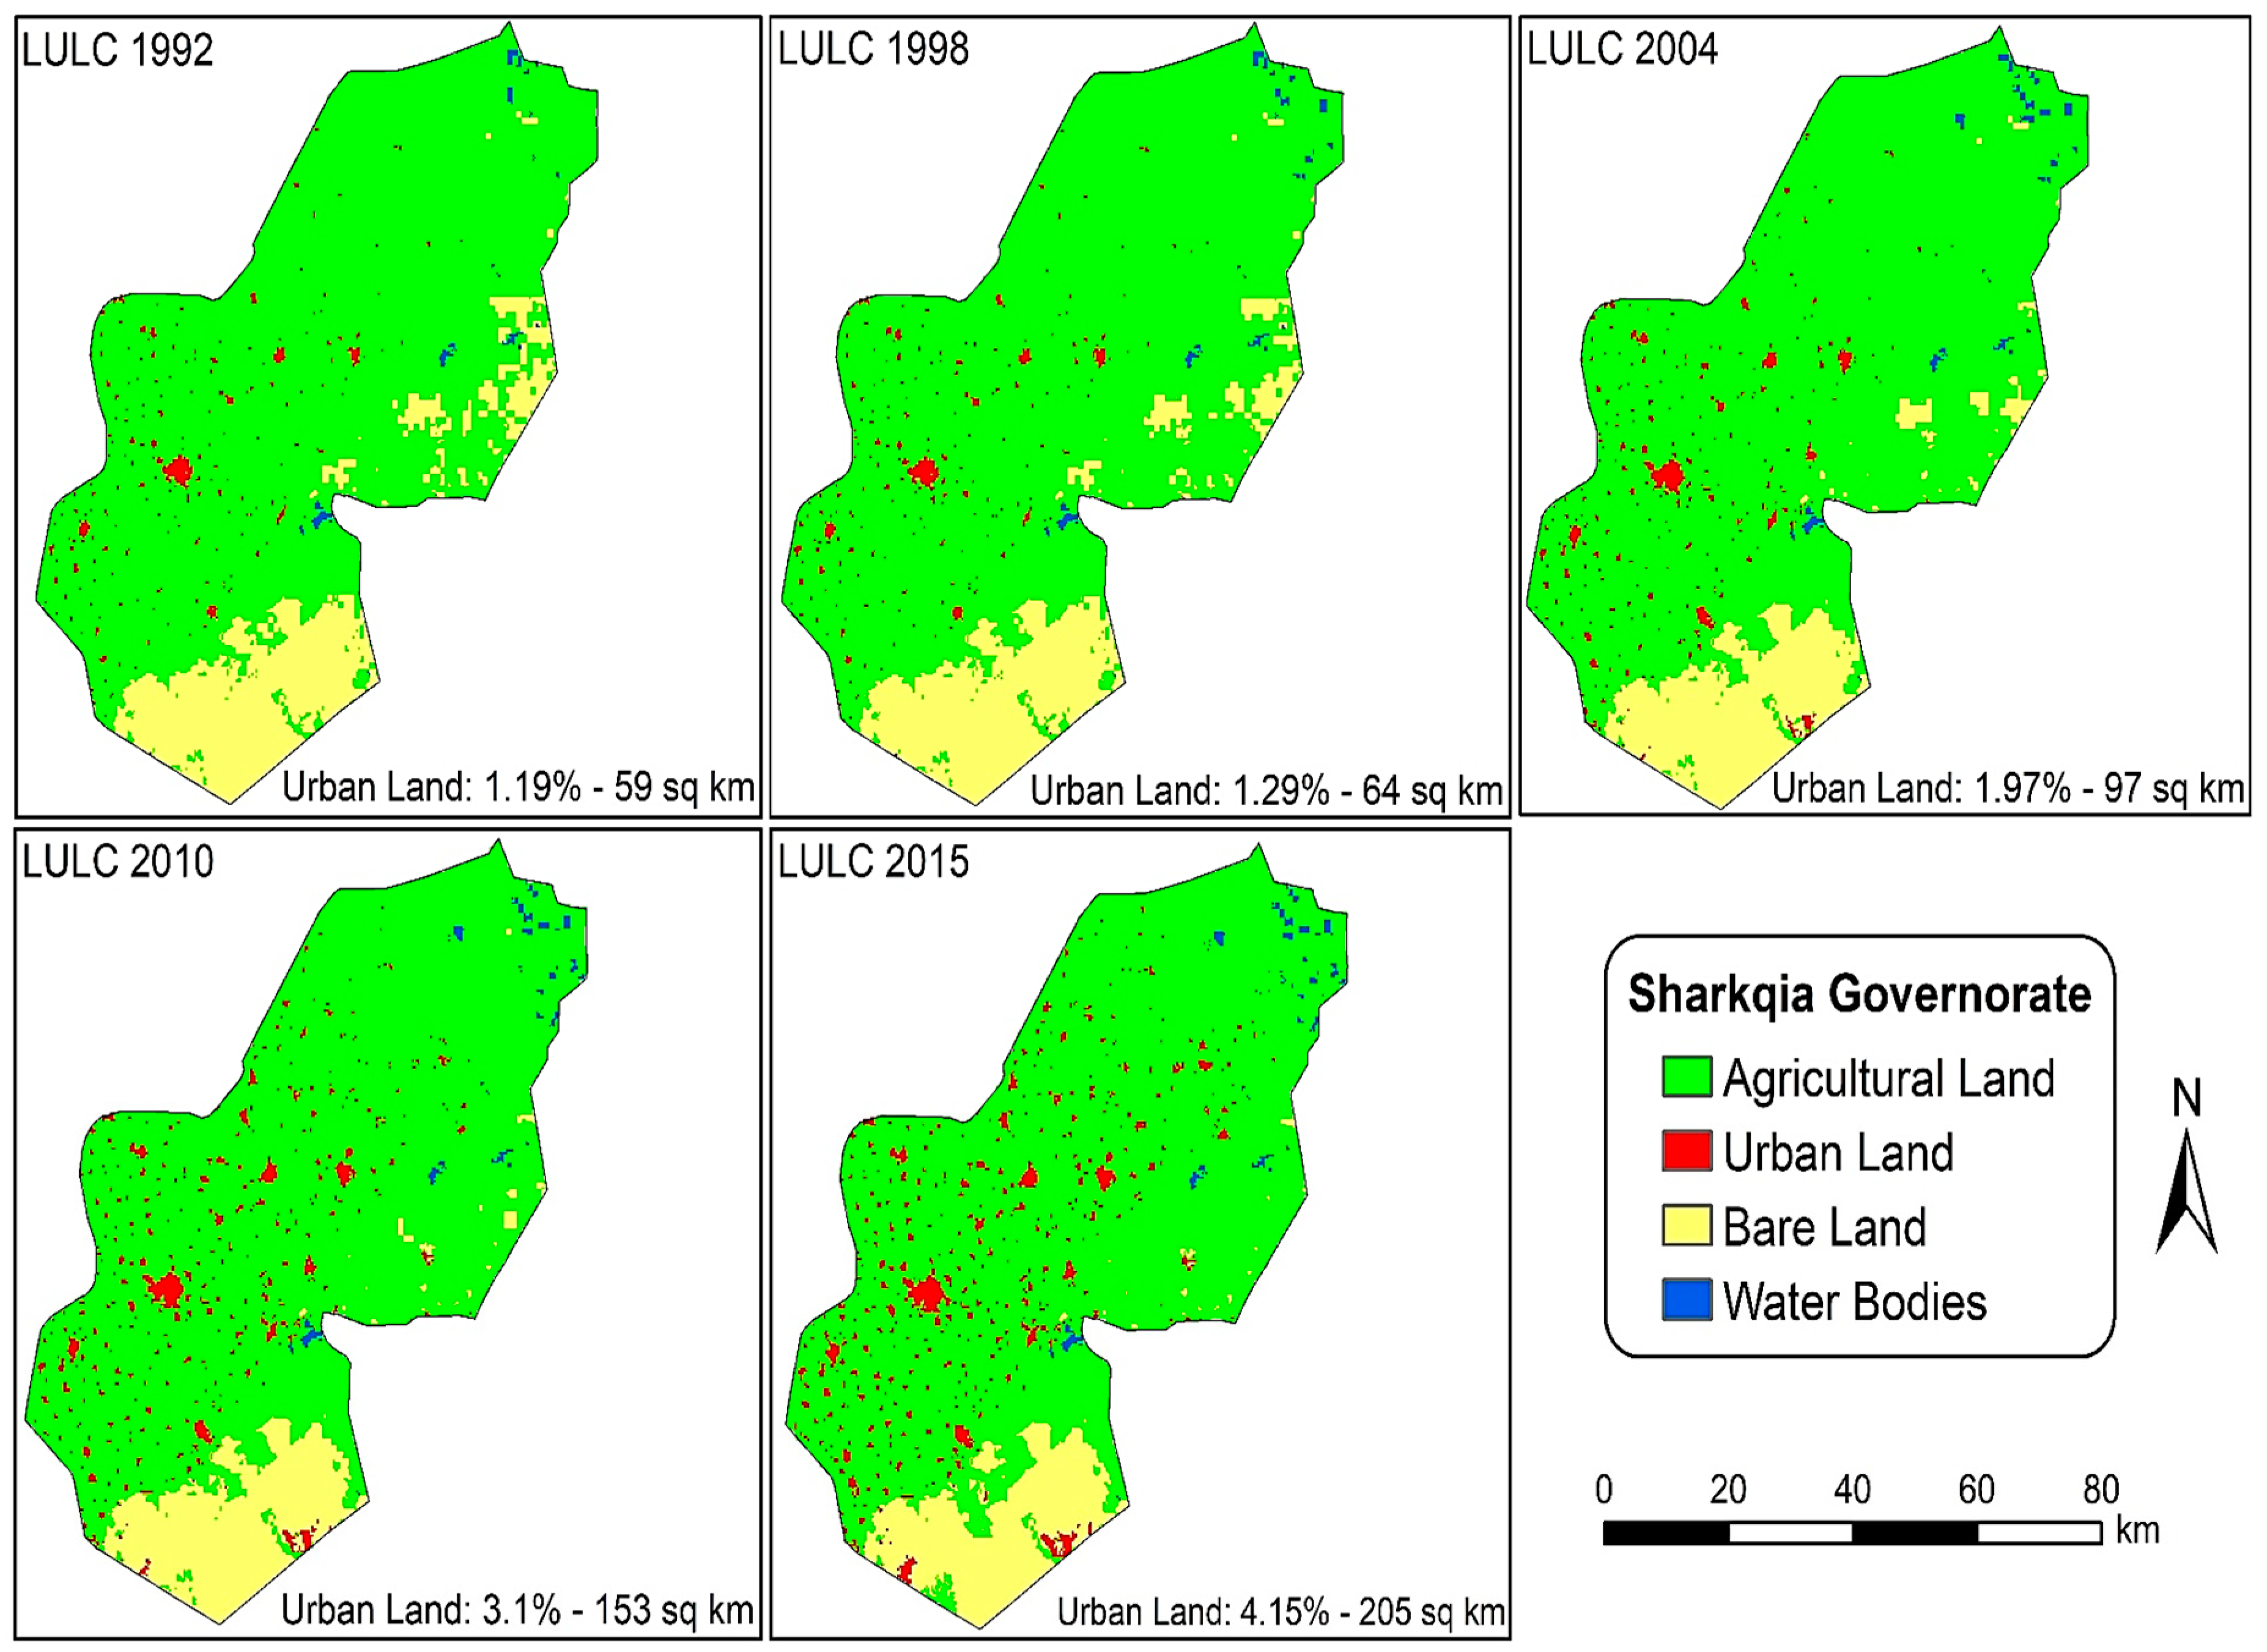
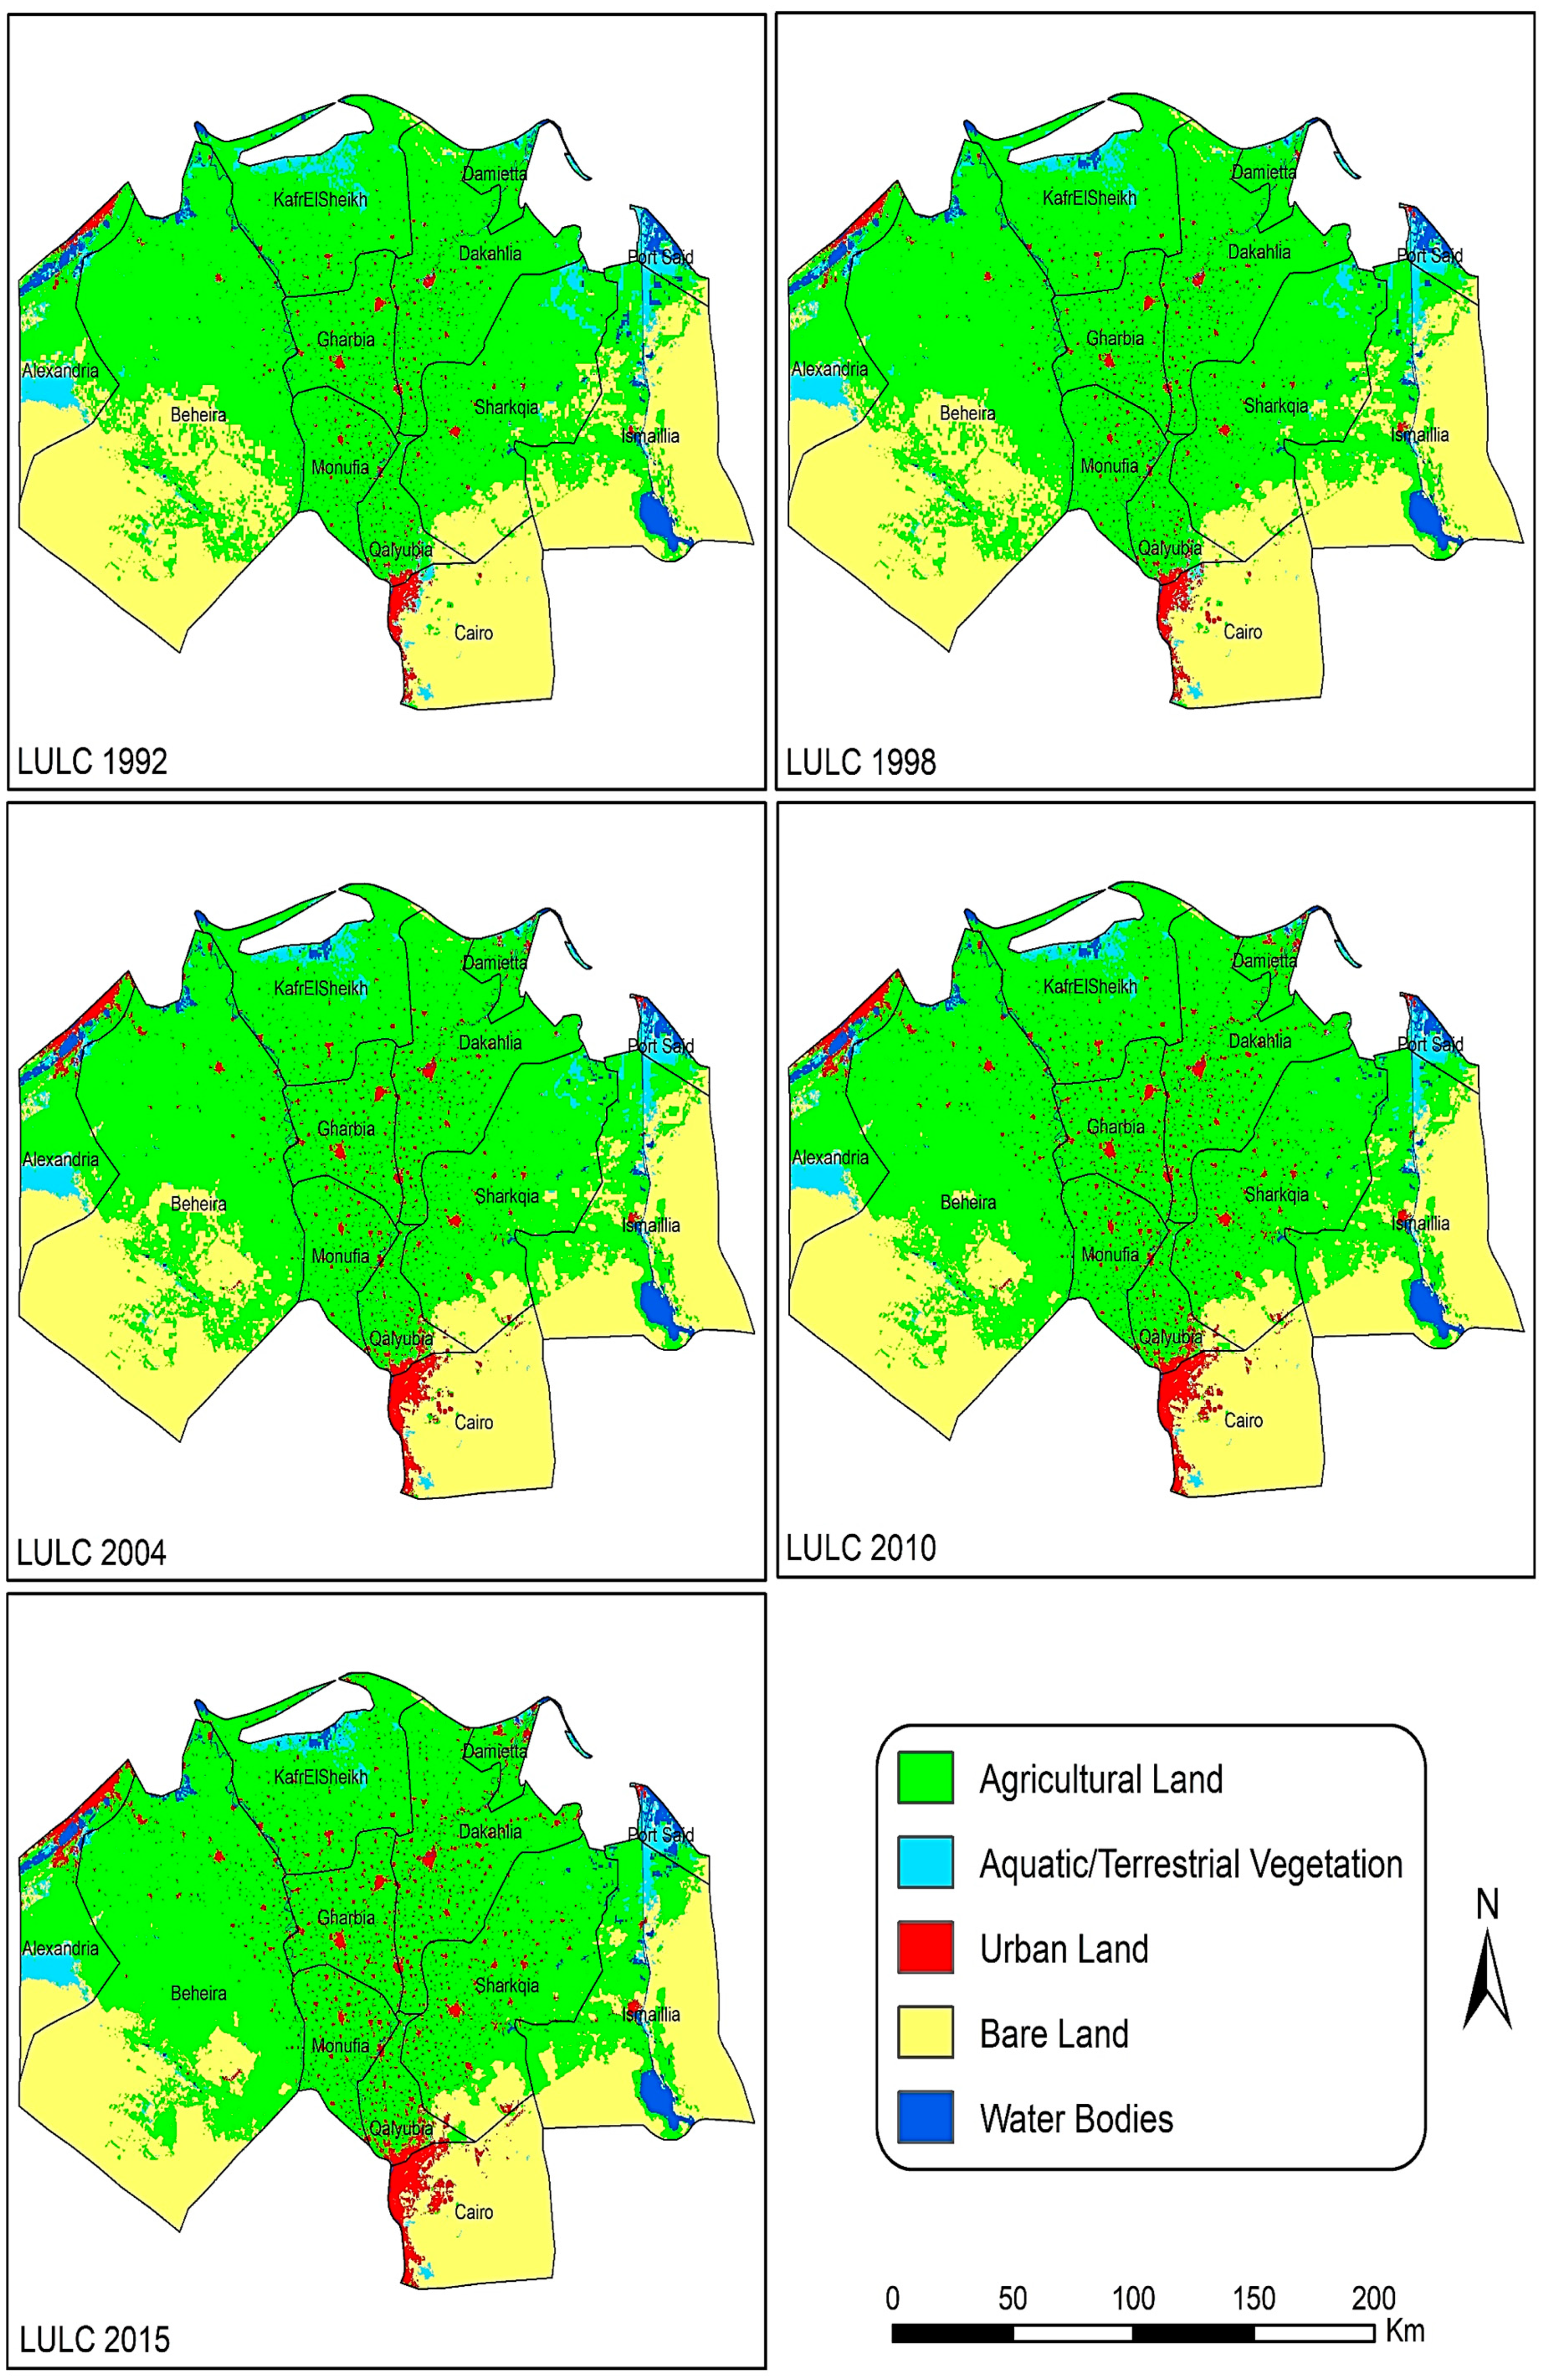
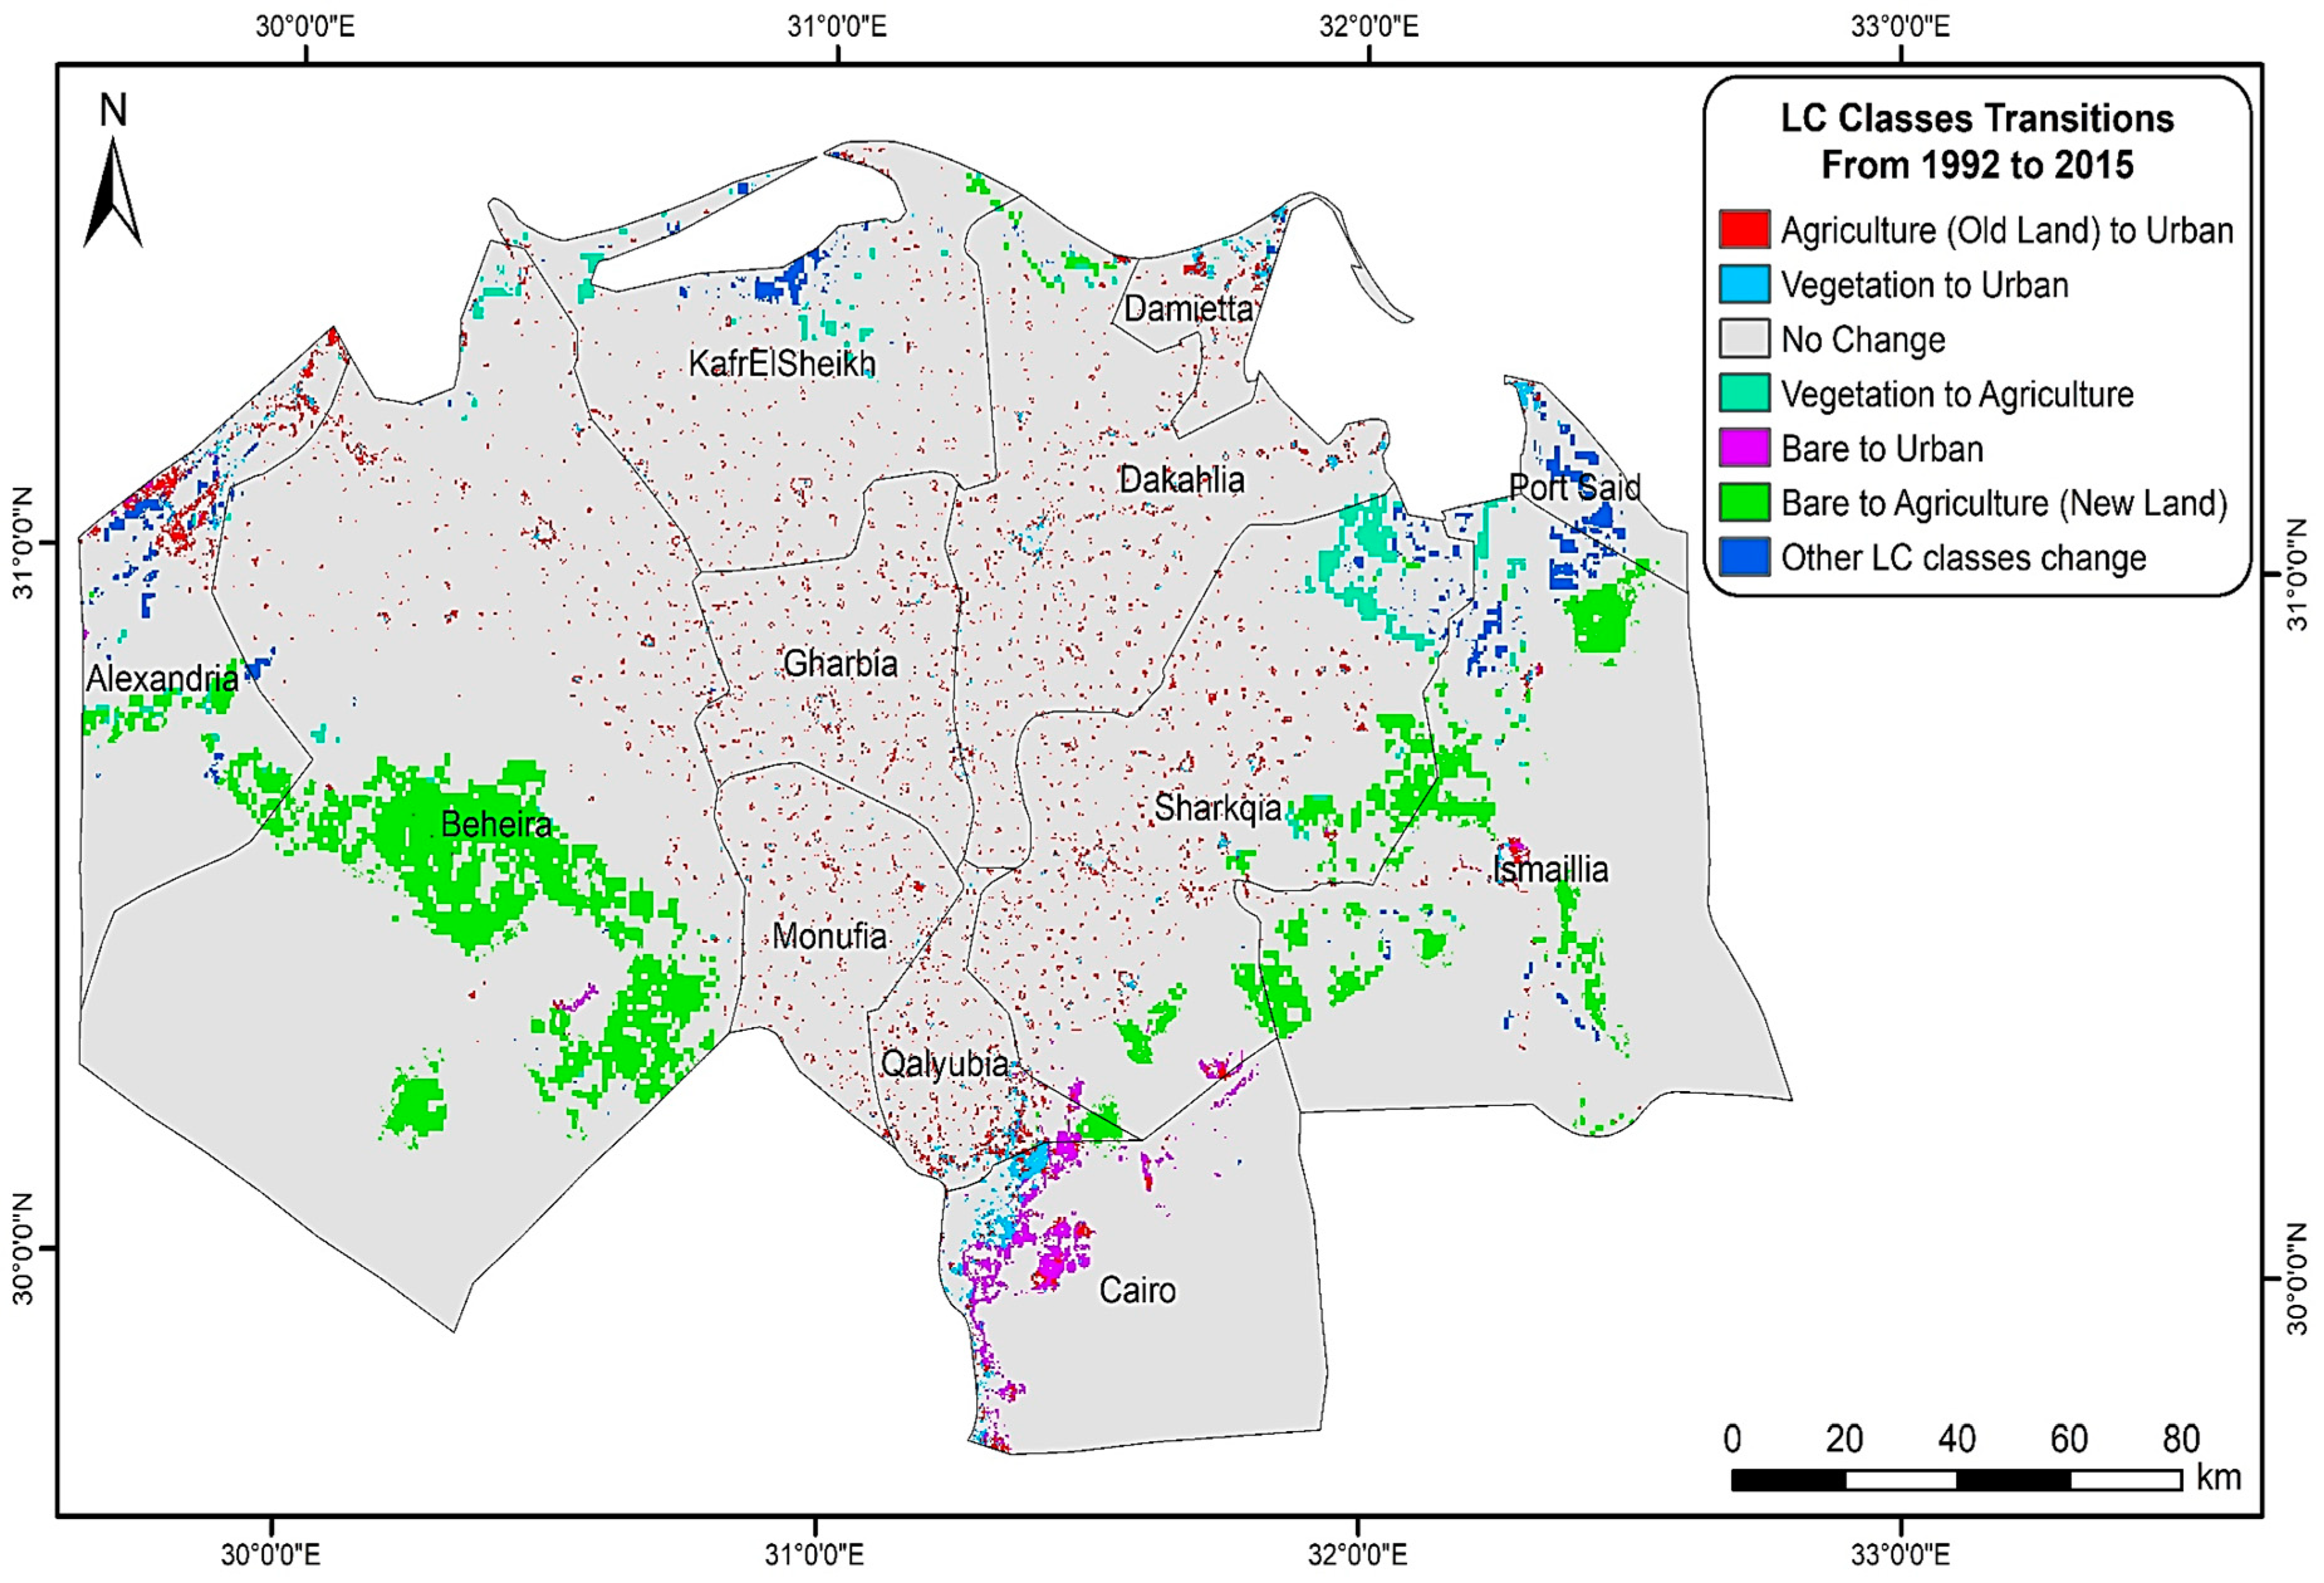
3.1. LULC Change Analysis
3.2. Prediction of Future LULC Dynamics
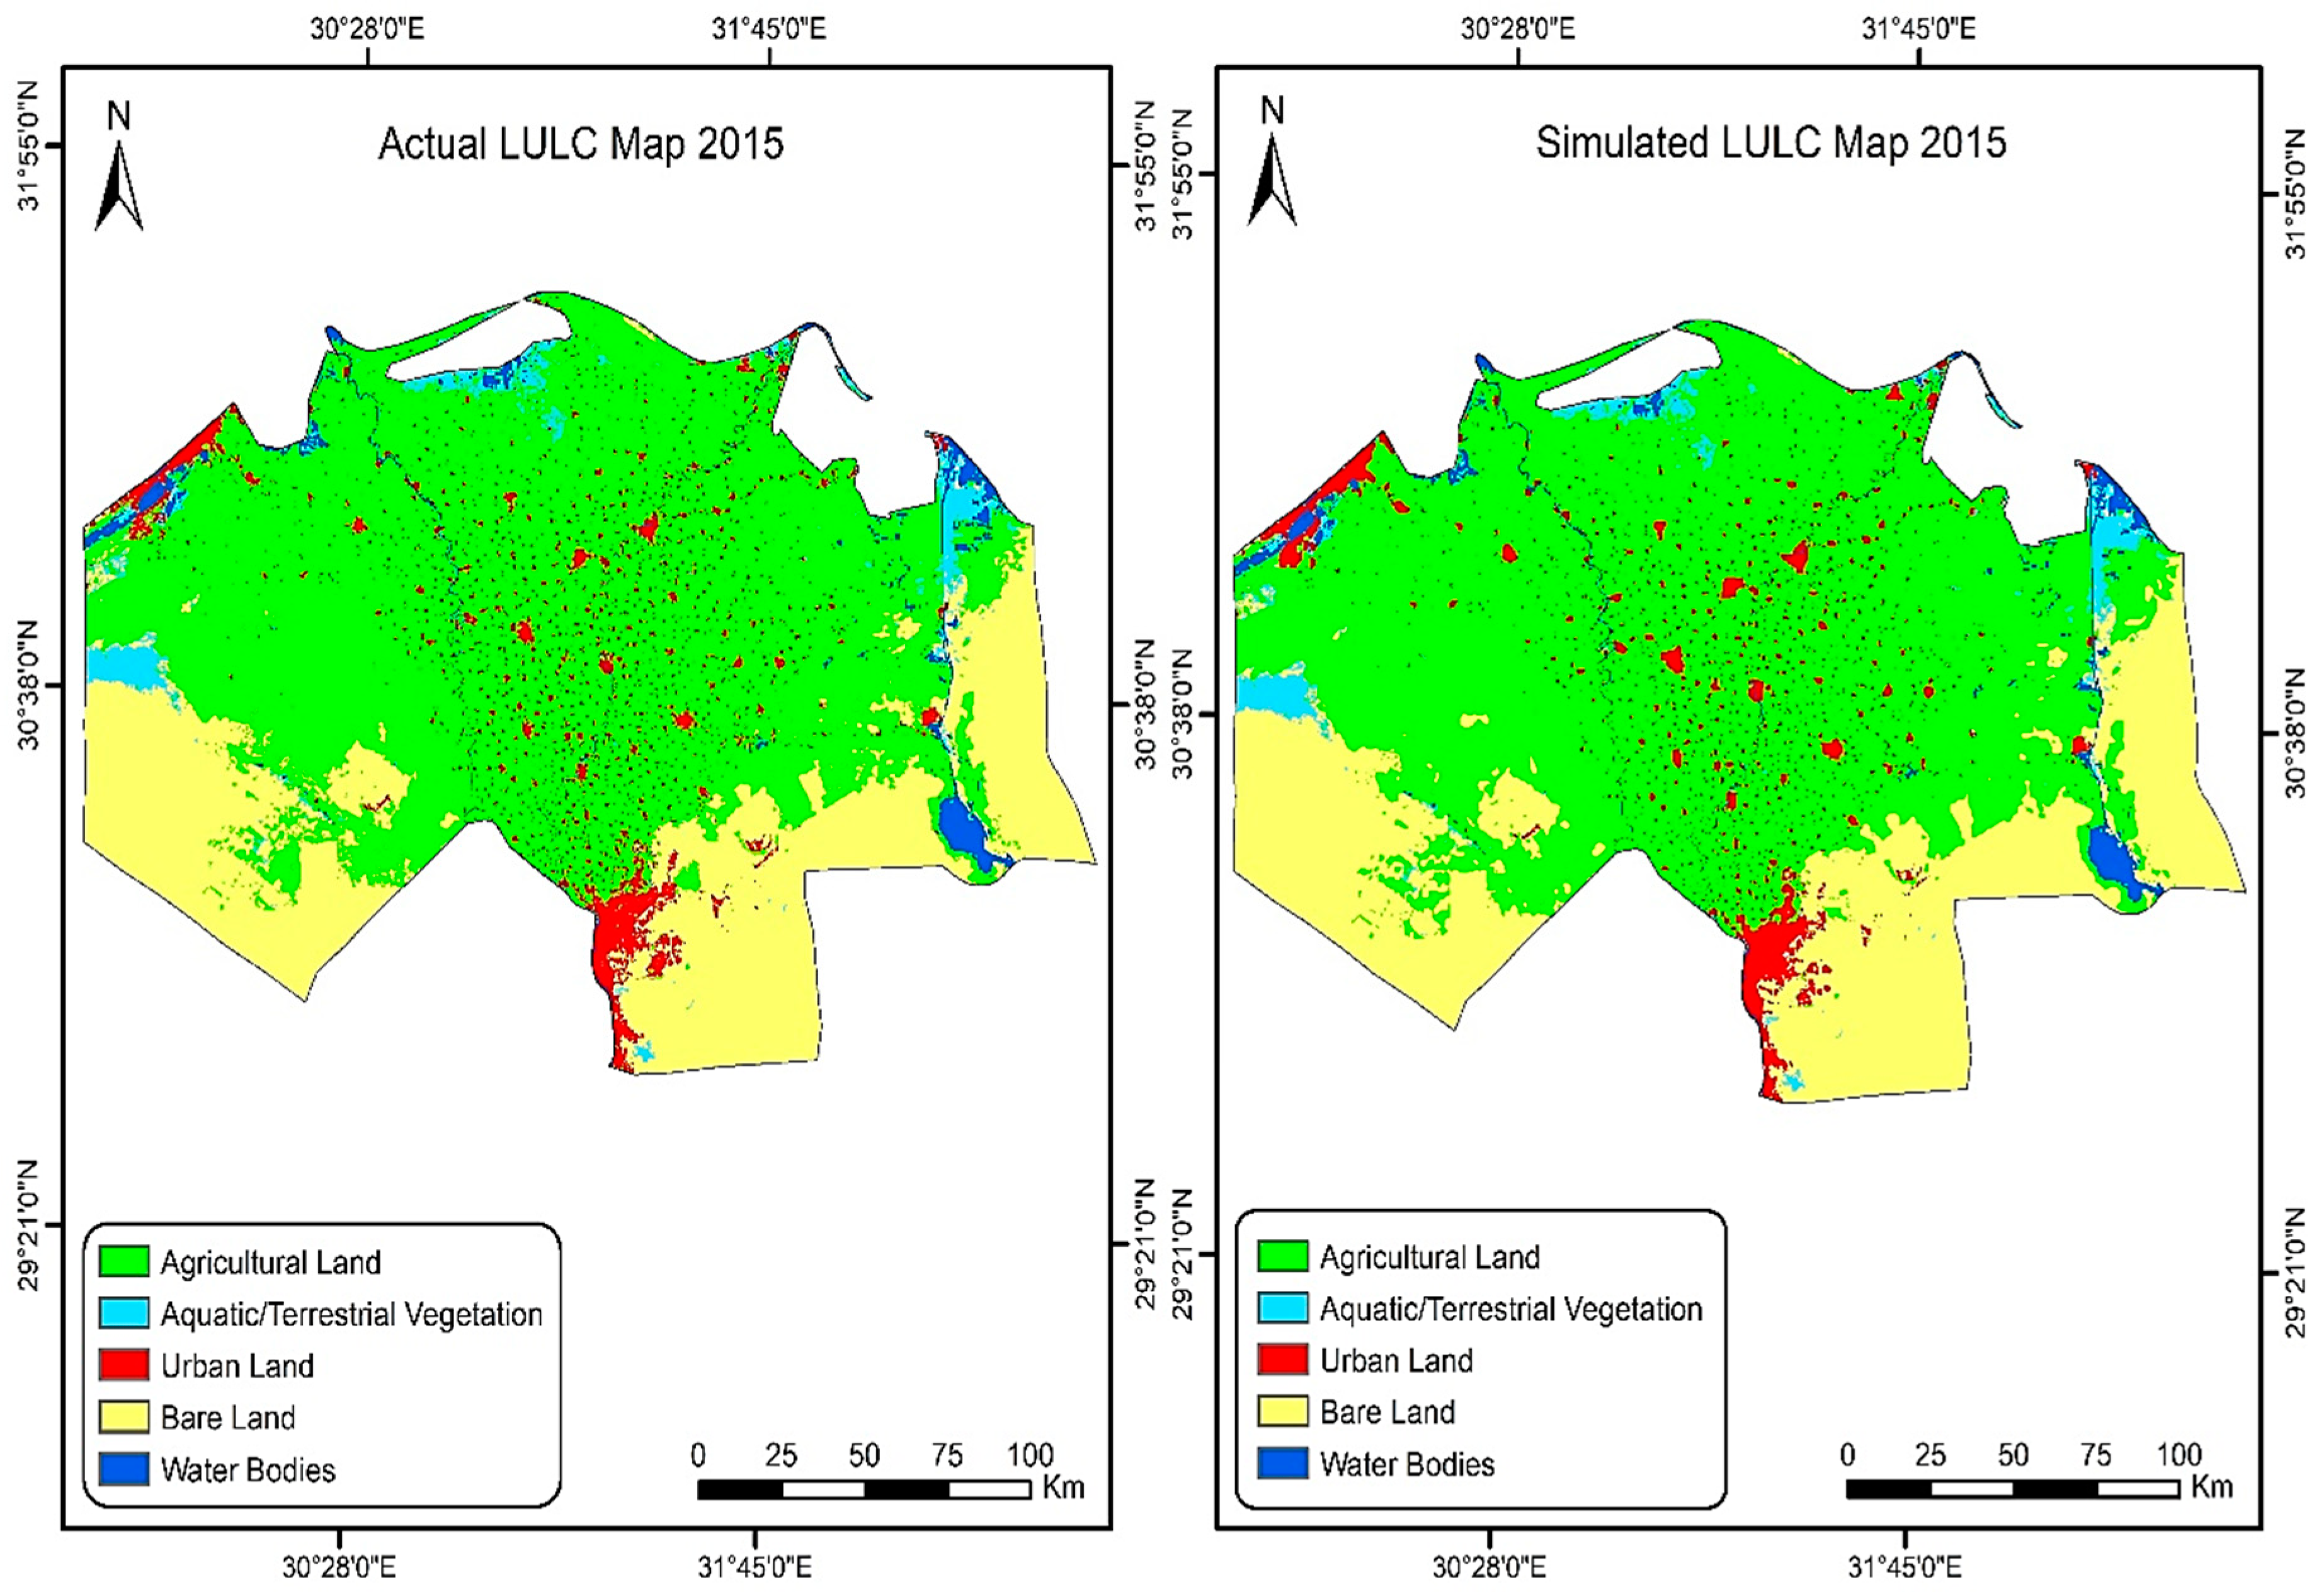
3.2.1. Validation and Application of the CA-Markov Integrated Model
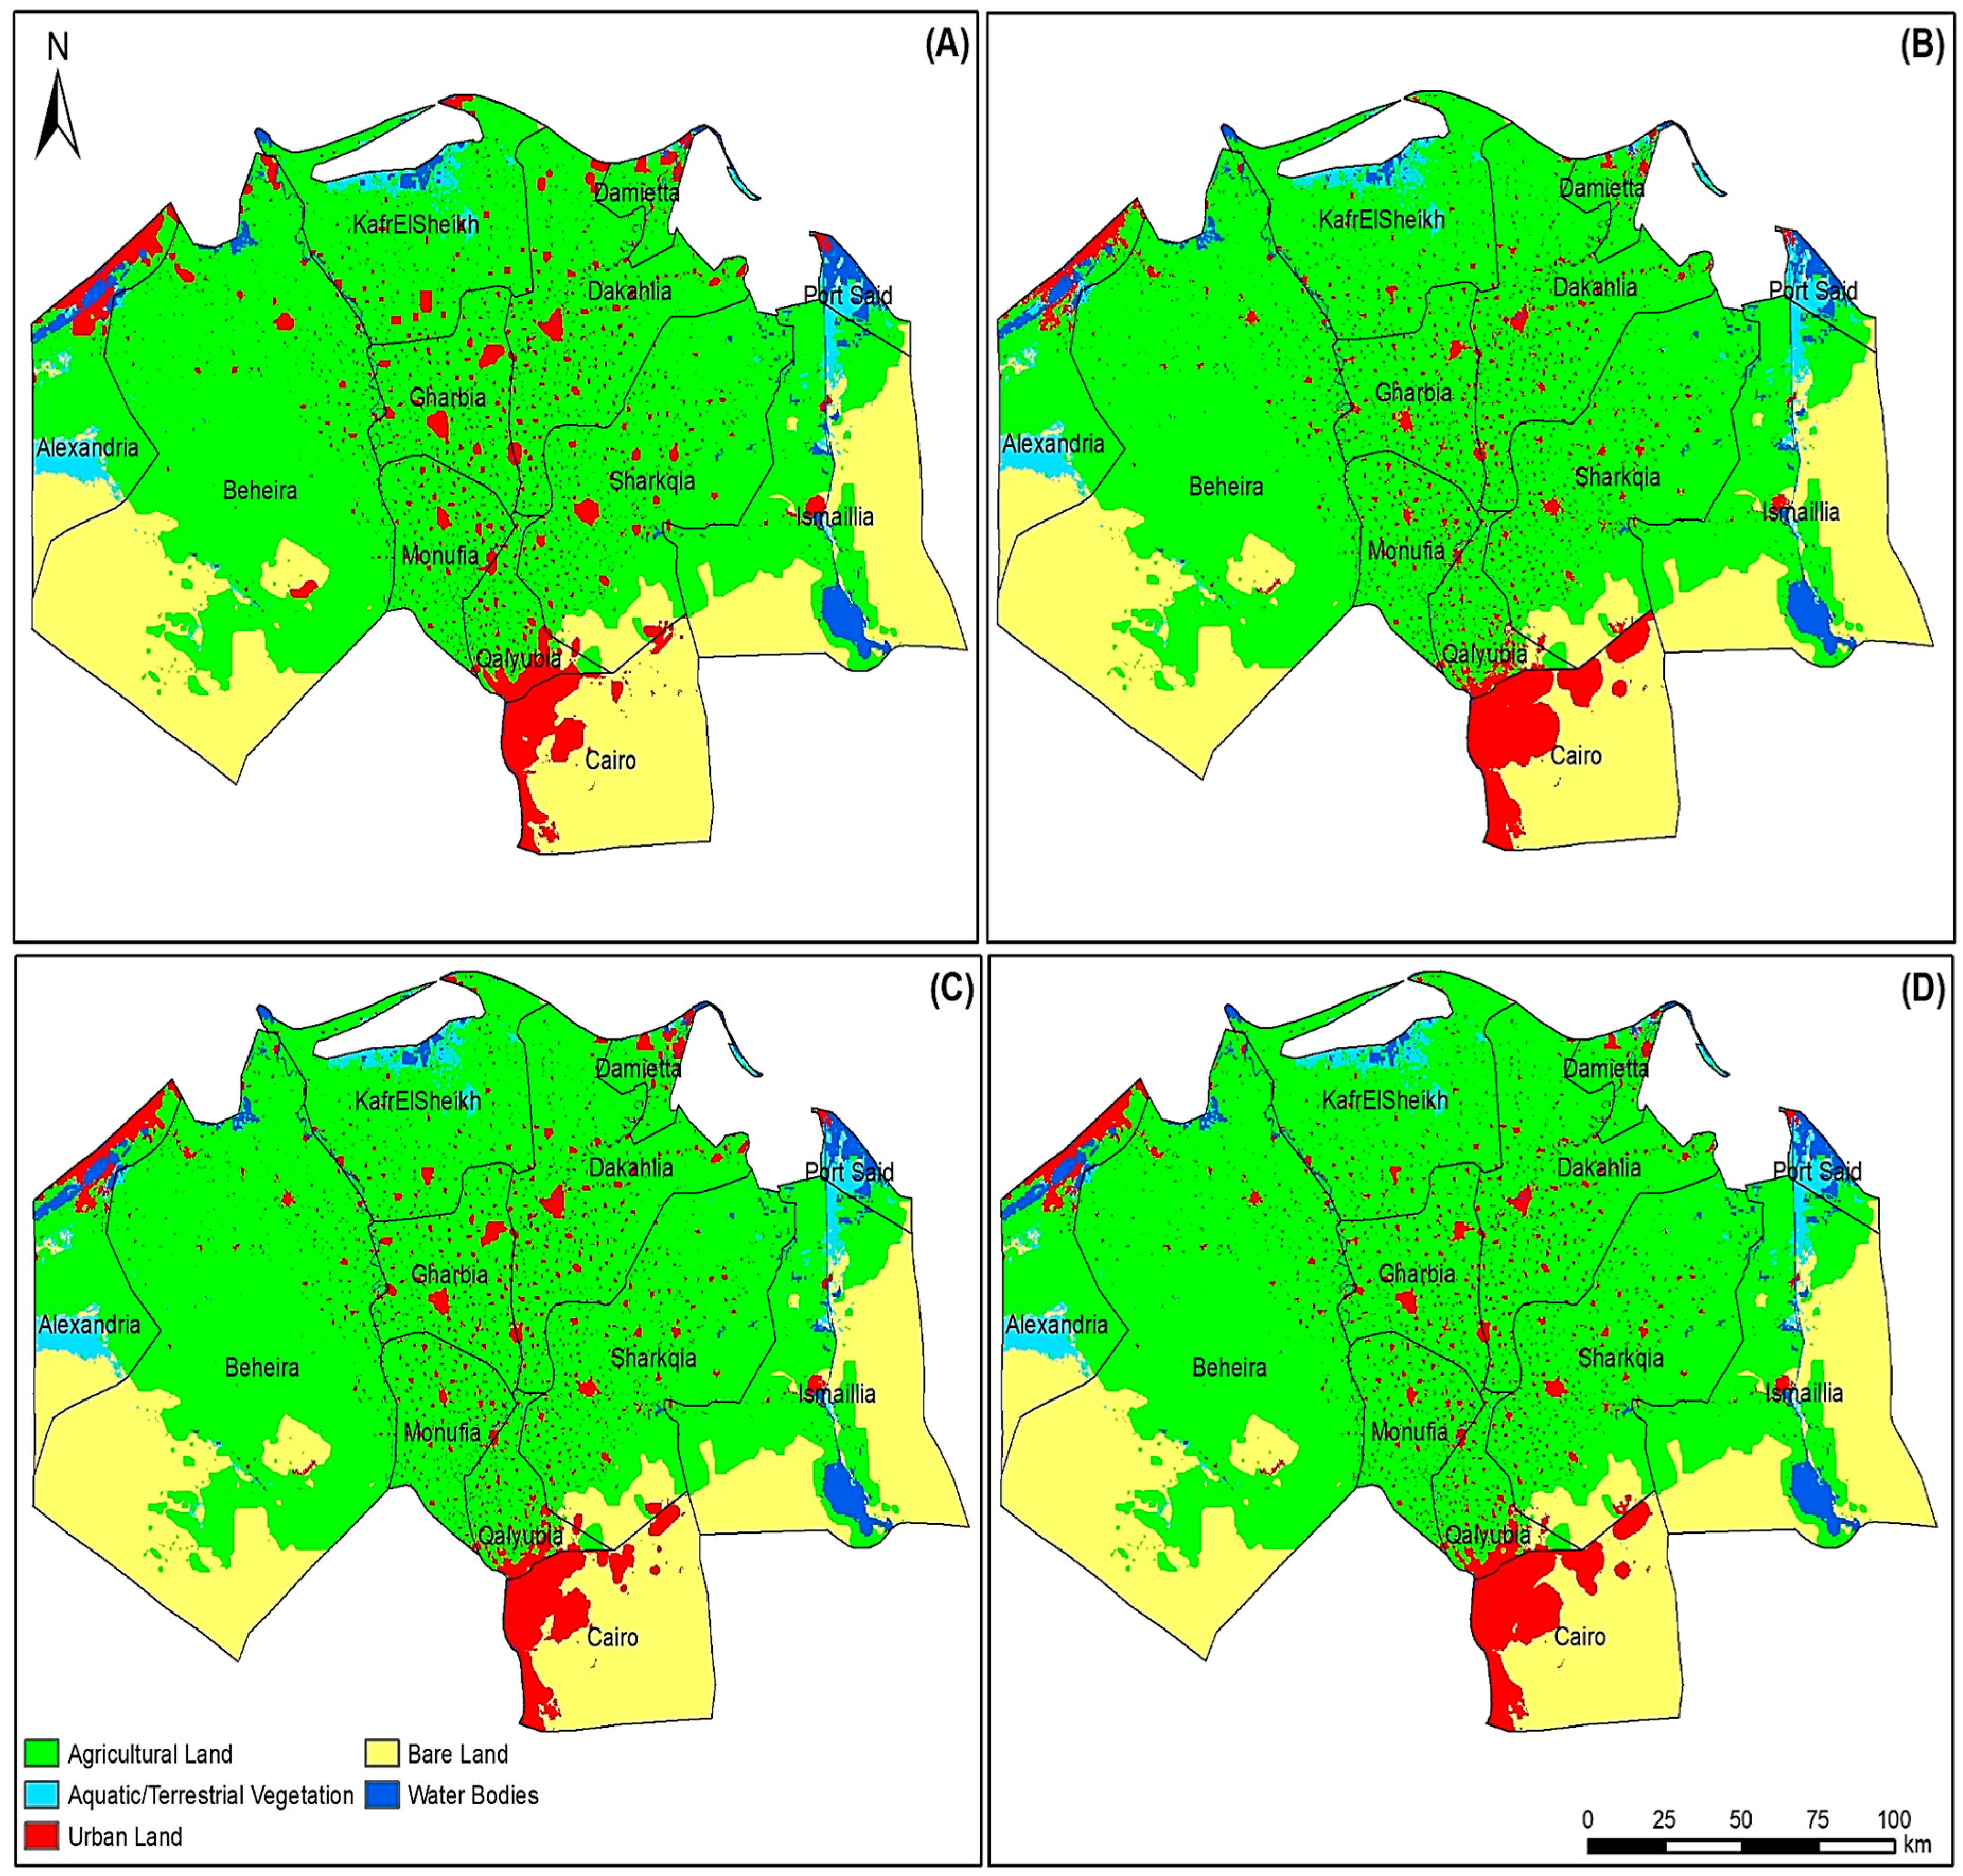
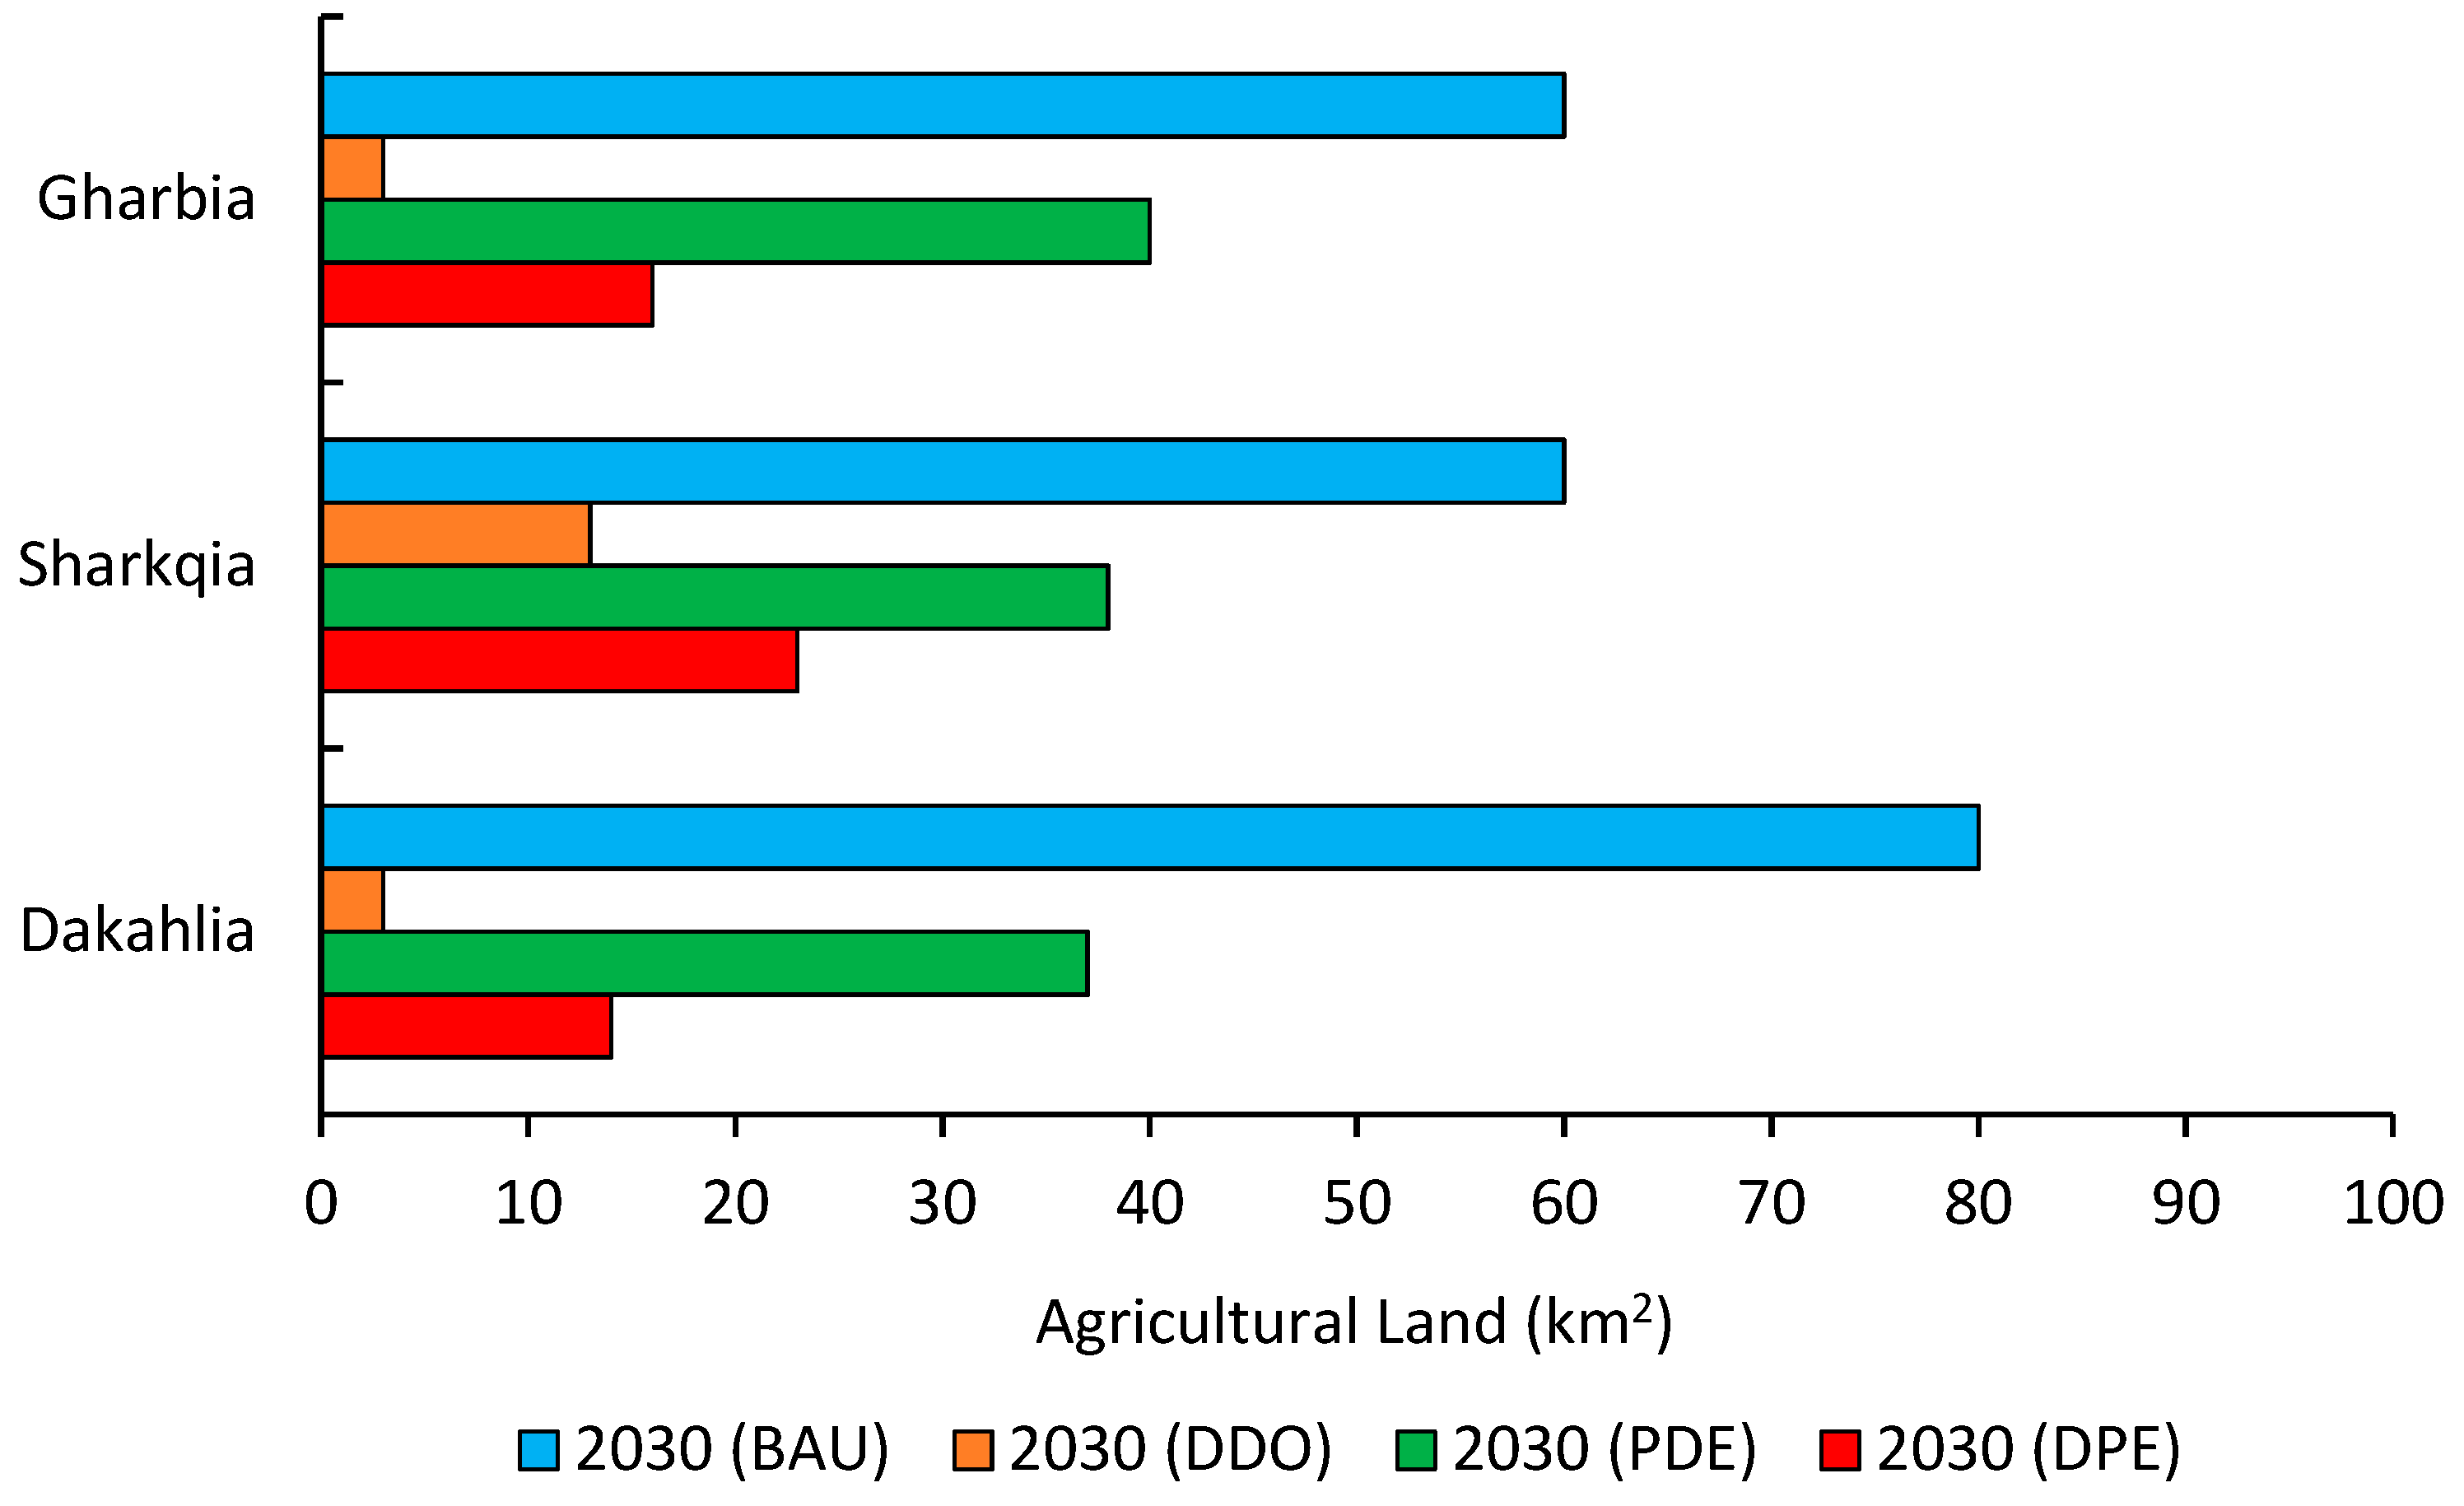
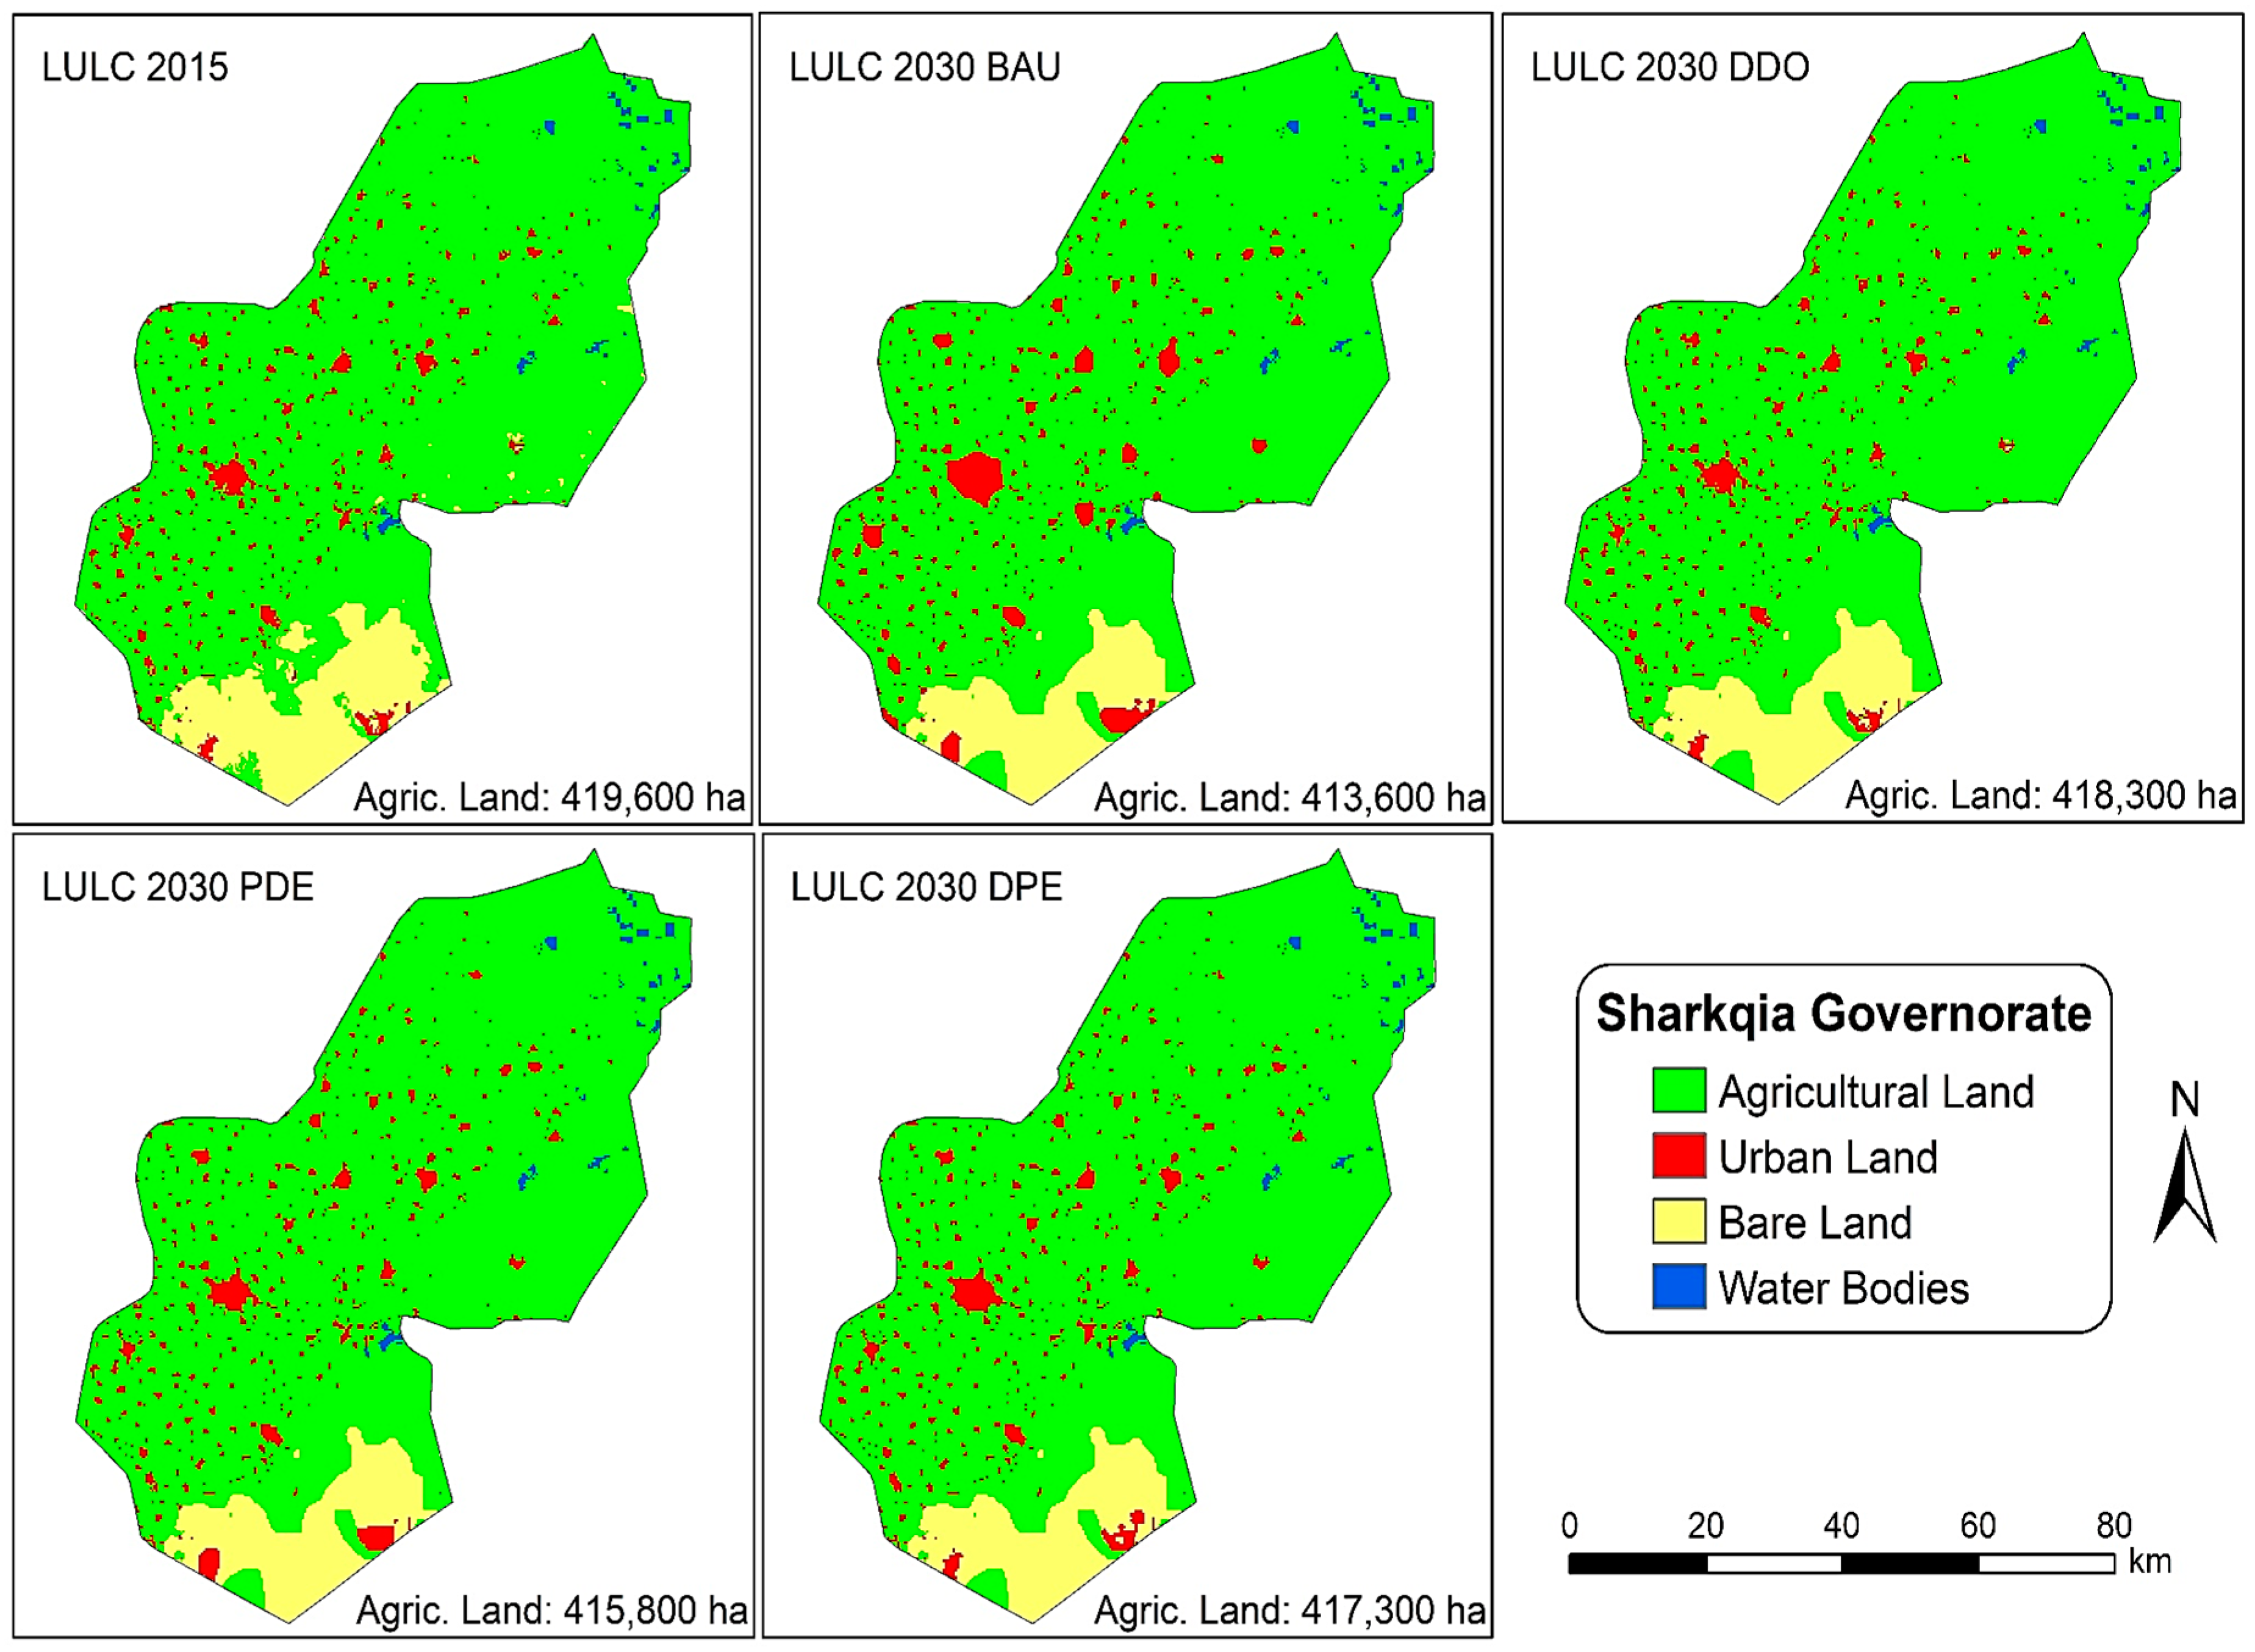
3.2.2. Simulation of LULC in 2030 Based on Different Scenarios of Urban Expansion
4. Discussion
4.1. Previous Nile Delta LULC Studies
4.2. Current and Possible Future Alternative Land-Use Strategies
4.3. Global LULC Change Studies
4.4. Egypt’s Wider Challenges
5. Conclusions
Author Contributions
Acknowledgments
Conflicts of Interest
Appendix A
Appendix B

References
- Worldometers. Available online: http://www.worldometers.info/world-population/egypt-population/ (accessed on 6 June 2018).
- Bakr, N.; Bahnassy, M.H. Egyptian Natural Resources. In The Soils of Egypt; El-Ramady, H., Alshaal, T., Bakr, N., Elbana, T., Mohamed, E., Belal, A.A., Eds.; World Soils Book Series; Springer: Cham, Switzerland, 2019; pp. 33–49. [Google Scholar]
- Abd El-Kawy, O.R.; Rød, J.K.; Ismail, H.A.; Suliman, A.S. Land use and land cover change detection in the western Nile delta of Egypt using remote sensing data. Appl. Geogr. 2011, 31, 483–494. [Google Scholar] [CrossRef]
- Shalaby, A.; Tateishi, R. Remote sensing and GIS for mapping and monitoring land cover and land-use changes in the Northwestern coastal zone of Egypt. Appl. Geogr. 2007, 27, 28–41. [Google Scholar] [CrossRef]
- Bratley, K.; Ghoneim, E. Modeling Urban Encroachment on the Agricultural Land of the Eastern Nile Delta Using Remote Sensing and a GIS-Based Markov Chain Model. Land 2018, 7, 114. [Google Scholar] [CrossRef]
- CAPMAS. The Central Agency for Public Mobilization and Statistics. The Arab Republic of Egypt. 2018. Available online: http://www.capmas.gov.eg/ (accessed on 6 June 2018).
- Food and Agriculture Organization of the United Nations. FAOSTAT Database; FAO: Rome, Italy, 2018; Available online: http://www.fao.org/faostat/en/#data/QC (accessed on 11 November 2018).
- Lambin, E.F.; Turner, B.L.; Geist, H.J.; Agbola, S.B.; Angelsen, A.; Bruce, J.W.; Coomes, O.T.; Dirzo, R.; Fischer, G.; Folke, C.; et al. The causes of land-use and land-cover change: Moving beyond the myths. Glob. Environ. Chang. 2001, 11, 261–269. [Google Scholar] [CrossRef]
- Dewan, A.M.; Yamaguchi, Y. Land use and land cover change in Greater Dhaka, Bangladesh: Using remote sensing to promote sustainable urbanization. Appl. Geogr. 2009, 29, 390–401. [Google Scholar] [CrossRef]
- Wu, K.Y.; Zhang, H. Land use dynamics, built-up land expansion patterns, and driving forces analysis of the fast-growing Hangzhou metropolitan area, eastern China (1978–2008). Appl. Geogr. 2012, 34, 137–145. [Google Scholar] [CrossRef]
- Wu, Y.; Li, S.; Yu, S. Monitoring urban expansion and its effects on land use and land cover changes in Guangzhou city, China. Environ. Monit. Assess. 2016, 188, 1–15. [Google Scholar] [CrossRef] [PubMed]
- Bakr, N.; Weindorf, D.C.; Bahnassy, M.H.; Marei, S.M.; El-Badawi, M.M. Monitoring land cover changes in a newly reclaimed area of Egypt using multi-temporal Landsat data. Appl. Geogr. 2010, 30, 592–605. [Google Scholar] [CrossRef]
- Guan, D.; Li, H.; Inohae, T.; Su, W.; Nagaie, T.; Hokao, K. Modeling urban land use change by the integration of cellular automaton and Markov model. Ecol. Model. 2011, 222, 3761–3772. [Google Scholar] [CrossRef]
- Rogan, J.; Chen, D.M. Remote sensing technology for mapping and monitoring land-cover and land-use change. Prog. Plann. 2004, 61, 301–325. [Google Scholar] [CrossRef]
- Wu, Q.; Li, H.Q.; Wang, R.S.; Paulussen, J.; He, Y.; Wang, M.; Wang, B.H.; Wang, Z. Monitoring and predicting land use change in Beijing using remote sensing and GIS. Landsc. Urban Plan. 2006, 78, 322–333. [Google Scholar] [CrossRef]
- Pijanowski, B.C.; Brown, D.G.; Shellito, B.A.; Manik, G.A. Using neural networks and GIS to forecast land use changes: A Land Transformation Model. Comput. Environ. Urban Syst. 2002, 26, 553–575. [Google Scholar] [CrossRef]
- Halmy, M.W.A.; Gessler, P.E.; Hicke, J.A.; Salem, B.B. Land use/land cover change detection and prediction in the north-western coastal desert of Egypt using Markov-CA. Appl. Geogr. 2015, 63, 101–112. [Google Scholar] [CrossRef]
- Van Soesbergen, A. A Review of Land-Use Change Models. 2016. Available online: https://www.researchgate.net/publication/308515089_A_review_of_land_use_change_models (accessed on 8 February 2019).
- Eastman, J.R. Terrset Geospatial Monitoring and Modeling System; Clark University: Worcester, MA, USA, 2016. [Google Scholar]
- Aburas, M.M.; Ho, Y.M.; Ramli, M.F.; Ash’aari, Z.H. The simulation and prediction of spatio-temporal urban growth trends using cellular automata models: A review. Int. J. Appl. Earth Obs. Geoinf. 2016, 52, 380–389. [Google Scholar] [CrossRef]
- Aburas, M.M.; Ho, Y.M.; Ramli, M.F.; Ash’aari, Z.H. Improving the capability of an integrated CA-Markov model to simulate spatio-temporal urban growth trends using an Analytical Hierarchy Process and Frequency Ratio. Int. J. Appl. Earth Obs. Geoinf. 2017, 59, 65–78. [Google Scholar] [CrossRef]
- Clarke, K.C.; Hoppen, S.; Gaydos, L.J. A self-modifying cellular automaton model of historical urbanization in the San Francisco Bay area. Environ. Plan. B 1997, 24, 247–261. [Google Scholar] [CrossRef]
- Baker, W.L. A review of models of landscape change. Landsc. Ecol. 1989, 2, 111–133. [Google Scholar] [CrossRef]
- Muller, M.R.; Middleton, J. A Markov model of land-use change dynamics in the Niagara Region, Ontario, Canada. Landsc. Ecol. 1994, 9, 151–157. [Google Scholar]
- Kamusoko, C.; Aniya, M.; Adi, B.; Manjoro, M. Rural sustainability under threat in Zimbabwe—Simulation of future land use/cover changes in the Bindura district based on the Markov-cellular automata model. Appl. Geogr. 2009, 29, 435–447. [Google Scholar] [CrossRef]
- Weng, Q. Land use change analysis in the Zhujiang Delta of China using satellite remote sensing, GIS and stochastic modelling. J. Environ. Manag. 2002, 64, 273–284. [Google Scholar] [CrossRef] [PubMed]
- Balzter, H. Markov chain models for vegetation dynamics. Ecol. Model. 2000, 126, 139–154. [Google Scholar] [CrossRef]
- Yang, X.; Zheng, X.Q.; Lv, L.N. A spatiotemporal model of land use change based on ant colony optimization, Markov chain and cellular automata. Ecol. Model. 2012, 233, 11–19. [Google Scholar] [CrossRef]
- Mishra, V.N.; Rai, P.K. A remote sensing aided multi-layer perceptron-Markov chain analysis for land use and land cover change prediction in Patna district (Bihar), India. Arab. J. Geosci. 2016, 9, 4. [Google Scholar] [CrossRef]
- Santé, I.; García, A.M.; Miranda, D.; Crecente, R. Cellular automata models for the simulation of real-world urban processes: A review and analysis. Landsc. Urban Plan. 2010, 96, 108–122. [Google Scholar] [CrossRef]
- Memarian, H.; Kumar Balasundram, S.; Bin Talib, J.; Teh Boon Sung, C.; Mohd Sood, A.; Abbaspour, K. Validation of CA-Markov for Simulation of Land Use and Cover Change in the Langat Basin, Malaysia. J. Geogr. Inf. Syst. 2012, 4, 542–554. [Google Scholar] [CrossRef]
- Nouri, J.; Gharagozlou, A.; Arjmandi, R.; Faryadi, S.; Adl, M. Predicting Urban Land Use Changes Using a CA-Markov Model. Arab. J. Sci. Eng. 2014, 39, 5565–5573. [Google Scholar] [CrossRef]
- Houet, T.; Hubert-Moy, L. Modeling and projecting land-use and land-cover changes with Cellular Automaton in considering landscape trajectories. EARSeL eProceedings 2006, 5, 63–76. [Google Scholar]
- Negm, A.M.; Saavedra, O.; El-Adawy, A. Nile Delta Biography: Challenges and Opportunities. In The Nile Delta; Negm, A., Ed.; The Handbook of Environmental Chemistry; Springer: Cham, Switzerland, 2016; Volume 55. [Google Scholar]
- Shalaby, A. Assessment of Urban Sprawl Impact on the Agricultural Land in the Nile Delta of Egypt Using Remote Sensing and Digital Soil Map. Int. J. Environ. Sci. 2012, 1, 253–262. [Google Scholar]
- European Space Agency (ESA). Land Cover CCI Product User Guide Version 2.0. 2018. Available online: http://maps.elie.ucl.ac.be/CCI/viewer/download/ESACCI-LC-Ph2-PUGv2_2.0.pdf (accessed on 14 January 2019).
- Environmental Systems Research Institute (ESRI). ArcGIS Desktop 10.5; ESRI: Redlands, CA, USA, 2016. [Google Scholar]
- Hyandye, C.; Martz, L.W. A Markovian and cellular automata land-use change predictive model of the Usangu Catchment. Int. J. Remote Sens. 2017, 38, 64–81. [Google Scholar] [CrossRef]
- Wu, F. Calibration of stochastic cellular automata: The application to rural-urban land conversions. Int. J. Geogr. Inf. Sci. 2002, 16, 795–818. [Google Scholar] [CrossRef]
- Pontius, G.R.; Malanson, J. Comparison of the structure and accuracy of two land change models. Int. J. Geogr. Inf. Sci. 2005, 19, 243–265. [Google Scholar] [CrossRef]
- Wang, S.Q.; Zheng, X.Q.; Zang, X.B. Accuracy assessments of land use change simulation based on Markov-cellular automata model. Procedia Environ. Sci. 2012, 13, 1238–1245. [Google Scholar] [CrossRef]
- WorldPop. Available online: http://www.worldpop.org.uk/data/summary/?doi=10.5258/SOTON/WP00078 (accessed on 6 June 2018).
- Bakr, N.; Bahnassy, M.H. Land Use/Land Cover and Vegetation Status. In The Soils of Egypt; El-Ramady, H., Alshaal, T., Bakr, N., Elbana, T., Mohamed, E., Belal, A.A., Eds.; World Soils Book Series; Springer: Cham, Switzerland, 2019. [Google Scholar]
- Ghar, M.A.; Shalaby, A.; Tateishi, R. Agricultural land monitoring in the Egyptian Nile Delta using landsat data. Int. J. Environ. Stud. 2004, 61, 651–657. [Google Scholar] [CrossRef]
- Viera, A.J.; Garrett, J.M. Kappa_statisitc_paper. Fam. Med. 2005, 37, 360–363. [Google Scholar] [PubMed]
- Kityuttachai, K.; Tripathi, N.K.; Tipdecho, T.; Shrestha, R. CA-Markov analysis of constrained coastal urban growth modeling: Hua hin Seaside City. Thailand. Sustainability 2013, 5, 1480–1500. [Google Scholar] [CrossRef]
- El-hallaq, M.A.; Habboub, M.O. Using Cellular Automata-Markov Analysis and Multi Criteria Evaluation for Predicting the Shape of the Dead Sea. Adv. Remote Sens. 2015, 4, 83–95. [Google Scholar] [CrossRef]
- Amini Parsa, V.; Yavari, A.; Nejadi, A. Spatio-temporal analysis of land use/land cover pattern changes in Arasbaran Biosphere Reserve: Iran. Model. Earth Syst. Environ. 2016, 2, 1–13. [Google Scholar] [CrossRef]
- Shalaby, A.A.; Ali, R.R.; Gad, A. Urban sprawl impact assessment on the agricultural land in Egypt using remote sensing and GIS: a case study, Qalubiya Governorate. J. Land Use Sci. 2012, 7, 261–273. [Google Scholar] [CrossRef]
- Shalaby, A.; Moghanm, F.S. Assessment of urban sprawl on agricultural soil of northern Nile Delta of Egypt using RS and GIS. Chin. Geogr. Sci. 2015, 25, 274–282. [Google Scholar] [CrossRef]
- Megahed, Y.; Cabral, P.; Silva, J.; Caetano, M. Land Cover Mapping Analysis and Urban Growth Modelling Using Remote Sensing Techniques in Greater Cairo Region—Egypt. ISPRS Int. J. Geo-Inf. 2015, 4, 1750–1769. [Google Scholar] [CrossRef]
- Barnes, J. Pumping possibility: Agricultural expansion through desert reclamation in Egypt. Soc. Stud. Sci. 2012, 42, 517–538. [Google Scholar] [CrossRef]
- Mundia, C.N.; Aniya, M. Analysis of land use/cover changes and urban expansion of Nairobi city using remote sensing and GIS. Int. J. Remote Sens. 2005, 26, 2831–2849. [Google Scholar] [CrossRef]
- Sahana, M.; Hong, H.; Sajjad, H. Analyzing urban spatial patterns and trend of urban growth using urban sprawl matrix: A study on Kolkata urban agglomeration, India. Sci. Total Environ. 2018, 628–629, 1557–1566. [Google Scholar] [CrossRef] [PubMed]
- Shi, K.; Chen, Y.; Yu, B.; Xu, T.; Li, L.; Huang, C.; Liu, R.; Chen, Z.; Wu, J. Urban expansion and agricultural land loss in China: A multiscale perspective. Sustainability 2016, 8, 790. [Google Scholar] [CrossRef]


| LULC Class | Area (km2) | Change | ||||
|---|---|---|---|---|---|---|
| 1992 | 1998 | 2004 | 2010 | 2015 | 1992–2015 (%) | |
| Agricultural Land | 24,053 | 24,427 | 24,959 | 25,430 | 25,576 | 6.3 |
| Natural Vegetation | 1435 | 1301 | 1147 | 1031 | 989 | −31.1 |
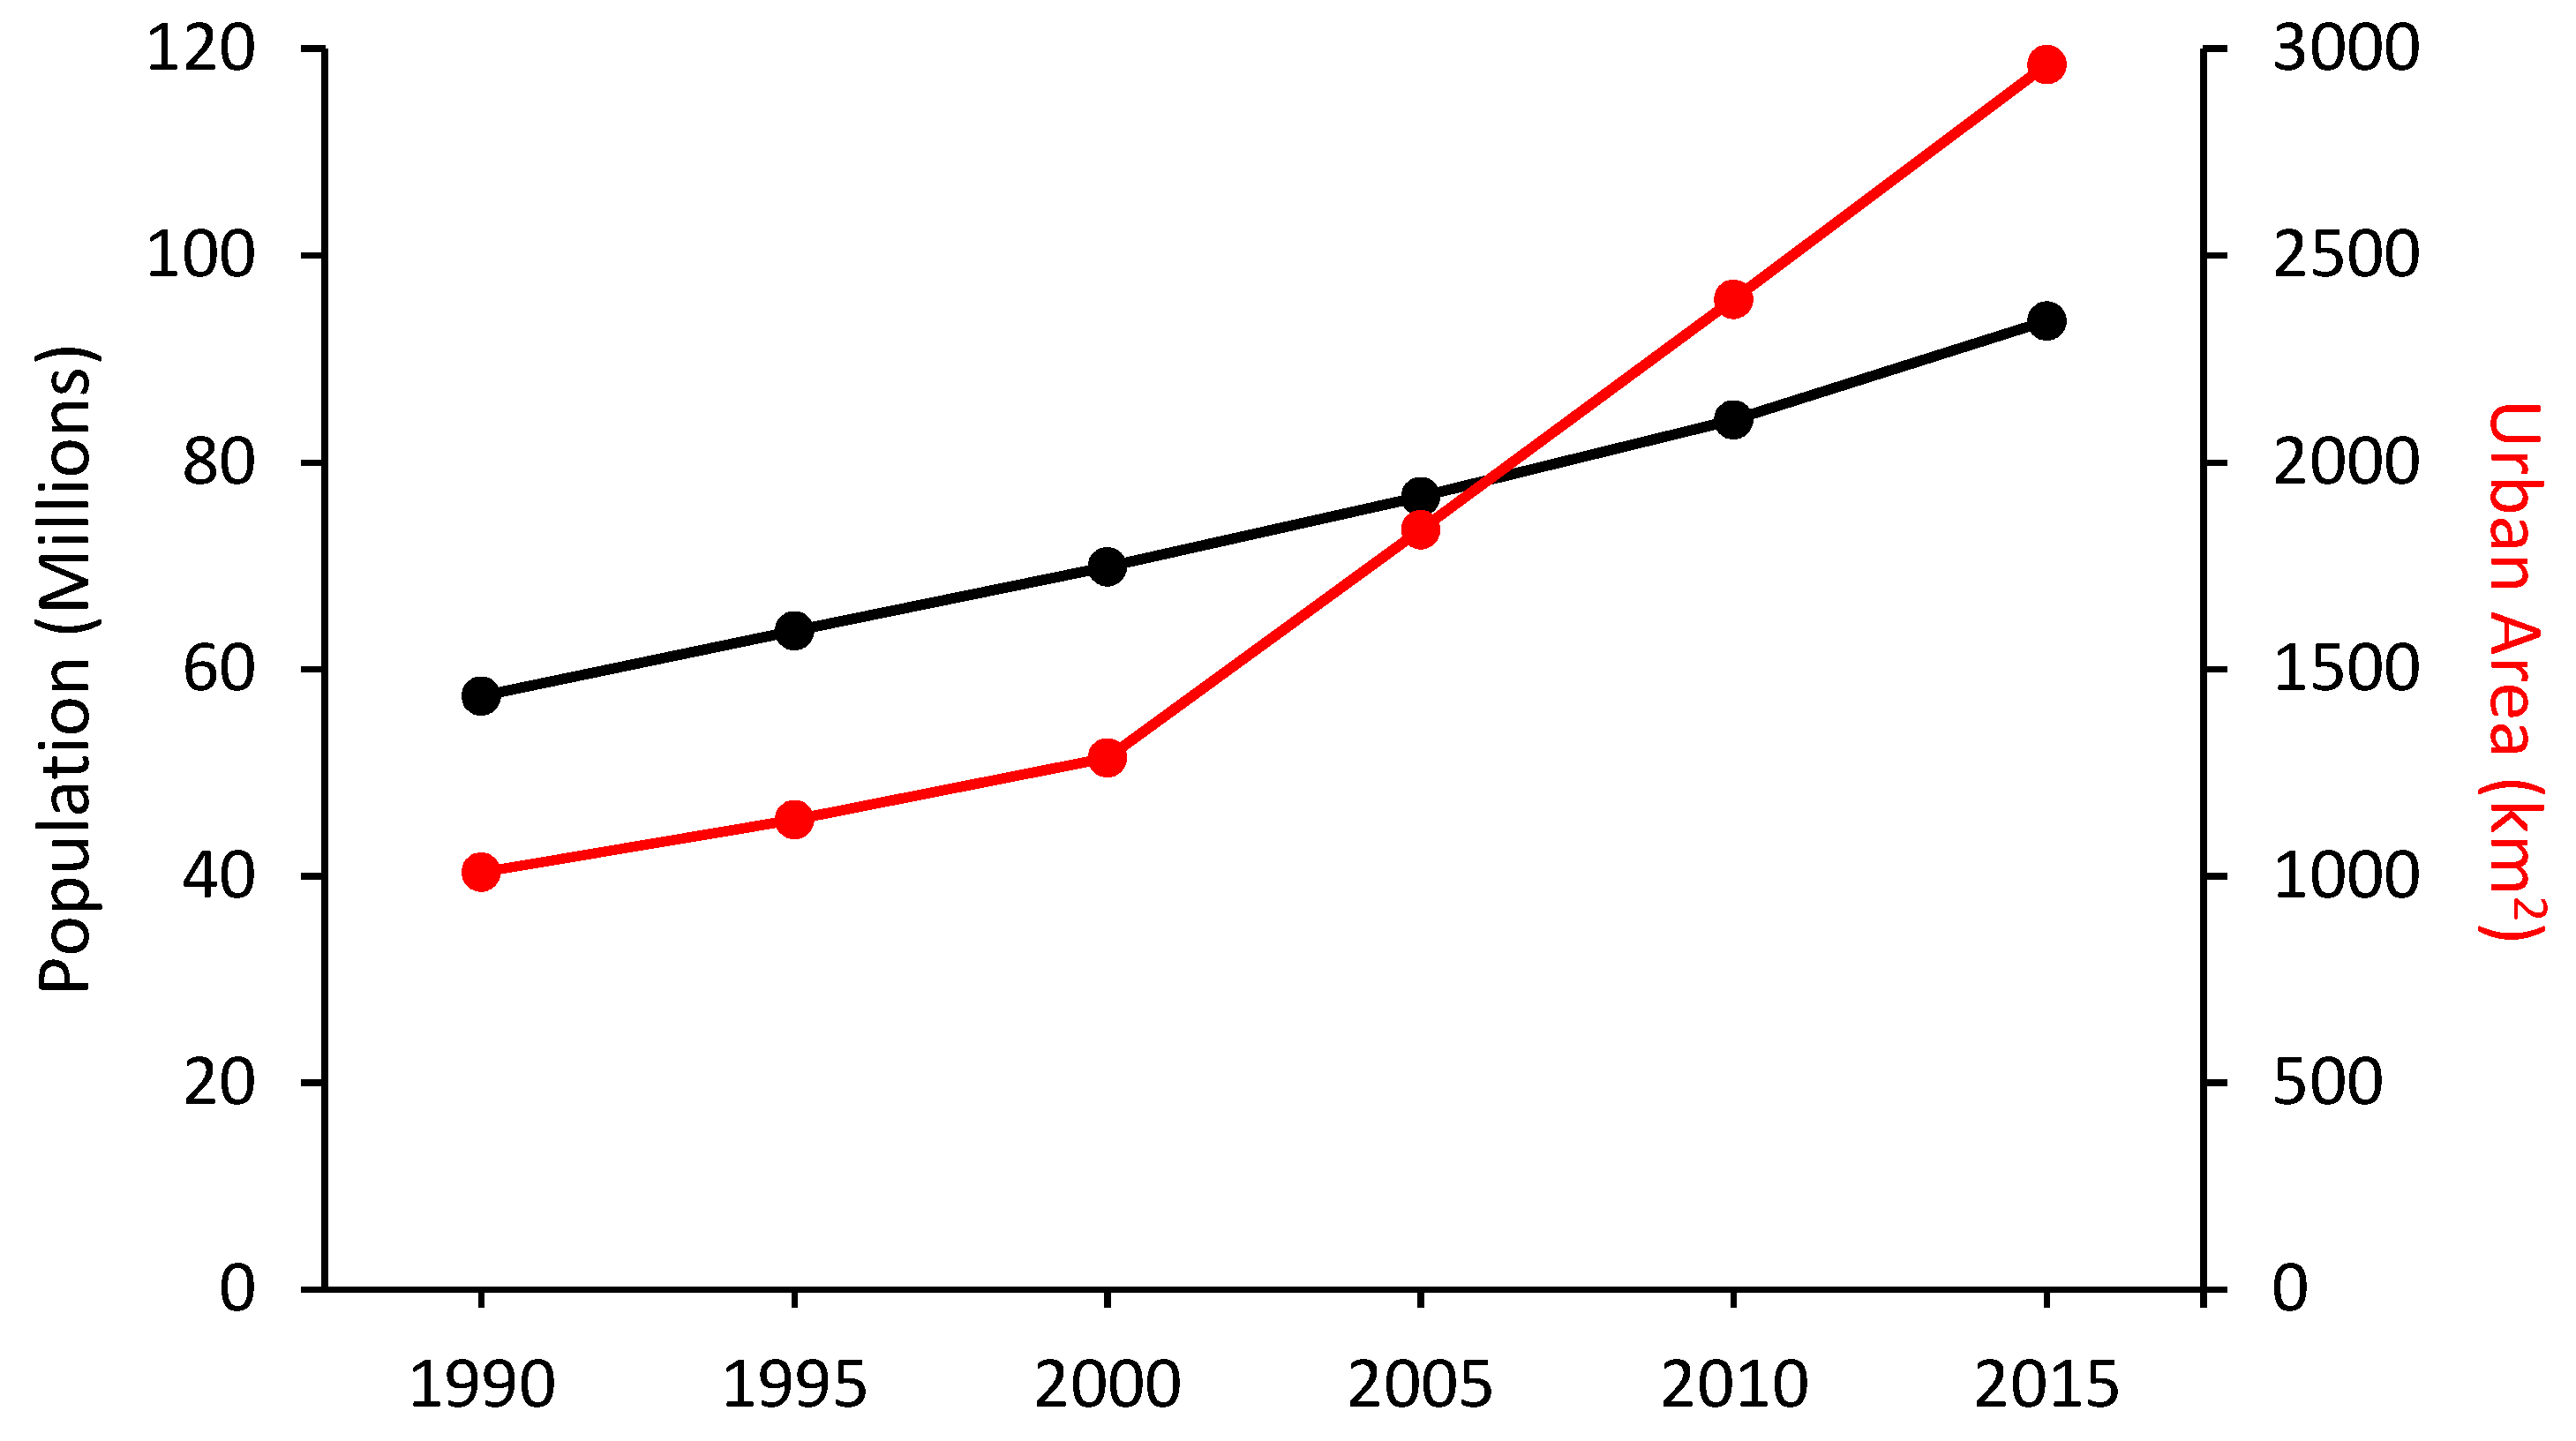
| Urban Land | 755 | 873 | 1266 | 1597 | 1890 | 150.3 |
| Bare Land | 13,031 | 12,696 | 11,947 | 11,243 | 10,795 | −17.2 |
| Water Bodies | 841 | 818 | 797 | 815 | 866 | 2.9 |
| LULC Transition | Area | |
|---|---|---|
| (km2) | Hectares (ha) | |
| Agriculture to Urban | 746 | 74,600 |
| Vegetation to Urban | 170 | 17,000 |
| No Change | 36,352 | 3,635,200 |
| Vegetation to Agriculture | 266 | 26,600 |
| Bare to Urban | 205 | 20,500 |
| Bare to Agriculture | 2061 | 206,100 |
| Other LC classes changes | 315 | 31,500 |
| LULC Class | Area Change (km2) | ||
|---|---|---|---|
| 1995–2005 | 2005–2015 | 2015–2030 | |
| Agricultural Land | 730 | 595 | 405 |
| Aquatic/Terrestrial Vegetation | −234 | −138 | −116 |
| Urban Land | 539 | 556 | 869 |
| Bare Land | −1,022 | −1,083 | −1,225 |
| Water Bodies | −14 | 73 | 66 |
| LULC Class | Predicted Area (km2) | |||
|---|---|---|---|---|
| BAU | DDO | PDE | DPE | |
| Agricultural Land | 26,078 | 26,488 | 26,332 | 26,424 |
| Aquatic/Terrestrial Vegetation | 832 | 814 | 806 | 826 |
| Urban Land | 2683 | 2680 | 2678 | 2681 |
| Bare Land | 9572 | 9247 | 9403 | 9293 |
| Water Bodies | 951 | 887 | 897 | 892 |
© 2019 by the authors. Licensee MDPI, Basel, Switzerland. This article is an open access article distributed under the terms and conditions of the Creative Commons Attribution (CC BY) license (http://creativecommons.org/licenses/by/4.0/).
Share and Cite
Radwan, T.M.; Blackburn, G.A.; Whyatt, J.D.; Atkinson, P.M. Dramatic Loss of Agricultural Land Due to Urban Expansion Threatens Food Security in the Nile Delta, Egypt. Remote Sens. 2019, 11, 332. https://doi.org/10.3390/rs11030332
Radwan TM, Blackburn GA, Whyatt JD, Atkinson PM. Dramatic Loss of Agricultural Land Due to Urban Expansion Threatens Food Security in the Nile Delta, Egypt. Remote Sensing. 2019; 11(3):332. https://doi.org/10.3390/rs11030332
Chicago/Turabian StyleRadwan, Taher M., G. Alan Blackburn, J. Duncan Whyatt, and Peter M. Atkinson. 2019. "Dramatic Loss of Agricultural Land Due to Urban Expansion Threatens Food Security in the Nile Delta, Egypt" Remote Sensing 11, no. 3: 332. https://doi.org/10.3390/rs11030332
APA StyleRadwan, T. M., Blackburn, G. A., Whyatt, J. D., & Atkinson, P. M. (2019). Dramatic Loss of Agricultural Land Due to Urban Expansion Threatens Food Security in the Nile Delta, Egypt. Remote Sensing, 11(3), 332. https://doi.org/10.3390/rs11030332