Drought and Human Impacts on Land Use and Land Cover Change in a Vietnamese Coastal Area

 , ,
, ,  ,
,
Abstract
:
1. Introduction
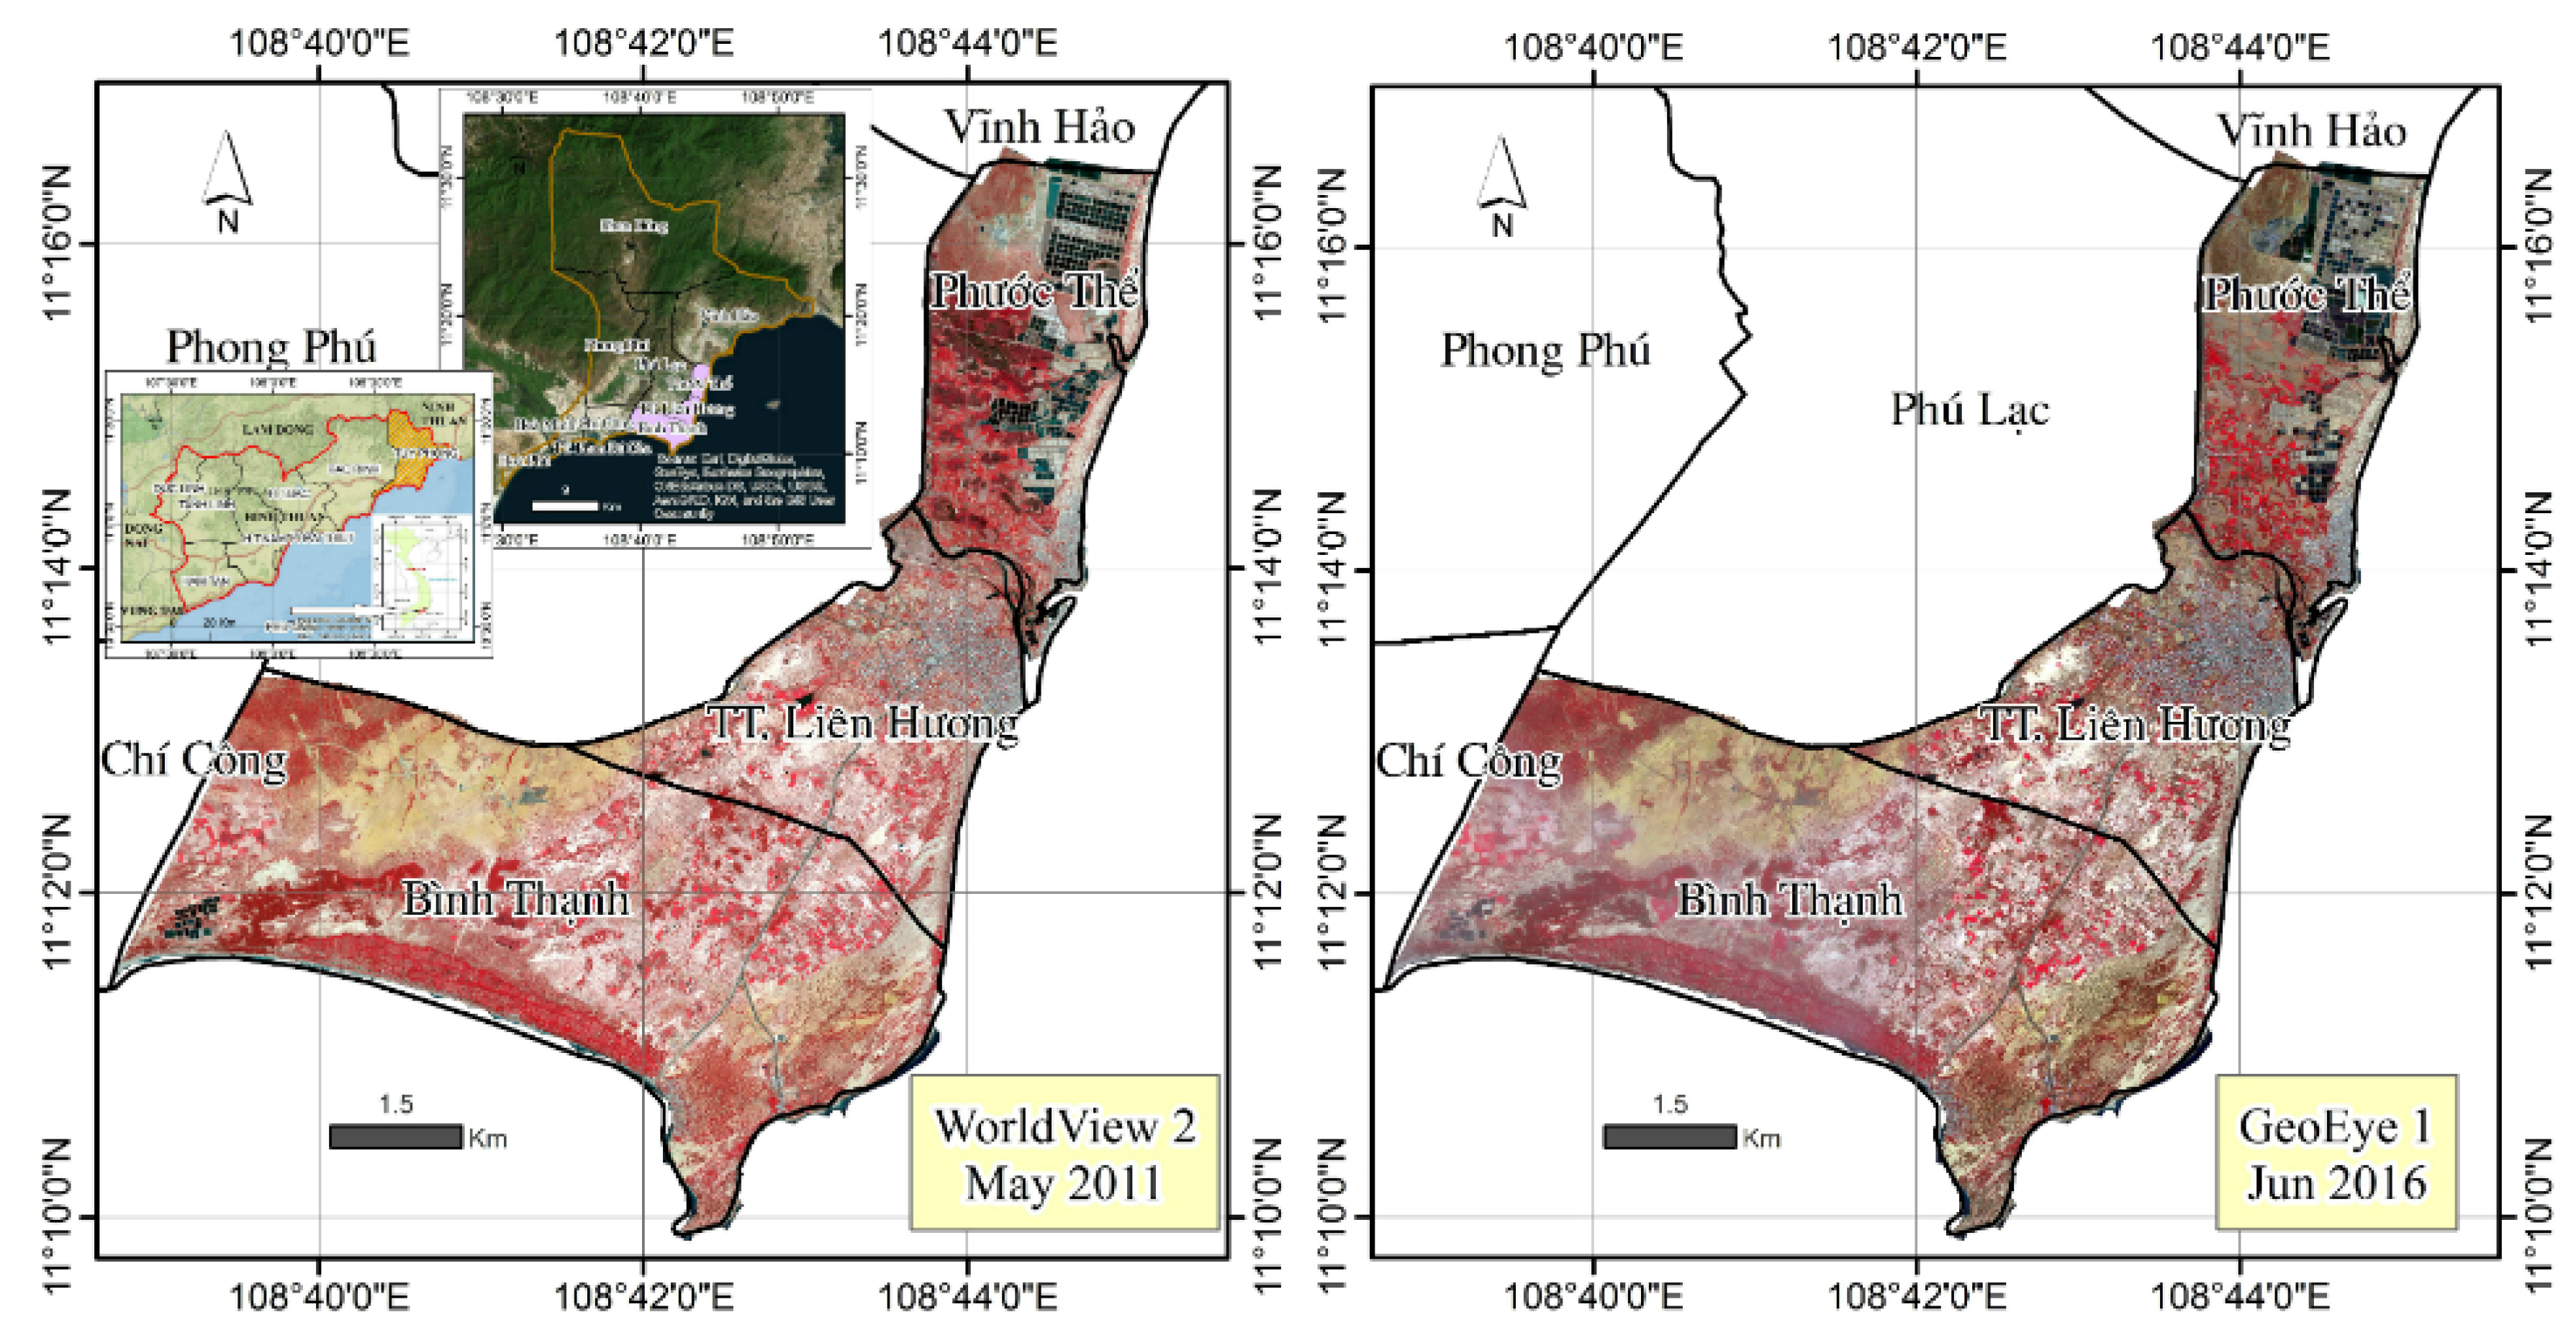
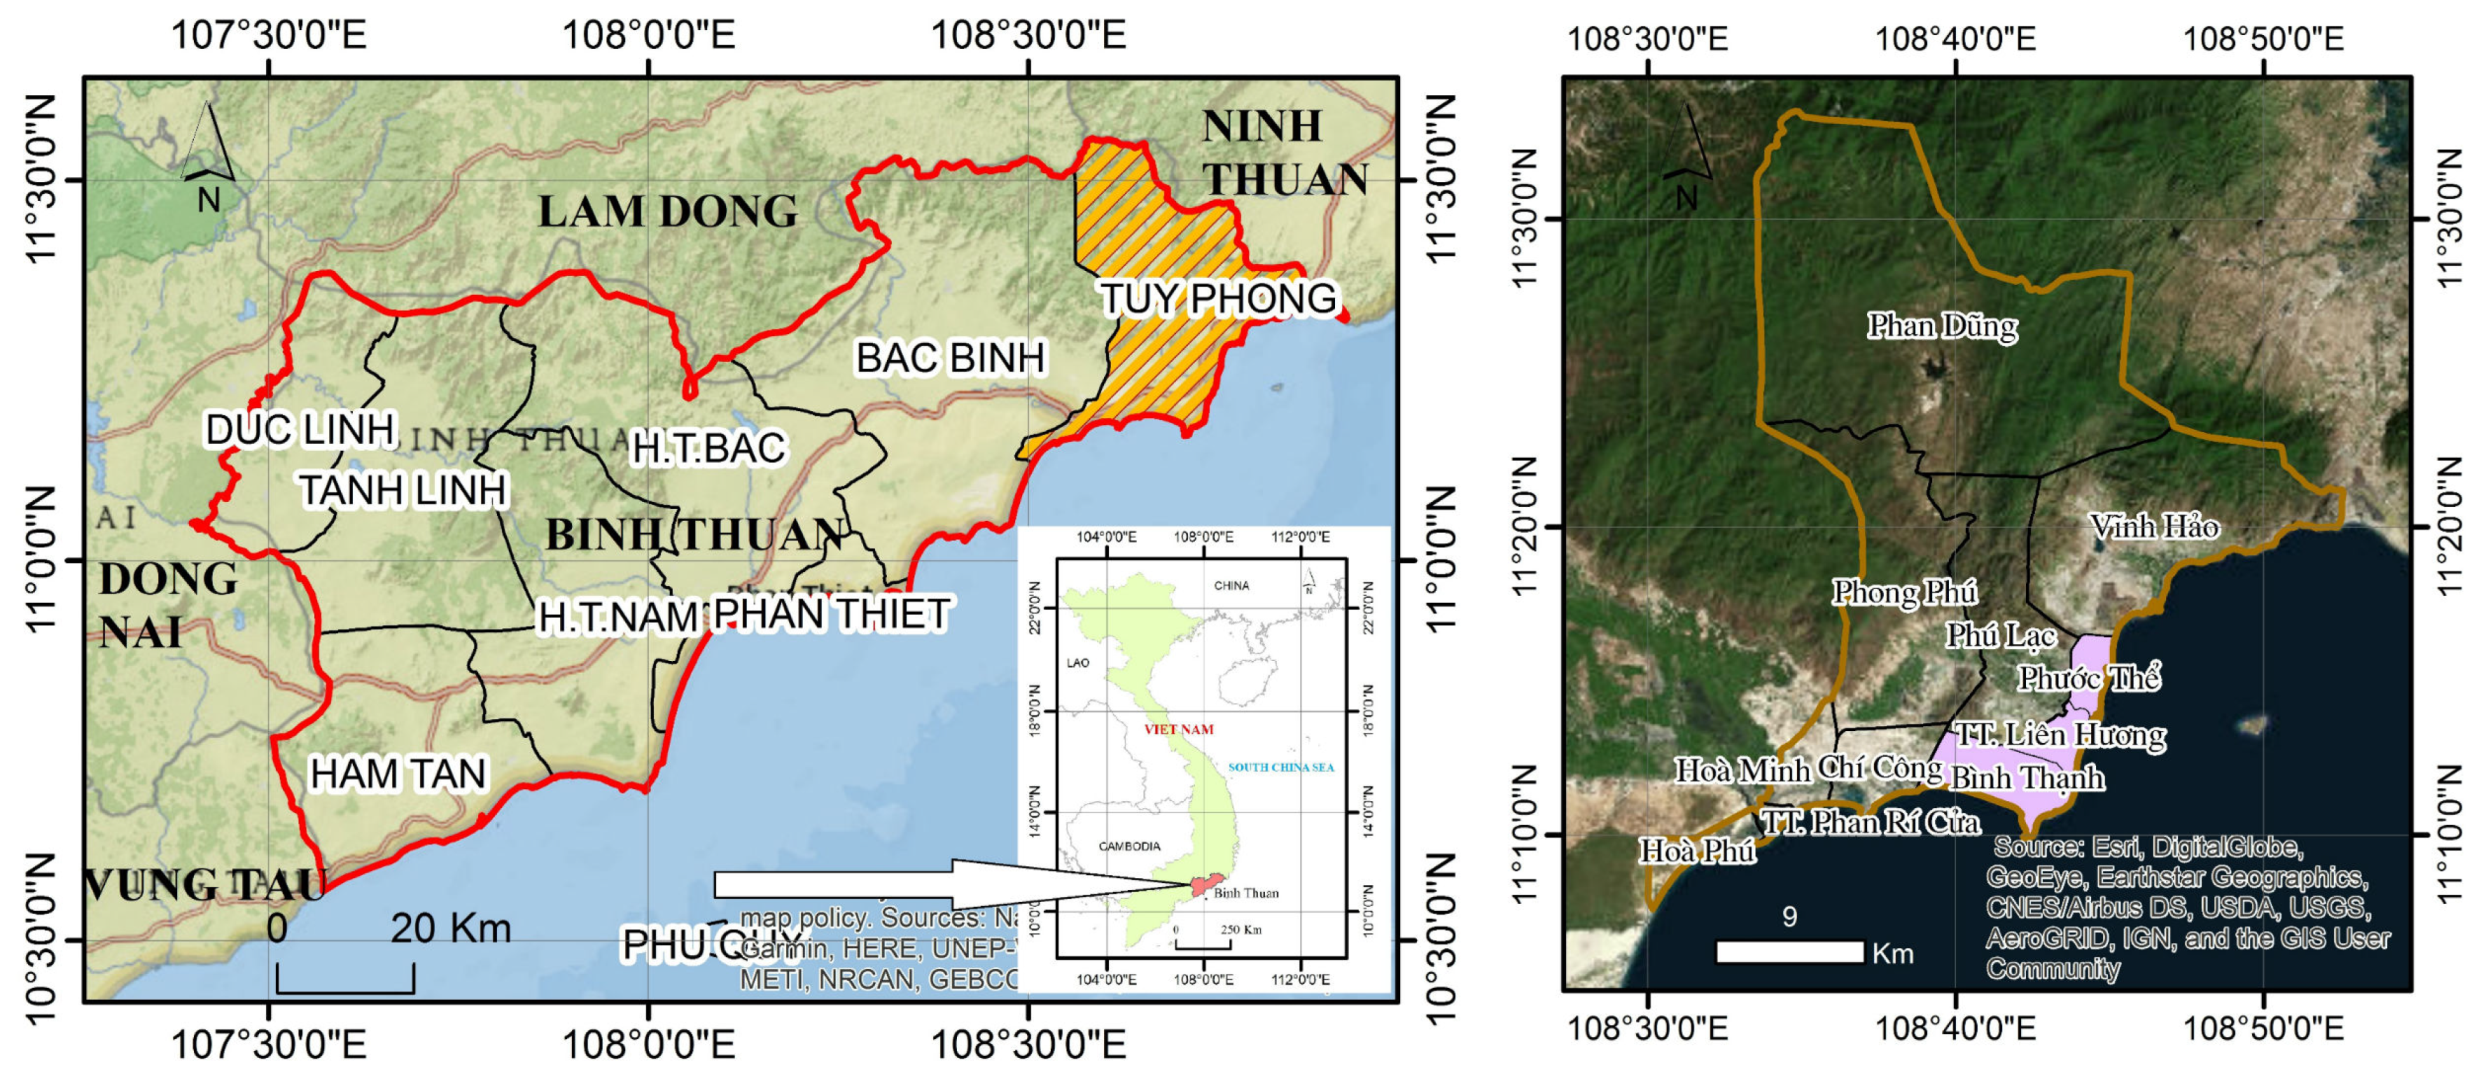
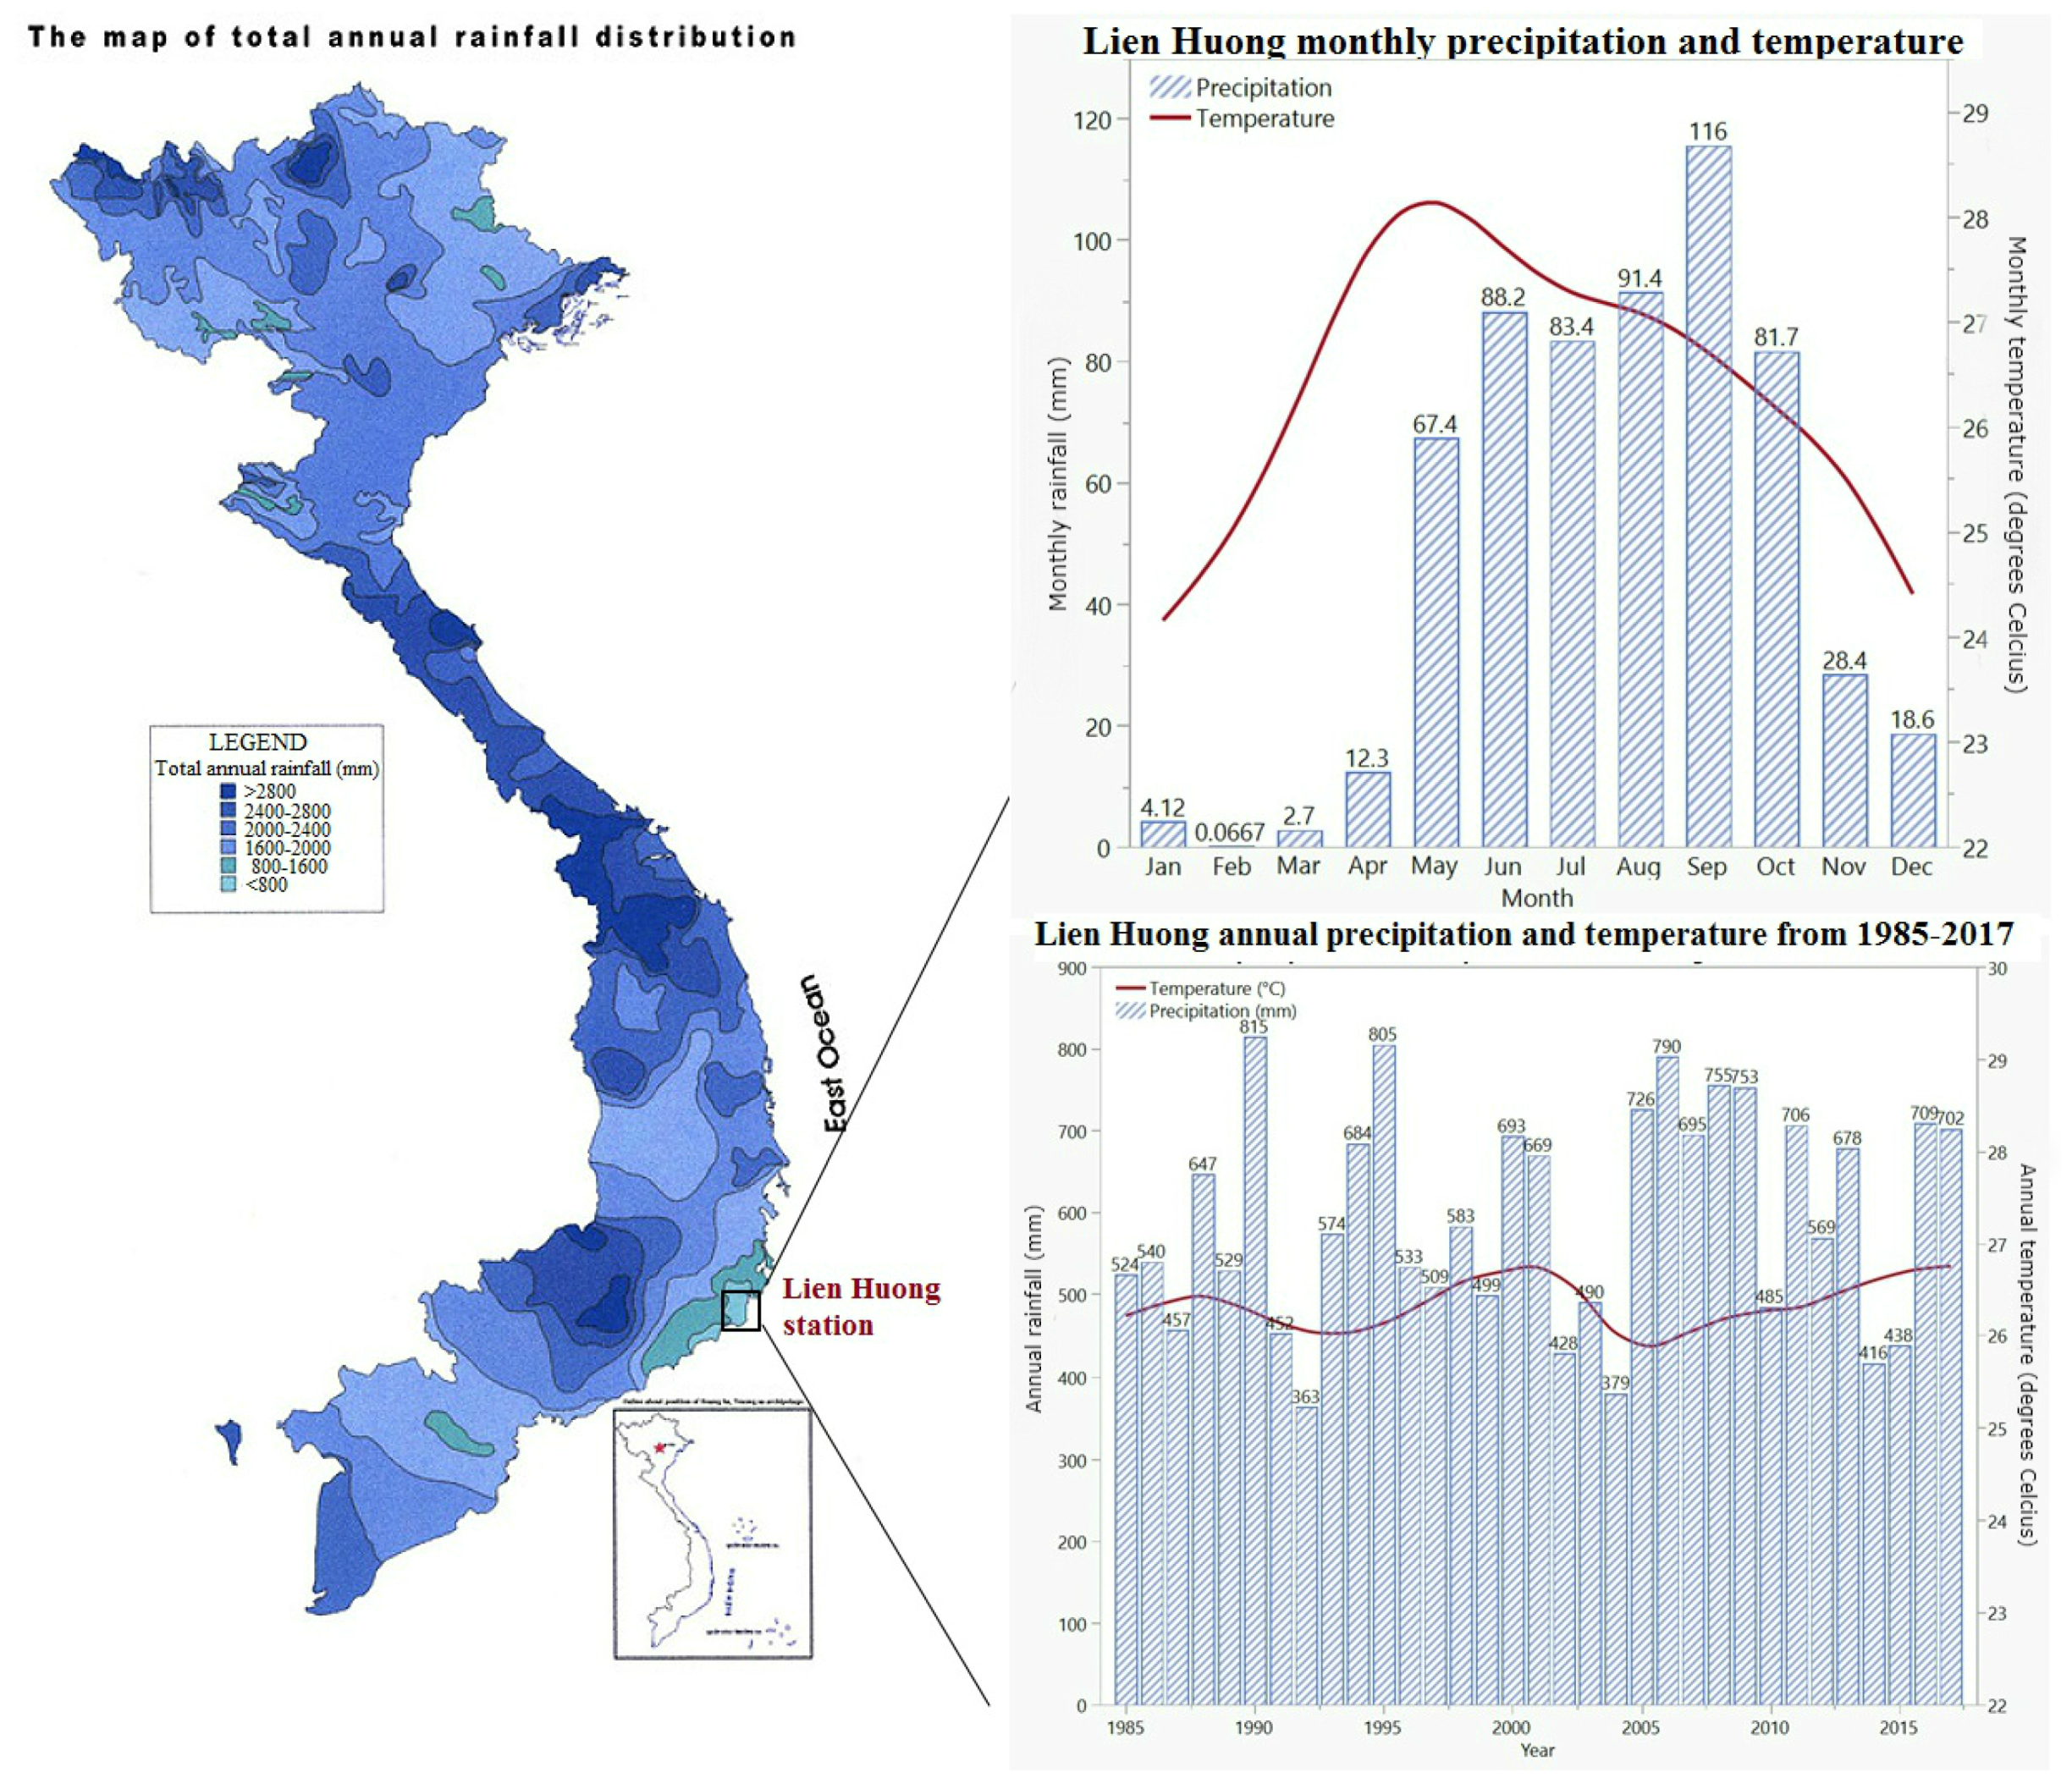
2. Study Area
2.1. Study Area Background
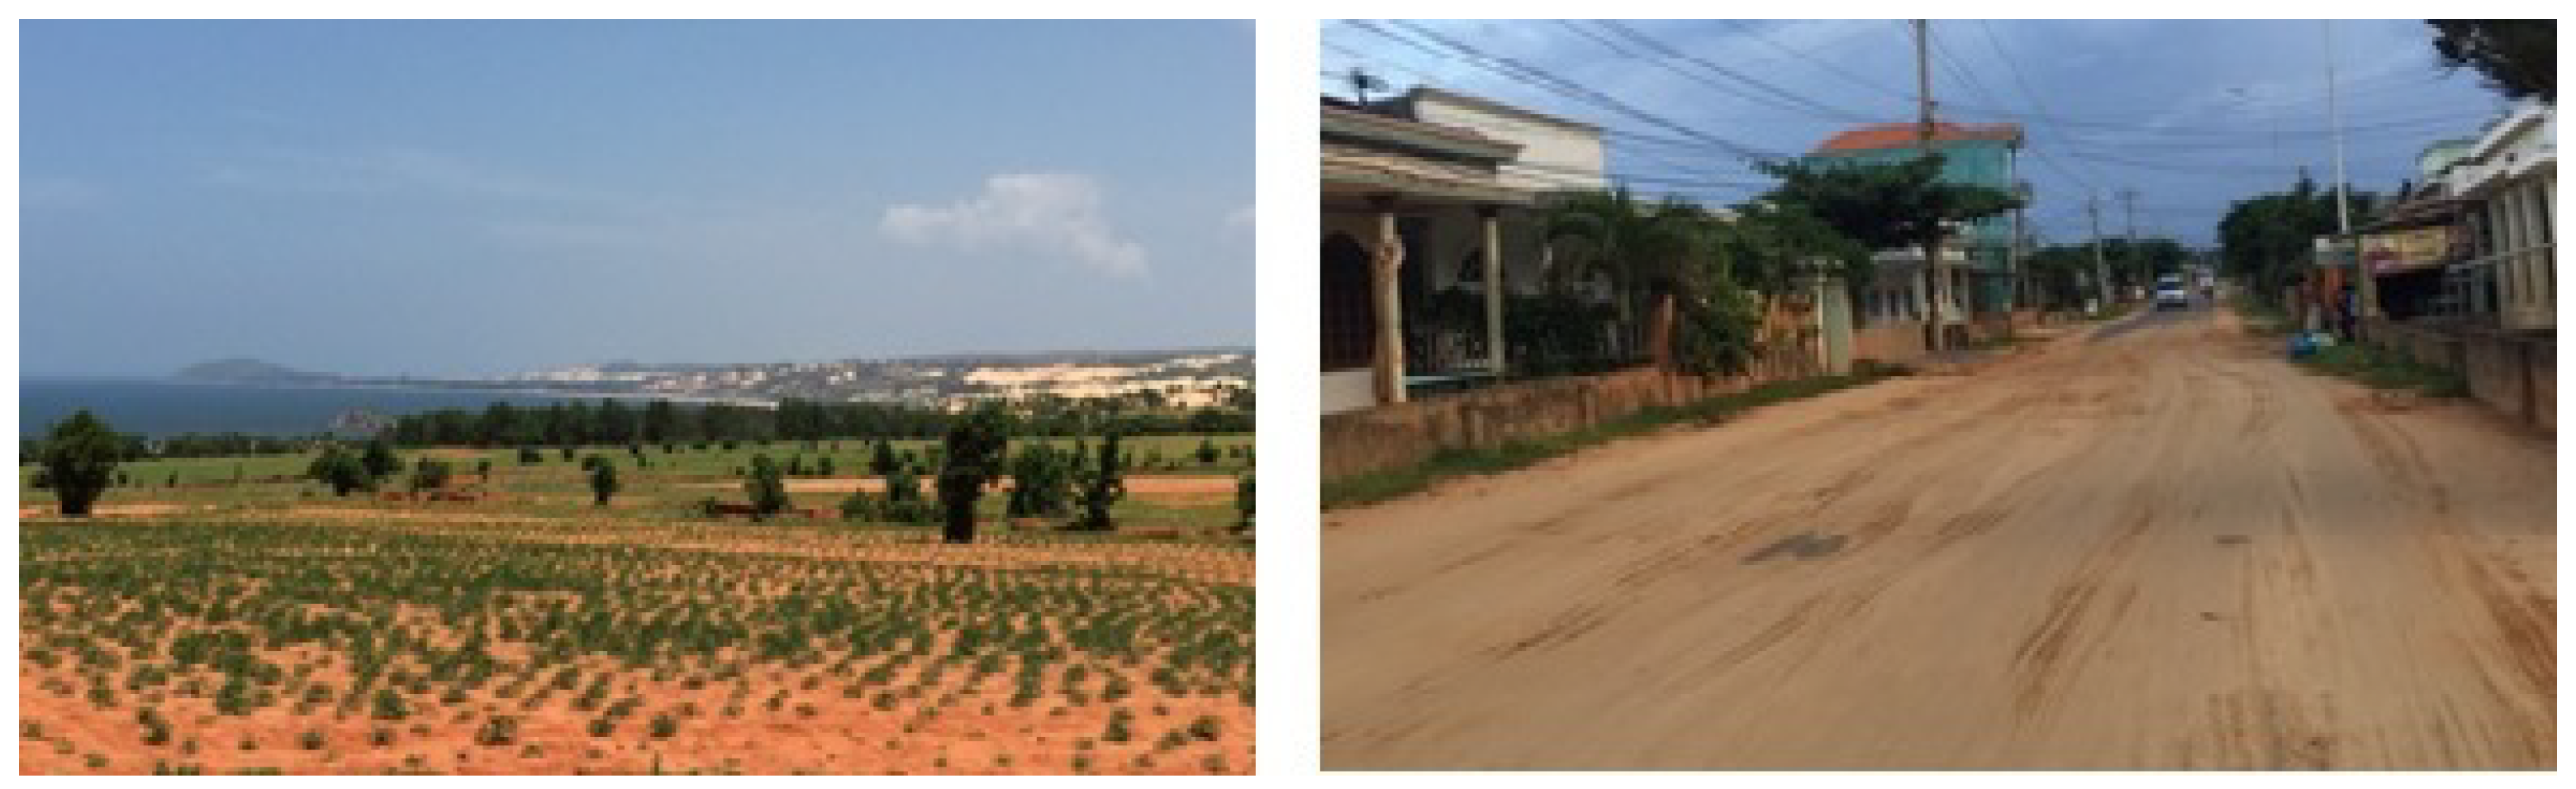
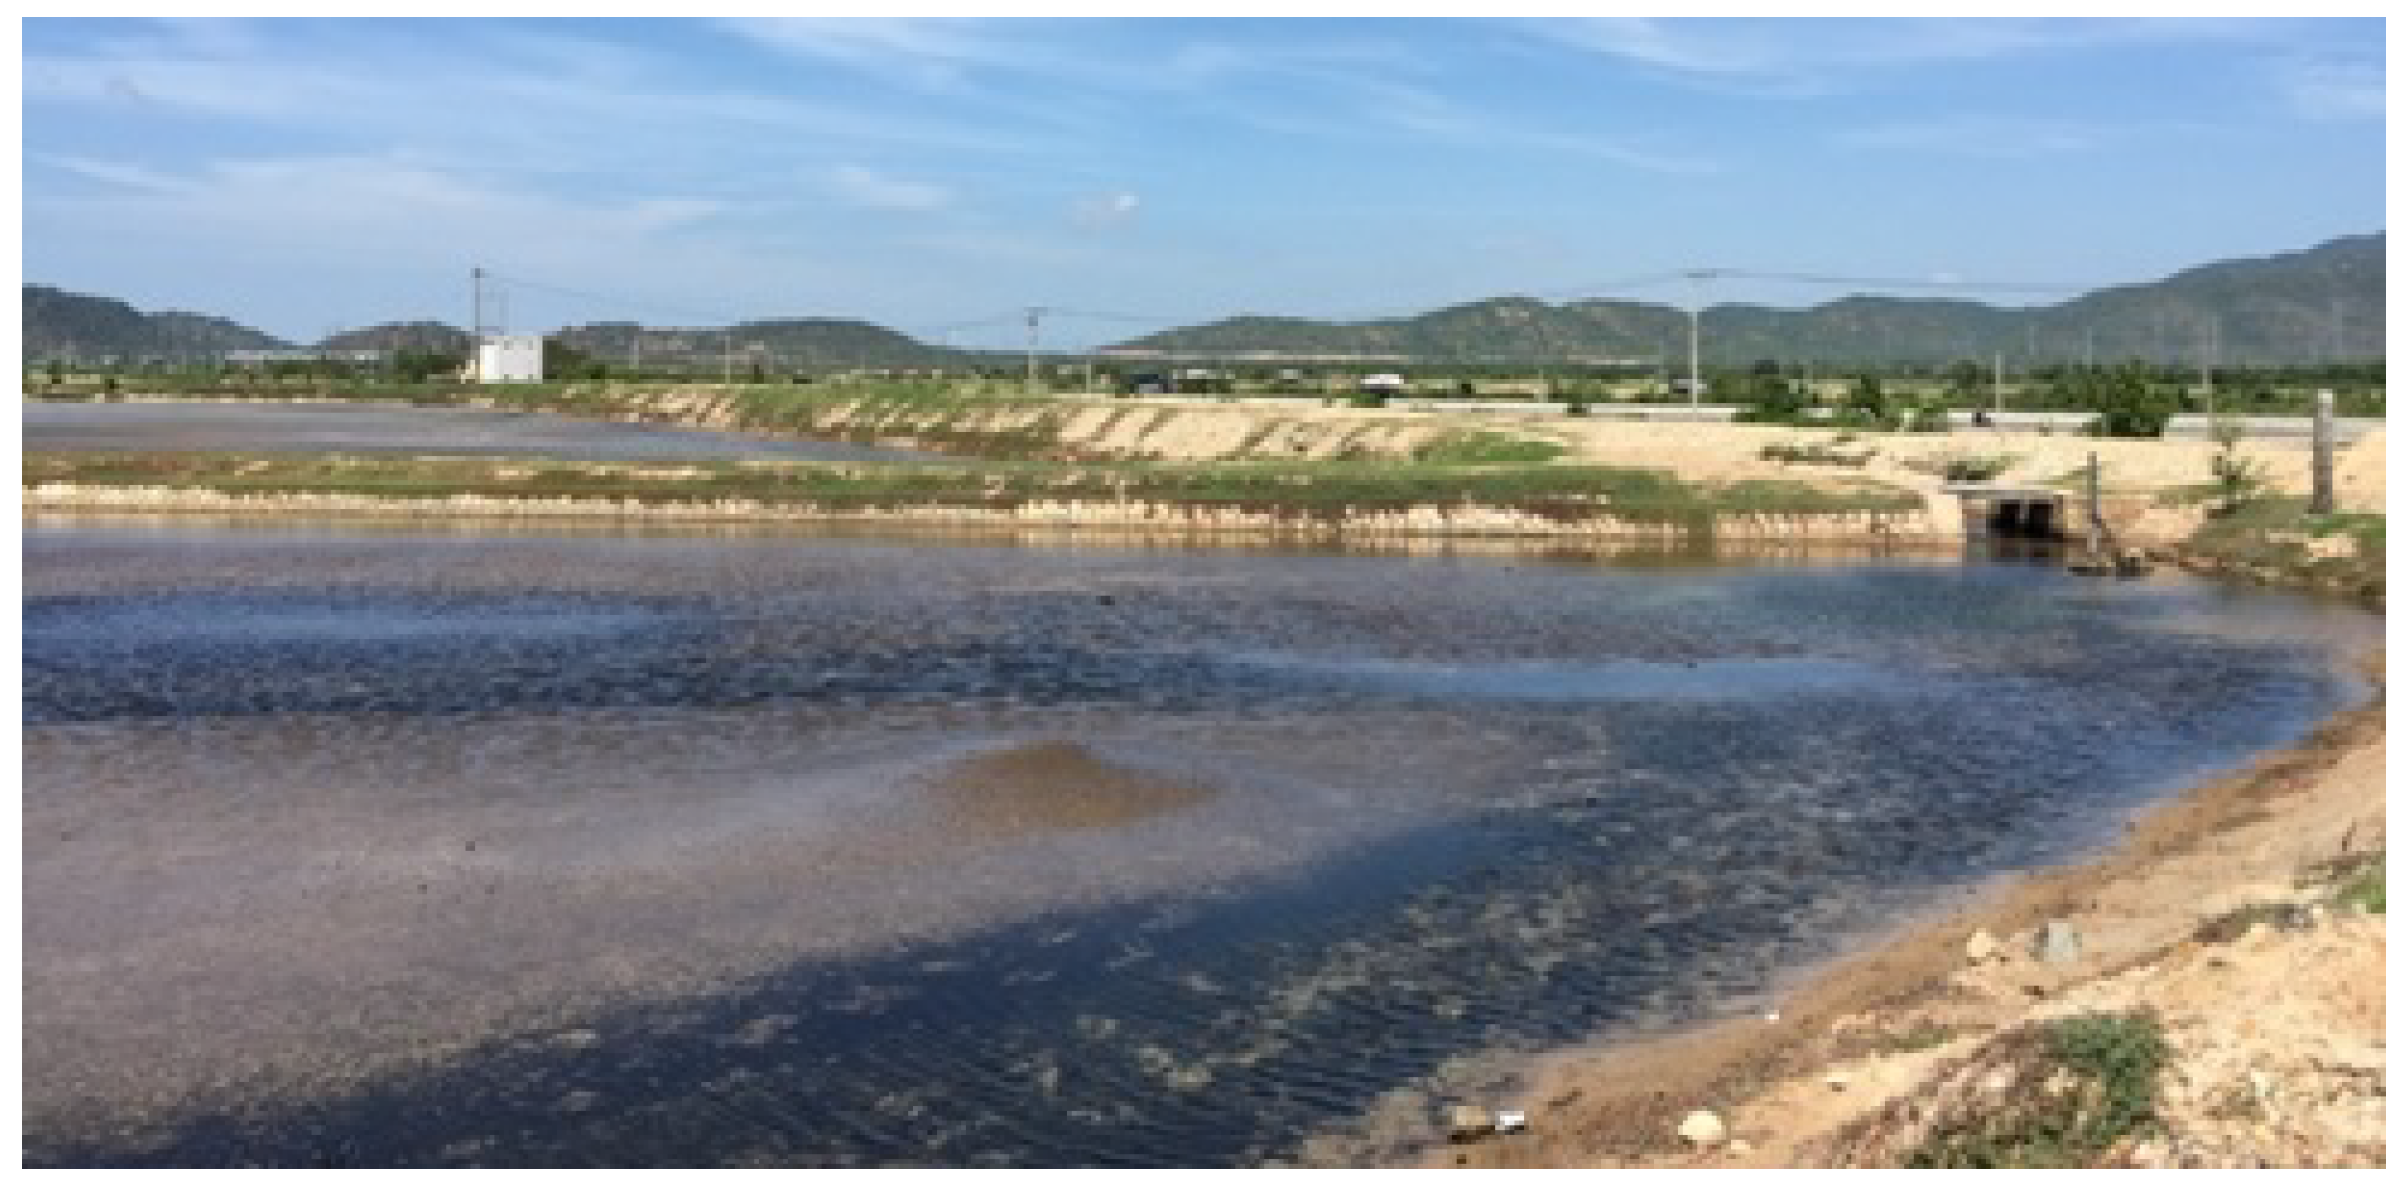
2.2. Agricultural Practicing During Drought Period
3. Materials and Methodologies
3.1. Datasets
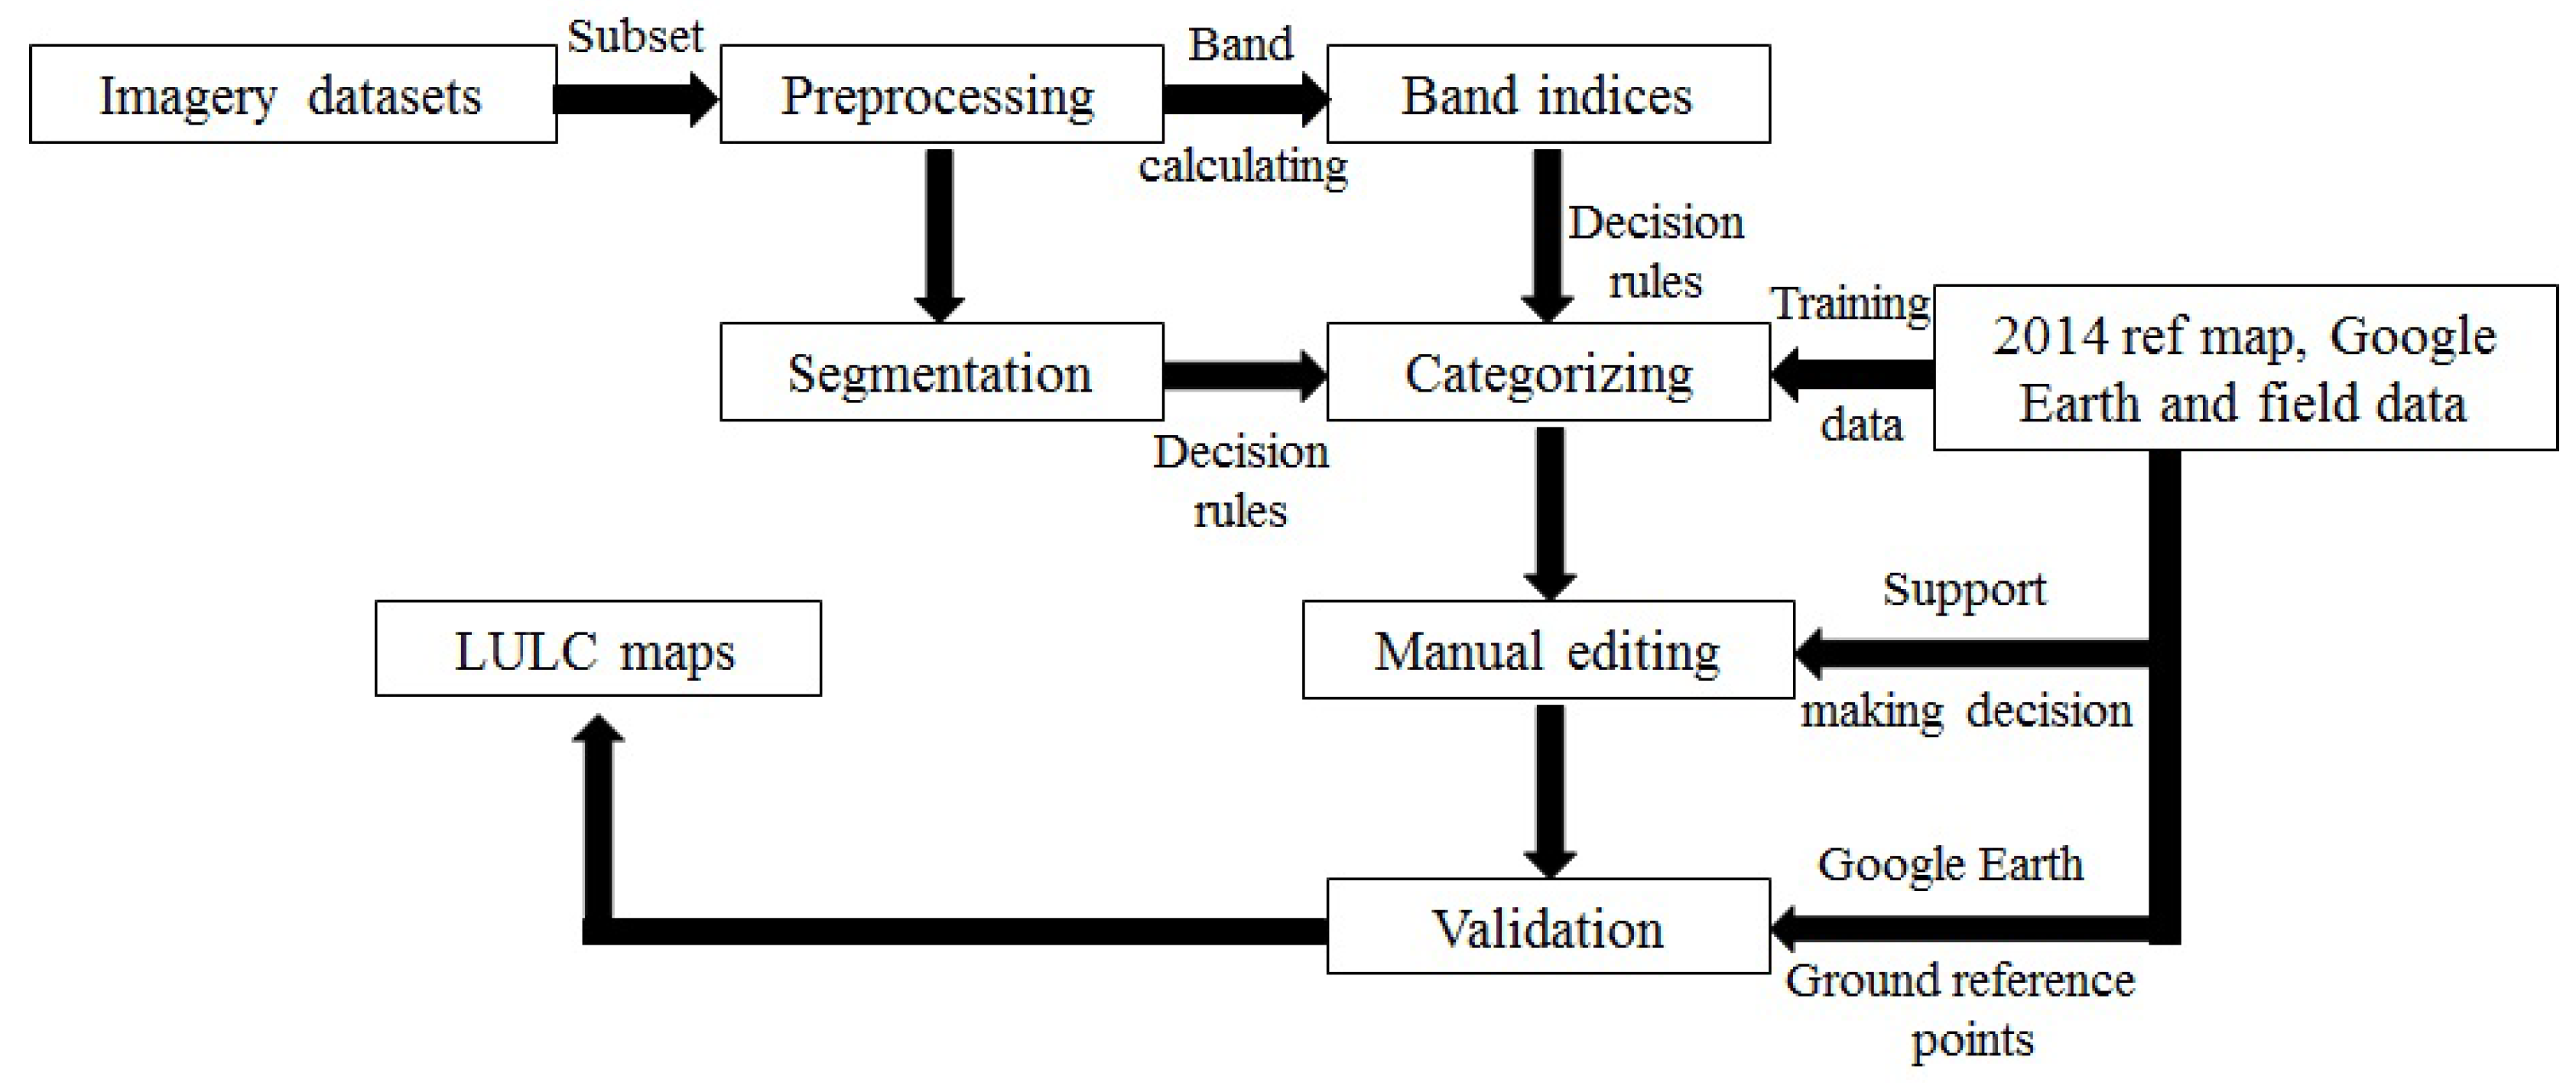
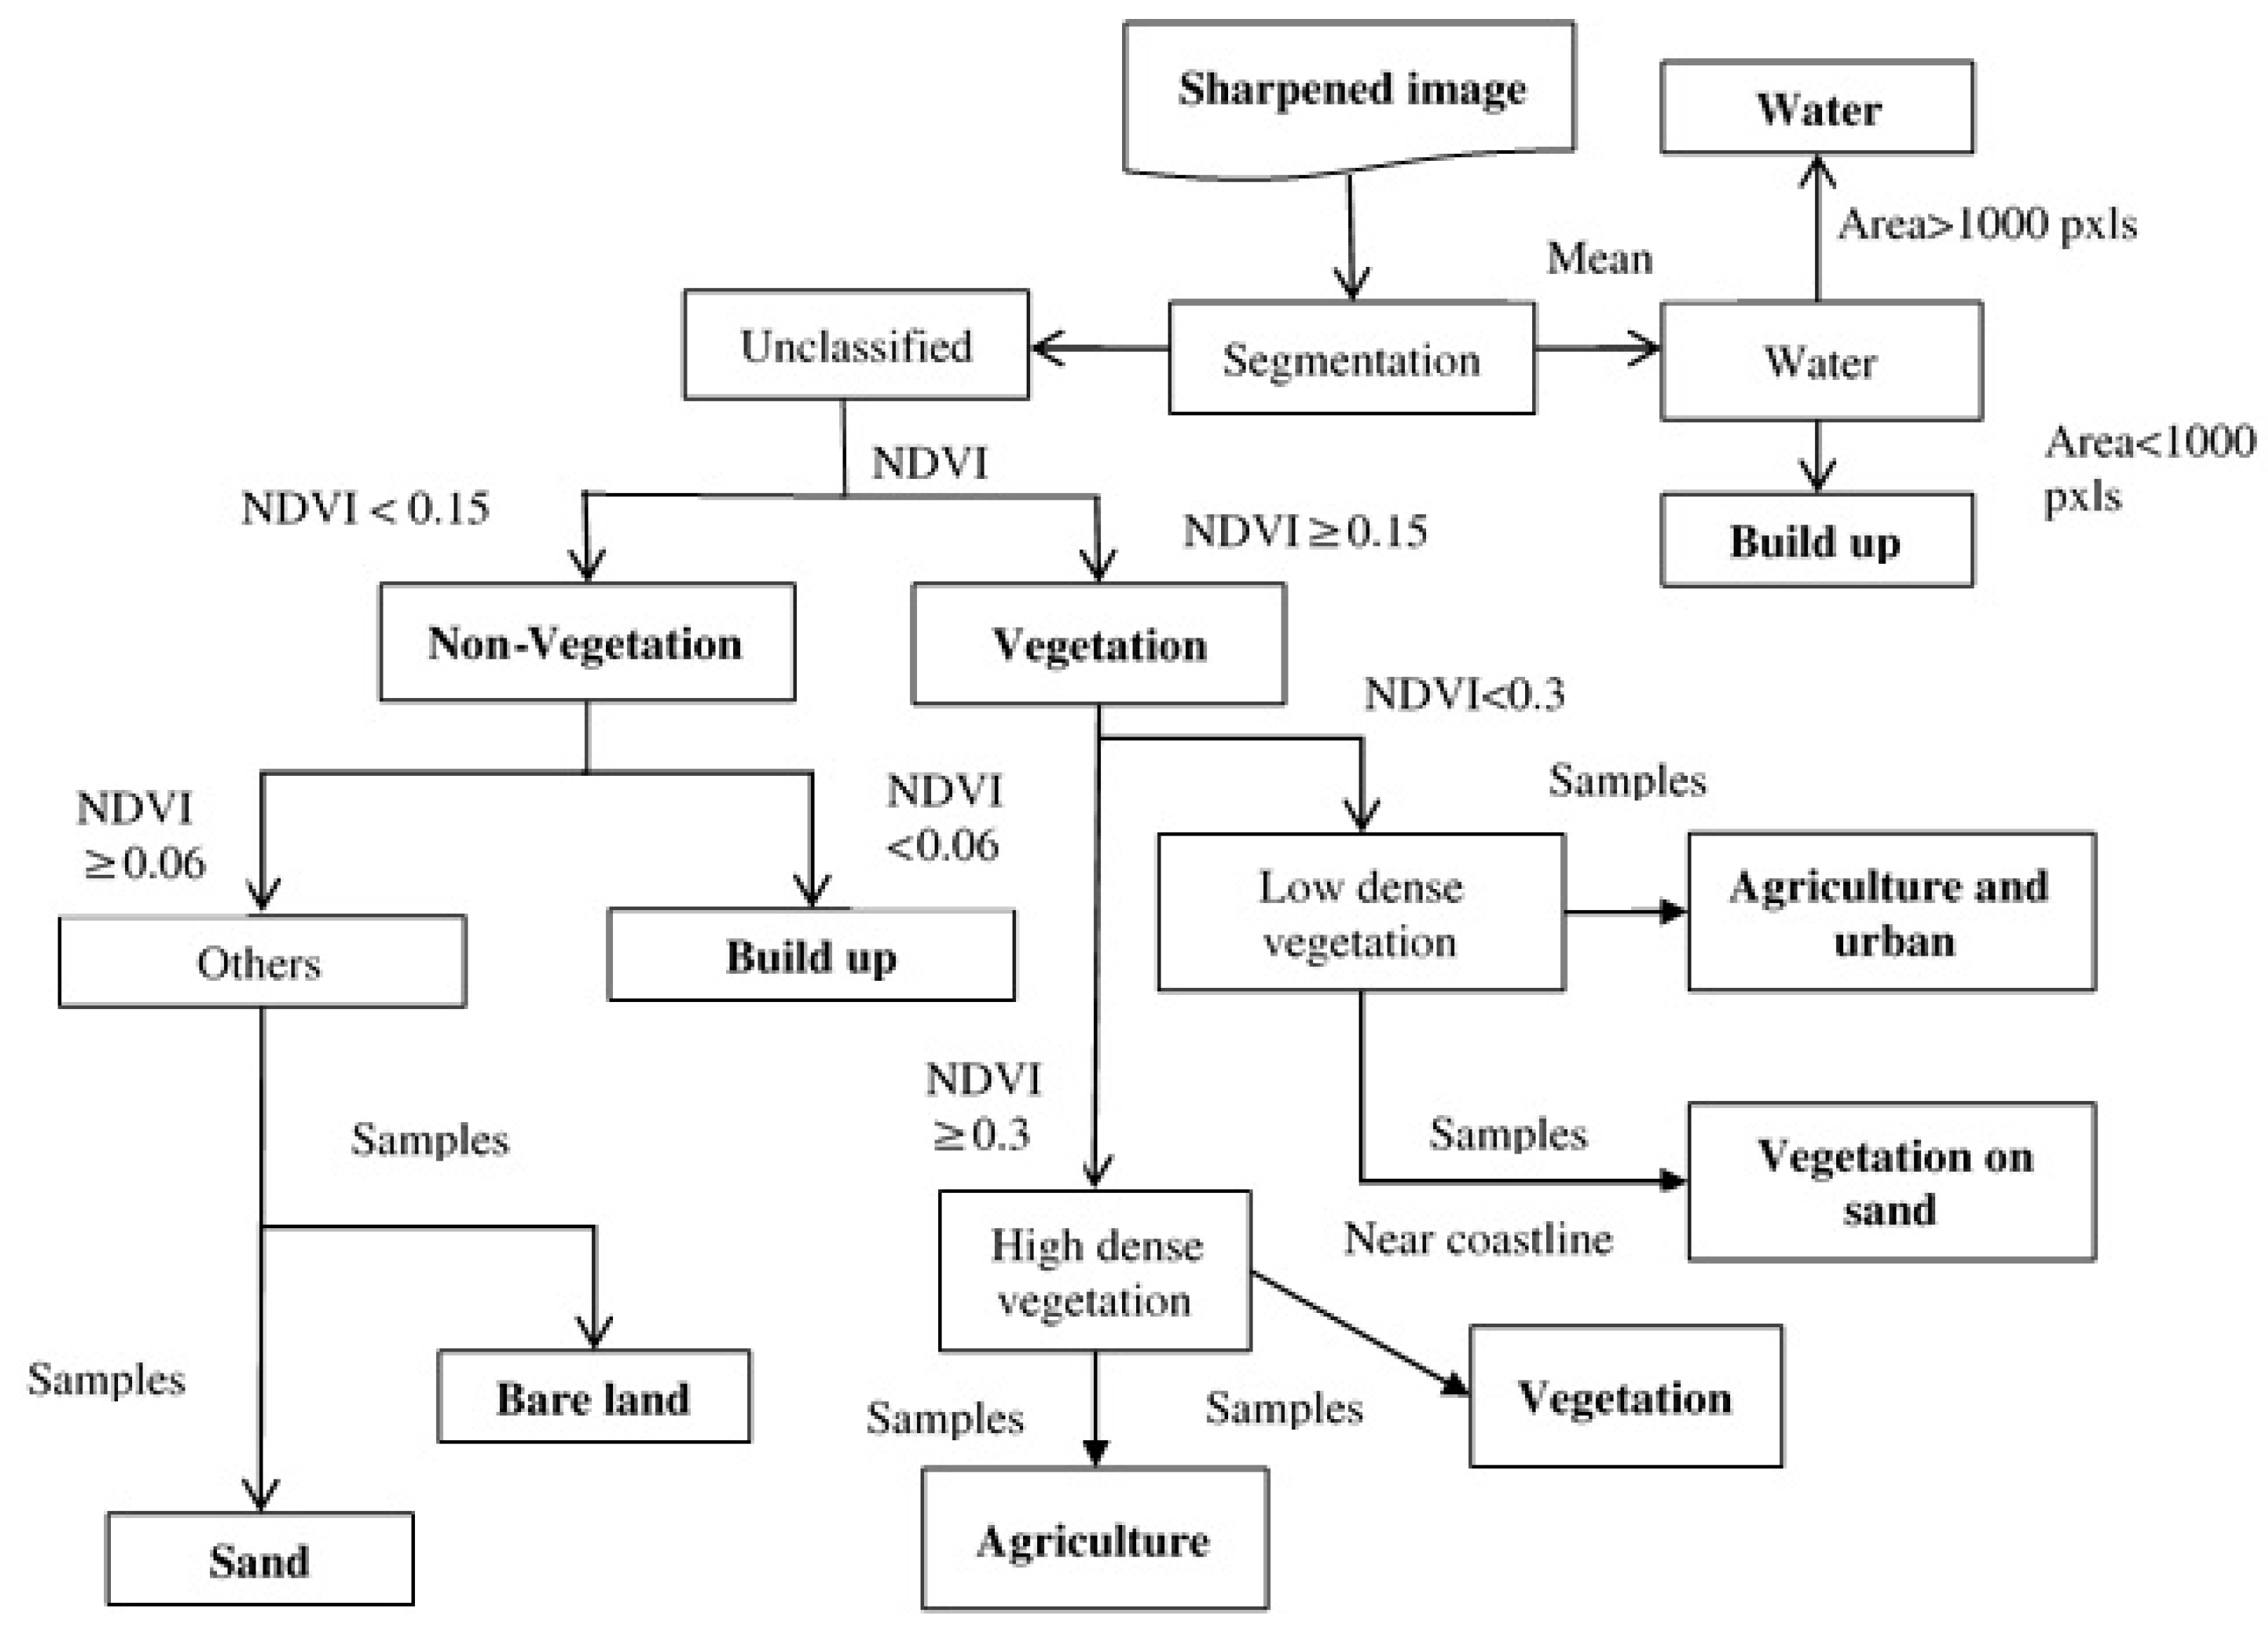
3.2. Image Analysis Procedures
3.3. Recommendations on Object-Based Classification Procedure
- Shadowed areas: On GeoEye 1 image, we observed shadows of vegetation and low buildings. In this circumstance, this shadow effect was not significant, so no further procedure was applied. However, if shadow effects are obvious (mainly in urban or forested areas), an object—spatial relationship (nearest neighbor, for instance) will be applied in the decision rules.
- Band indices: Using different band indices is a good approach to derive effective rules of decision tree to assign classes. It required less time to categorize classes on the Worldview2 image than the GeoEye1 one, especially when it is effective to differentiate roads from water layer. On images, road and water surfaces often appear as similar colors—dark blue. Nevertheless, these indices are quite sensitive, so in each case, the selected range of values of each index designated to each class are different. The image preprocessing step is very important before calculating band indices.
- Segmentation procedure: This procedure requires a lot of time, computer RAM storage, and analyst experience. Sub-divided regions that are too small or too large may increase processing time, or lead to missing data or mixed classes.
- Decision tree: Constructing rules for the decision tree to categorize objects into classes is very important, and obviously not an easy mission. Each object has its own typical characteristics, and shares some with others. The more indicators there are, the more supportive and successful decision rules are. However, there is another constraint of cost and time consumption.
- Subset images helps to save time to generate classified rules and decision trees. We divided the study area into three parts regarding the administrative boundary.
- Manual editing is a necessary step to approach a better result. A significant difference between object-based classification and supervised classification is the smallest object. A pixel is the smallest object in a supervised method, so “salt and pepper” errors exist on the classified image. An object that may cover at least 50 or 100 pixels, depending on segmentation methods is the smallest one in the object-based classification. Thus, it is easier to detect mis-classified objects on results, and bring them to their true class. Ecognition Developer software allows users to process segmentation, and manual editing very conveniently.
4. Results and Discussion
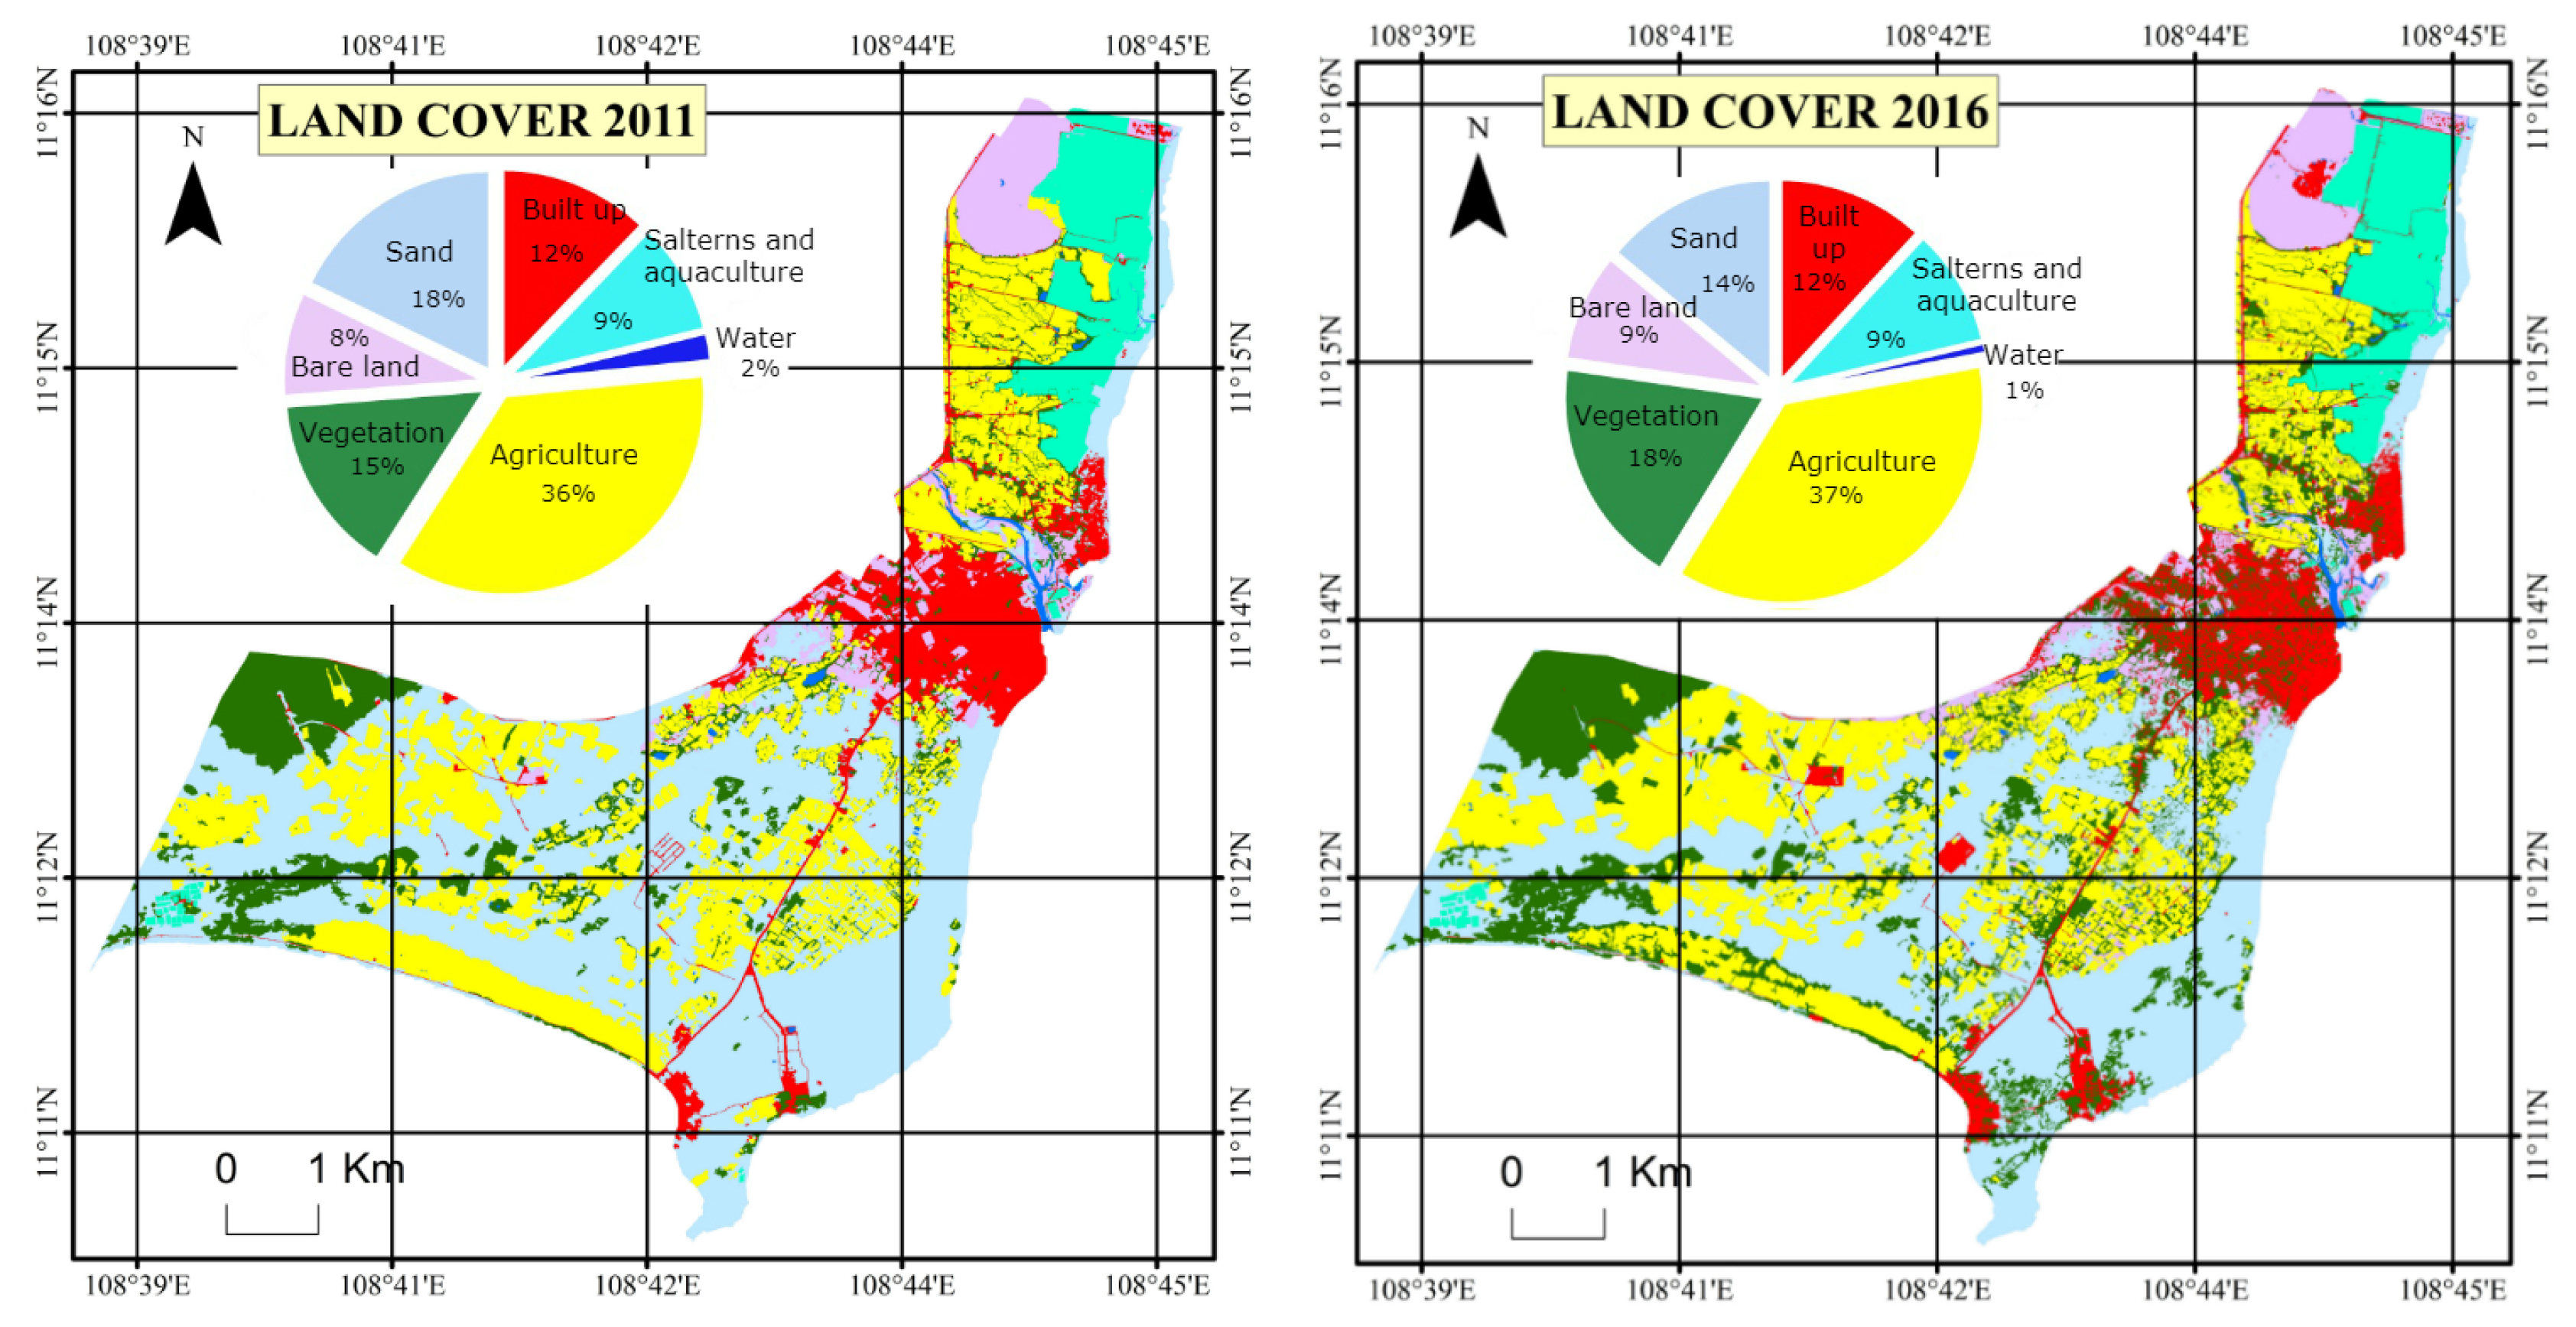
4.1. Land Use—Land Cover Classification
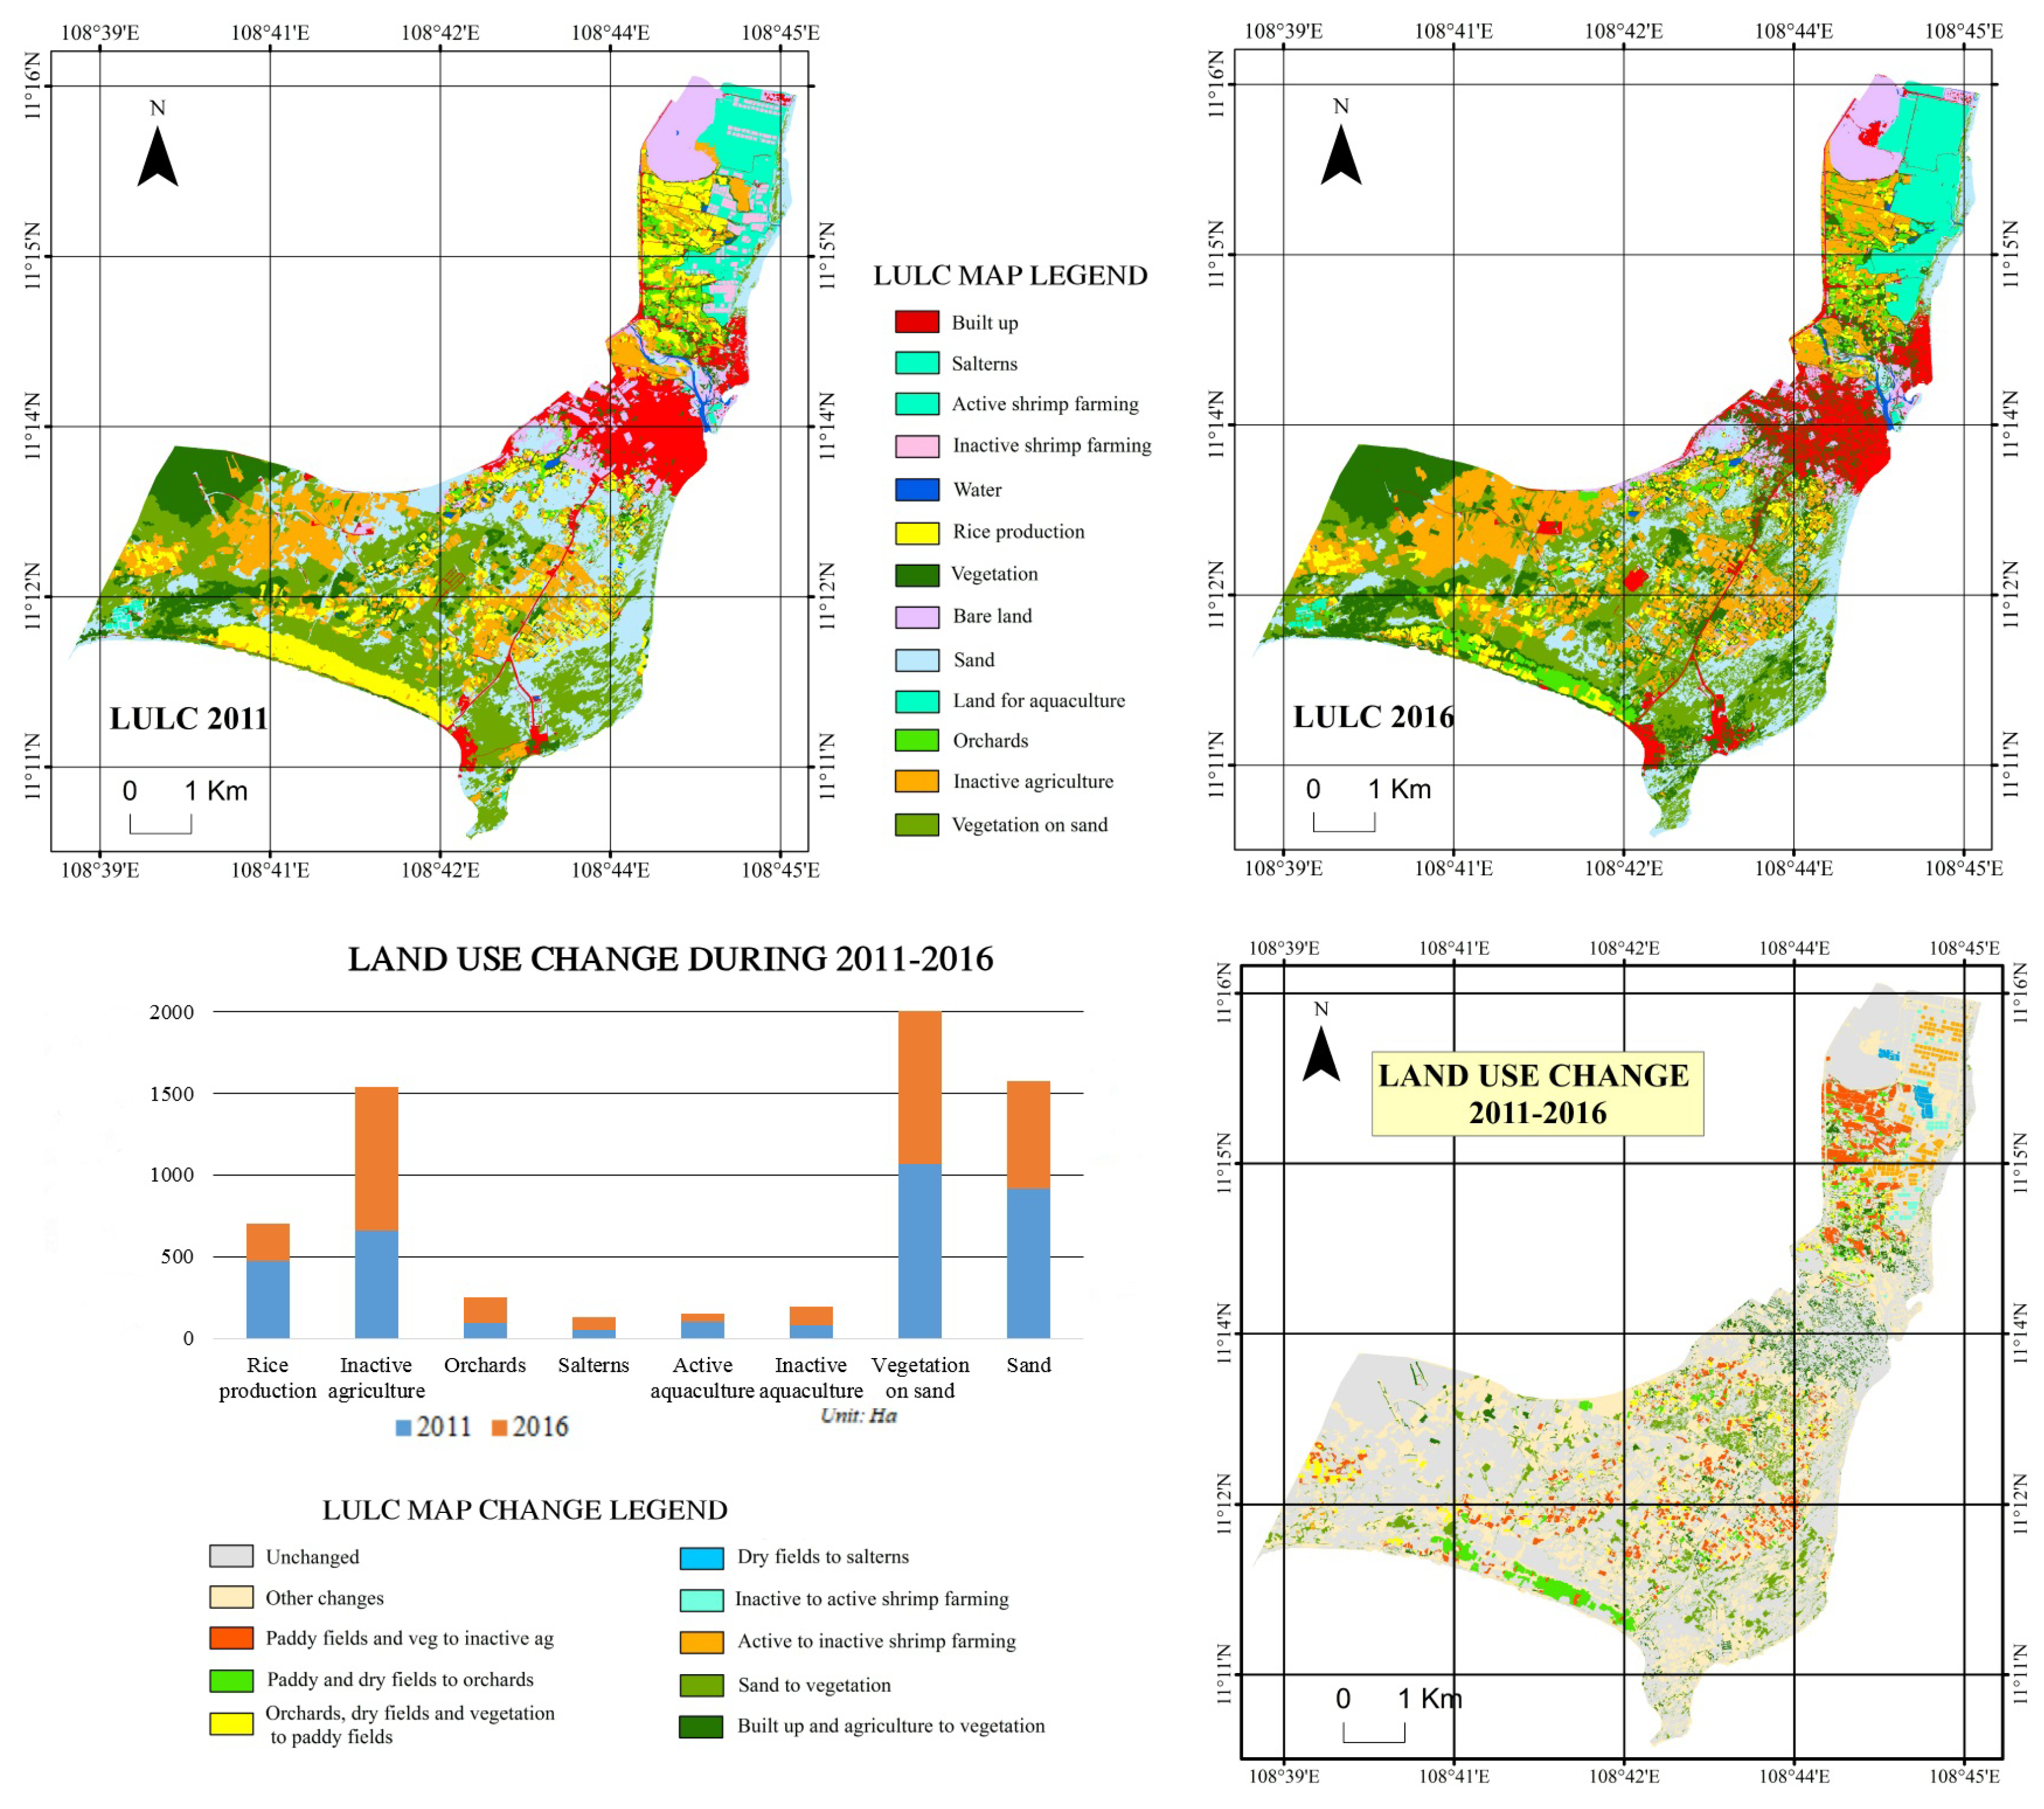
4.2. Overall Changes in LULC during 2011–2016
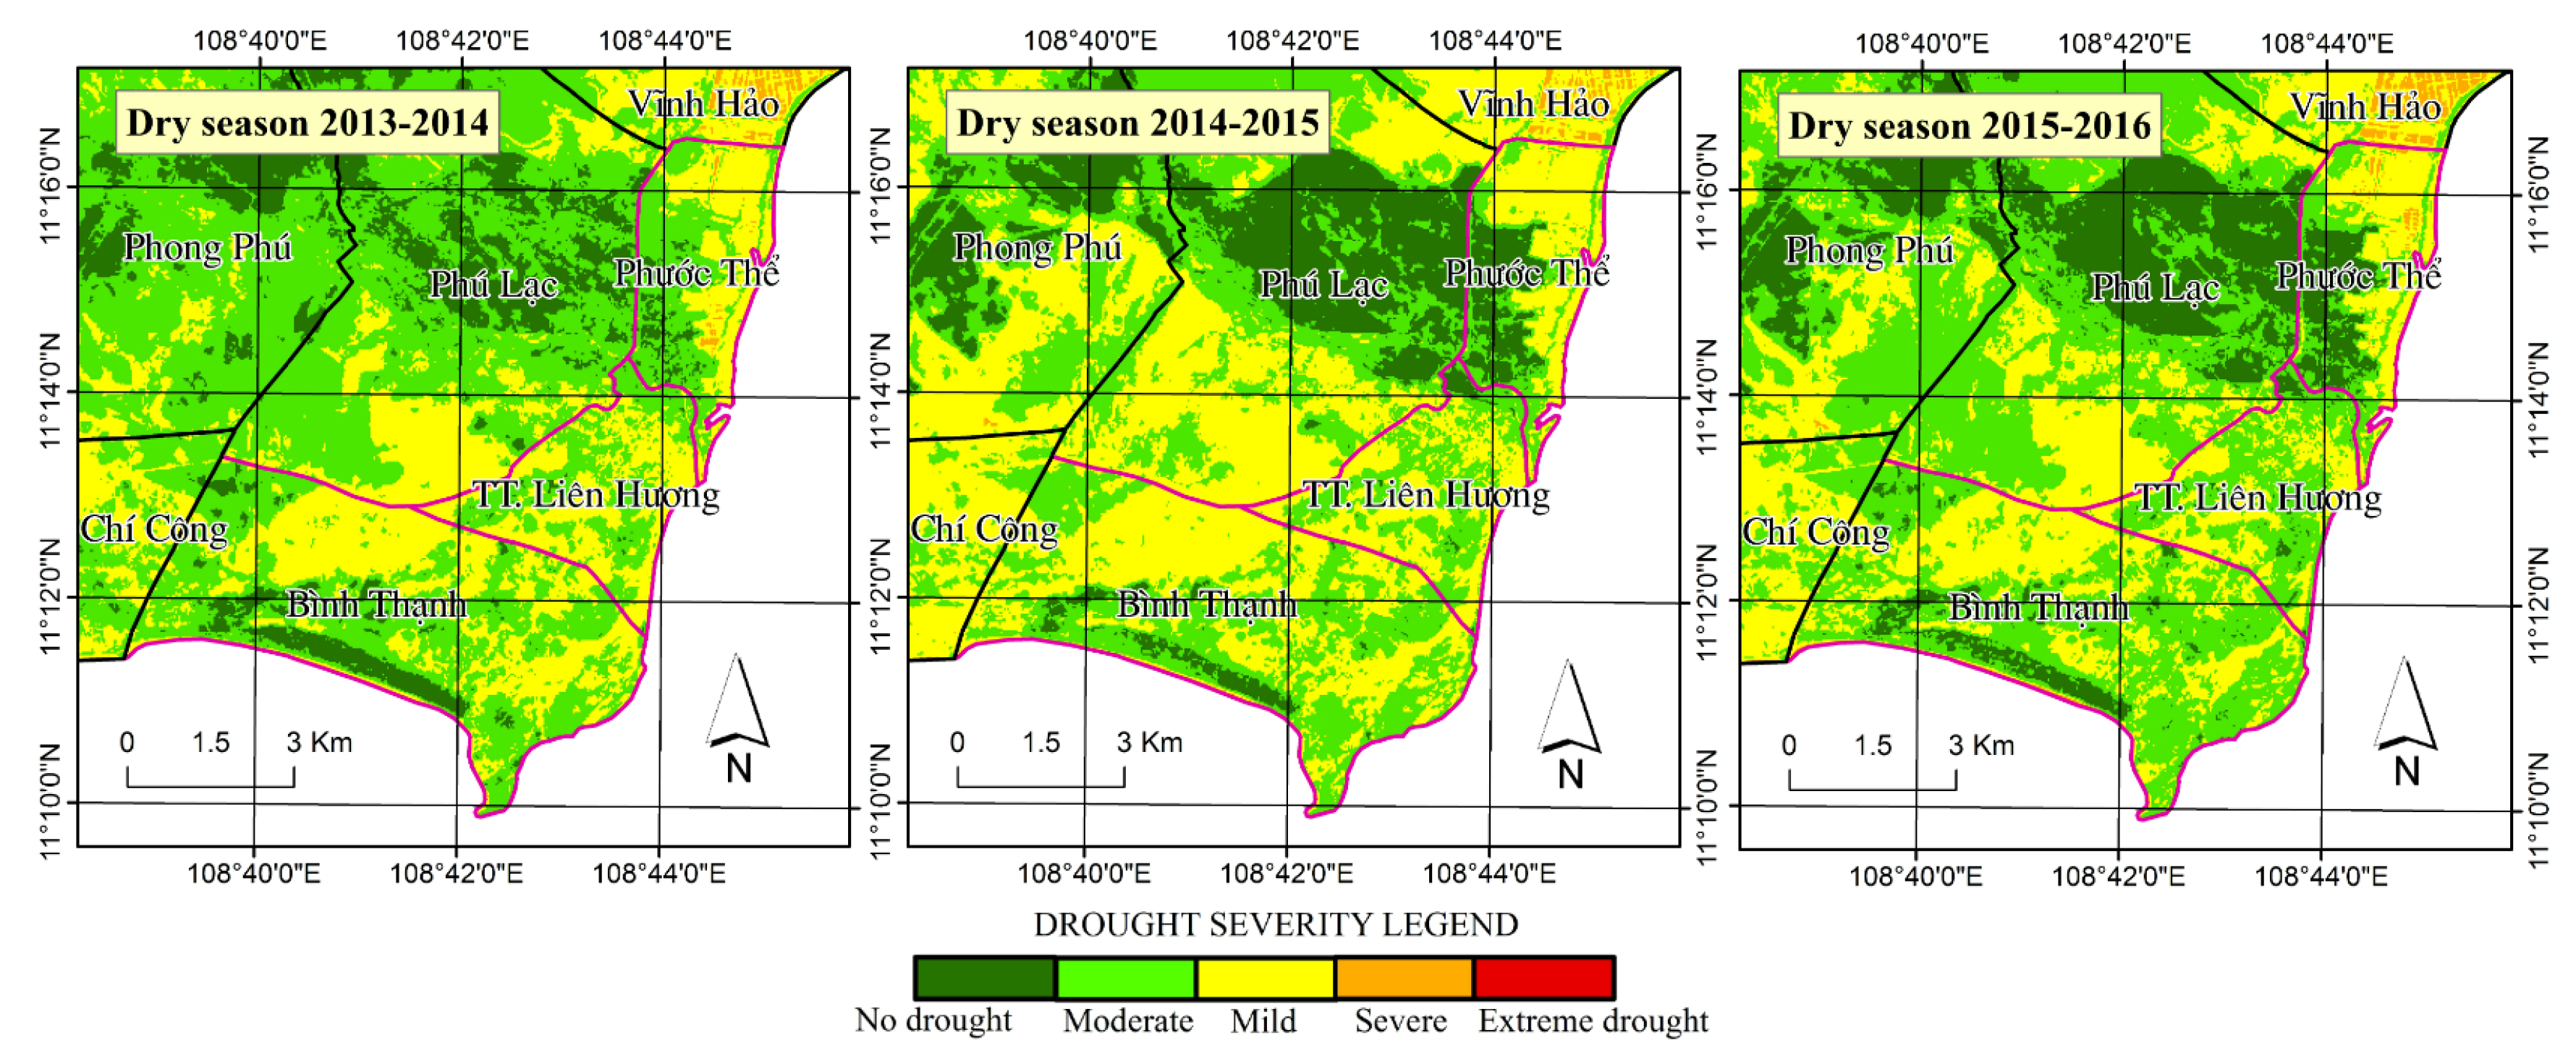
4.3. Impacts of Drought and Human on LULC Change during 2011–2016
4.3.1. Agricultural Land Transition
4.3.2. Salterns and Shrimp Farming
4.3.3. Vegetative Areas
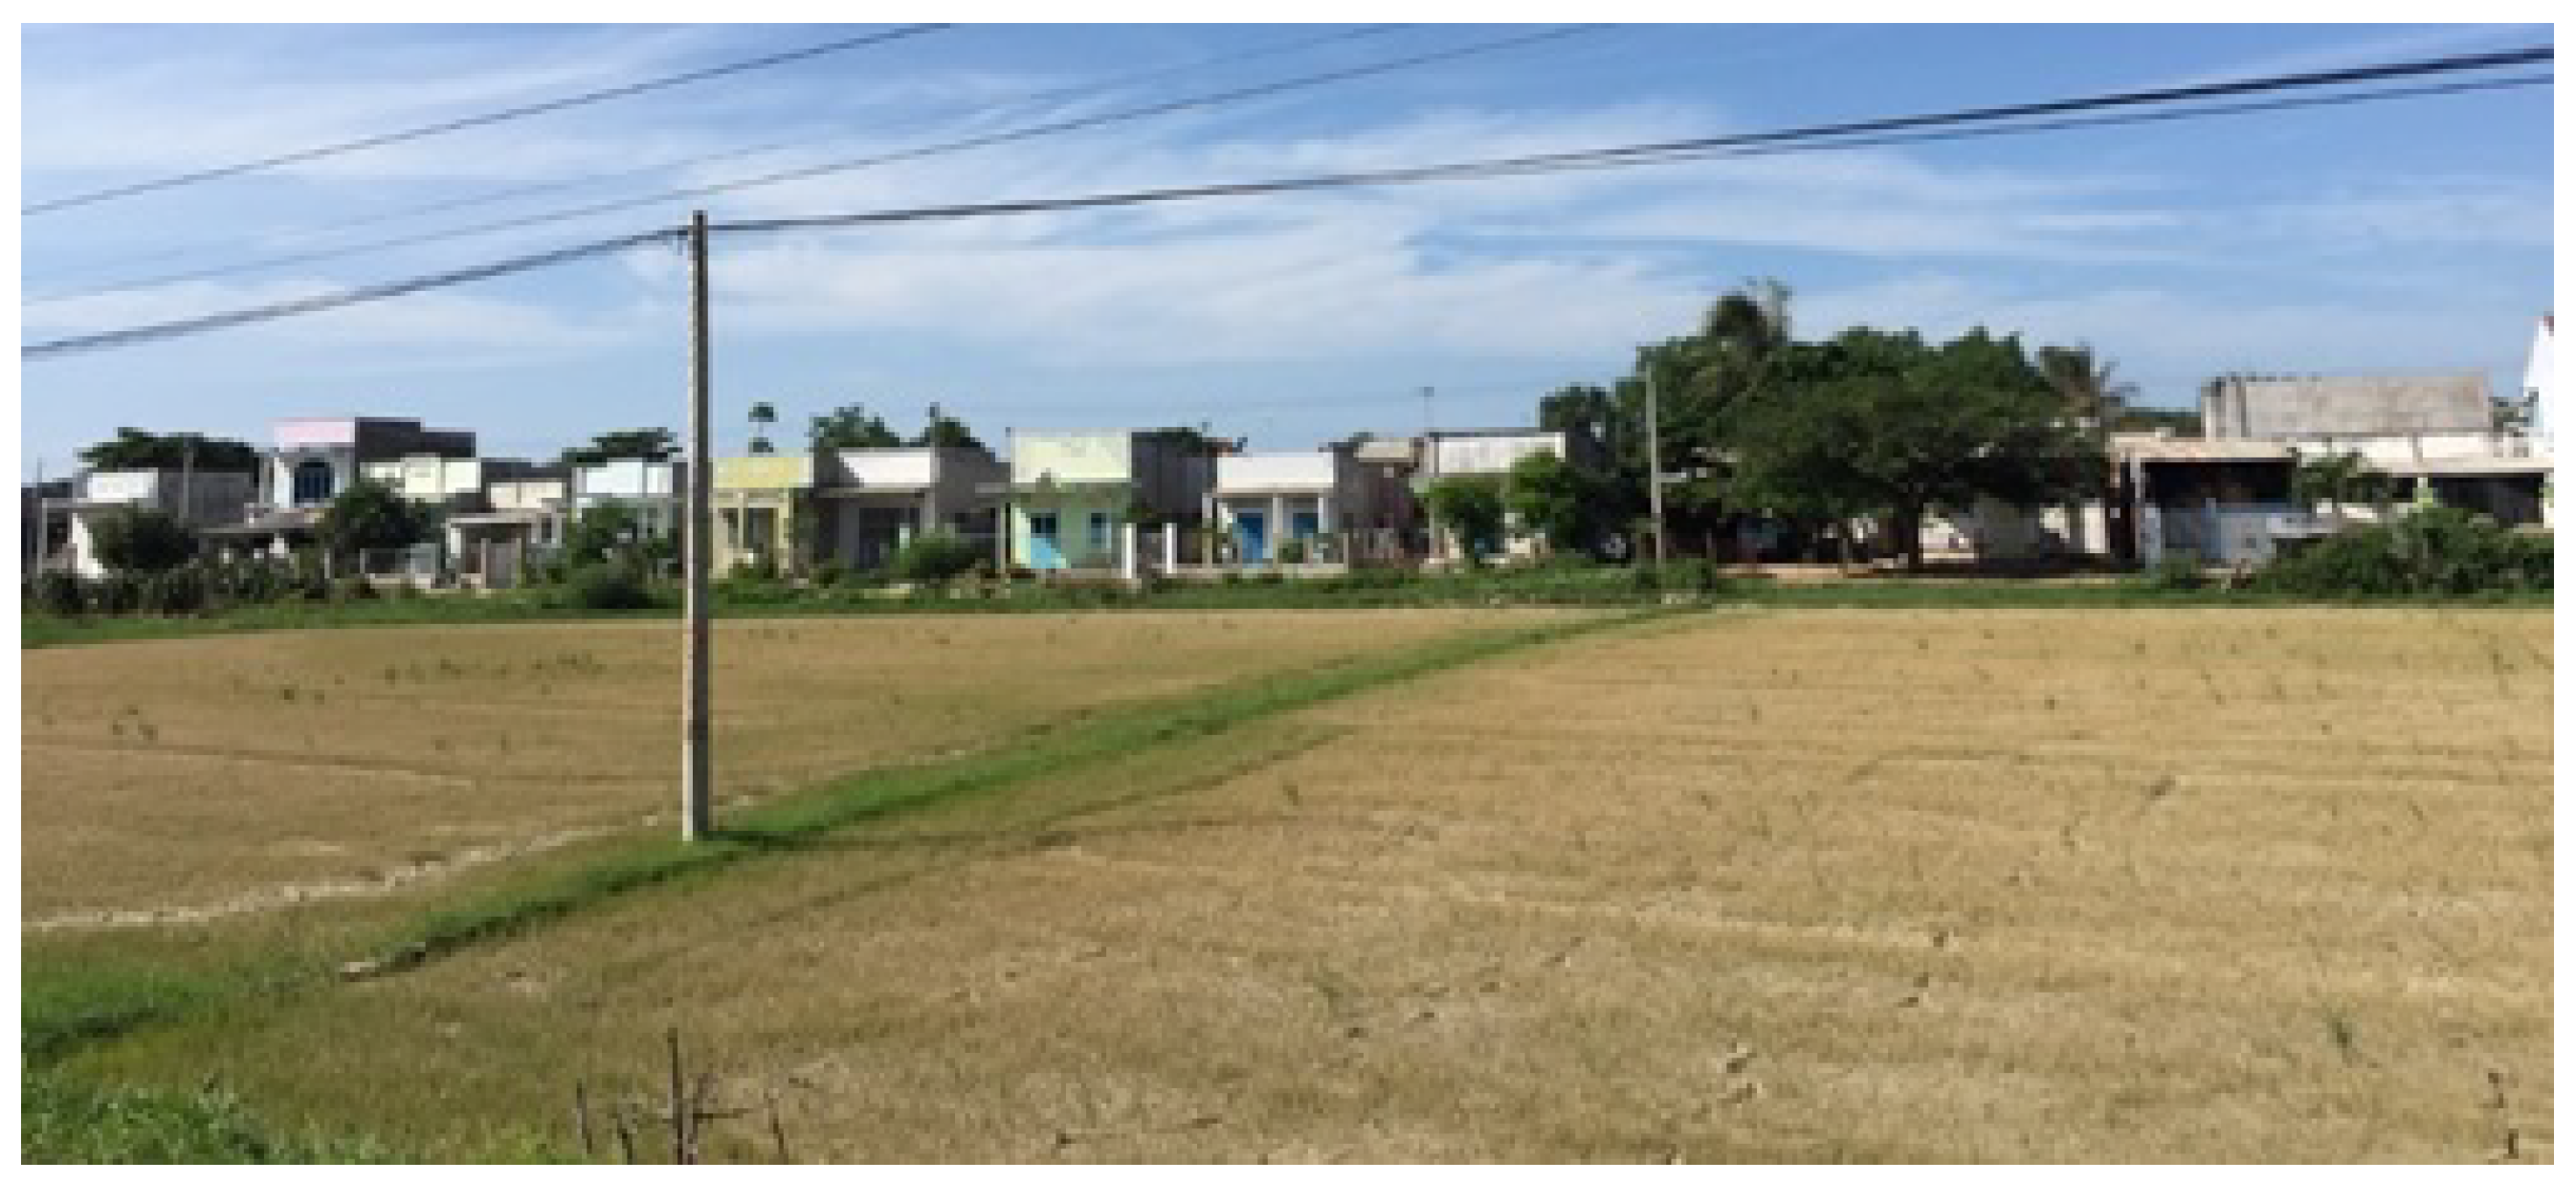
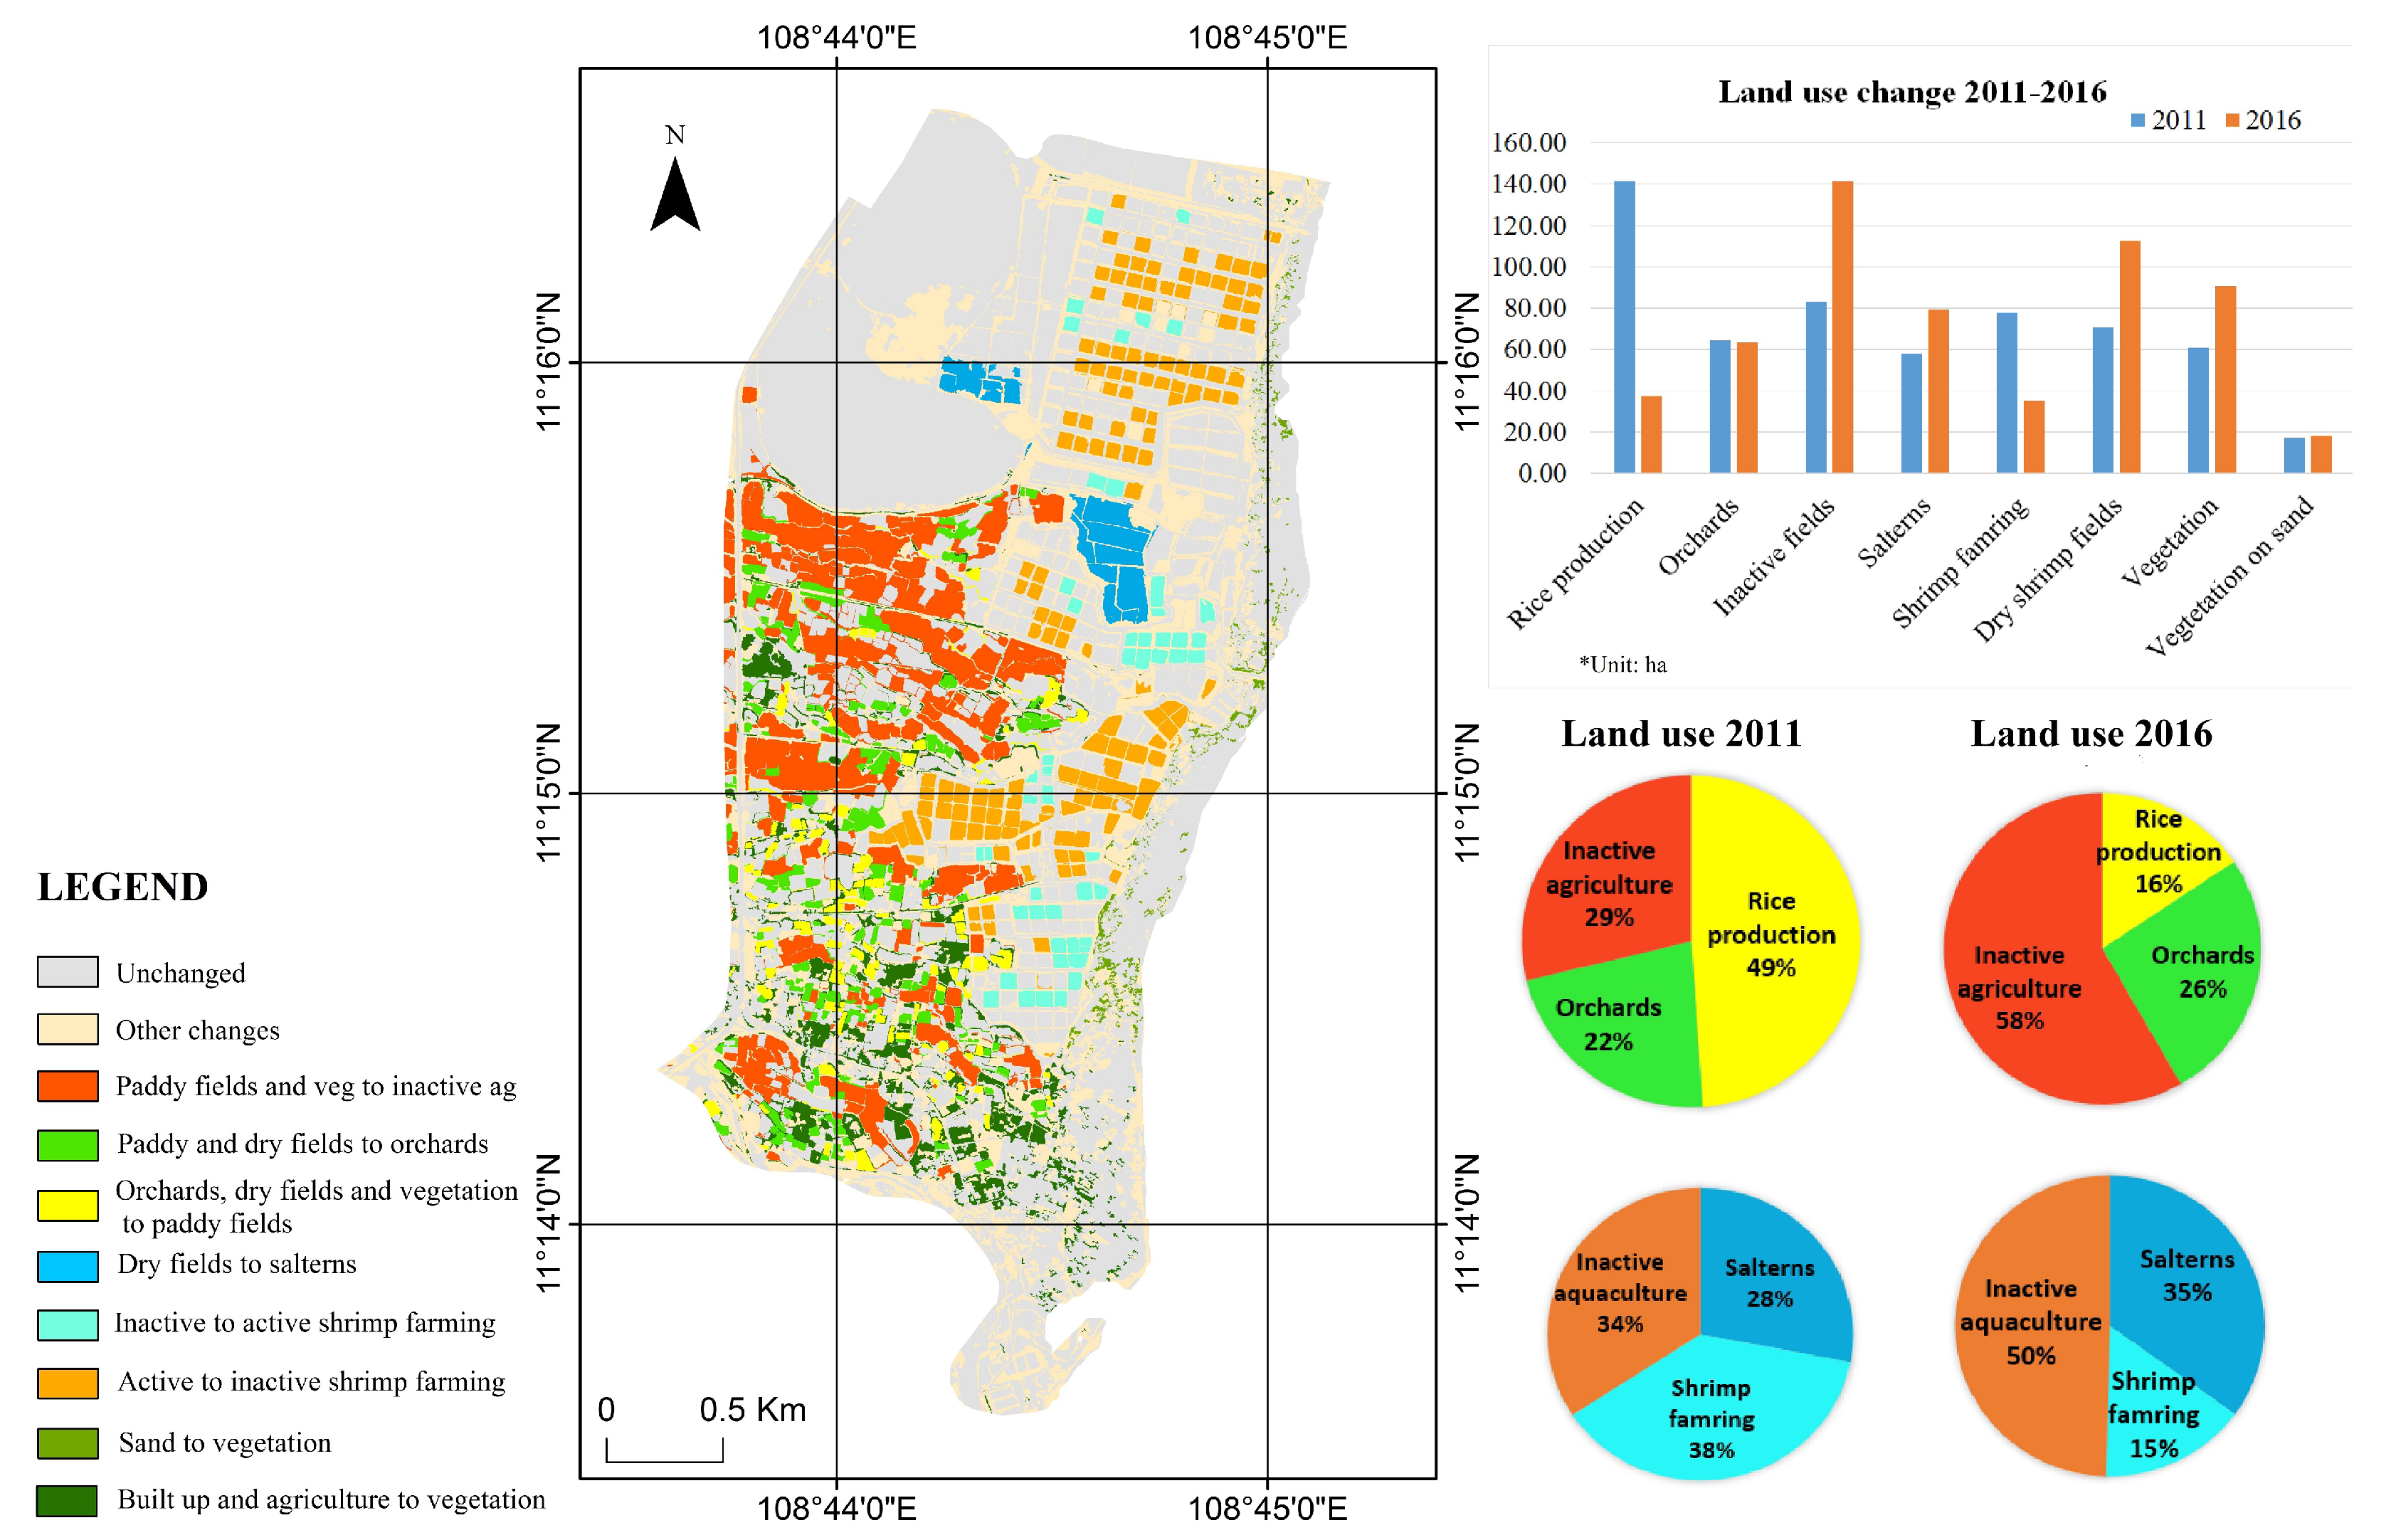
4.4. Agricultural Practicing in Phuoc The Commune
4.5. Limitations of the Study
5. Conclusions
- (1)
- During drought periods, surface water resources reduced by one fourth, resulting in water shortage for irrigated and rain-fed rice fields, and a slight increase of bare land (unused land);
- (2)
- To quantify impacts of drought, and water shortage on agricultural and aquacultural lands, we conducted a higher detailed image analysis; results showed a dramatic decrease of those land types (more than 50% and 44%, respectively). The extent of inactive agriculture and dry shrimp fields may promote land degradation, a spreading of sand into land, and desertification processes;
- (3)
- Assessing interaction of local residents and droughts on LULC change, we observed local efforts to alternate rice and dry field by orchards growing drought-tolerant plants, such as dragon fruit or pitayas. Those plants not only adapt the prolonged dry conditions of the study area, but also bring higher income. Additionally, local residents and authorities were also active in promoting LULC transitions by vegetating bare soil and sand with stabilizing covering crops. Vegetating and crop rotation are examples of adaptive methods to combat drought.
Author Contributions
Funding
Acknowledgments
Conflicts of Interest
Appendix A. Training Sample

| Land Types | Descriptions | Imagery Samples | |||||||
|---|---|---|---|---|---|---|---|---|---|
| Level 1 | Level 2 | Shape & distribution | Color | Indices | WV2 | GE1 | Ref img | ||
| 1 | Built up | 1 | Build up | Rectangle, dense, near main roads or coastlines. | White or light blue or red rooftops. | NDWI NHFD |  *1:5000 |  |  |
| 2 | Salterns and shrimp farming | 2 | Salterns certain size. | Rectangle, but white or brown. | Blue, dark blue NDWI | NDVI |  |  |  |
 |  |  | |||||||
| 3 | Active shrimp farming | Square, certain size. 65 by 65 m. | Blue, dark blue. | NDVI |  *1:10 000 |  |  | ||
| 4 | Inactive shrimp farming | Square, certain size 65 by 65 m. | Tan, brown, white. | NDSI |  |  |  | ||
| 10 | Others land for aquaculture | Routes or rectangle. | Brown, tan. | NDSI |  *1:5000 |  |  | ||
| 3 | Water | 5 | Water | Undefined shape. | Dark blue or green. | NDVI |  |  |  |
| 4 | Agriculture | 6 | Rice production | Undefined shape, smooth surface. | Dark to light green (natural color). | NDVI |  |  |  |
| Dark to bright red (false color). |  |  | |||||||
| 11 | Orchards | Rectangle, rows and columns, mixed with built up. | Green and/or mixing brown as soil background. | NDVI |  |  |  | ||
| 12 | Inactive agriculture | Rectangle or undefined shape. | Brown, tan with some greenness | NDSI |  |  |  | ||
 |  |  | |||||||
| 5 | Vegetation | 7 | Vegetation | Undefined shape, narrow like borders. | Green to dark green | NDVI |  |  |  |
| 6 | Bare land | 8 | Bare land | Undefined shape, no or very spare vegetation. | Brown, tan, some greenness. | NDSI |  |  |  |
| 7 | Sand | 9 | Sand | Undefined shape, near coastlines, or dried fields. | Yellow or white, tan, some greyness. | NDVI |  |  |  |
 |  |  | |||||||
| 13 | Vegetation on sand | Undefined shape, near coastlines. | Green | NDVI |  |  |  | ||
Appendix B. Land Use Change in Phuoc The community
| 2016 | 1 | 2 | 3 | 4 | 5 | 6 | 7 | 8 | 9 | 10 | 11 | 12 | 13 | |
|---|---|---|---|---|---|---|---|---|---|---|---|---|---|---|
| 2011 | ||||||||||||||
| 1 | 46.95 | 0.65 | 0.01 | 0.03 | 0.49 | 0.48 | 11.92 | 7.09 | 0.9 | 1.35 | 1.90 | 2.04 | 0.69 | |
| 2 | 0.72 | 47.91 | 1.13 | 1.71 | 0.41 | 0.02 | 0.46 | 1.178 | 0.1 | 2.62 | 0.9 | 0.04 | 0.11 | |
| 3 | 0.26 | 0.9 | 10.01 | 53.89 | 0.06 | 0 | 0.96 | 0.54 | 0.04 | 9.97 | 0 | 0.11 | 0.15 | |
| 4 | 0.22 | 0 | 18.28 | 39 | 0.02 | 0 | 0.79 | 0.25 | 0.15 | 12.01 | 0 | 0.01 | 0.05 | |
| 5 | 0.35 | 0.09 | 0.02 | 0.04 | 6.9 | 0.22 | 2.41 | 1.8 | 0.13 | 0.38 | 0.06 | 0.23 | 0.12 | |
| 6 | 2.39 | 0.21 | 2 | 0.05 | 0.008 | 18.8 | 11.44 | 2.55 | 0 | 0.12 | 15.77 | 89.69 | 0 | |
| 7 | 6.68 | 0.89 | 0.27 | 0.73 | 0.52 | 3.46 | 25.16 | 6.15 | 0.02 | 2.02 | 5.74 | 9.1 | 0.06 | |
| 8 | 16.12 | 1.3 | 0.11 | 0.04 | 1.97 | 0.32 | 5.46 | 140.0 | 2.62 | 0.31 | 0.72 | 1.43 | 0.44 | |
| 9 | 6.88 | 0.36 | 0.26 | 0.12 | 0.41 | 0 | 1.22 | 1.29 | 47.5 | 0.85 | 0.02 | 0.04 | 5.94 | |
| 10 | 3.86 | 11.06 | 4.047 | 16.38 | 0.42 | 0 | 2.27 | 3.16 | 0.52 | 38.79 | 0.01 | 0.02 | 0.89 | |
| 11 | 2.65 | 0 | 0 | 0.02 | 0 | 8.08 | 20.04 | 2.12 | 0 | 0.03 | 26.51 | 5.12 | 0 | |
| 12 | 1.83 | 15.05 | 0.66 | 0.76 | 0.02 | 6.42 | 7.79 | 4.18 | 0 | 1.02 | 11.89 | 33.46 | 0 | |
| 13 | 0.52 | 0.05 | 0.09 | 0.04 | 0.11 | 0 | 0.67 | 0.15 | 5.77 | 0.17 | 0 | 0.02 | 9.7 | |
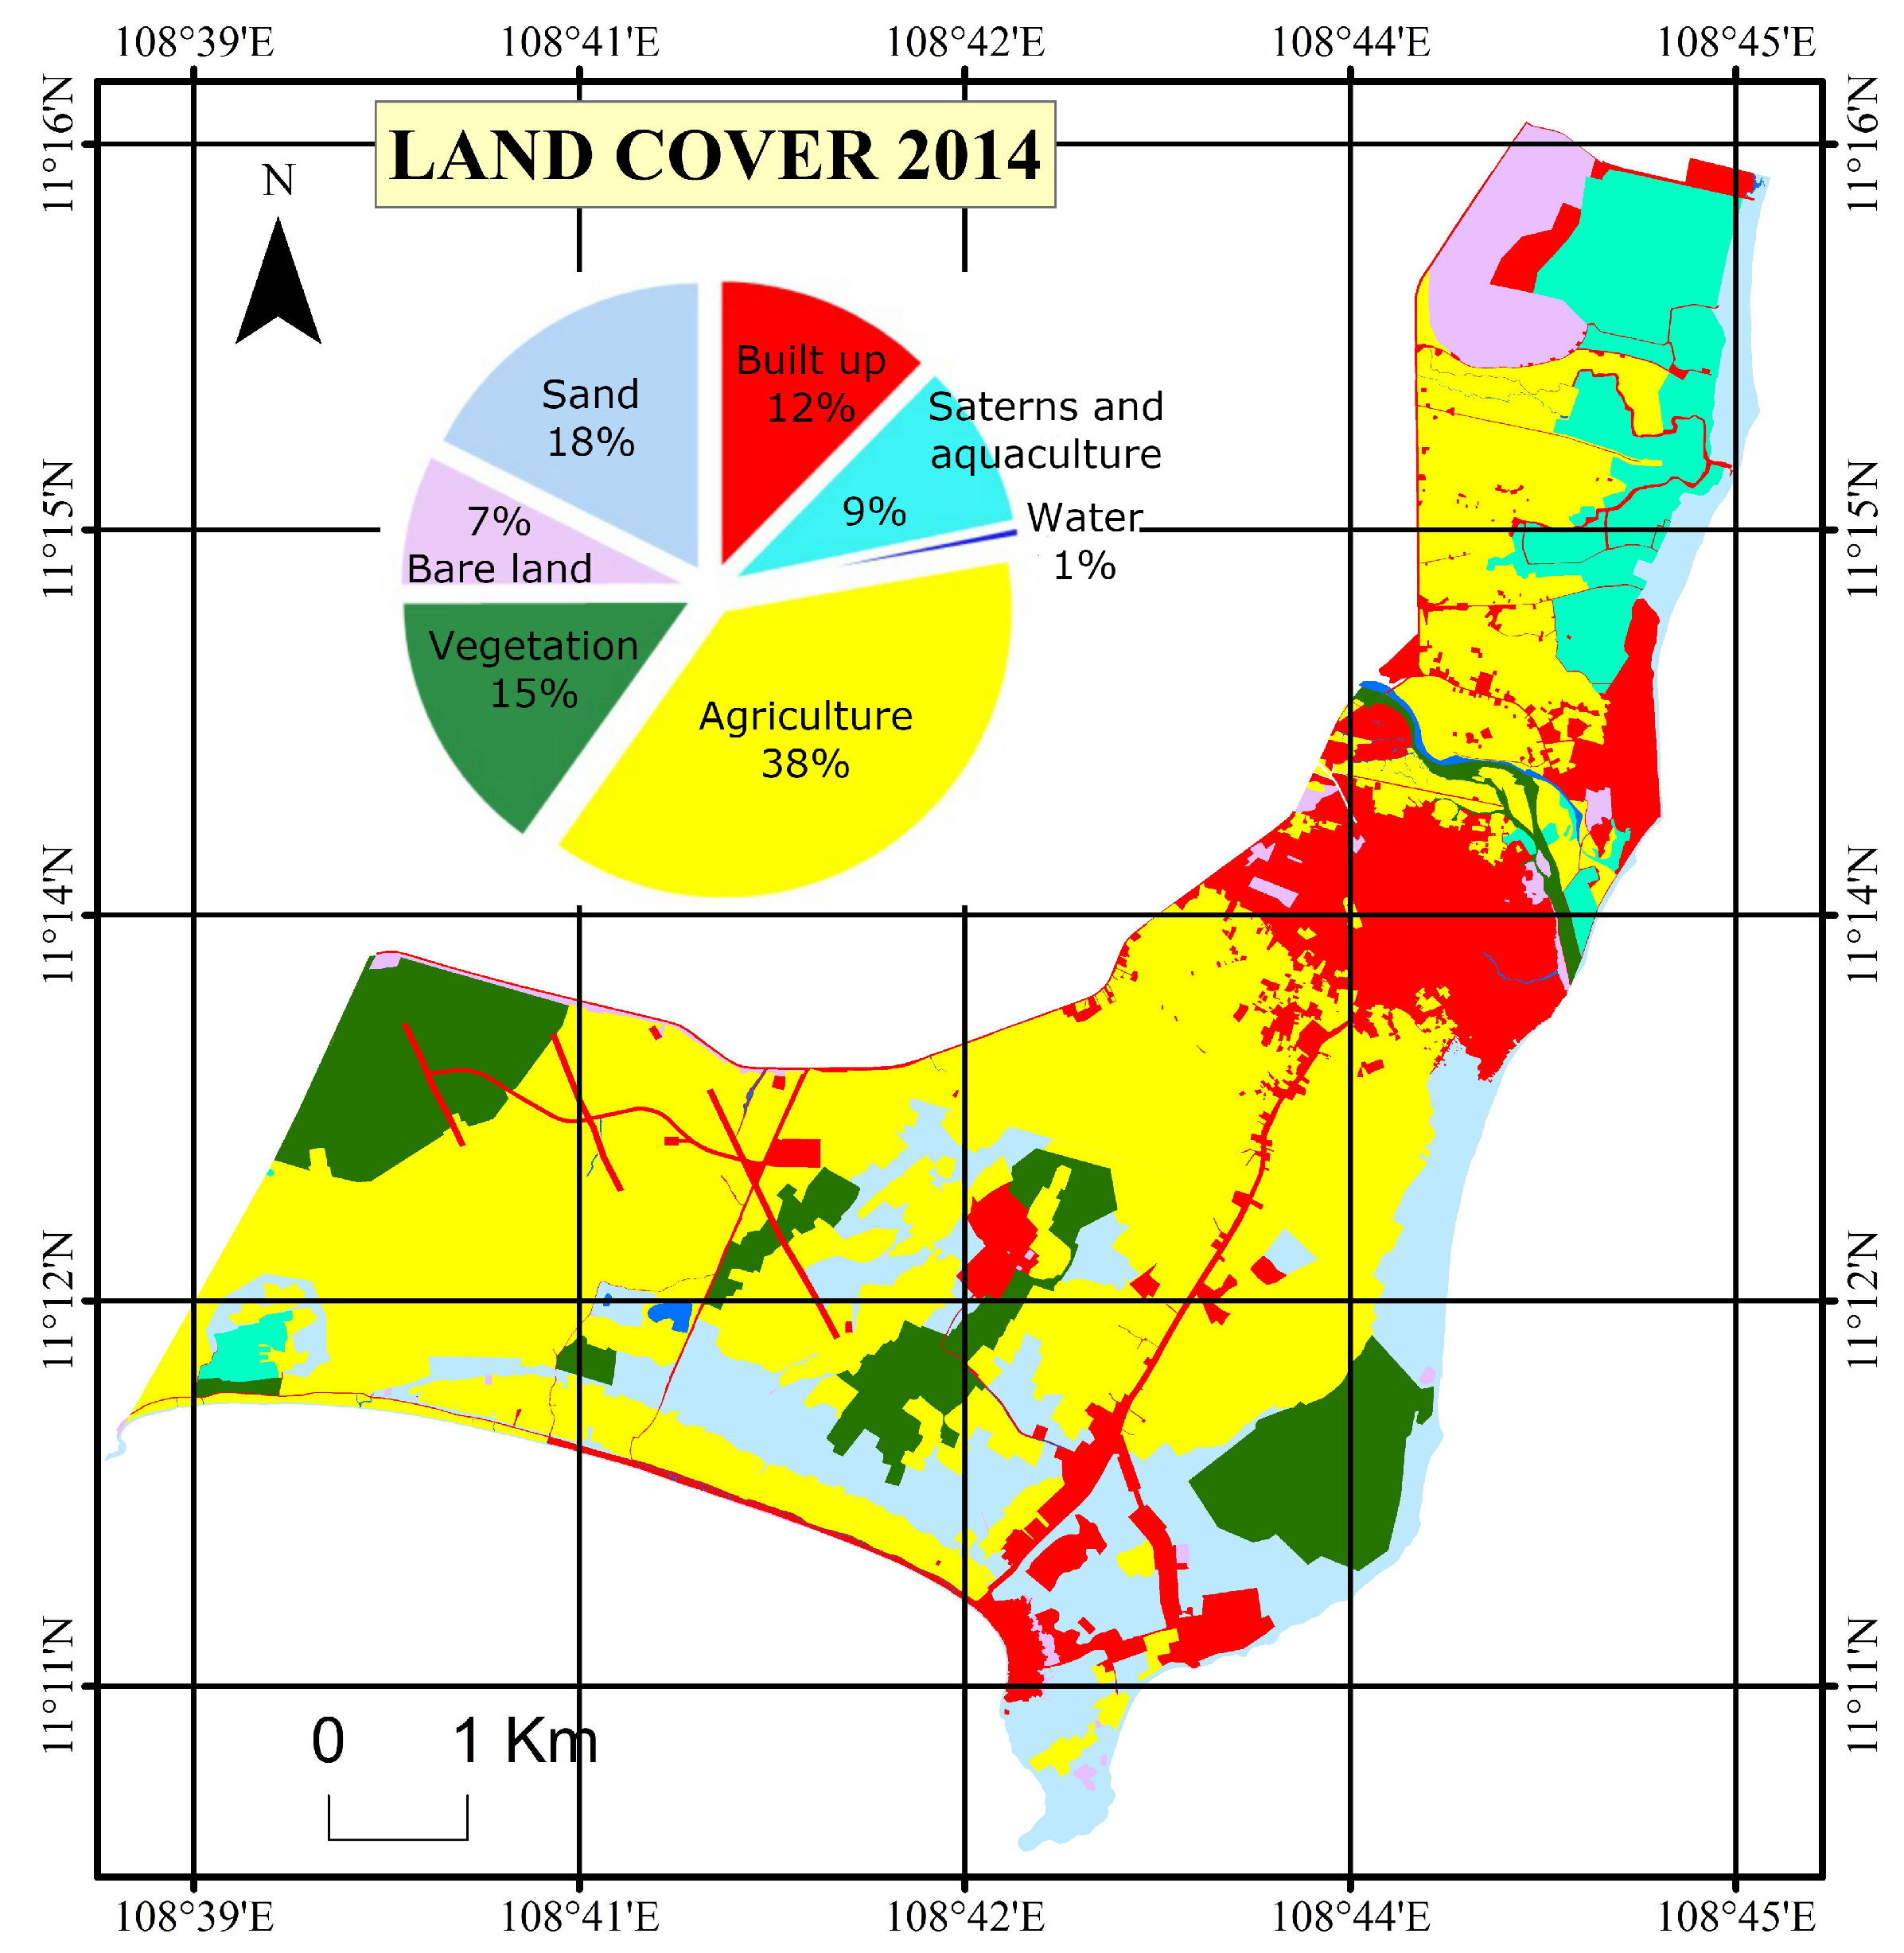
Appendix C. The 2014 Land Use Land Cover Map

References
- Wilhite, D.A.; Glantz, M.H. Understanding the Drought Phenomenon: The Role of Definitions; Drought Mitigation Center Faculty Publications. 1985. Available online: http://digitalcommons.unl.edu/cgi/viewcontent.cgi?article=1019context=droughtfacpub (accessed on 8 February 2019).
- Descroix, L.; Moussa, I.B.; Genthon, P.; Sighomnou, D.; Mahe, G.; Mamadou, I.; Vandervaere, J.-P.; Gautier, E.; Maiga, O.F.; Rajot, J.L.; et al. Impact of Drought an Land—Use Changes on Surface-Water Quality Quantity: The Sahelian Paradox. In Current Perspectives in Contaminant Hydrology and Water Resources Sustainability; IntechOpen: London, UK, 2013; Chapter 10; pp. 243–271. [Google Scholar] [CrossRef]
- Li, Y.; Change, J.; Luo, L. Assessing the impacts of climate and land use land cover changes on hydrological droughts in the Yellow River Basin using SWAT model with time-varying parameters. In Proceedings of the 2017 6th International Conference on Agro-Geoinformatics, Fairfax, VA, USA, 7–10 August 2017; pp. 1–6. [Google Scholar] [CrossRef]
- Gutierrez-Velez, V.H.; Uriarte, M.; DeFries, R.; Pinedo-Vasquez, M.; Fernades, K.; Ceccato, P.; Baethgen, W.; Padoch, C. Land cover change interacts with drought severity to change fire regimes in Western Amazonia. Ecol. Appl. 2014, 24, 1323–1340. [Google Scholar] [CrossRef] [PubMed]
- Raja Rao, G.; Visweswara Reddy, B.; Tammi Naidu, G.; Hema Malini, B. Impact of Drought on Land Use/Land Cover Changes in Srikakulam District of Andhra Pradesh—A Study Through Remote Sensing and GIS. Int. J. Multidiscip. Educ. Res. 2013, 2. [Google Scholar]
- Findell, K.L.; Berg, A.; Gentine, P.; Krasting, J.P.; Lintner, B.R.; Malyshev, S.; Santanello, J.A.; Sheliakova, E. The Impact of Anthoropogenic Land Use and Land Cover Change on Regional Climate Extremes. Nat. Commun. 2017, 8. [Google Scholar] [CrossRef] [PubMed]
- Biazin, B.; Sterk, G. Drought Vulnerability Drives Land Use and Land Cover Changes in the Rift Valley Dry Lands of Ethiopia. Agric. Ecosyst. Environ. 2013, 164, 100–112. [Google Scholar] [CrossRef]
- Hisdal, L.; Tallaksen, L.M. Drought Event Definition. In Assessment of Regional Impacts of Droughts in Europe; Technical Report; University Oslo: Oslo, Norway, 2000. [Google Scholar]
- Kottek, M.; Grieser, J.; Beck, C.; Rudolf, B.; Rubel, F. World Map of the Köppen-Geiger climate classification updated. Meteorol. Z. 2006, 15, 259–263. [Google Scholar] [CrossRef]
- Pham, Q.V.; Nguyen, T.B.; Bui, T.T.H. Drought Zoning for Binh Thuan Province, in Viet Nam base on ETo Calculator and GIS. In Proceedings of the GeoInformatics for Spatial-Infrastructure Development in Earth and Allied Sciences (GIS-IDEAS) 2012, Ho Chi Minh City, Vietnam, 16–20 October 2012. [Google Scholar]
- Duong, H.L. San Xuat Muoi o Vinh Hao Gay O Nhiem Moi Truong. 2009. Available online: Mard.gov.vn (accessed on 8 February 2019).
- The Center of Database Establishment for Environmental Resources in Vietnam, Geography Institute. The Map of Total Annual Rainfall Distribution; Geography Institute: Ha Noi, Vietnam, 1999. [Google Scholar]
- Weather Data Archive at Lien Huong Station. Available online: www.meteoblue.com (accessed on 8 February 2019).
- Gobin, A.; Le, T.H.; Pham, H.L.; Hens, L.; Ozer, P.; Le, T.T.H.; Nguyen, T.B.; Pham, Q.V. Impact of Global Climate Change and Desertification on the Environment and Society in the Southern Centre of Viet Nam (Case Stuty in the Binh Thuan Province); Technical Report; The Belgian Federal Science Policy Office: Brussels, Belgium, 2012. [Google Scholar]
- Le, T.H.; Gobin, A.; Hens, L. Select Indicators and Prioritize Solutions for Desertification and Drought in Binh Thuan, Vietnam. Chin. J. Pop. Resour. Environ. 2016, 14, 123–132. [Google Scholar] [CrossRef]
- VNA. Binh Thuan Province Dries up in Severe Drought. 2016. Available online: vietnamplus.vn (accessed on 8 February 2019).
- Tran, H.T.; Campbell, J.B.; Tran, T.D.; Tran, H.T. Monitoring drought vulnerability using multispectral indices observed from sequential remote sensing (Case Study: Tuy Phong, Binh Thuan, Vietnam). GISci. Remote Sens. 2017, 54, 167–184. [Google Scholar] [CrossRef]
- Kogan, F.N. Remote sensing of weather impacts on vegetation in non-homogeneous areas. Int. J. Remote Sens. 1990, 11, 1405–1419. [Google Scholar] [CrossRef]
- Pham, T.H. Long Song Dam. 2009. Available online: vncold.vn (accessed on 8 February 2019).
- Al-Kofahi, S.D.; Steele, C.; VanLeeuwen, D.; St Hilaire, R. Mapping Land Cover in Urban Residential Landscapes using Fine Resolution Imagery and Object-Oriented Classification. Hortscience 2010, 45, 93–94. [Google Scholar]
- Cao, X.; Ke, C.Q. Land Use Classification with QUICKBIRD Image Using Object-Oriented Approach. IEEE Int. Geosci. Remote Sens. Symp. 2006, 1, 3255–3258. [Google Scholar] [CrossRef]
- Billo, R.E.; Bidanda, B. Representing Group Technology Classification and Coding Techniques with Object-Oriented Modeling Principles. IIE Trans. 1995, 27, 542–554. [Google Scholar] [CrossRef]
- Gao, Y.; Mas, J.F.; Maathuis, B.H.P.; Zhang, X.M.; Van Dijk, P.M. Comparison of Pixel-based and Object-Oriented Image Classification Approaches—A Case Study in a Coal Fire Area, Wuda, Inner Mongolia, China. Int. J. Remote Sens. 2006, 27, 4039–4055. [Google Scholar] [CrossRef]
- Hebbar, R.; Ravishankar, H.M.; Trivedi, S.; Subramoniam, S.R.; Raj, U.; Dadhwal, V.K. Object oriented classification of high resolution data for inventory of horticultural crops. In Proceedings of the ISPRS Technical Commission VIII Symposium, Hyderabad, India, 9–12 December 2014; Volume 40, pp. 745–749. [Google Scholar] [CrossRef]
- Chen, M.J.; Sui, W.; Li, L.; Zhang, C.; Yue, A.Z.; Li, H.X. A Comparison of Pixel-Based and Object-Oriented Classification using SPOT5 Imagery. WSEAS Trans. Inf. Sci. Appl. 2008, 6. [Google Scholar]
- Hermosilla, T.; Almonacid, J.; Fernandez-Sarria, A.; Ruiz, L.A.; Recio, J.A. Combining Features extracted from Imagery and Lidar data for Object-Oriented Classification of Forest Areas. Int. Arch. Photogramm. Remote Sens. Spat. Inf. Sci. 2010, 38, 4-c7. [Google Scholar]
- Hong, L.; Liu, C.; Yang, K.; Deng, M. Object-Oriented Markov Random Model for Classification of High Resolution Satellite Imagery based on Wavelet Transform. In Proceedings of the Fifth International Conference on Digital Image Processing (Icdip), Beijing, China, 19 July 2013; Volume 8878. [Google Scholar] [CrossRef]
- Zhang, X.; Sun, Y.L.; Shang, K.; Zhang, L.F.; Wang, S.D. Crop Classification based on Feature Band Set Construction and Object-Oriented Approach using Hyperspectral Images. IEEE J. Sel. Top. Appl. Earth Obs. Remote Sens. 2016, 9, 4117–4128. [Google Scholar] [CrossRef]
- Wolf, A. Using World View 2 Vis-NIR MSI Imagery to Support Land Mapping and Feature Extraction using Normalized Difference Index Ratio. In Proceedings of the Algorithms and Technologies for Multispectral, Hyperspectral, and Ultraspectral Imagery XVIII, Baltimore, MD, USA, 14 May 2012; Volume 8390. [Google Scholar]
- Cole, R. The Definition of Drought. In Measuring Drought and Drought Impacts in Red Sea Province; Publishing House: Oxford, UK, 1989; Volume xvii, 304p. [Google Scholar]
- Healthcote, R.L. Drought and the Human Story: Braving the Bull of Heaven; Ashgate: Farnham, UK, 2013; Volume xvi, 301p, ISBN 9781409405016. [Google Scholar]
- Duong, A. Tuy Phong: Dien Tich Tha Nuoi Tom The Chan Trang Giam. 2017. Available online: Baobinhthuan.com.vn (accessed on 8 February 2019).
- Hountondji, Y.C.; De Longueville, F.; Ozer, P. Land Cover Dynamics (1990–2002) in Binh Thuan Province, Southern Central Vietnam. Int. J. Asian Soc. Sci. 2012, 2, 336–349. [Google Scholar]
- Mercy, M.W. Assessment of the Effects of Climate Change on Land Use and Land Cover Using Remote Sensing: A Case Study form Kenya; Dresden Nexus Conference Working Paper Series; United Nations University Institute for Integrated Management of Material Fluxes and of Resources (UNU-FLORES): Tokyo, Japan, 2015; DNC2015/03. [Google Scholar]
- Mokhtari, A.; Mansor, S.B.; Mahmur, A.R.; Helmi, Z.M. Monitoring the Impacts of Drought on Land Use/Cover: a Developed Object-based Algorithm for NOAA AVHRR Time Series Data. J. Appl. Sci. 2011, 11, 3089–3103. [Google Scholar]


| No | Band | WorldView2 | Geoeye1 |
|---|---|---|---|
| 1 | Coastal | 400–450 nm | NA |
| 2 | Blue | 450–510 nm | 450–510 nm |
| 3 | Green | 510–580 nm | 510–580 nm |
| 4 | Yellow | 585–625 nm | NA |
| 5 | Red | 630–690 nm | 655–690 nm |
| 6 | Red Edge | 705–745 nm | NA |
| 7 | NIR1 | 770–895 nm | 780–920 nm |
| 8 | NIR2 | 860–1040 nm | NA |
| ID | Level 1 Land Type | ID | Level 2 Land Type | Description | ||
|---|---|---|---|---|---|---|
| 1 |  | Built up | 1 | | Built up | Urban area, transportation, mining and windpower. |
| 2 |  | Salterns and shrimp farming | 2 | | Salterns | Used for sea salt production; near coastline; different shape. |
| 3 | | Active shrimp farming | Square objects; used for shrimp cultivation, well organized. | |||
| 4 |  | Inactive shrimp farming | Square shapes; no practice at time of observation. | |||
| 10 | | Land in shrimp farming | Normally linear object;bright color (tan); used for transportation. | |||
| 3 |  | Water | 5 | | Water | Lakes, ponds, streams, rivers. |
| 4 |  | Agriculture | 6 | | Rice production/paddy fields | In different shape (rectangular); smooth surface; still practicing. |
| 11 |  | Orchards | Drought-tolerant plants; normally in rectangular; clear rows, and pots; mixing urban | |||
| 12 |  | Inactive agriculture | No/sparse vegetation; normally rectangular; clear/sharp borders. | |||
| 5 |  | Vegetation | 7 | | Vegetation | Near urban area, or fields; dense; rough surface. |
| 6 |  | Bare land | 8 | | Bare land | Bare soil, no/sparse vegetation (small and low bush). |
| 7 |  | Sand | 9 | | Sand | No vegetation;yellow, or white; near the coastline. |
| 13 |  | Vegetation on sand | Small and low bush; near. coastline; dense or sparse. | |||
| ID | Land Types | 2011 Map’s Accuracy | 2016 Map’s Accuracy | Overall | ||
|---|---|---|---|---|---|---|
| User’s | Producer’s | User’s | Producer’s | |||
| 1 | Built up | 86.2 | 92.6 | 98 | 84.5 | 2011’s overall = 85% |
| 2 | Salterns | 100 | 100 | 100 | 93.8 | 2011’s kappa= 82.9% |
| 3 | Active shrimp farming | 100 | 100 | 100 | 100 | 2016’s overall = 87.3% |
| 4 | Inactive shrimp farming | 90 | 100 | 83.3 | 90.9 | 2016’s kappa=85.6% |
| 5 | Water | 66.7 | 66.7 | 100 | 66.7 | Total points = 521 |
| 6 | Rice production | 74.5 | 87.2 | 84 | 100 | |
| 7 | Vegetation | 84.2 | 61.5 | 79.1 | 89.5 | |
| 8 | Bare land | 76.9 | 81.1 | 87 | 88.9 | |
| 9 | Sand | 93.3 | 79.5 | 100 | 77.1 | |
| 10 | Land for aquaculture | 100 | 83.3 | 92.3 | 92.3 | |
| 11 | Orchards | 91.7 | 64.7 | 83.3 | 71.4 | |
| 12 | Inactive agriculture | 78.5 | 93.9 | 92.7 | 93.6 | |
| 13 | Vegetation on sand | 83.5 | 94.7 | 71.8 | 87.1 | |
| No | Land Types | Area in 2011 (ha) | Area in 2014 (ha) | Area in 2016 (ha) | Difference 2011–2016 (ha) | % of Difference |
|---|---|---|---|---|---|---|
| 1 | Built up | 418.8 | 725.3 | 406.5 | ||
| 2 | Salterns and shrimp farming | 311.9 | 321.9 | 322.4 | ↑10.5 | ↑3.4 |
| 3 | Water | 30.8 | 17.2 | 24.8 | ||
| 4 | Agriculture | 1229.4 | 2293.3 | 1269.3 | ||
| 5 | Vegetation | 475.1 | 517.9 | 839.8 | ||
| 6 | Bare land | 291.7 | 156.3 | 300.6 | ||
| 7 | Sand | 1992.5 | 755 | 1592.5 |
| No | Land Types | Area in 2011 (ha) | Area in 2016 (ha) | Area of Difference (ha) | % of Difference |
|---|---|---|---|---|---|
| 1 | Rice production | 474.6 | 228.5 | ||
| 2 | Inactive agriculture | 662.2 | 877 | ||
| 3 | Orchards | 92.6 | 163.8 | ||
| 4 | Salterns | 50.4 | 80.4 | ||
| 5 | Active shrimp farming | 99.8 | 55.8 | ||
| 6 | Inactive shrimp farming | 79.5 | 114.7 | ||
| 7 | Vegetation on sand | 1071.9 | 937.7 | ||
| 8 | Sand | 920.6 | 654.8 |
© 2019 by the authors. Licensee MDPI, Basel, Switzerland. This article is an open access article distributed under the terms and conditions of the Creative Commons Attribution (CC BY) license (http://creativecommons.org/licenses/by/4.0/).
Share and Cite
Tran, H.T.; Campbell, J.B.; Wynne, R.H.; Shao, Y.; Phan, S.V. Drought and Human Impacts on Land Use and Land Cover Change in a Vietnamese Coastal Area. Remote Sens. 2019, 11, 333. https://doi.org/10.3390/rs11030333
Tran HT, Campbell JB, Wynne RH, Shao Y, Phan SV. Drought and Human Impacts on Land Use and Land Cover Change in a Vietnamese Coastal Area. Remote Sensing. 2019; 11(3):333. https://doi.org/10.3390/rs11030333
Chicago/Turabian StyleTran, Hoa Thi, James B. Campbell, Randolph H. Wynne, Yang Shao, and Son Viet Phan. 2019. "Drought and Human Impacts on Land Use and Land Cover Change in a Vietnamese Coastal Area" Remote Sensing 11, no. 3: 333. https://doi.org/10.3390/rs11030333
APA StyleTran, H. T., Campbell, J. B., Wynne, R. H., Shao, Y., & Phan, S. V. (2019). Drought and Human Impacts on Land Use and Land Cover Change in a Vietnamese Coastal Area. Remote Sensing, 11(3), 333. https://doi.org/10.3390/rs11030333