Operational Monitoring of Illegal Fishing in Ghana through Exploitation of Satellite Earth Observation and AIS Data

 , ,
, ,  , and
, and
Abstract
:1. Introduction
2. Methods
2.1. EO Data Sources
2.1.1. Data Coverage
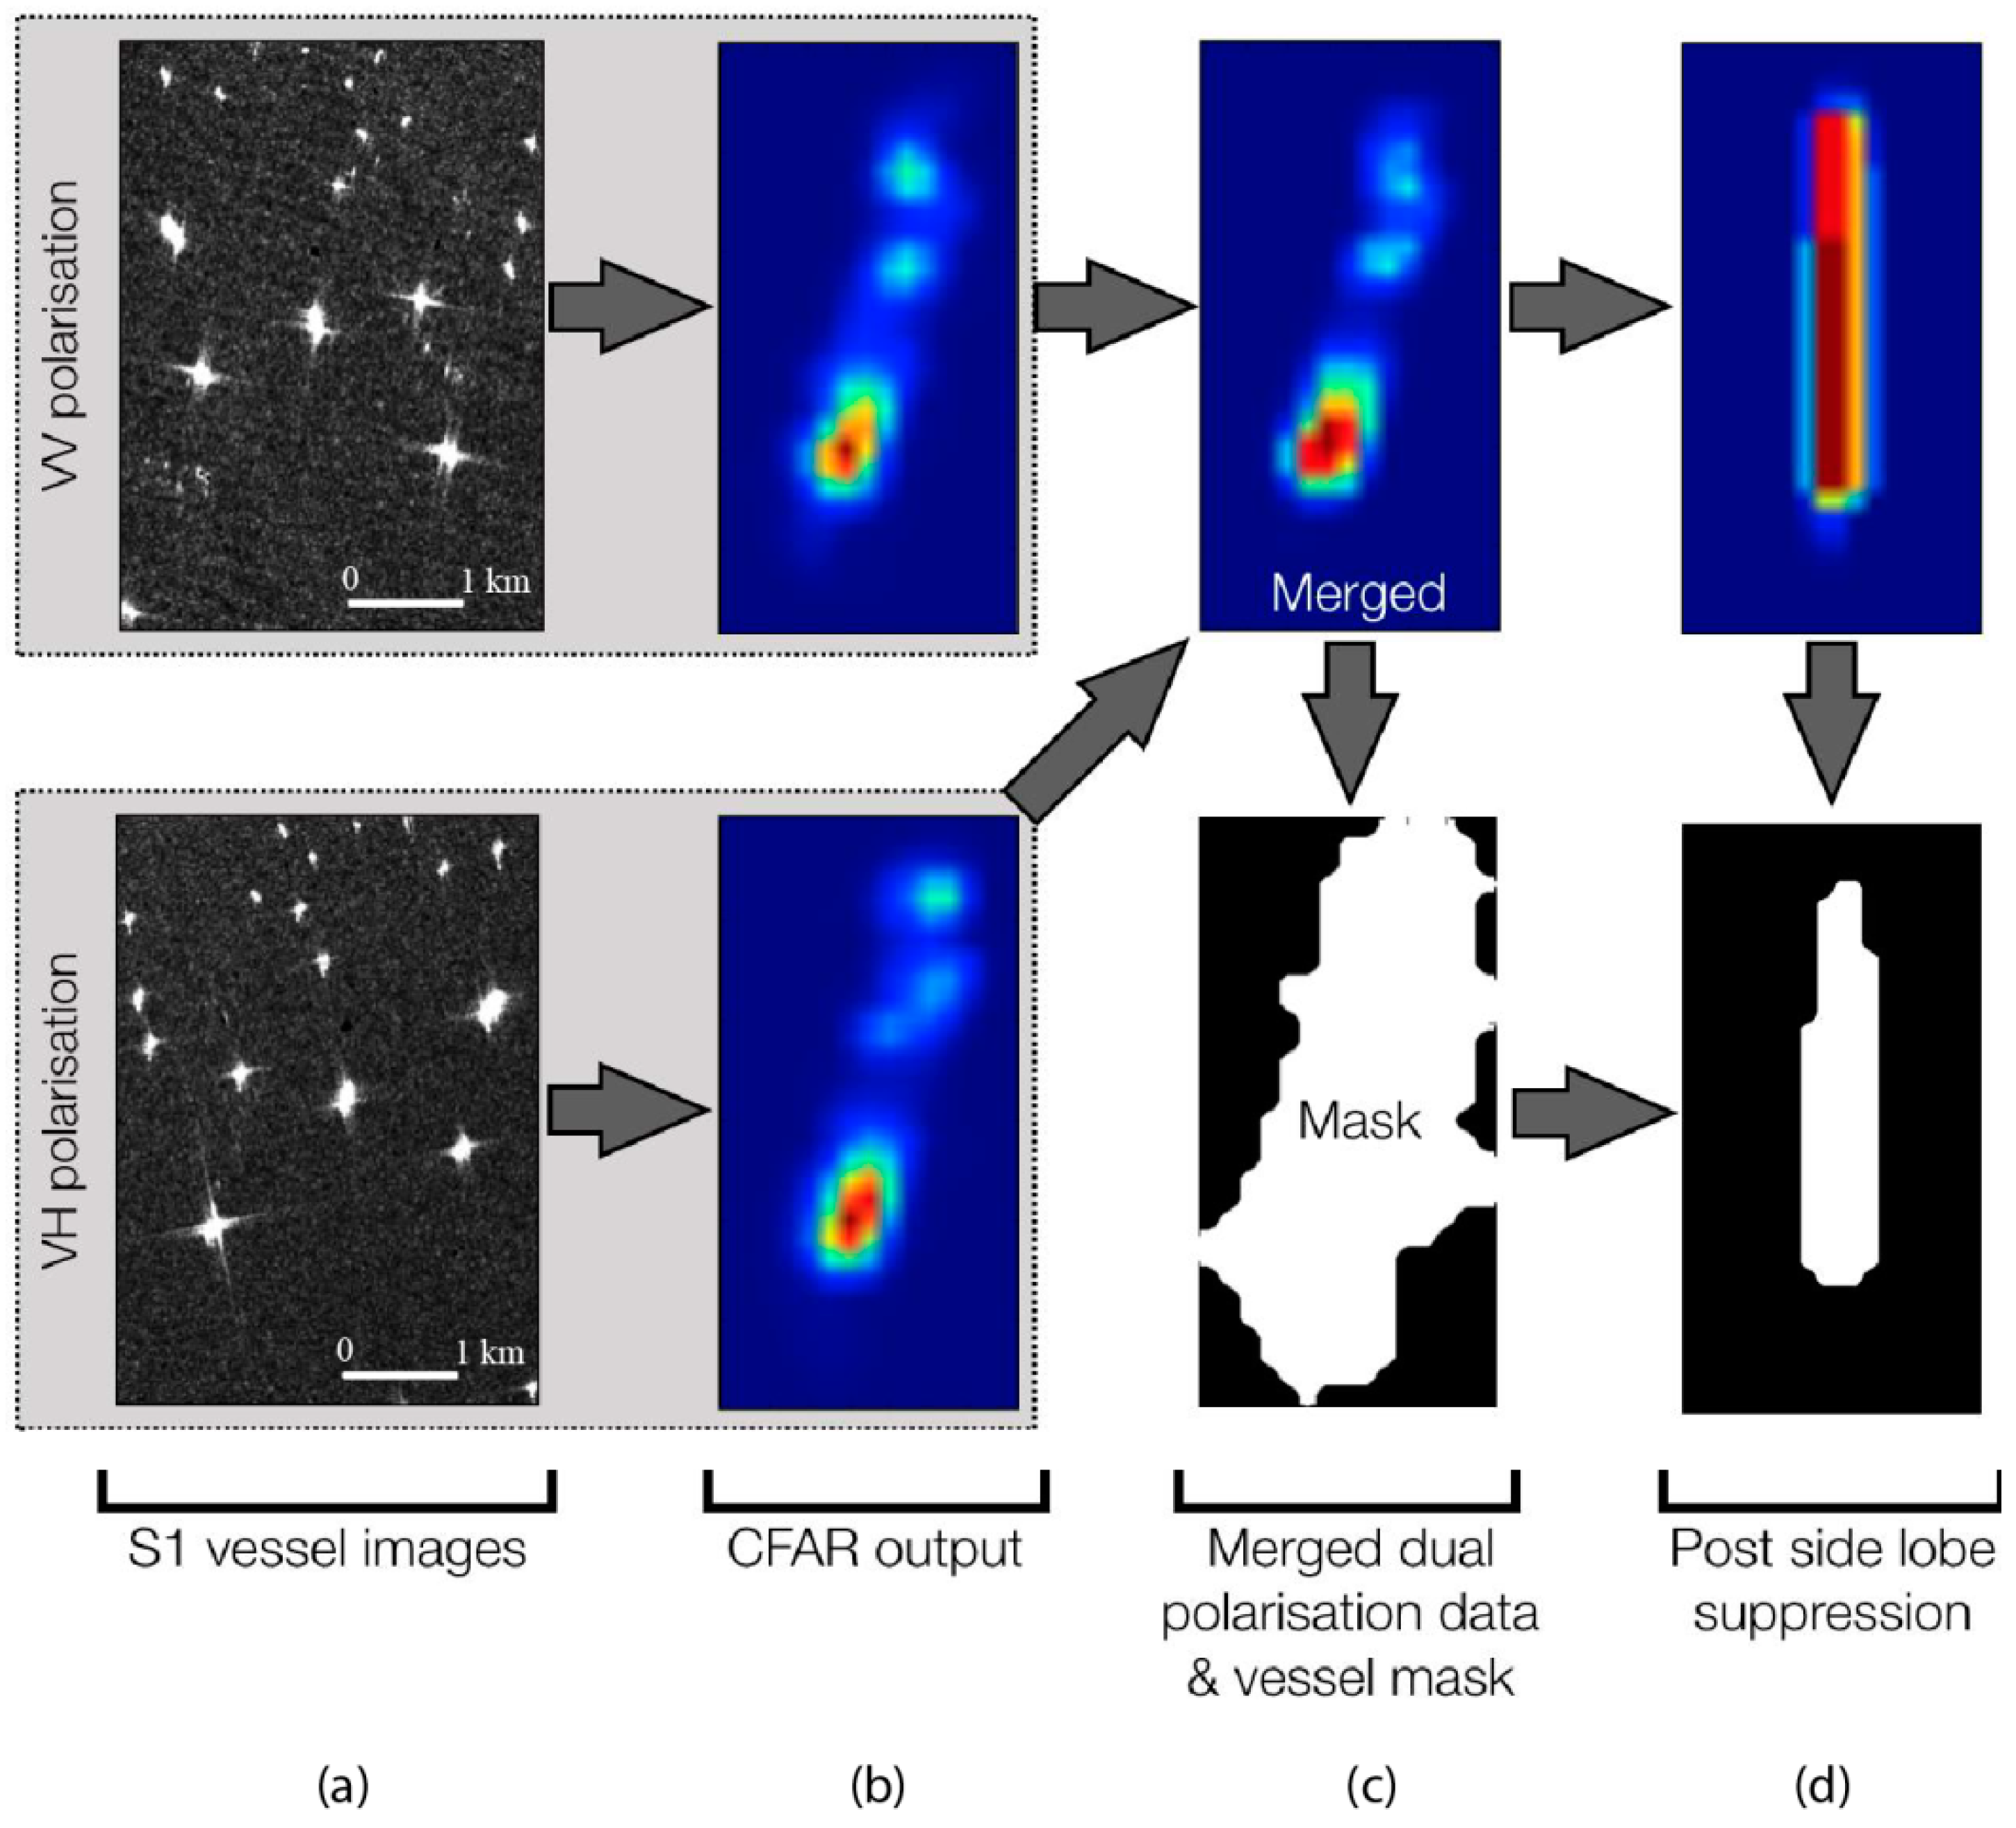
2.1.2. Sentinel-1 SAR Data
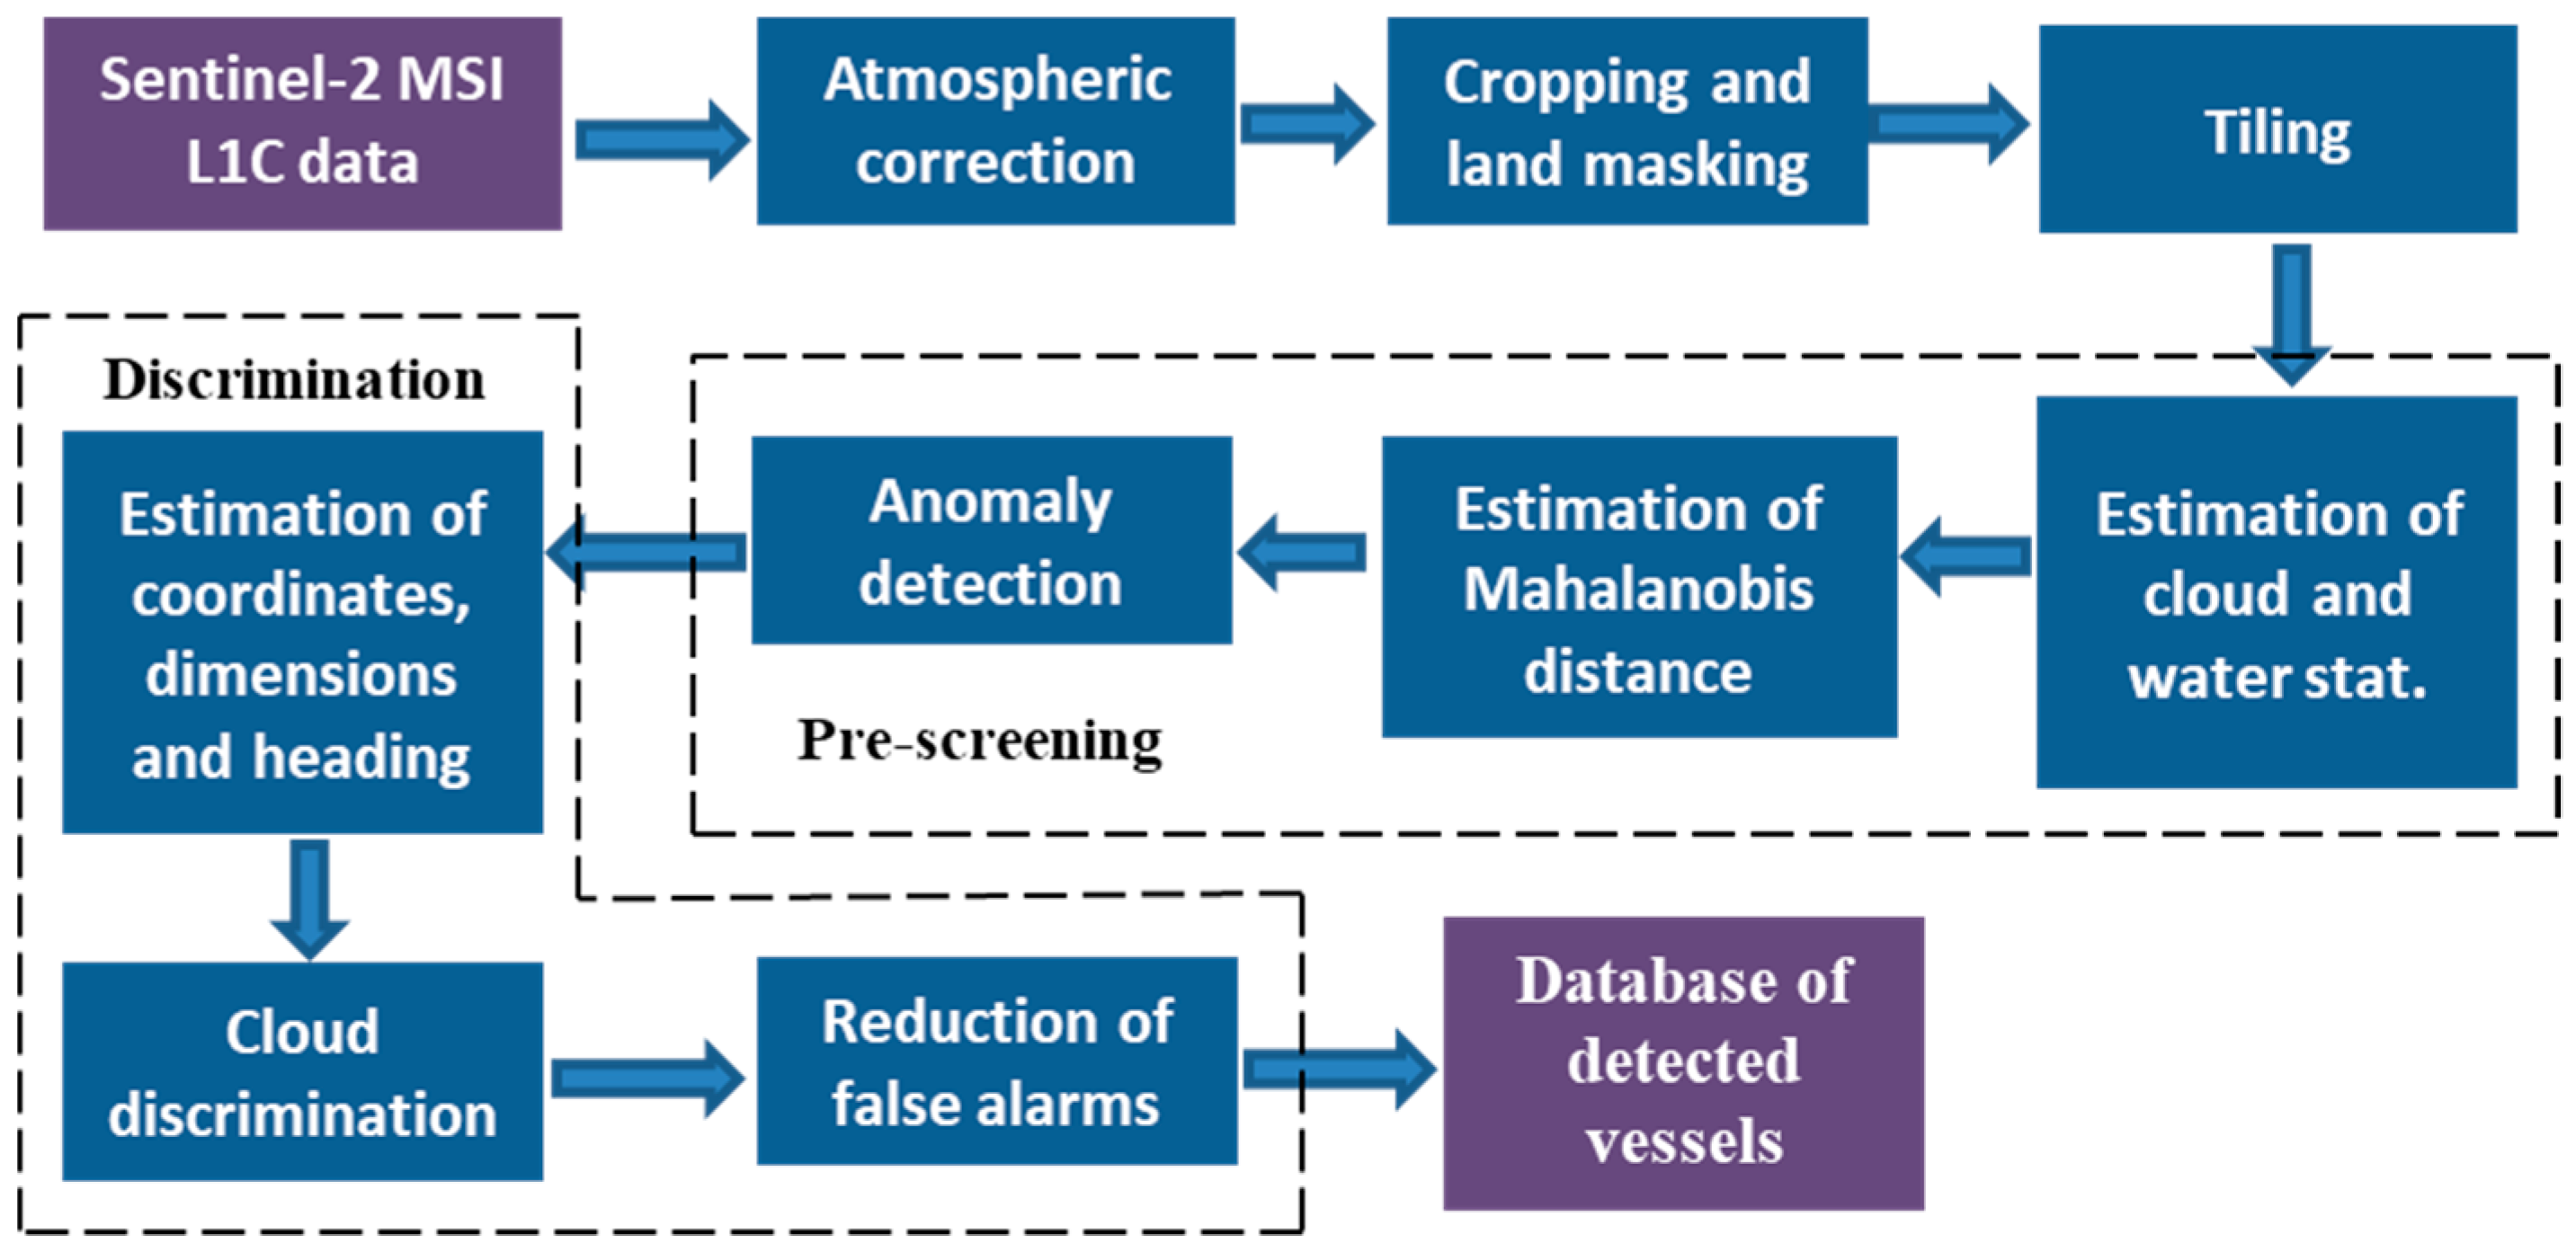
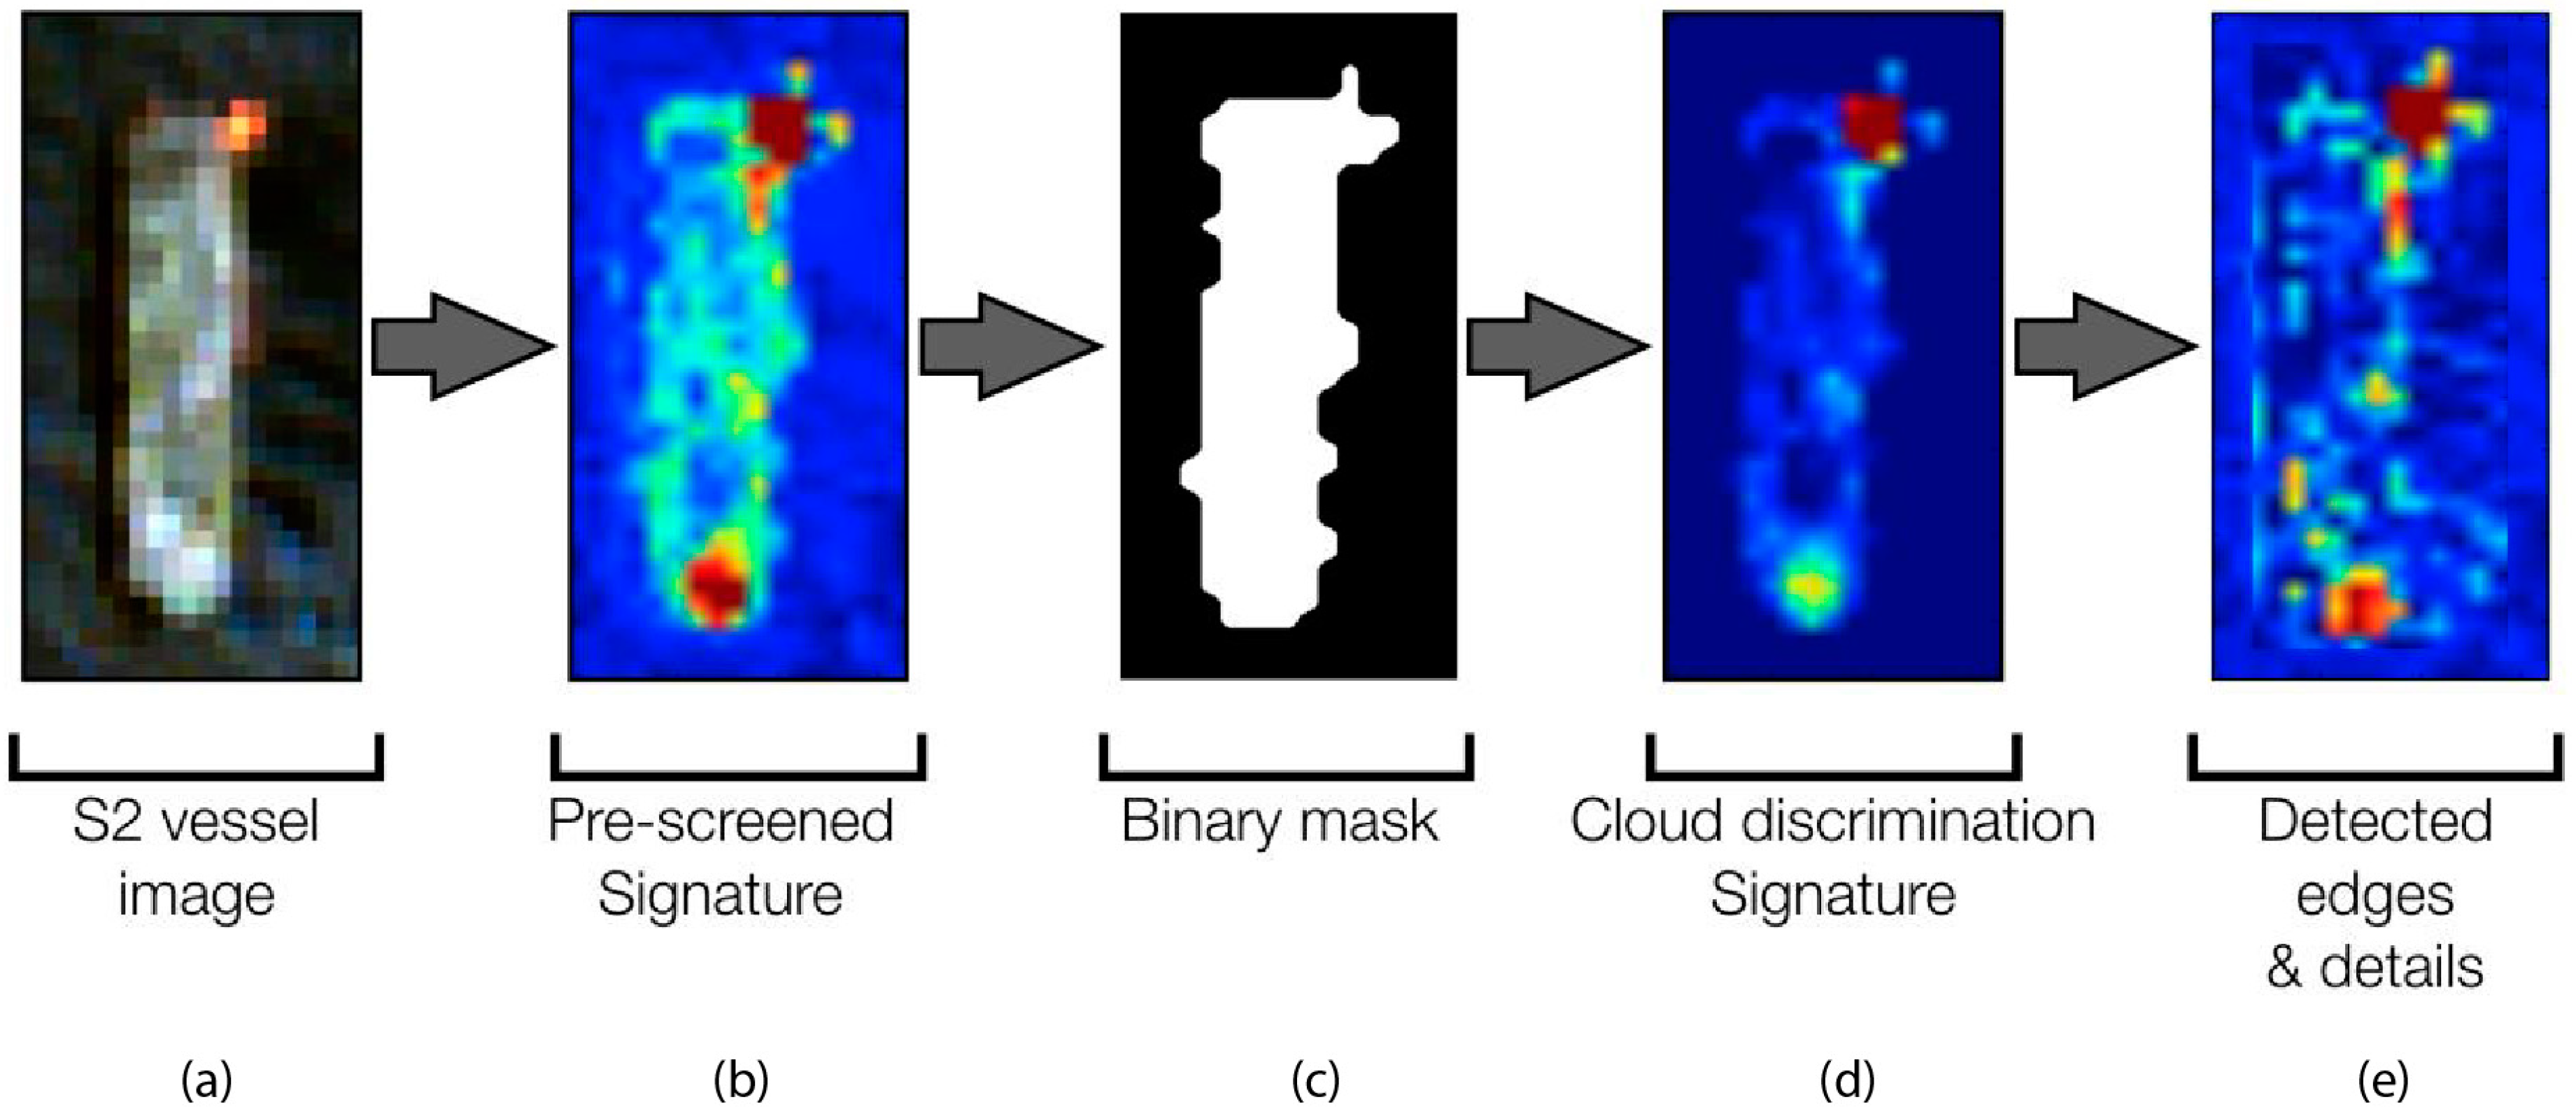
2.1.3. Sentinel-2 MSI data
2.2. Integration of EO and AIS Data
2.2.1. AIS Dataset
2.2.2. Vessel Tracks Interpolation
2.2.3. Matching Routine
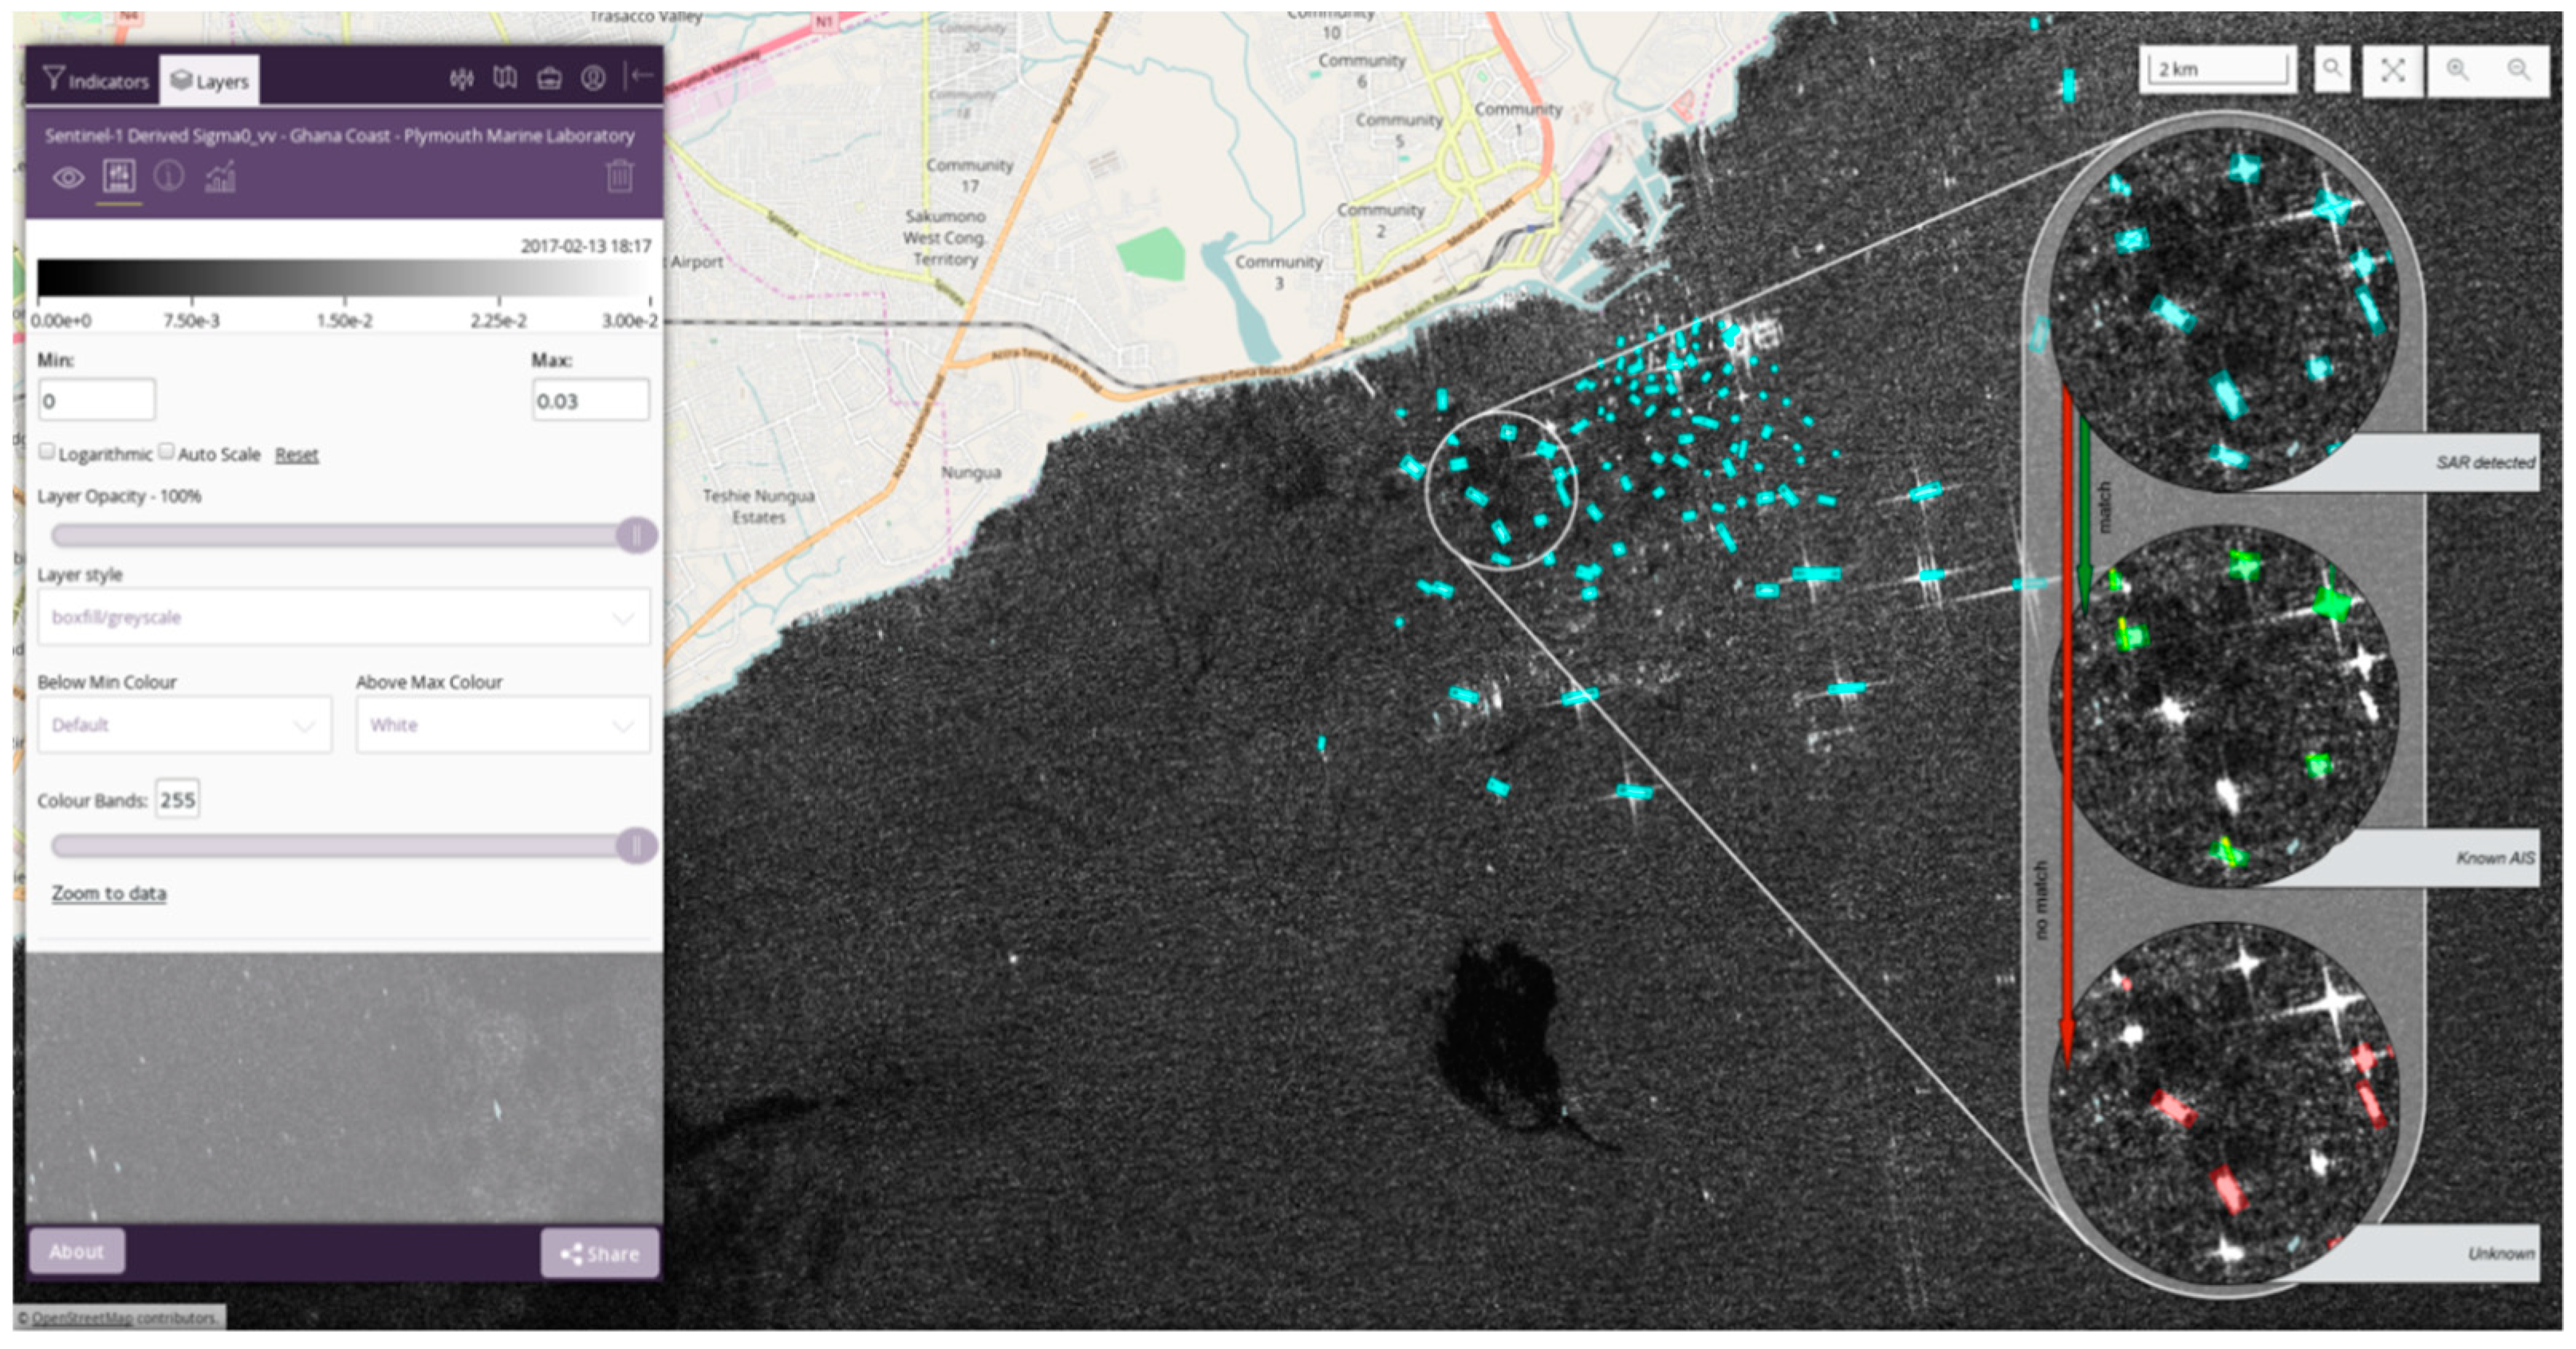
2.3. Information Delivery and Utilisation
3. Results
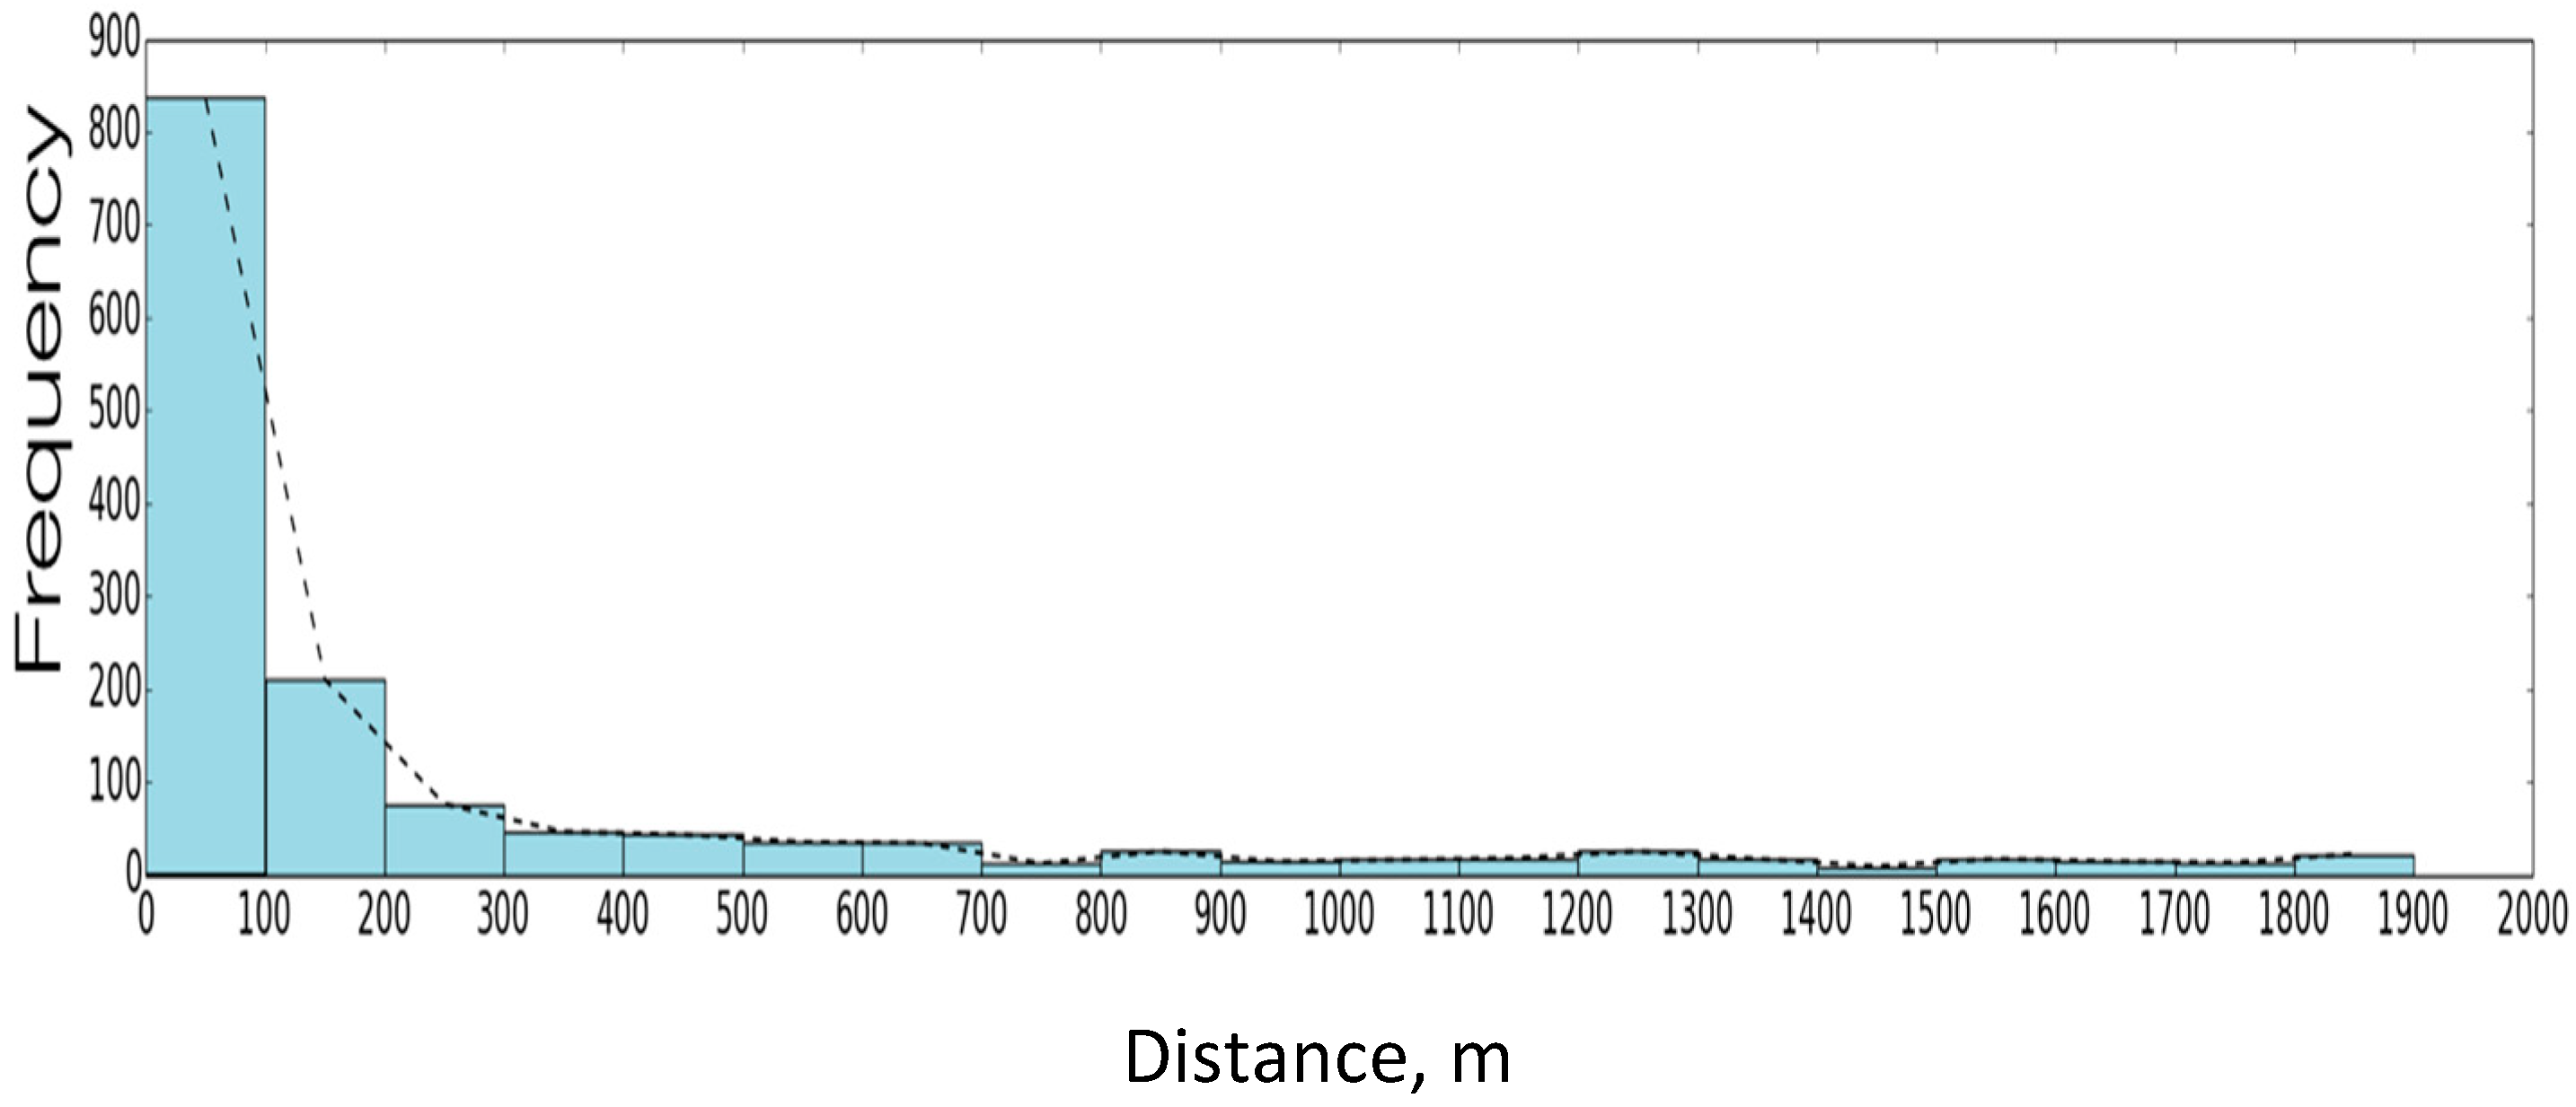
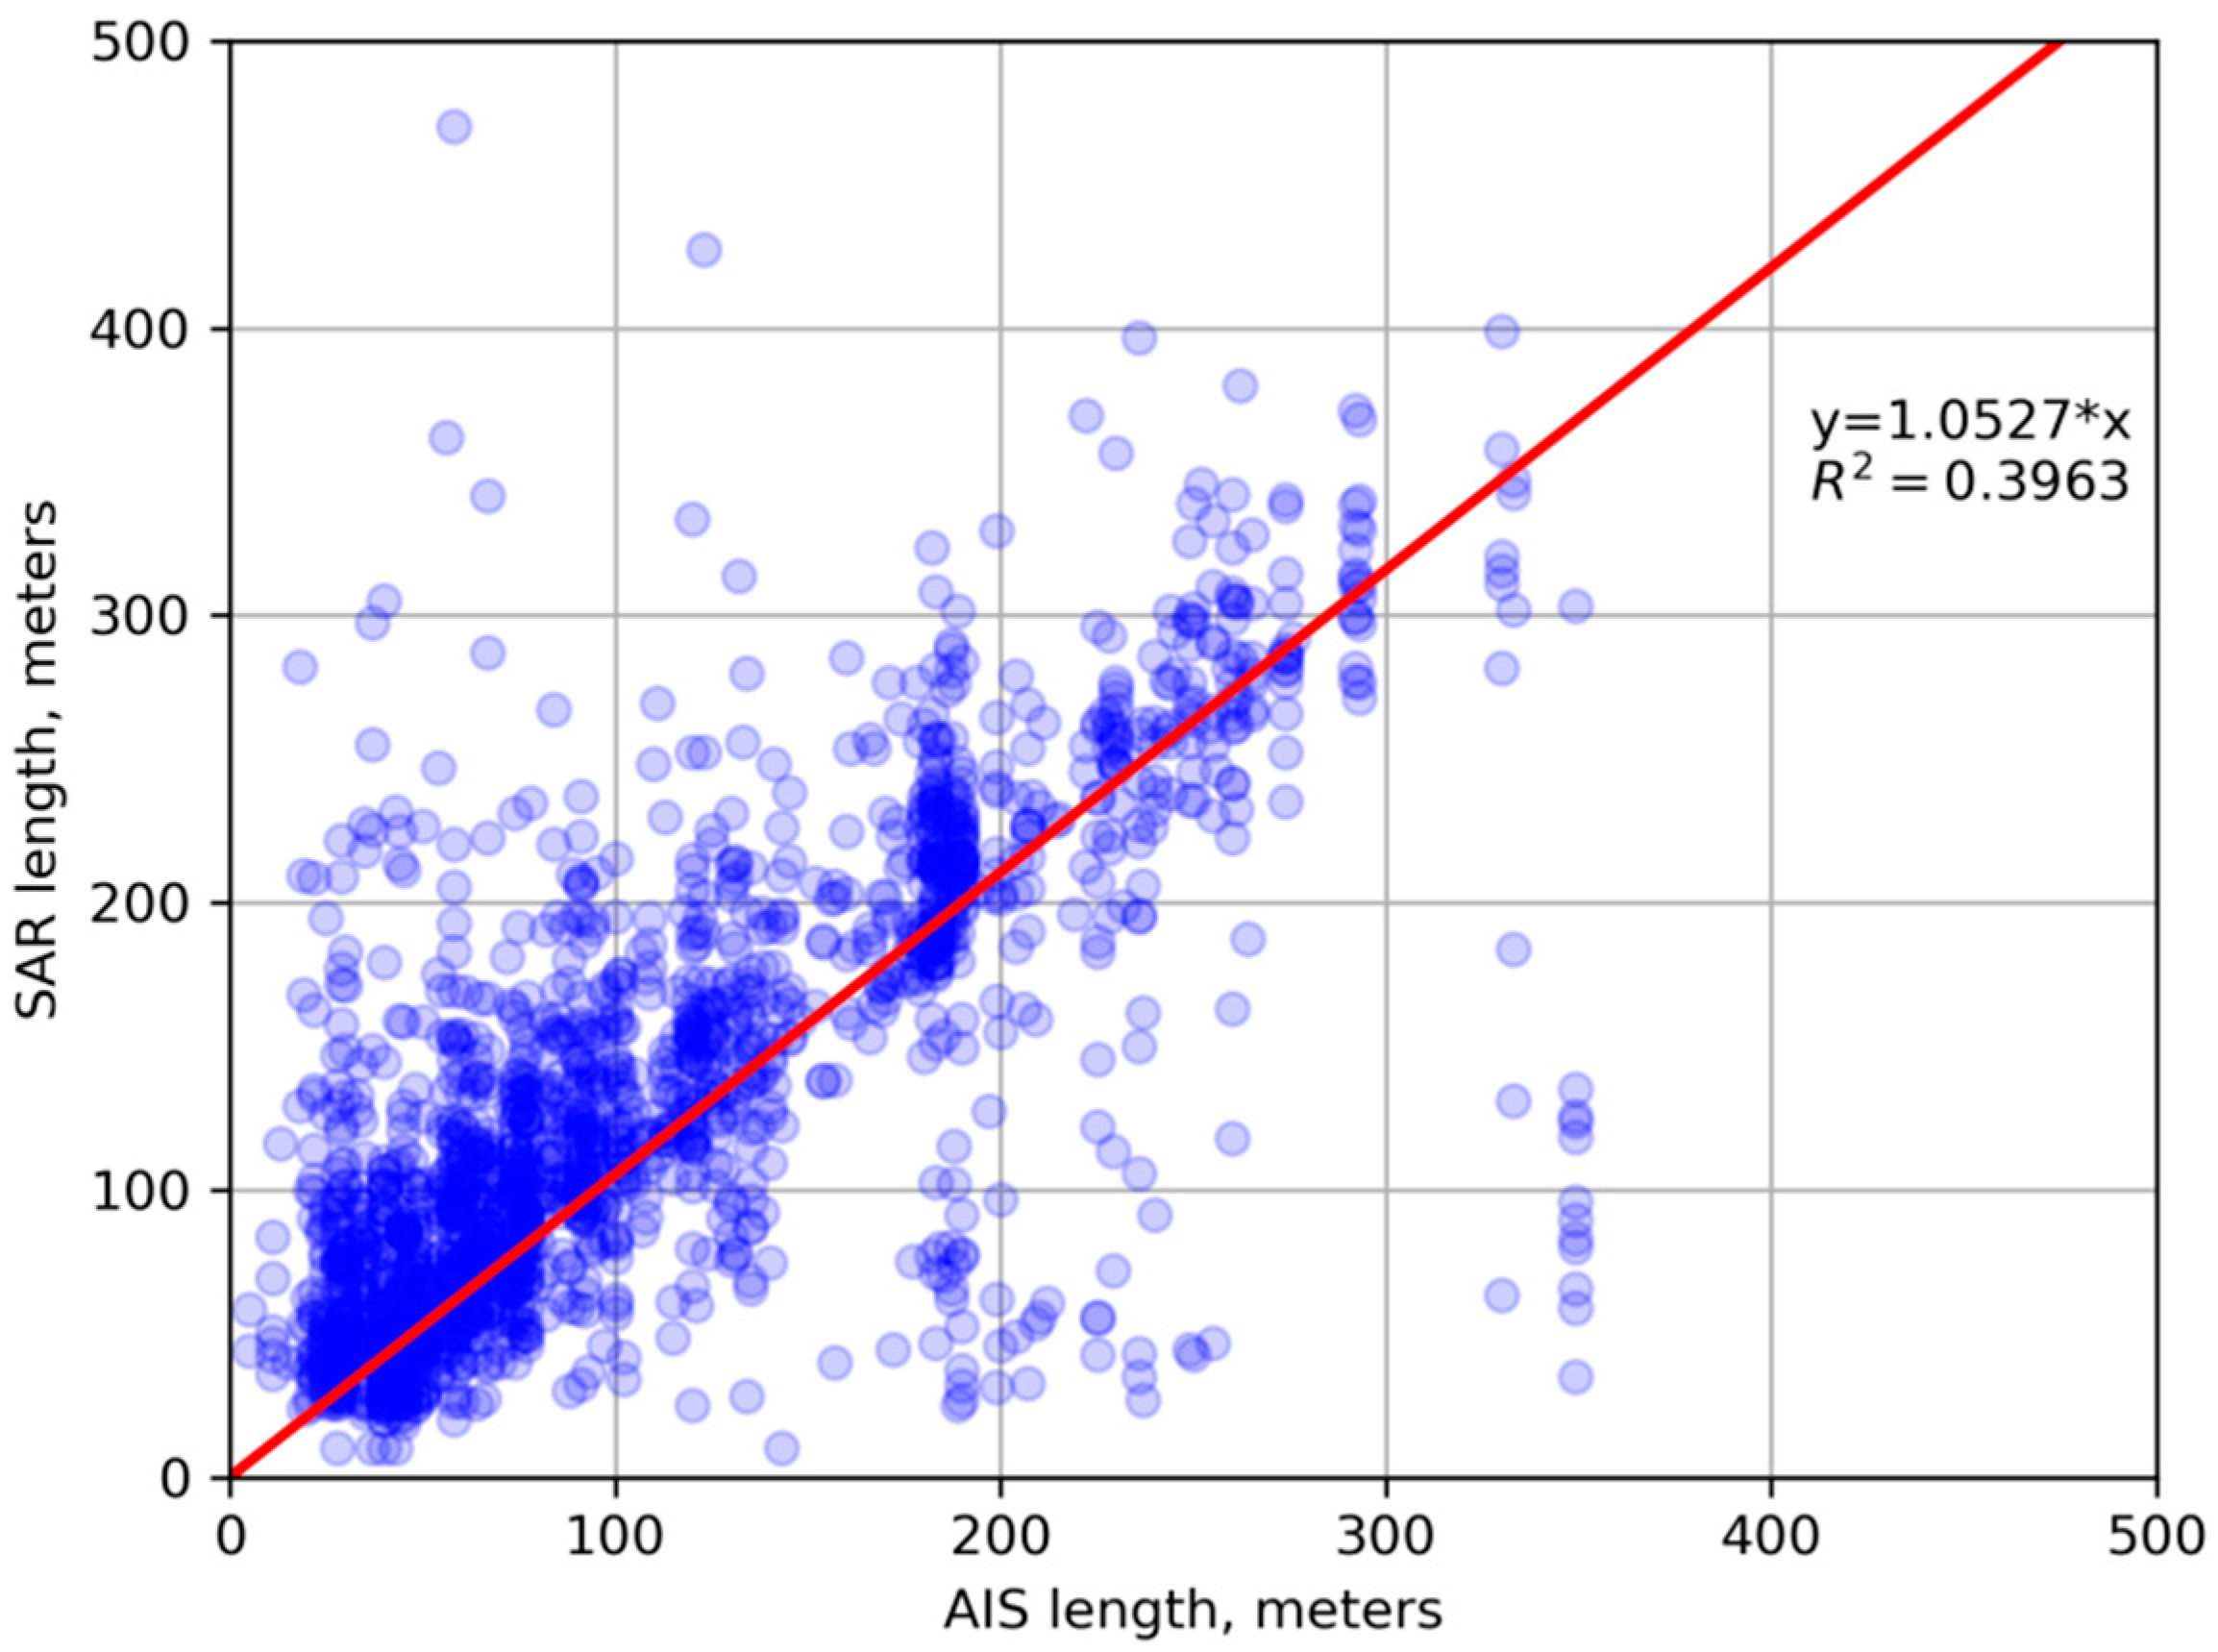
3.1. Validation
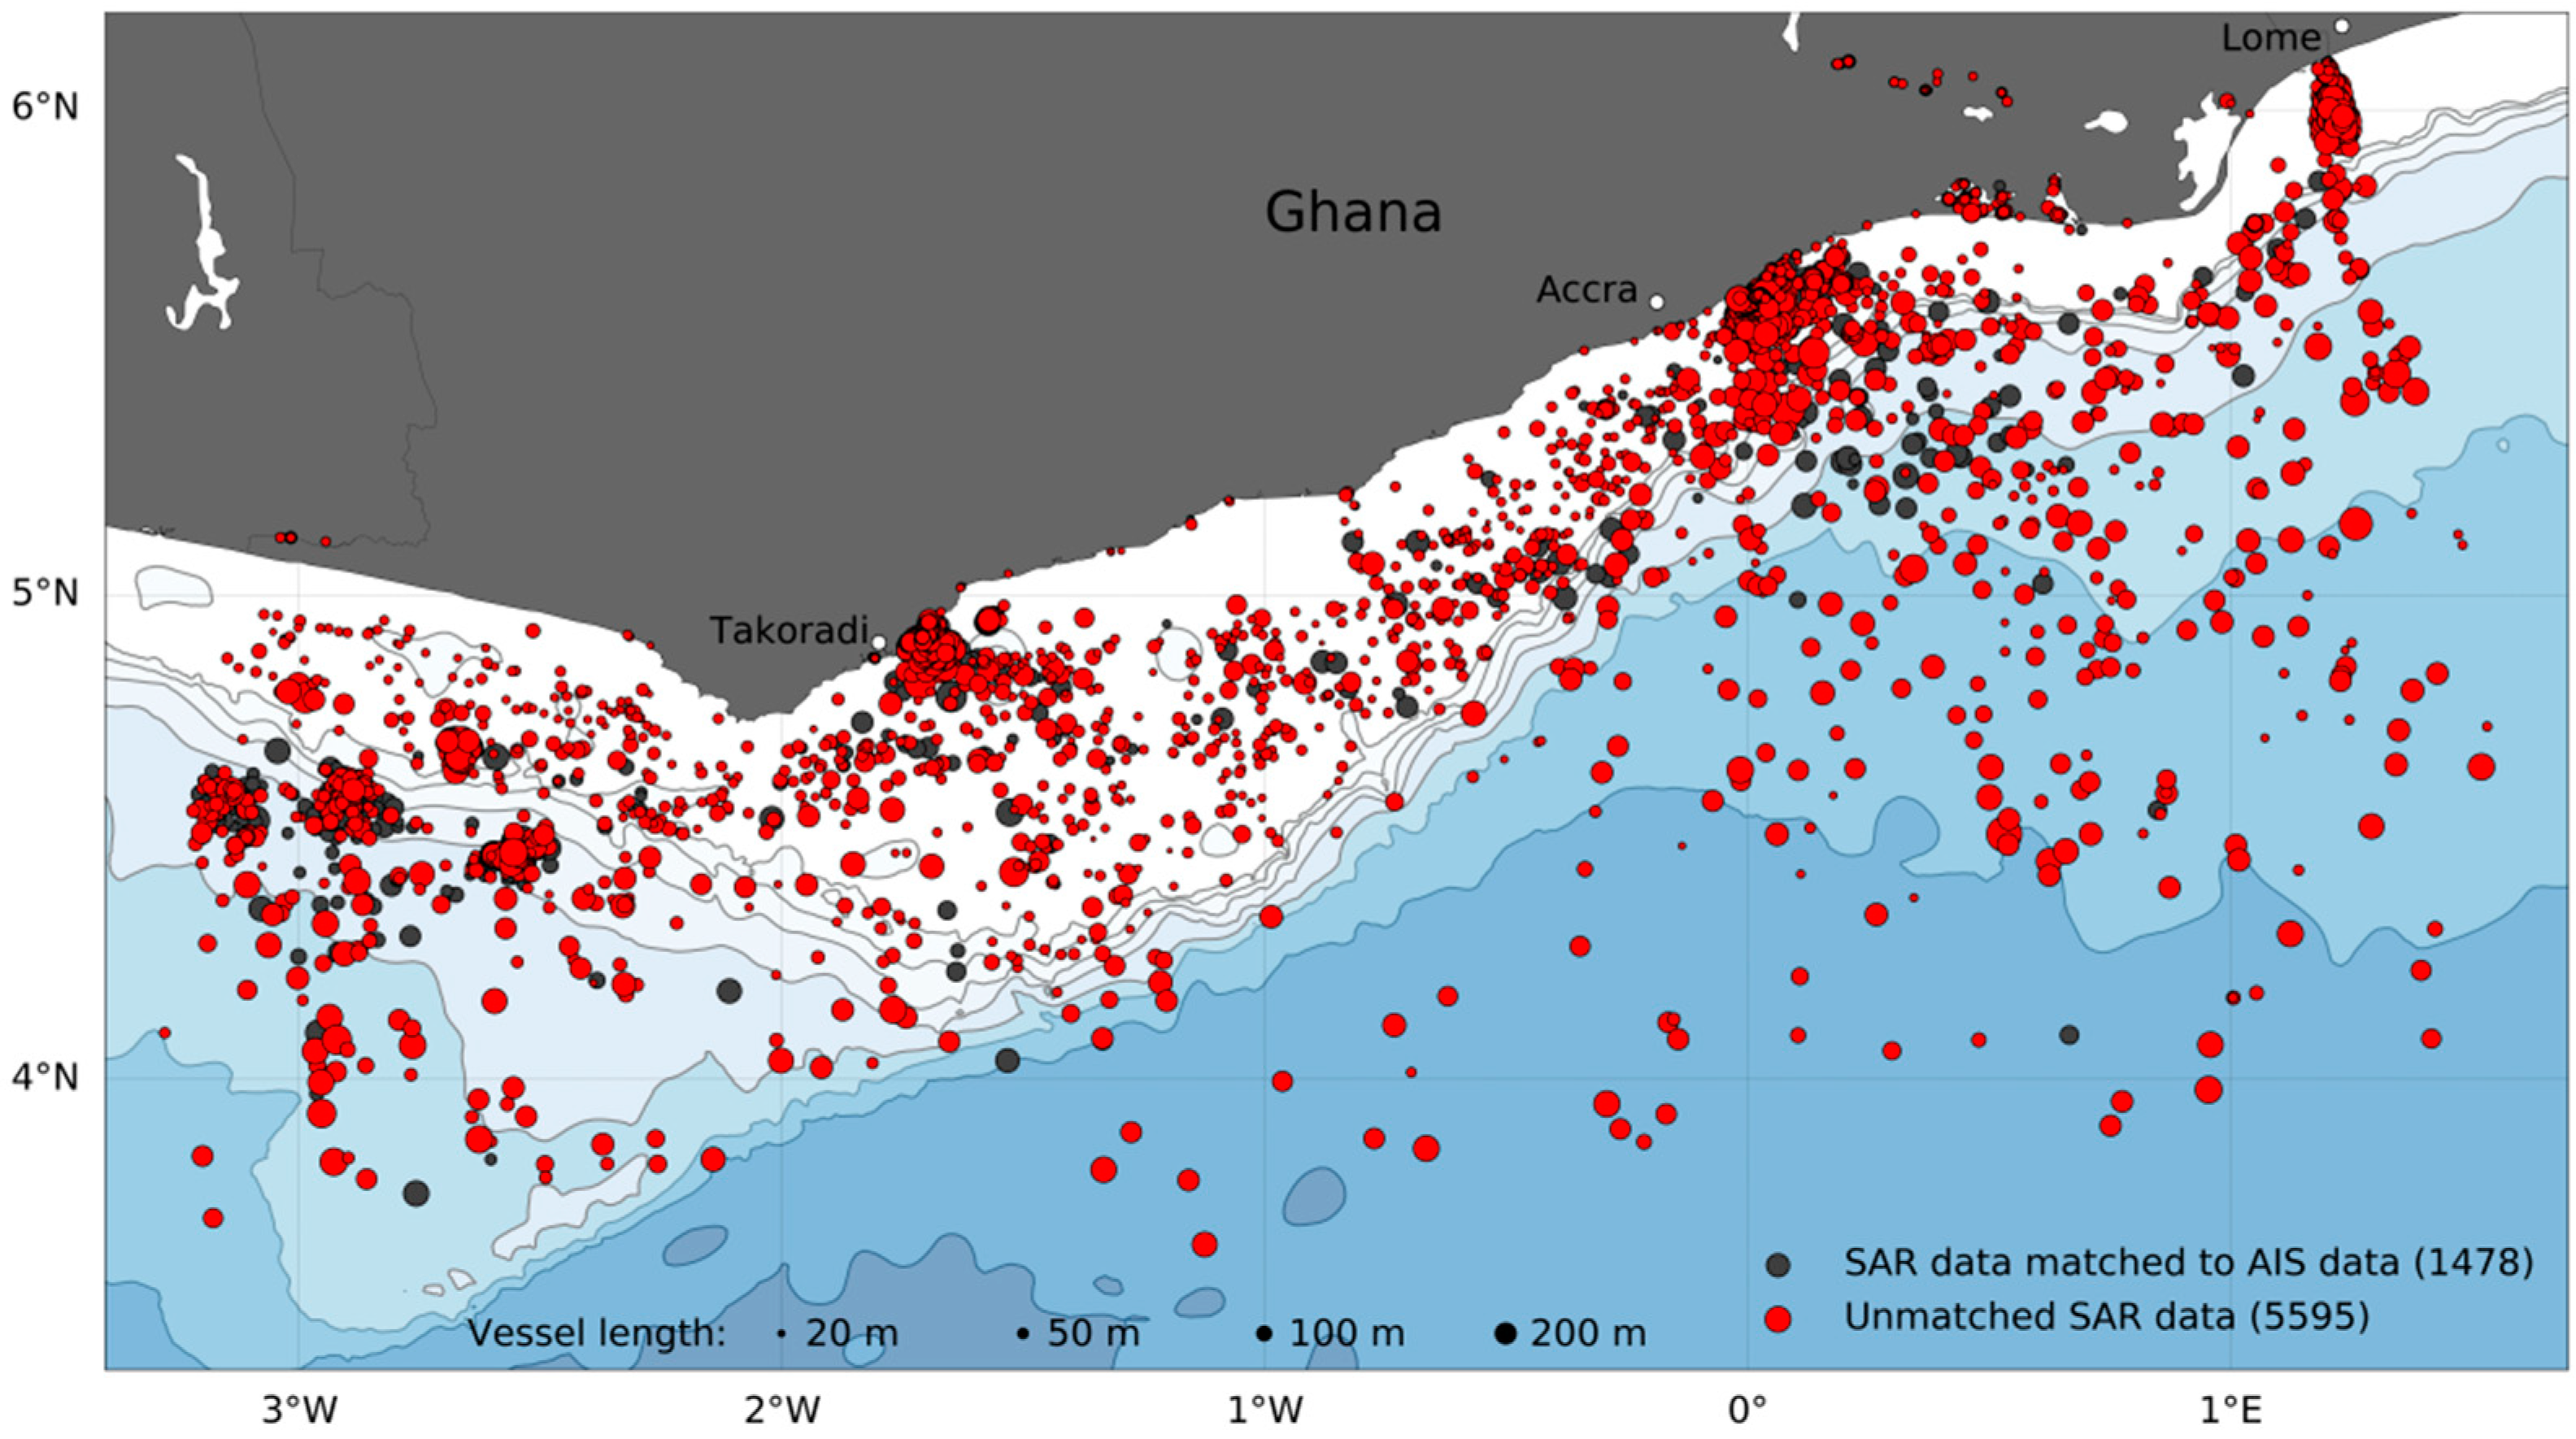
3.2. Long-Term Analysis
3.3. Discrimination of Fishing Vessels in SAR Images
3.4. Data Latency
4. Discussion
4.1. Application for Ghanaian Fisheries
4.2. Unmatched Detections
4.3. Technical Challenges and Future Development
5. Conclusions
Author Contributions
Funding
Acknowledgments
Conflicts of Interest
References
- Nunoo, F.; Asiedu, B.; Amador, K.; Belhabib, D.; Lam, V.; Sumaila, R.; Pauly, D. Marine fisheries catches in Ghana: Historic reconstruction for 1950 to 2010 and current economic impacts. Rev. Fish. Sci. Aquacult. 2014, 22, 274–283. [Google Scholar] [CrossRef]
- International Crisis Group. “The Gulf of Guinea: The New Danger Zone”. Africa Report, No. 195. 12 December 2012. Available online: http://www.crisisgroup.org/media/Files/africa/central-africa/195-the-gulf-of-guinea-the-new-danger-zone-english.pdf (accessed on 14 March 2016).
- Environmental Justice Fundation. “Party to the Plunder. Illegal Fishing in Guinea and its links to the EU,” Coalition for Fair Fisheries Arrangements CFFA Report. Available online: http://www.imcsnet.org/imcs/docs/party_to_the_plunder_guinea.pdf (accessed on 14 March 2016).
- Greenpeace. Hope in West Africa ship tour, 2017. Summary of findings. 2017. Available online: http://www.greenpeace.org/africa/Global/africa/Oceans/Hope_In_West_Africa_Tour/publications/HopeinWestAfricashiptour_finalbriefing.pdf (accessed on 20 October 2018).
- FAO. Fishery and Aquaculture Country Profiles. Ghana. Country Profile Fact Sheets; FAO Fisheries and Aquaculture Department: Rome, Italy, 2016; Available online: http://www.fao.org/fishery/ (accessed on 22 October 2018).
- Balduzzi, M.; Pasta, A.; Wilhoit, K. A security evaluation of AIS automated identification system. In Proceedings of the 30th Annual Computer Security Applications Conference, New Orleans, LA, USA, 8–12 December 2014; pp. 436–445. [Google Scholar]
- Crisp, D.J. The State-Of-The-Art in Ship Detection in Synthetic Aperture Radar Imagery; Defence Science and Technology Organisation DSTO Information Sciences Laboratory: Edinburgh, South Australia, Research Report DSTO-RR-0272; May 2004; 116p.
- Daniel, B.J.; Schaum, A.P.; Allman, E.C.; Leathers, R.A.; Downes, T.V. Automatic ship detection from commercial multispectral satellite imagery. In Algorithms and Technologies for Multispectral, Hyperspectral, and Ultraspectral Imagery XIX; International Society for Optics and Photonics: Baltimore, MA, USA, 2013; Volume 8743. [Google Scholar] [CrossRef]
- Greidanus, H.; Alvarez, M.; Santamaria, C.; Thoorens, F.X.; Kourti, N.; Argentieri, P. The SUMO Ship Detector Algorithm for Satellite Radar Images. Remote Sens. 2017, 9, 246. [Google Scholar] [CrossRef]
- EMSA European Maritime Safety Agency. Copernicus Maritime Surveillance—Service Overview. Available online: http://emsa.europa.eu/news-a-press-centre/external-news/item/2880-copernicus-maritime-surveillance-service-overview.html (accessed on 09 October 2018).
- Santamaria, C.; Alvarez, M.; Greidanus, H.; Syrris, V.; Soille, P.; Argentieri, P. Mass Processing of Sentinel-1 Images for Maritime Surveillance. Remote Sens. 2017, 9, 678. [Google Scholar] [CrossRef]
- Voinov, S.; Schwarz, E.; Krause, D.; Berg, M. Identification of SAR Detected Targets on Sea in Near Real Time Applications for Maritime Surveillance. In Proceedings of the Free and Open Source Software for Geospatial (FOSS4G) Conference, Bonn, Germany, 22–26 August 2016; Volume 16, pp. 40–48. [Google Scholar]
- Mazzarella, F.; Vespe, M.; Santamaria, C. SAR ship detection and self-reporting data fusion based on traffic knowledge. IEEE Geosci. Remote Sens. Lett. 2015, 12, 1685–1689. [Google Scholar] [CrossRef]
- Pan, Z.; Liu, L.; Qiu, X.; Lei, B. Fast vessel detection in Gaofen-3 SAR Images with Ultrafine Strip-Map Mode. Sensors 2017, 17, 1578. [Google Scholar] [CrossRef] [PubMed]
- Kanjir, U.; Greidanus, H.; Oštir, K. Vessel detection and classification from spaceborne optical images: A literature survey. Remote Sens. Environ. 2018, 207, 1–26. [Google Scholar] [CrossRef] [PubMed]
- El-Darymli, K.; McGuire, P.; Power, D.; Moloney, C. Target detection in synthetic aperture radar imagery: A state-of-the-art survey. J. Appl. Remote Sens. 2013, 7, 071598. [Google Scholar] [CrossRef]
- MPC. Thermal Denoising of Products Generated by the S-1 IPF, Technical Report DI-MPC-IPFDPM, S-1 Mission Performance Centre, European Space Agency. 2017. Available online: https://sentinel.esa.int/documents/247904/2142675/Thermal-Denoising-of-Products-Generated-by-Sentinel-1-IPF (accessed on 3 December 2018).
- Sentinel 1 Toolbox | STEP. Available online: http://step.esa.int/main/toolboxes/sentinel-1-toolbox/ (accessed on 11 September 2017).
- Soille, P. Morphological Image Analysis: Principles and Applications; Springer Science & Business Media: Boston, NY, USA, 2013. [Google Scholar]
- Otsu, N. A threshold selection method from gray-level histograms. IEEE Trans. Syst, Man. Cyber. 1979, 9, 62–66. [Google Scholar] [CrossRef]
- Ulaby, F.T.; Moore, R.K.; Fung, A.K. Microwave Remote Sensing Active and Passive-Volume II: Radar Remote Sensing and Surface Scattering and Emission Theory; Artech House: Norwood, MA, USA, 1982; ISBN 0890061912. [Google Scholar]
- Oliver, C.; Quegan, S. Understanding Synthetic Aperture Radar Images; SciTech Publishing: Boston, MA, USA, 2004; 510p. [Google Scholar]
- Arnesen, H.; Tonje, N. Multi-channel and multi-polarisation ship detection. In Proceedings of the IGARSS 2012, Munich, Germany, 22–27 July 2012. [Google Scholar]
- Gao, G.; Shi, G.; Zhou, S. Ship detection in high-resolution dual-polarization SAR amplitude images. Int. J. Antennas Propag. 2013. [Google Scholar] [CrossRef]
- Hu, M.-K. Visual pattern recognition by moment invariants. IRE Trans. Inf. Theory 1962, 8, 179–187. [Google Scholar]
- Wang, C.; Zhang, H.; Wu, F.; Jiang, S.; Zhang, B.; Tang, Y. A novel hierarchical ship classifier for COSMO-SkyMed SAR data. IEEE Geosci. Remote Sens. Lett. 2014, 11, 484–488. [Google Scholar] [CrossRef]
- Morse, A.J.; Protheroe, M.A. Vessel classification as part of an automated vessel traffic monitoring system using SAR data. Int. J. Remote Sens. 1997, 18, 2709–2712. [Google Scholar] [CrossRef]
- Dougherty, E.R. Nonlinear Filters for Image Processing; SPIE Press: Bellingham, WA, USA, 1999. [Google Scholar]
- Louis, J.; Debaecker, V.; Pflug, B.; Main-Knorn, M.; Bieniarz, J.; Muller-Wilm, U.; Cadau, E.; Gascon, F. Sentinel-2 Sen2cor: L2A Processor for Users. In Proceedings of the ESA Living Planet Symposium, Prague, Czech Republic, 9–13 May 2016. [Google Scholar]
- Dörnhöfer, K.; Göritz, A.; Gege, P.; Pflug, B.; Oppelt, N. Water constituents and water depth retrieval from Sentinel-2A—A first evaluation in an oligotrophic lake. Remote Sens. 2016, 8, 941. [Google Scholar] [CrossRef]
- Reed, I.S.; Yu, X. Adaptive multiband CFAR detection of an optical pattern with unknown spectral distribution. IEEE Trans. Acoustics Speech Signal Process. 1990, 38, 1760–1770. [Google Scholar] [CrossRef]
- Schaum, A. Hyperspectral anomaly detection beyond RX. Proc. SPIE 2007, 656502. [Google Scholar] [CrossRef]
- Schaum, A. Theoretical foundations of NRL spectral target detection algorithms. Appl. Opt. 2015, 54, 286–297. [Google Scholar] [CrossRef] [PubMed]
- Yuksel, C.; Schaefer, S.; Keyser, J. On the parameterization of Catmull-Rom curves. In Proceedings of the SIAM/ACM Joint Conference on Geometric and Physical Modeling, San Diego, CA, USA, 5–8 October 2009; pp. 47–53. [Google Scholar]
- Kroodsma, D.A.; Mayorga, J.; Hochberg, T.; Miller, N.A.; Boerder, K.; Ferretti, F.; Wilson, A.; Bergman, B.; White, T.D.; Block, B.A.; et al. Tracking the global footprint of fisheries. Science 2018, 359, 904–908. [Google Scholar] [CrossRef] [PubMed]
- UNCTAD. Review of Maritime Transport. In Proceedings of the United Nations Conference on Trade and Development, Belgrade, Serbia, 2–6 July 2016. [Google Scholar]
- Mensah, M.A.; Koranteng, K.A.; Bortey, A.; Yeboah, D.A. The State of World Fisheries from a Fishworker Perspective: The Ghanaian Situation. SAMUDRA Monograph; International Collective in Support of Fishworkers: Chennai, India; 89p, ISBN 81 902957 4 8.
- Koranteng, K.A. The Impacts of Environmental Forcing on the Dynamics of Demersal Fishery Resources of Ghana. Ph.D. Thesis, University of Warwick, Coventry, UK, 1998. [Google Scholar]
- Wiafe, G.; Nyadjro, E.S. Satellite observations of upwelling in the Gulf of Guinea. IEEE Geosci. Remote Sens. Lett. 2015, 12, 1066–1070. [Google Scholar] [CrossRef]
- Ford, J.H.; Peel, D.; Kroodsma, D.; Hardesty, B.D.; Rosebrock, U.; Wilcox, C. Detecting suspicious activities at sea based on anomalies in Automatic Identification Systems transmissions. PLoS ONE 2018, 13, e0201640. [Google Scholar] [CrossRef]
- Agyekum, K.A.; Wiafeg, G.; Nunoo, F.K.E. Mapping of potential fishing zone in support of fisheries management in West Africa. College of Basic and Applied Science. Sci. Dev. J. 2018, in press. [Google Scholar]
- Boerder, K.; Miller, N.A.; Worm, B. Global hot spots of transhipment of fish catch at sea. Sci. Adv. 2018, 4, eaat7159. [Google Scholar] [CrossRef]


| Sensor | Sentinel-1A | Sentinel-1B | Sentinel-2A | Sentinel-2B |
|---|---|---|---|---|
| Mode | Interferometric Wide | Interferometric Wide | - | - |
| Product | high-resolution ground range detected (GRDH) | GRDH | Multispectral Instrument Level-1C (MSI1C) | MSI1C |
| Swath | 250 km | 250 km | 290 km | 290 km |
| Resolution | 20 × 20 m | 20 × 20 m | 10, 20, 60 m | 10, 20, 60 m |
| Polarisation | VV + VH | VV + VH | - | - |
| Bands | - | - | 13 bands | 13 bands |
| Orbit | Ascending | Ascending | Descending | Descending |
| Revisit period | 12 days | 12 days | 10 days | 10 days |
| Local time of acquisition | 18:10 | 18:20 | 10:20 | 10:30 |
| Parameter | Score |
|---|---|
| Vessels with AIS | 1924 |
| Vessels detected in SAR | 1742 |
| SAR detections missed | 182 |
| Percentage detection success (%) | 91 |
| Median distance between AIS/SAR detections (m) | 100 |
© 2019 by the authors. Licensee MDPI, Basel, Switzerland. This article is an open access article distributed under the terms and conditions of the Creative Commons Attribution (CC BY) license (http://creativecommons.org/licenses/by/4.0/).
Share and Cite
Kurekin, A.A.; Loveday, B.R.; Clements, O.; Quartly, G.D.; Miller, P.I.; Wiafe, G.; Adu Agyekum, K. Operational Monitoring of Illegal Fishing in Ghana through Exploitation of Satellite Earth Observation and AIS Data. Remote Sens. 2019, 11, 293. https://doi.org/10.3390/rs11030293
Kurekin AA, Loveday BR, Clements O, Quartly GD, Miller PI, Wiafe G, Adu Agyekum K. Operational Monitoring of Illegal Fishing in Ghana through Exploitation of Satellite Earth Observation and AIS Data. Remote Sensing. 2019; 11(3):293. https://doi.org/10.3390/rs11030293
Chicago/Turabian StyleKurekin, Andrey A., Benjamin R. Loveday, Oliver Clements, Graham D. Quartly, Peter I. Miller, George Wiafe, and Kwame Adu Agyekum. 2019. "Operational Monitoring of Illegal Fishing in Ghana through Exploitation of Satellite Earth Observation and AIS Data" Remote Sensing 11, no. 3: 293. https://doi.org/10.3390/rs11030293
APA StyleKurekin, A. A., Loveday, B. R., Clements, O., Quartly, G. D., Miller, P. I., Wiafe, G., & Adu Agyekum, K. (2019). Operational Monitoring of Illegal Fishing in Ghana through Exploitation of Satellite Earth Observation and AIS Data. Remote Sensing, 11(3), 293. https://doi.org/10.3390/rs11030293