Article

Simulating Land Cover Change Impacts on Groundwater Recharge under Selected Climate Projections, Maui, Hawaiʻi

1
The East-West Center, 1601 East West Rd, Honolulu, HI 96848, USA
2
United States Geological Survey Pacific Islands Water Science Center, 1845 Wasp Blvd. B176, Honolulu, HI 96818, USA
*
Author to whom correspondence should be addressed.
Remote Sens. 2019, 11(24), 3048; https://doi.org/10.3390/rs11243048
Submission received: 31 October 2019 / Revised: 6 December 2019 / Accepted: 8 December 2019 / Published: 17 December 2019
(This article belongs to the Special Issue Remote Sensing of Human-Environment Interactions)

Abstract

:
This project developed an integrated land cover/hydrological modeling framework using remote sensing and geographic information systems (GIS) data, stakeholder input, climate information and projections, and empirical data to estimate future groundwater recharge on the Island of Maui, Hawaiʻi, USA. End-of-century mean annual groundwater recharge was estimated under four future land cover scenarios: Future 1 (conservation-focused), Future 2 (status-quo), Future 3 (development-focused), and Future 4 (balanced conservation and development), and two downscaled climate projections: a coupled model intercomparison project (CMIP) phase 5 (CMIP5) representative concentration pathway (RCP) 8.5 “dry climate” future and a CMIP3 A1B “wet climate” future. Results were compared to recharge estimated using the 2017 baseline land cover to understand how changing land management and climate could influence groundwater recharge. Estimated recharge increased island-wide under all future land cover and climate combinations and was dominated by specific land cover transitions. For the dry future climate, recharge for land cover Futures 1 to 4 increased by 12%, 0.7%, 0.01%, and 11% relative to 2017 land cover conditions, respectively. Corresponding increases under the wet future climate were 10%, 0.9%, 0.6%, and 9.3%. Conversion from fallow/grassland to diversified agriculture increased irrigation, and therefore recharge. Above the cloud zone (610 m), conversion from grassland to native or alien forest led to increased fog interception, which increased recharge. The greatest changes to recharge occurred in Futures 1 and 4 in areas where irrigation increased, and where forest expanded within the cloud zone. Furthermore, new future urban expansion is currently slated for coastal areas that are already water-stressed and had low recharge projections. This study demonstrated that a spatially-explicit scenario planning process and modeling framework can communicate the possible consequences and tradeoffs of land cover change under a changing climate, and the outputs from this study serve as relevant tools for landscape-level management and interventions.

Graphical Abstract

1. Introduction

Water resource managers, urban planners, conservation organizations, and agricultural producers in Hawaiʻi, USA, are faced with making decisions in a changing natural environment. Ecosystems and communities in this remote, Pacific archipelago are already experiencing multiple impacts from climate change. Mean annual air temperatures warmed at a rate of 0.043 °C per decade during 1919 and 2006 [1], and 2015 and 2016 were the warmest years on record [2]. Warming temperatures can increase both evaporation and water demand, which can negatively affect groundwater recharge and storage. Furthermore, annual rainfall has trended downwards across more than 90% of the main Hawaiian Islands [3]. On the other hand, despite long-term drying trends, more consecutive wet days and heavy rainfall events are increasingly common across the state [4].
Hawaiʻi’s freshwater resources are directly impacted by changes in land cover, temperature, rainfall, and streamflow uses [5,6]. Groundwater provides 99% of the state’s drinking water for residential and commercial use and about 50% of all freshwater used in the state. A century of streamflow observations in Hawaiʻi has shown a significant decrease in baseflow of about 0.2% to 0.5% per year [7], which suggests a decrease in groundwater recharge and storage that is coincident with downward trends in rainfall. Land cover change in Hawaiʻi can also affect processes that influence groundwater recharge, including cloud-water interception, net precipitation, infiltration, direct runoff, and transpiration [8,9,10,11,12,13,14,15,16,17,18,19,20,21].
On the Island of Maui, the history of modern freshwater concerns dates to the 1800s, with streamflow diversions for agriculture competing with traditional uses. Today, Maui has the third-largest population in the state (144,444 permanent residents; [22]) and receives 2.74 million visitors annually [23]. Its diverse geology and ecosystems have made it a world-class tourist destination, but like other island settings globally it is vulnerable to the impacts of a changing climate, including sea-level rise, coral bleaching and acidification, increasing air and sea surface temperatures, and more frequent storms, drought, and flood events [2]. Pressures to develop new hotels, housing, and infrastructure coexist with concerns about the sustainability of food production, water supplies, and other ecosystem services. Water resources in Hawaiʻi are legally held in public trust by the State for the public benefit, yet the many uses of water often lead to conflict. Contested case hearings on streamflow diversions have pitted the commercial sugarcane industry against conservation groups and Native Hawaiian traditional and customary practices, for example [24].
There is a need, therefore, to estimate the effects of plausible land cover changes, projected changes in climate, and increased water demand on Maui’s future groundwater availability to plan for both human and ecological needs. Such estimates are used by the State to calculate sustainable yield values for aquifer systems statewide [25] and are also a critical input to numerical groundwater models, which have been used to help inform decision making by the County of Maui Department of Water Supply and other water resource managers in Hawaiʻi [26,27]. Groundwater recharge can be estimated using a variety of techniques including soil-water balance, surface water, unsaturated zone, and saturated zone models [28,29]. The soil-water balance method is considered a reliable recharge estimation technique for regional-scale groundwater management purposes and, due to its versatility, it can be used to evaluate the effects of climate and/or land cover change across a wide range of space and time scales. Hence, the method has been extensively used in many Pacific Island settings to produce spatially-distributed estimates of groundwater recharge for a variety of climate and land cover conditions [30,31,32,33,34,35,36,37]. On Maui, this approach has been applied to produce spatially-distributed estimates of recharge for a variety of historical land cover conditions, and present-day and future climate scenarios [6,38,39,40].
Between 1870 and 2010, Maui land cover changes were related to the development of sugarcane agriculture, reduction in taro cultivation, development of urbanized areas, reduction of native forest areas, and the spread of alien grassland and forest species [6]. Izuka et al. [6] estimated mean recharge for Maui for 2010 land cover conditions and found that changes in island-wide irrigation and cloud-water interception effectively increased island-wide recharge estimates by 2.2% when compared to 1870 land cover conditions. Mair et al. [40] modified the model used by Izuka et al. [6] to estimate recharge for Maui for the same climate but using 2017 land cover conditions, which reflected the cessation of sugarcane cultivation. This effectively decreased island-wide recharge estimates by 3.7% and 5.8% when compared to 1870 and 2010 land cover conditions, respectively. These results illustrate the effects that historical changes in land cover have had on estimated recharge rates for Maui.
Mair et al. [40] also estimated recharge for Maui for 2017 land cover conditions and two downscaled climate projections but did not consider the effects of future land cover on recharge. However, they noted that such information would be helpful for evaluating the effects of planned development, climate-induced changes in the distribution of forest species, and watershed management and restoration efforts. Moreover, estimating recharge for a range of future land cover conditions can help resource managers assess the extent to which plausible land cover changes can mitigate the projected impacts of a changing climate on groundwater recharge and availability. Landscape-level assessments of potential future groundwater supplies under the influence of climate change could assist natural resource managers in preparing for an uncertain future, but such a comprehensive approach has not yet been applied in the Hawaiian Islands.

1.1. Spatially-Explicit Scenario Planning for Climate Change

Remote sensing and spatial data products offer high-resolution information that can readily be combined with other data sources and incorporated into models for improved landscape change detection, scenario testing, and forecasting. These tools map and project the consequences of alternative management practices, urban development, or agricultural activities on a landscape, which provide useful information for decision-makers, especially when compared to a baseline reference period [41]. Scenario-based approaches lend themselves to the visualization of alternative management opportunities, particularly when linked to the social and ecological processes that influence landscape change [42,43]. Scenario planning can help account for uncertainty about the future by creating informed products that reflect potential management decisions, even by highlighting unexpected or undesirable outcomes. Accomplished through focus groups, interviews, and multi-stakeholder meetings, scenario planning typically begins by defining a set of stories, or narratives, about a system (i.e. freshwater resource supply and demand). Such narratives should be (1) plausible—realistic and believable; (2) challenging—thought-provoking and provocative; (3) relevant—significant and demonstrable; and (4) divergent—different enough from one another to facilitate comparisons [44]. The process proceeds with the development of a conceptual model, including the relevant variables, parameters, and forces of change. At each stage of scenario development, the concepts and narratives are presented back to participants for validation and consistency.
Spatially-explicit scenario assessments have been used in numerous social, economic, environmental, and political contexts to project future urban growth [45,46], inform sustainable agroforestry practices [47], and simulate potential outcomes of national resource policy [48]. This interdisciplinary, participatory approach has also been applied by scholars working in water resources management. For example, the Willamette River Basin in Oregon, USA, has served as a test bed for the Envision multi-agent modeling framework, which links landscape change trajectories to future water availability and consumption according to a suite of contrasting scenario components [49,50,51]. Flügel et al. [52] integrated remote sensing and geographic information with hydrological models for prognostic water resources scenario planning in arid South Africa. In the arid southwestern USA, landscape patterns derived from remote sensing and geospatial data have been used to model and predict future watershed management outcomes [41]. The spatially-explicit scenario planning approach has been further informed by current and future climate information in multiple contexts, such as coral reefs and fisheries [53] and hydrological systems [54], and recent efforts to generate downscaled climate projections for the Hawaiian Islands provide such a research opportunity.
Building on the efforts of Izuka et al. [6] and Mair et al. [40] to model historic and current land cover impacts on recharge in Maui, in this study, the spatial distributions of groundwater recharge and other water-budget components were estimated for a set of plausible future land cover and projected climate conditions. Specific objectives of the study were to: (1) model the effects of future land cover and climate change on Maui’s groundwater recharge; (2) identify the tradeoffs between alternative land management decisions under climate change; and (3) provide information for decision-makers and resource managers in planning for and adapting to the impacts of change.

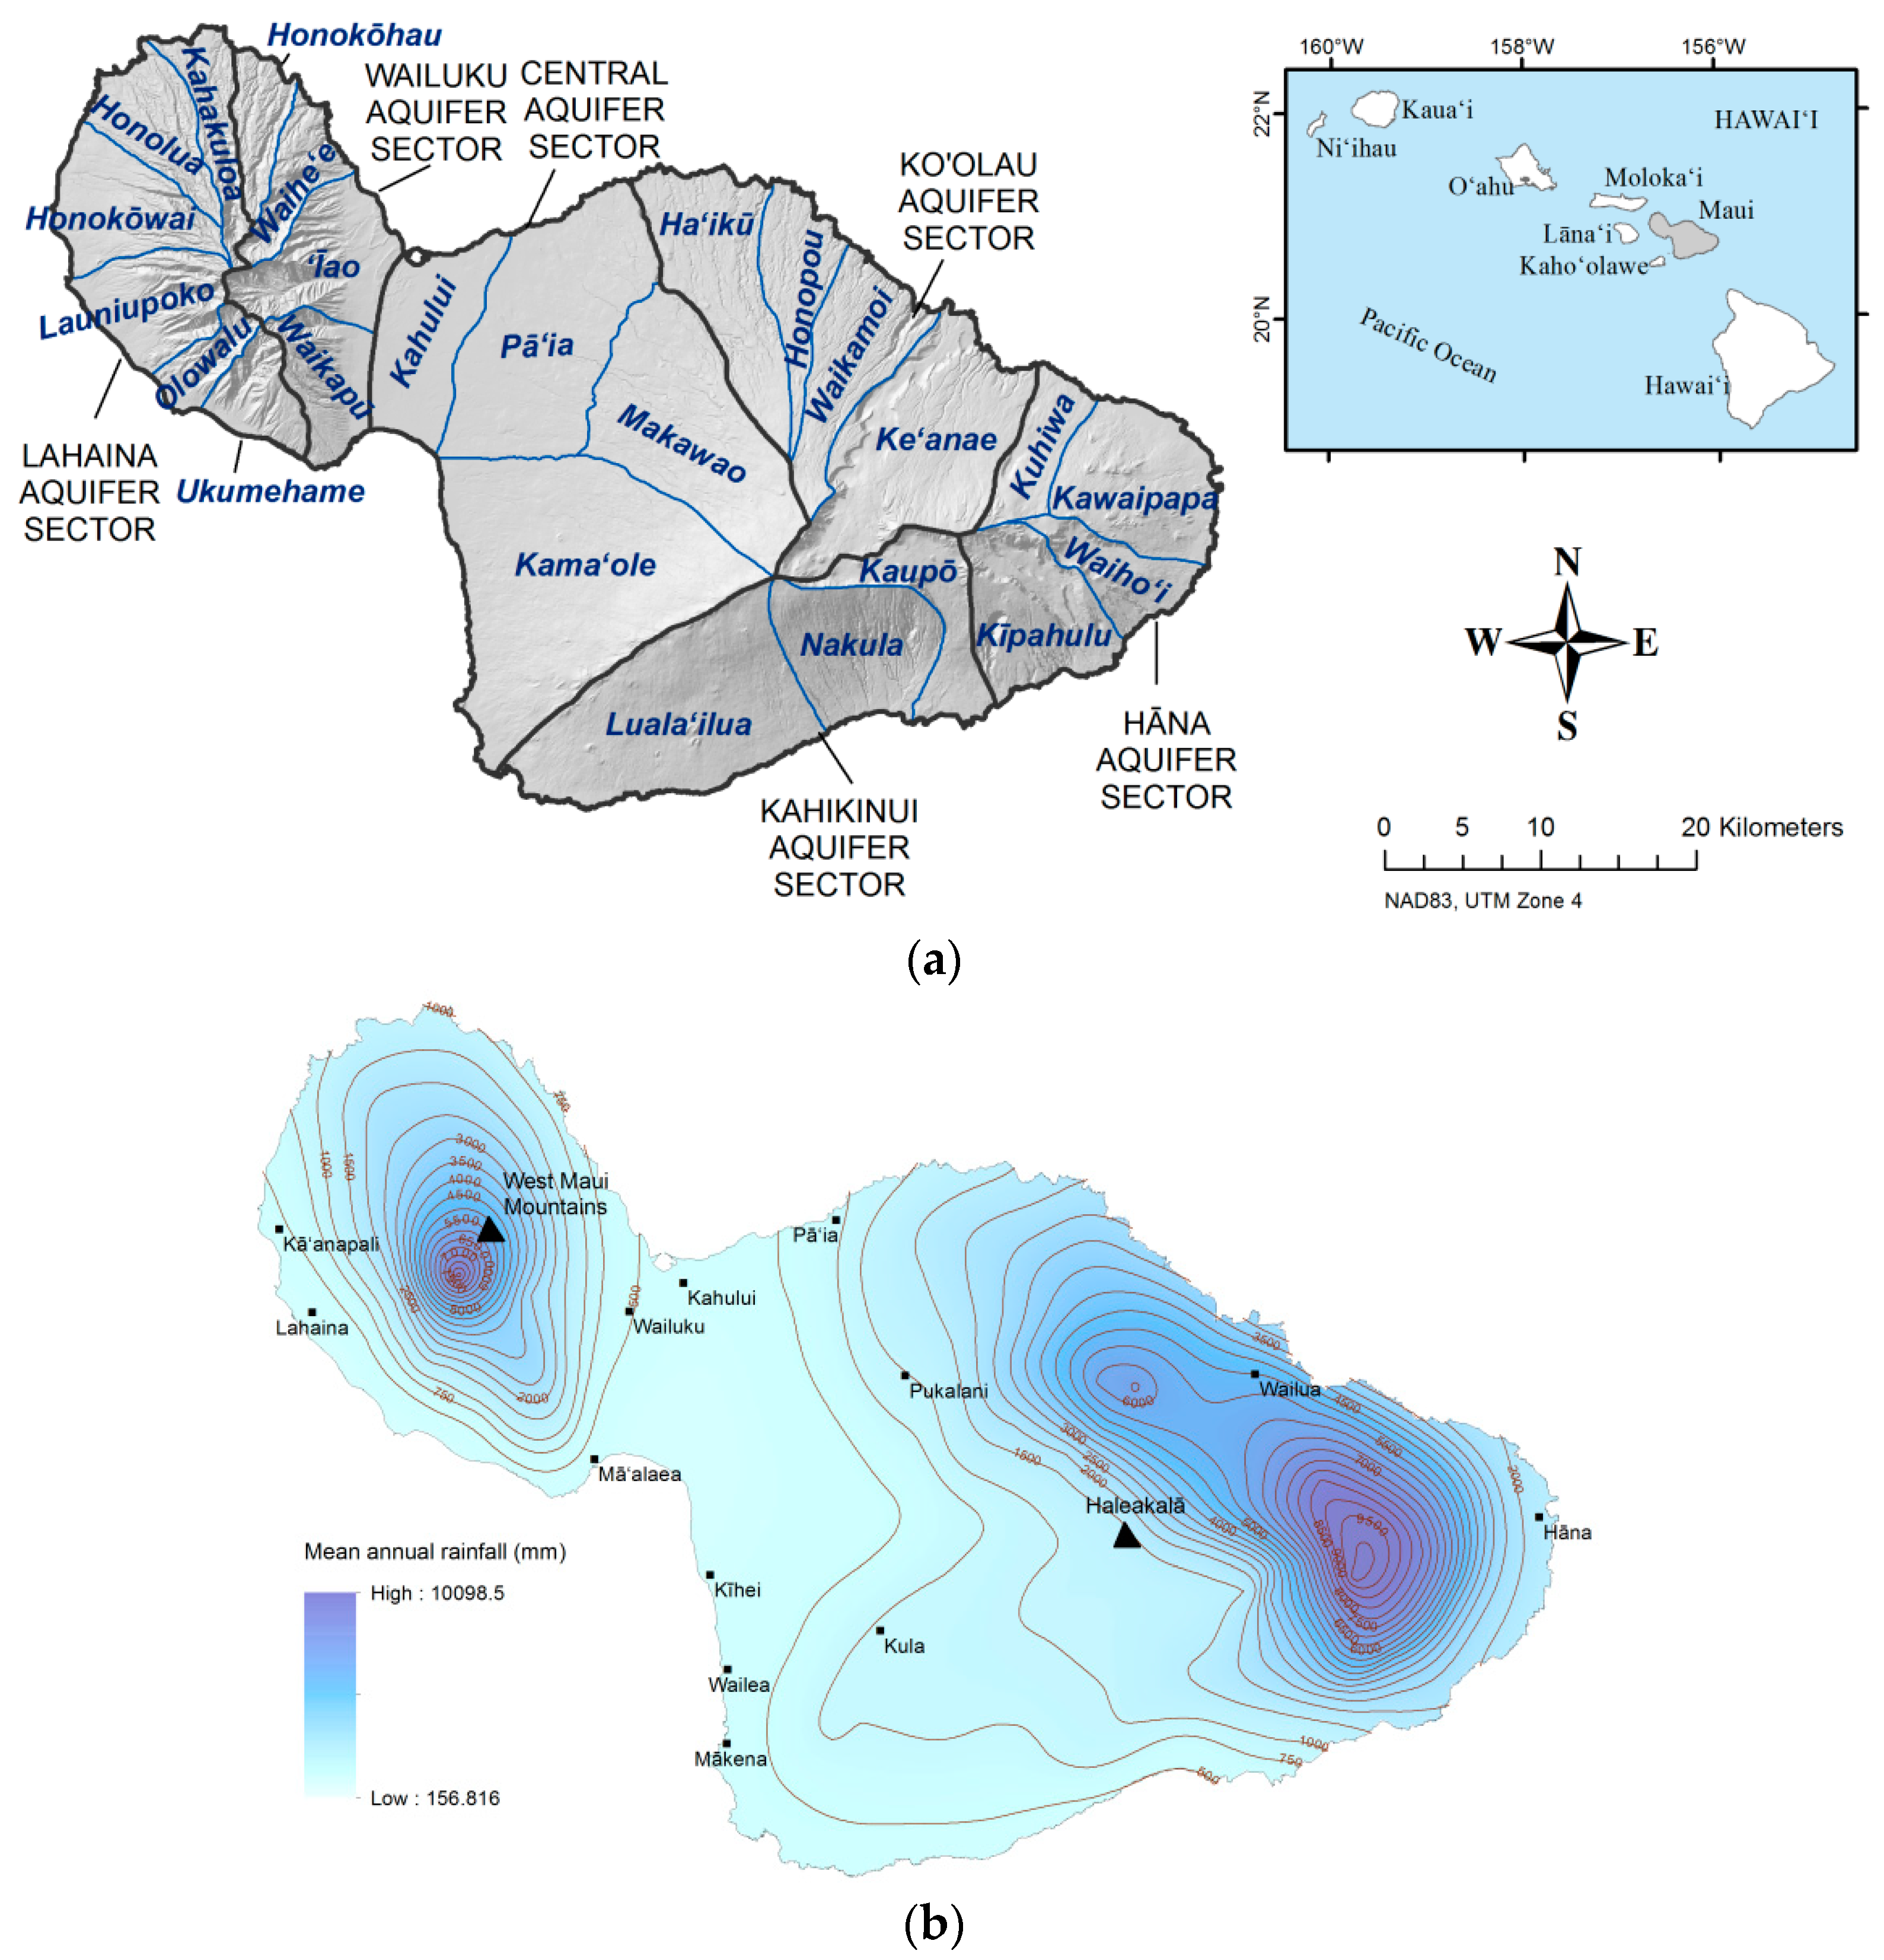
1.2. Background and Study Area

Maui is the second-largest of the main Hawaiian Islands (1836 km2). Climate conditions are spatially variable, ranging from low-elevation, leeward (southwest-facing) areas that receive less than 600 mm/year of rainfall to windward (northeast-facing) areas and the upper slopes of mountains receiving rainfall totals greater than 10,000 mm/year ([55]; Figure 1). The windward slopes above Hāna, in far eastern Maui, are one of the wettest regions in the world.
Land cover on Maui has changed dramatically since ancient Hawaiian settlement due to economic interests in whaling, the sandalwood trade, sugarcane, and most recently tourism [57,58,59,60]. In the west, the coastal region around Lahaina has been extensively developed for resort-based tourism and retains small areas in agricultural production. The dense urban areas of Kahului, Wailuku, and Kīhei are found along the coast in central Maui, which is dominated by a low-lying isthmus that was dedicated to sugarcane cultivation until 2016. Coastal and shoreline areas also incorporate wetlands, seabird habitats, and small dune ecosystems. Moving inland to the middle elevations, dry shrub and grassland ecosystems are found in the leeward areas and ranching and diversified agricultural production extend up the southwestern-facing slopes of east Maui’s Haleakalā Volcano. Many of these areas are still dominated by native forest and are managed by local watershed conservation partnerships, which actively restore native forest species and erect fences to exclude feral ungulate populations from forest resources. Some of the Pacific’s only sub-alpine and alpine ecosystems are found at the highest elevations of Haleakalā, where very little rain falls above the 2150 m trade-wind inversion layer [61].

2. Methods

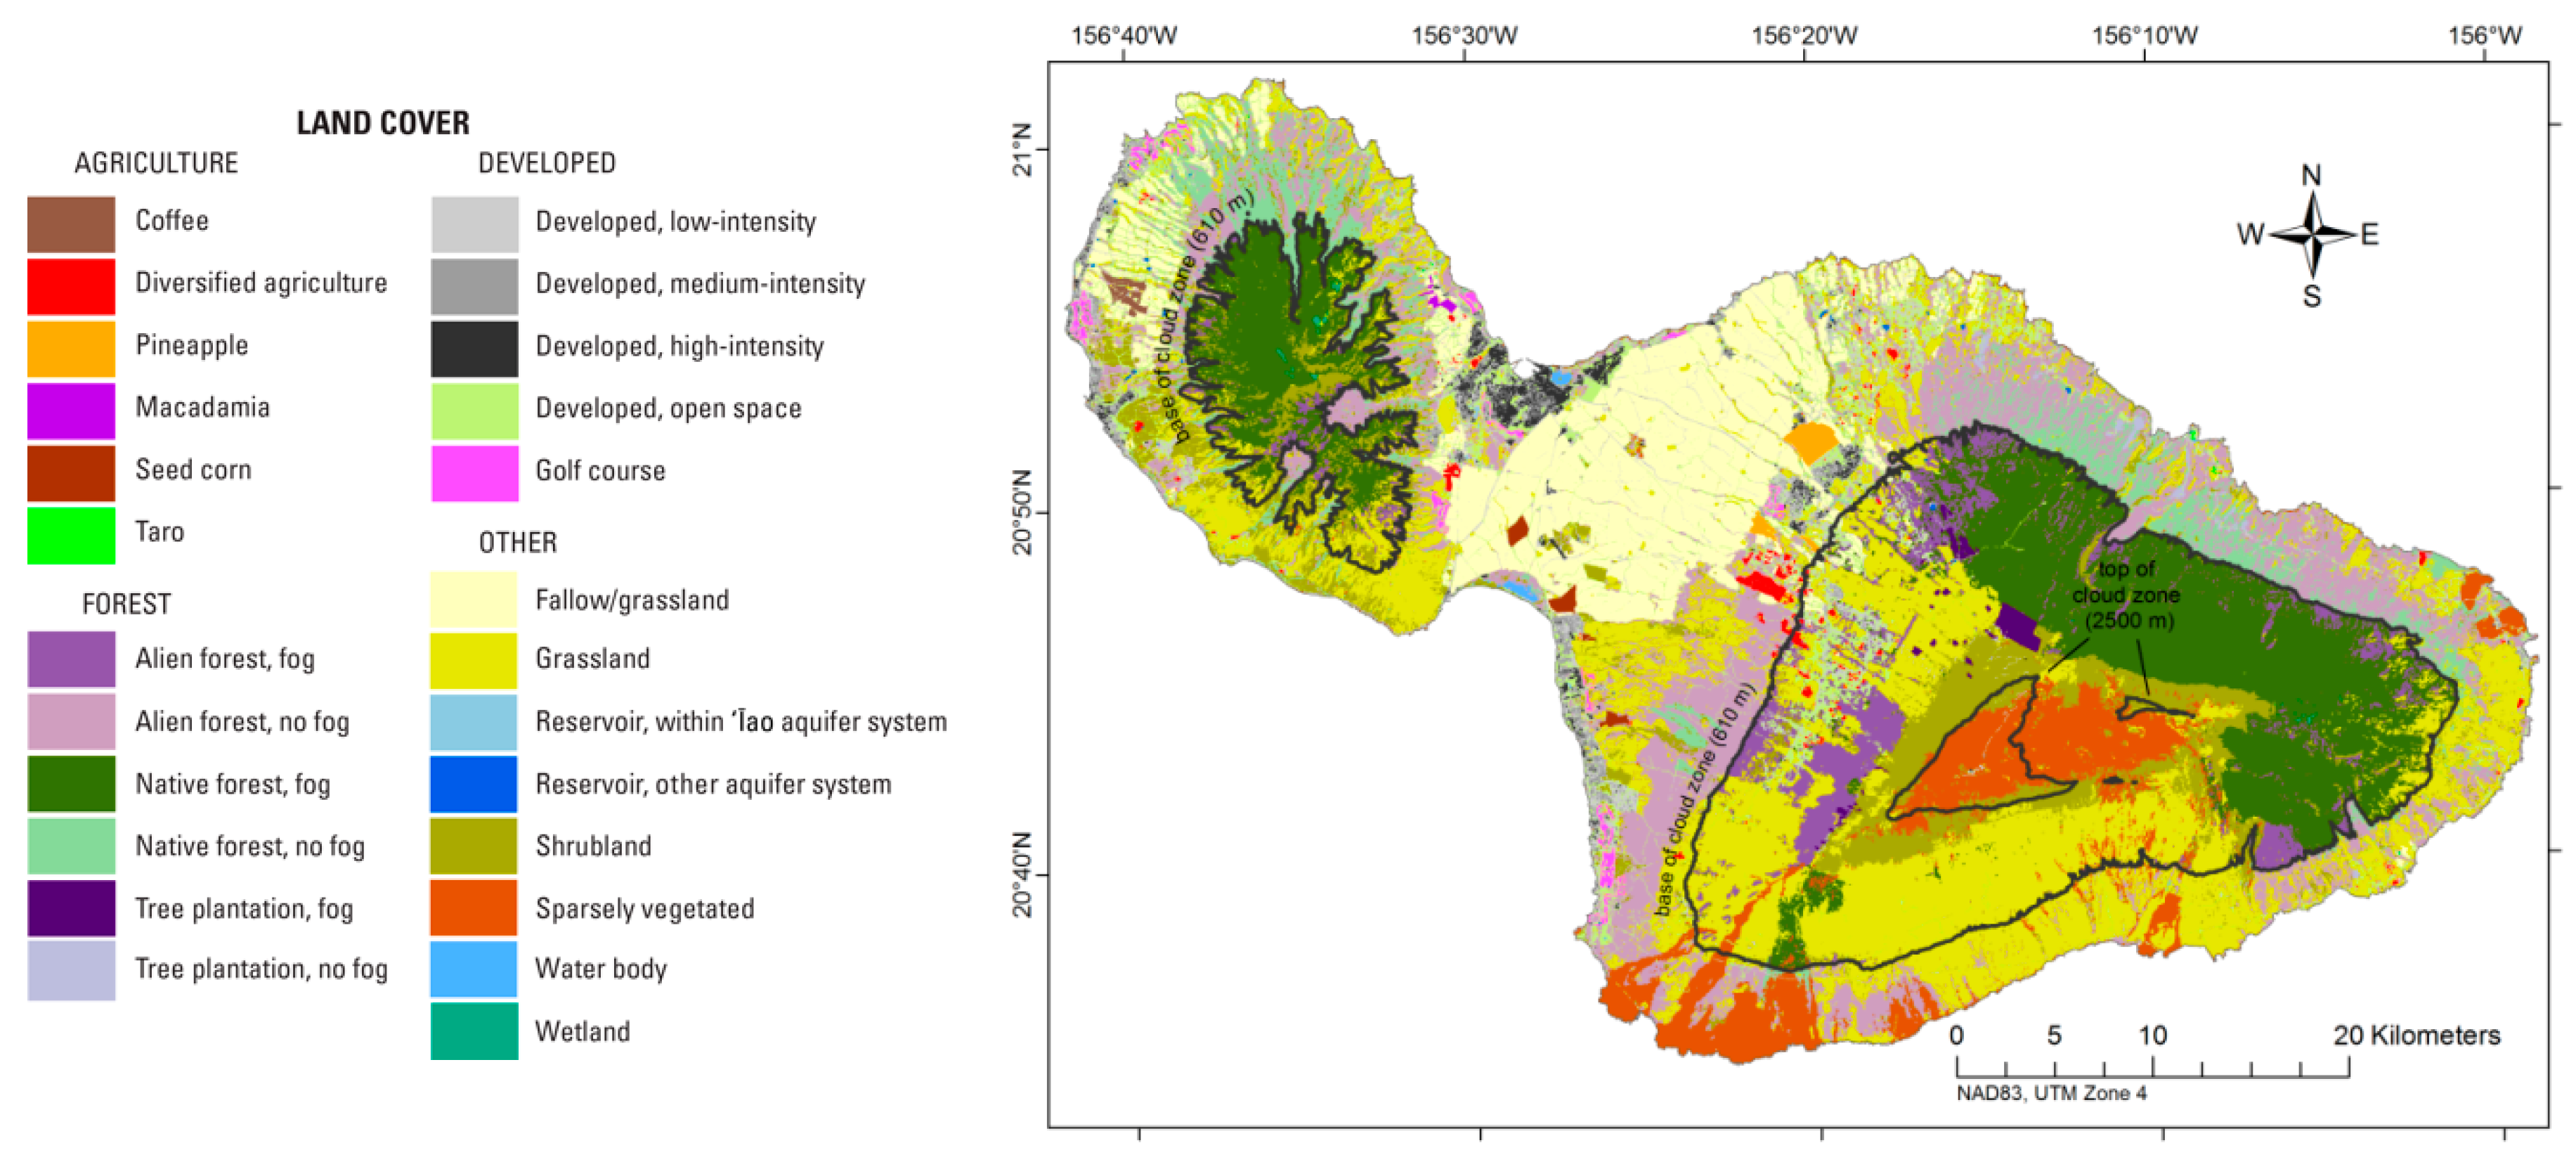
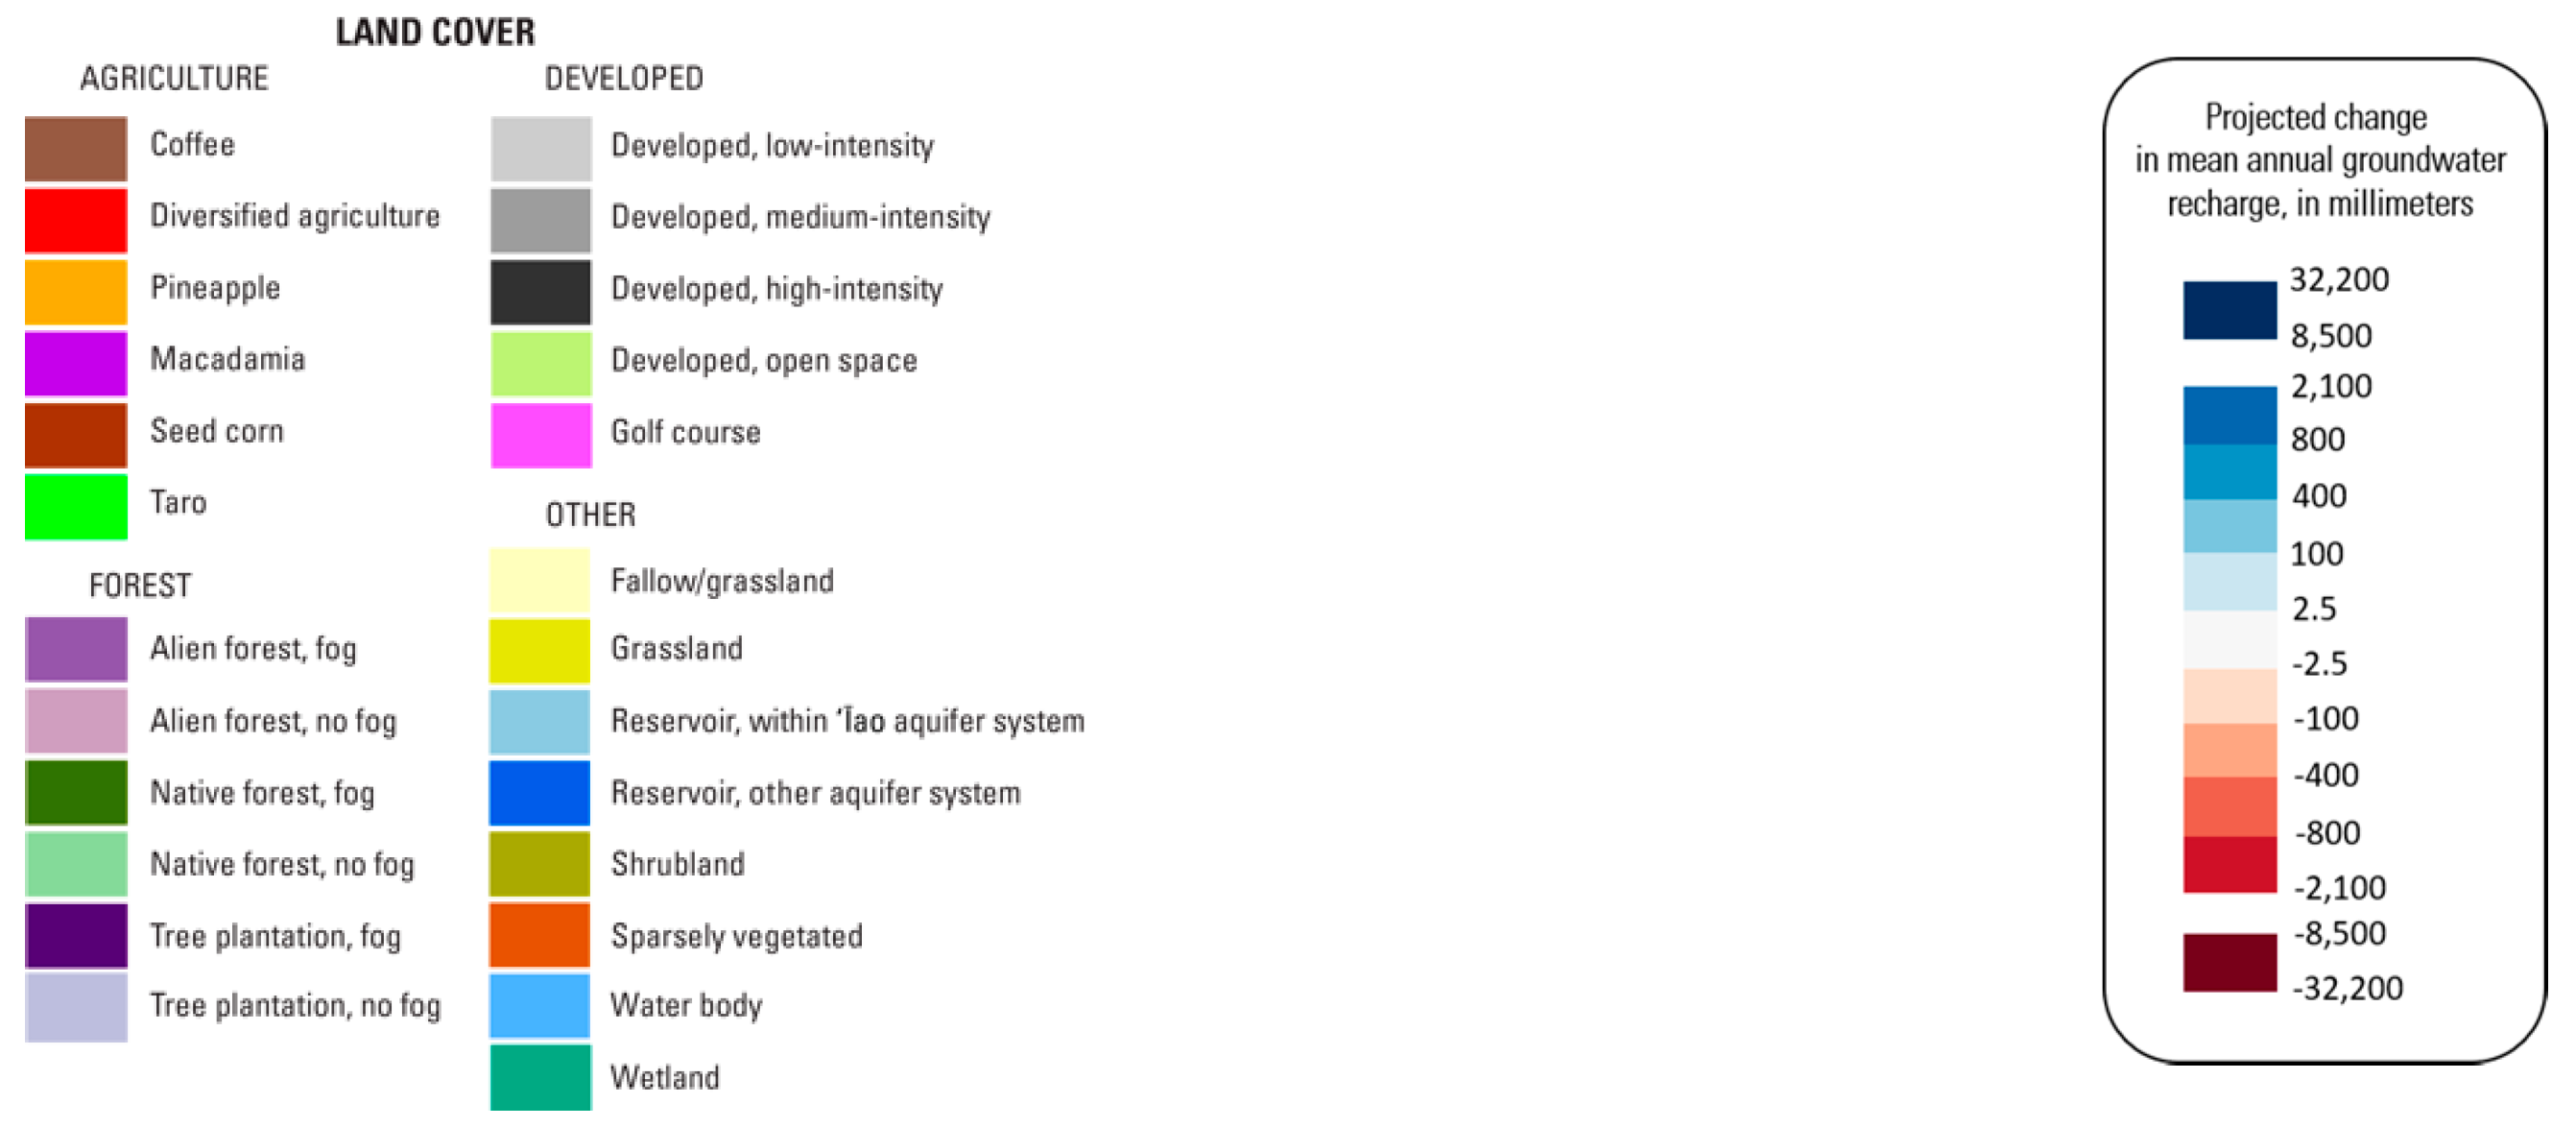
2.1. Current Land Cover

A map of 2017 land cover conditions was developed by Mair [62] to reflect the cessation of sugarcane cultivation in central Maui in December 2016 [63], and information in the 2015 agricultural land use map by the University of Hawaiʻi at Hilo [64] (Figure 2). The 2017 land cover map is a modified version of a 2010 land cover map that was created by merging multiple spatial datasets that characterize the spatial distribution of rainfall, cloud-water (or fog) interception, irrigation, reference evapotranspiration (ET, acronym for evapotranspiration throughout), direct runoff, soil type, and land cover [65]. Land cover designations in the 2010 land cover map were derived mainly from the US Geological Survey Landfire Existing Vegetation Type (EVT) map for the Island of Maui [66]. The Landfire Project uses Landsat imagery over the contiguous and non-contiguous United States to map multiple biophysical parameters, including existing vegetation type, fuel loads, and disturbance, among others. Each dataset has an approximately 30-meter spatial resolution and is updated every two to three years. The Landfire EVT map for the Hawaiian Islands originally contained 21 land cover classes, some of which were combined into generalized categories. New categories reflecting golf courses and agricultural land cover types not included in the Landfire EVT map were delineated using recent satellite imagery, other land cover products, and ancillary GIS data sources. The 2017 land cover map retains the merged structure of the 2010 map but includes later modifications related to agricultural land use. To represent the cessation of sugarcane production on approximately 15,000 ha in central Maui [63], areas represented in the University of Hawaiʻi at Hilo map (2016) as sugarcane were reclassified to fallow/grassland cover. These modifications affected about 10% of the total area in the 2010 land cover map. The 2017 land cover map contains 25 classes corresponding to impervious surfaces, crop varieties, native and alien forest, water bodies, and tree plantations, and was used as the reference land cover condition for this study.

2.2. Future Land Cover Scenarios

The participatory scenario process for this project took place between 2012 and 2014 and involved input from over 100 stakeholders in Hawaiʻi representing local, county, and state-level organizations (for full details of the stakeholder process and outputs, see Brewington et al. [67]). During this process, the research team designed and iteratively refined narratives about future development, agriculture, and natural resource management on Maui, encouraging participants to consider a range of alternative, plausible futures.
Stakeholder input coalesced around four main themes, or decision variables, that were central to Maui land cover: forest conservation, agriculture and ranching, urban development, and freshwater use. Participants were then asked to visualize the relevant scenario narratives by contrasting two of the four decision variables at a time to determine what might be feasible outcomes in the future and how they could be helpful in designing management objectives (e.g., contrasting high and low extremes of forest conservation and urban development). The four resulting narratives were linked to supporting remote sensing and GIS data sources, which were used to render the scenario components into spatial representations of future land cover for the Island of Maui (Table 1). The original maps described in Brewington et al. [67] were later modified to reflect the 2017 land cover map by Mair [62], which also incorporated the cessation of sugarcane from central Maui in 2016 [68].

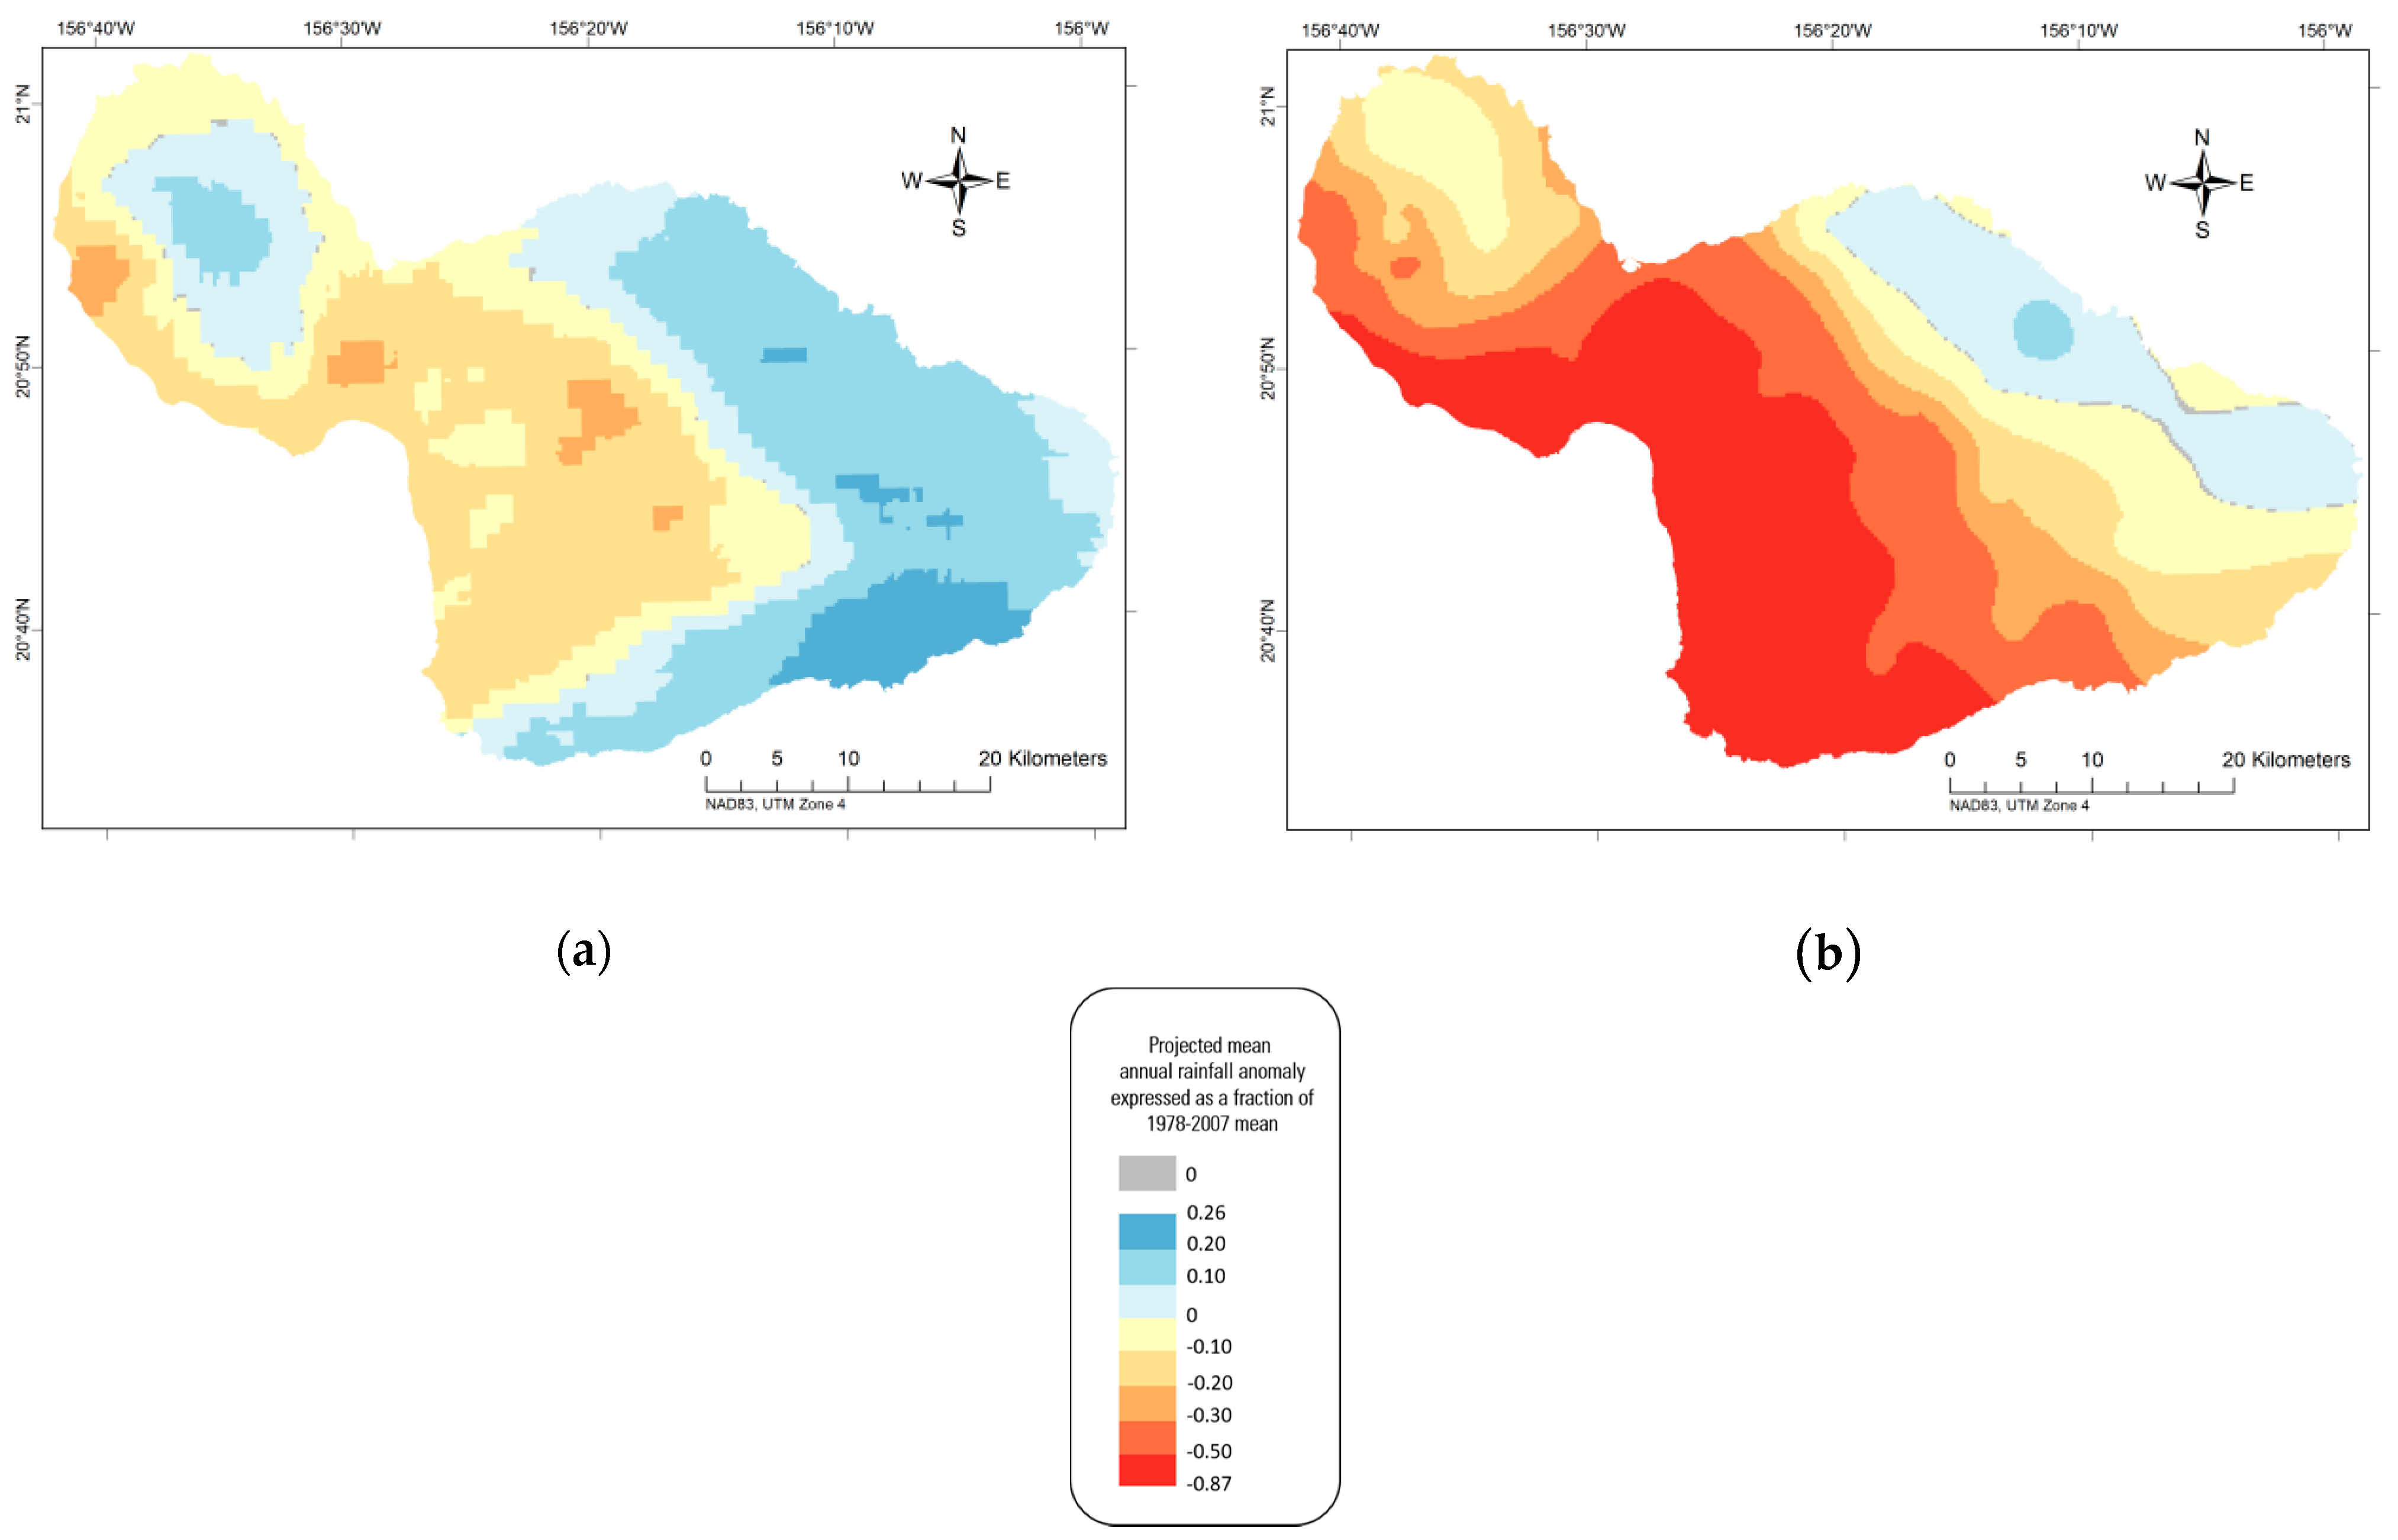
2.3. Downscaled Climate Projections

Small-scale topographic features, such as the Hawaiian Islands, cannot be represented in general circulation models (GCMs) [69]. However, recent downscaling of phases 3 and 5 of the coupled model intercomparison project (CMIP3 and CMIP5) model experiments using dynamical and statistical downscaling approaches has produced mid- and late-21st-century high-resolution climate projection datasets for the Hawaiian Islands [70,71,72]. To capture the range of projected changes in island-wide rainfall, Mair et al. [40] selected two climate projections for water-budget model analyses. The “dry future climate” was developed using a Representative Concentration Pathway warming scenario during 2071–99 with total radiative forcing of 8.5 Watts per square meter by the year 2100 (RCP8.5 2071–99 scenario) [70], whereas the “wet future climate” was developed using a “Special Report on Emissions Scenarios” A1B emission scenario during 2080–99 (A1B 2080–99 scenario) [71,72].
Both future-climate scenarios projected increased rainfall across parts of the windward slopes of Haleakalā along with decreased rainfall across much of central and leeward Maui (Figure 3). The greatest increases occurred along parts of the southeast slope of Haleakalā where mean annual rainfall was projected to increase by as much as 26% for the wet future climate. The greatest decreases occurred near the coastline along the southern part of the Kamaʻole aquifer system where mean annual rainfall was projected to decrease by up to 87% for the dry future climate. However, the two climate projections indicated contrasting drying and wetting for many parts of Maui including the windward areas of West Maui, high-altitude windward areas of Haleakalā, and the southeast areas of Haleakalā. In these areas, projected changes in mean rainfall for the dry climate showed drying, in contrast to wetting under the wet climate. The contrasts in rainfall changes (in both magnitude and direction) across many parts of Maui reflected uncertainty in projected late-21st-century rainfall.
The two climate projections reflected departures from climate conditions during different reference periods (1978–2007 and 1990–2009). Although the reference periods partially overlapped, the 1990–2009 present-day scenario represented a distinctly drier baseline condition compared to the 1978–2007 present-day scenario. The differences in baseline conditions confound comparisons between the published projections. Therefore, Mair et al. [40] used the change-factor method to develop two datasets of future monthly rainfall by adjusting datasets of present-day monthly rainfall [73] with relative change factors derived from each set of climate projections. Next, Mair et al. [40] adjusted the set of relative change factors for the wet future climate to reflect the same 1978–2007 reference period used by the dry future climate. They also used the change-factor approach to develop estimates of the future spatial distribution of the ratio of the mean evaporation rate (E) to mean precipitation rate (R) during saturated conditions, E/R, and future mean monthly reference ET for the wet future climate.

2.4. The Water-Budget Model

Groundwater recharge replenishes aquifers and is derived mainly from precipitation and irrigation that infiltrates the ground surface and percolates beyond the root zone in the soil. For this study, a water-budget analysis was conducted for Maui to estimate the spatial distribution of mean annual groundwater recharge and other water-budget components using the model of Mair et al. [40], hereinafter referred to as the water-budget model. The water-budget model is a modified version of an existing model [6,39] and was designed to simulate the hydrologic processes and physical conditions that affect recharge on Maui. Hydrologic processes simulated by the model include rainfall, fog interception, irrigation, runoff, ET, and groundwater recharge. In this study, changes in land cover mainly affected model calculations for fog interception, irrigation, ET, and groundwater recharge. A description of the model calculations for these processes is presented in Addendum S1 in the Supplementary Material, with associated model parameters (Tables S1 and S2) and mean annual water-budget components (Table S3).

3. Results

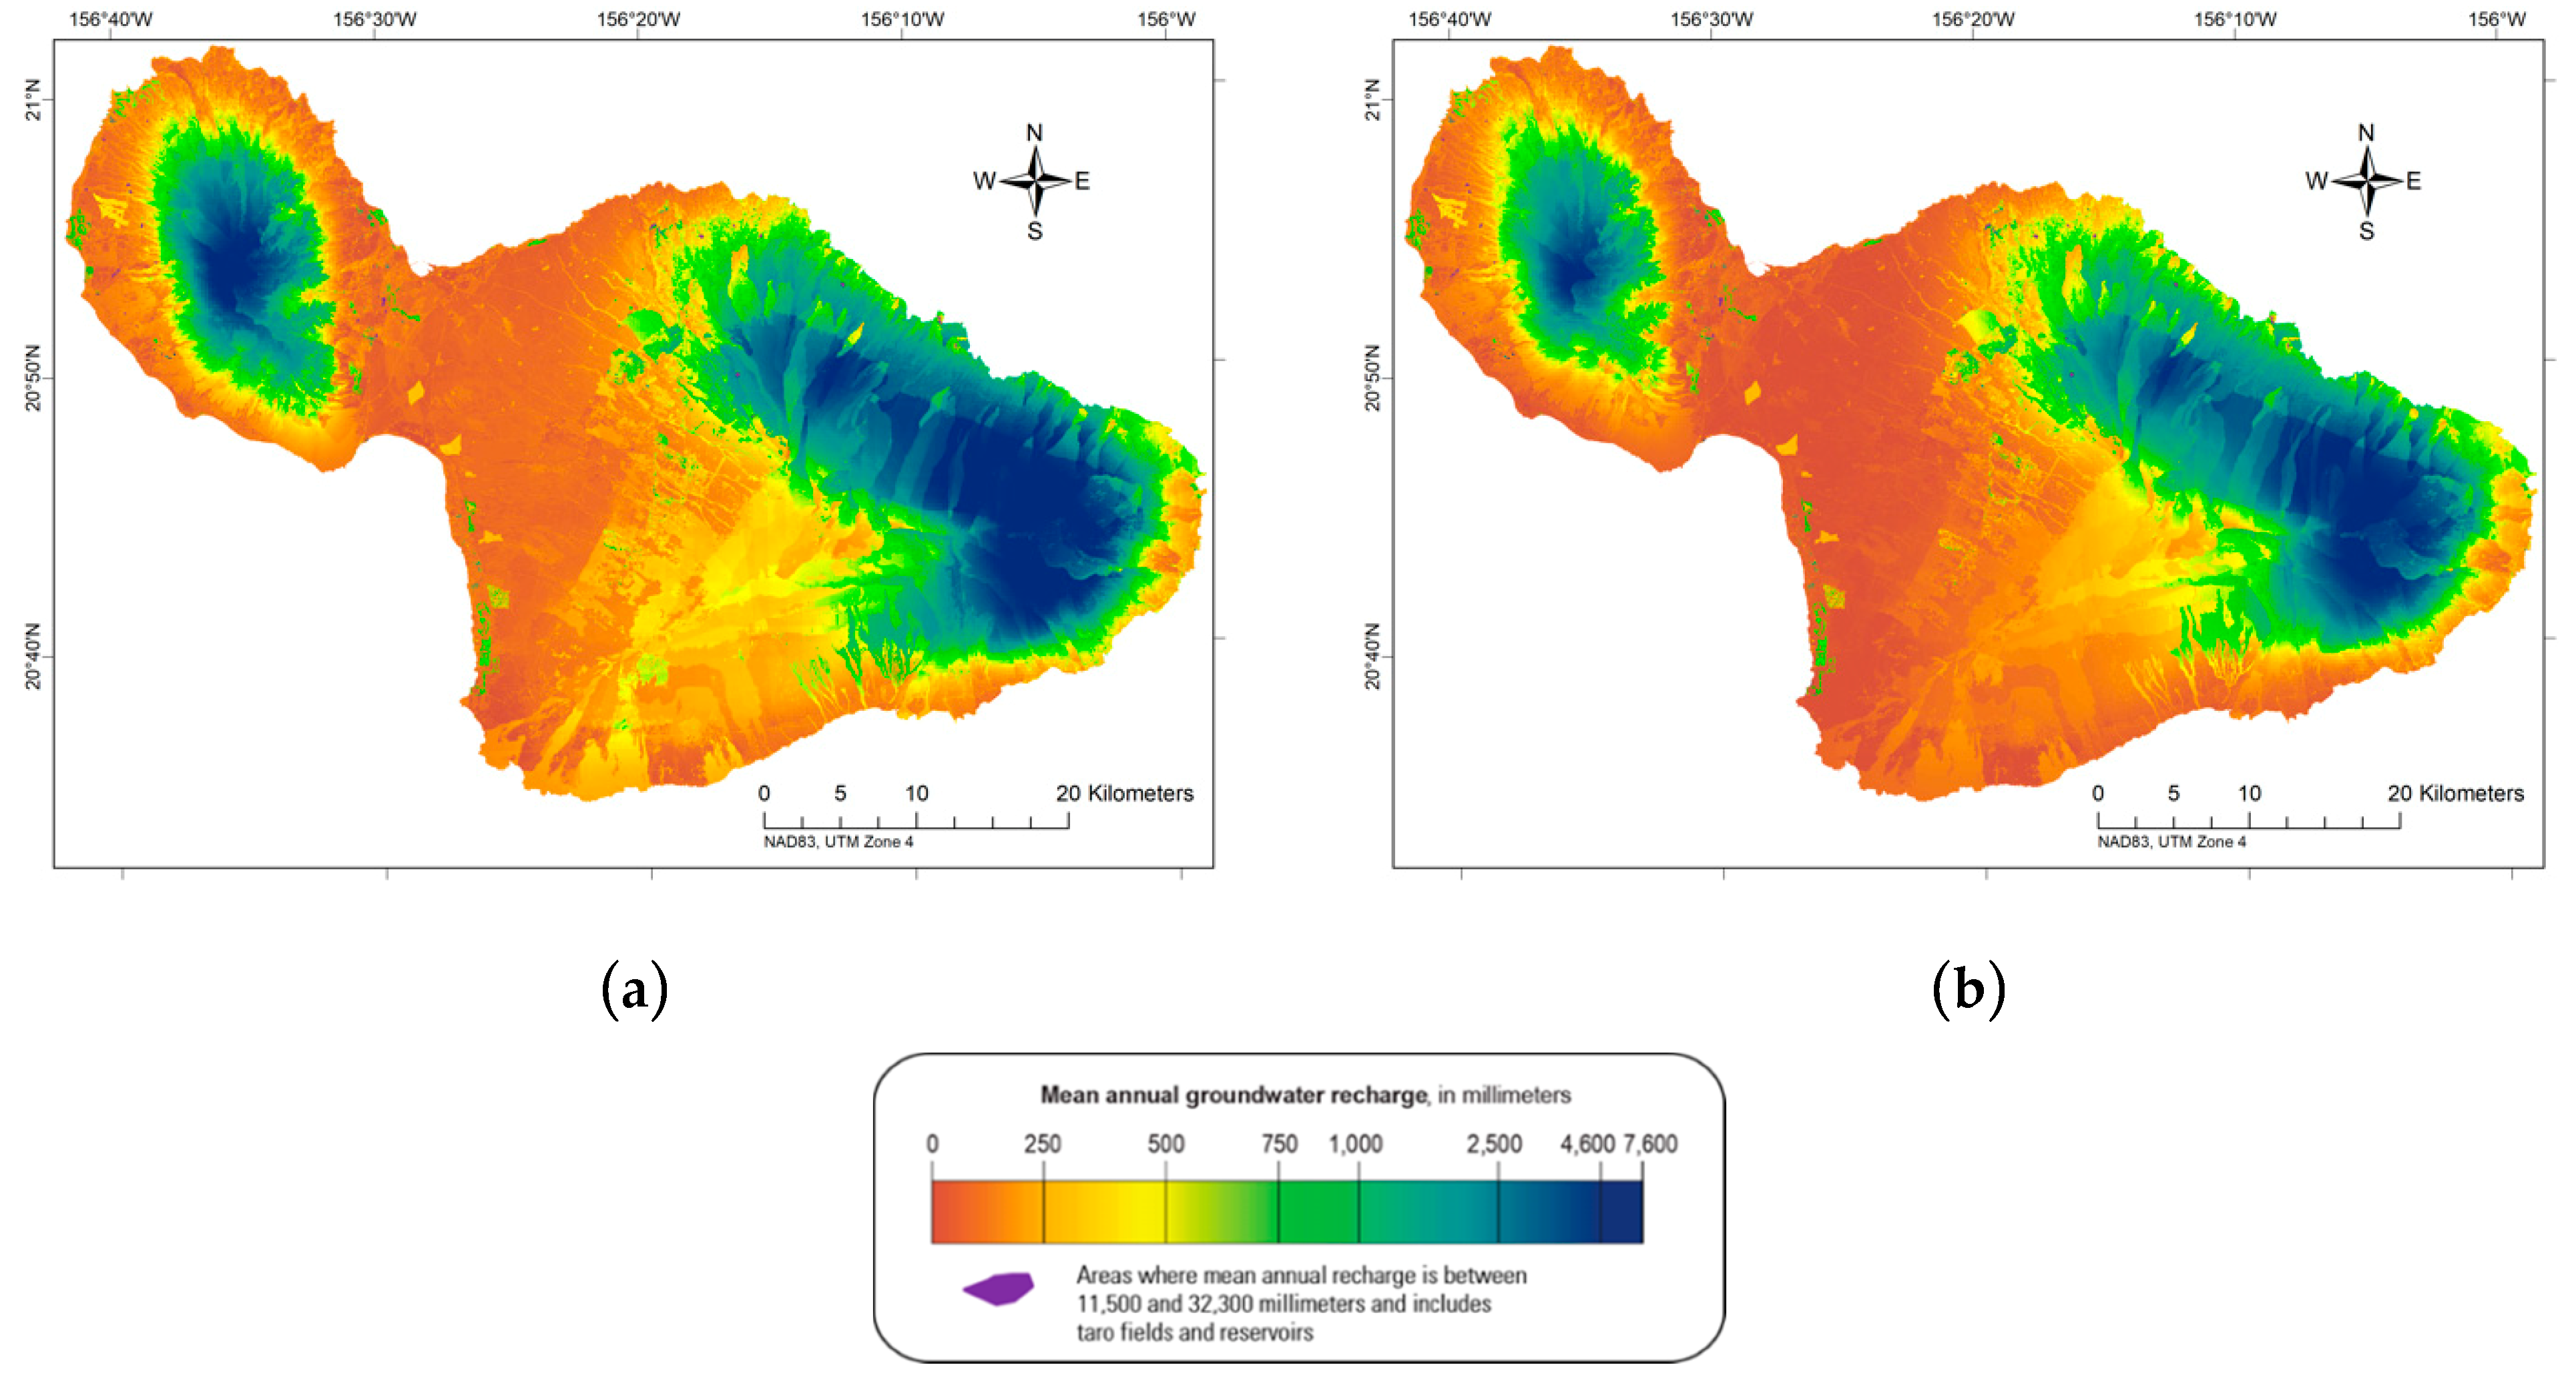
3.1. Description of Reference Conditions

The water-budget model simulation results by Mair et al. [40] for 2017 land cover conditions and each projected climate condition were used to define two reference conditions for quantifying the impacts of the plausible future land cover scenarios: (1) 2017 land cover conditions and a wet future climate [74], and (2) 2017 land cover conditions and a dry future climate [75]. Island-wide, mean annual recharge was 5208 and 4010 million liters per day (Mld) for the future wet and dry climates, respectively (Table 2). The spatial recharge patterns under both projected climates (Figure 4) were largely controlled by rainfall and exhibited higher recharge in the wet, upland parts of Maui and lower recharge in dry, coastal areas. Recharge under the wet future climate reflected an expansion and intensification of the high recharge areas in the West Maui Mountains and the windward areas of Haleakalā when compared to the dry future climate results. Lower recharge across central Maui and leeward coastal areas was indicated under the dry future climate, on the other hand. The difference in recharge patterns between each projected climate scenario was largely attributable to the changes in the spatial patterns of mean annual rainfall (Figure 3), but also reflected spatial variations in estimated canopy evaporation and total ET.

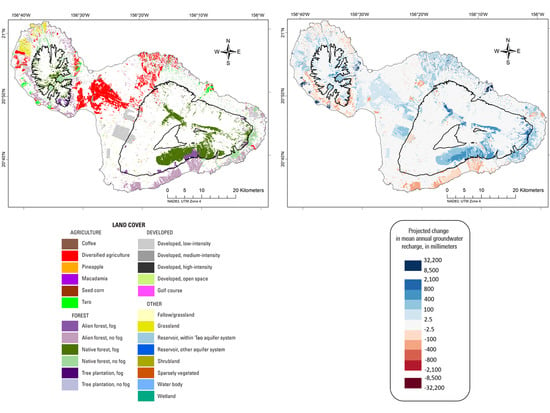
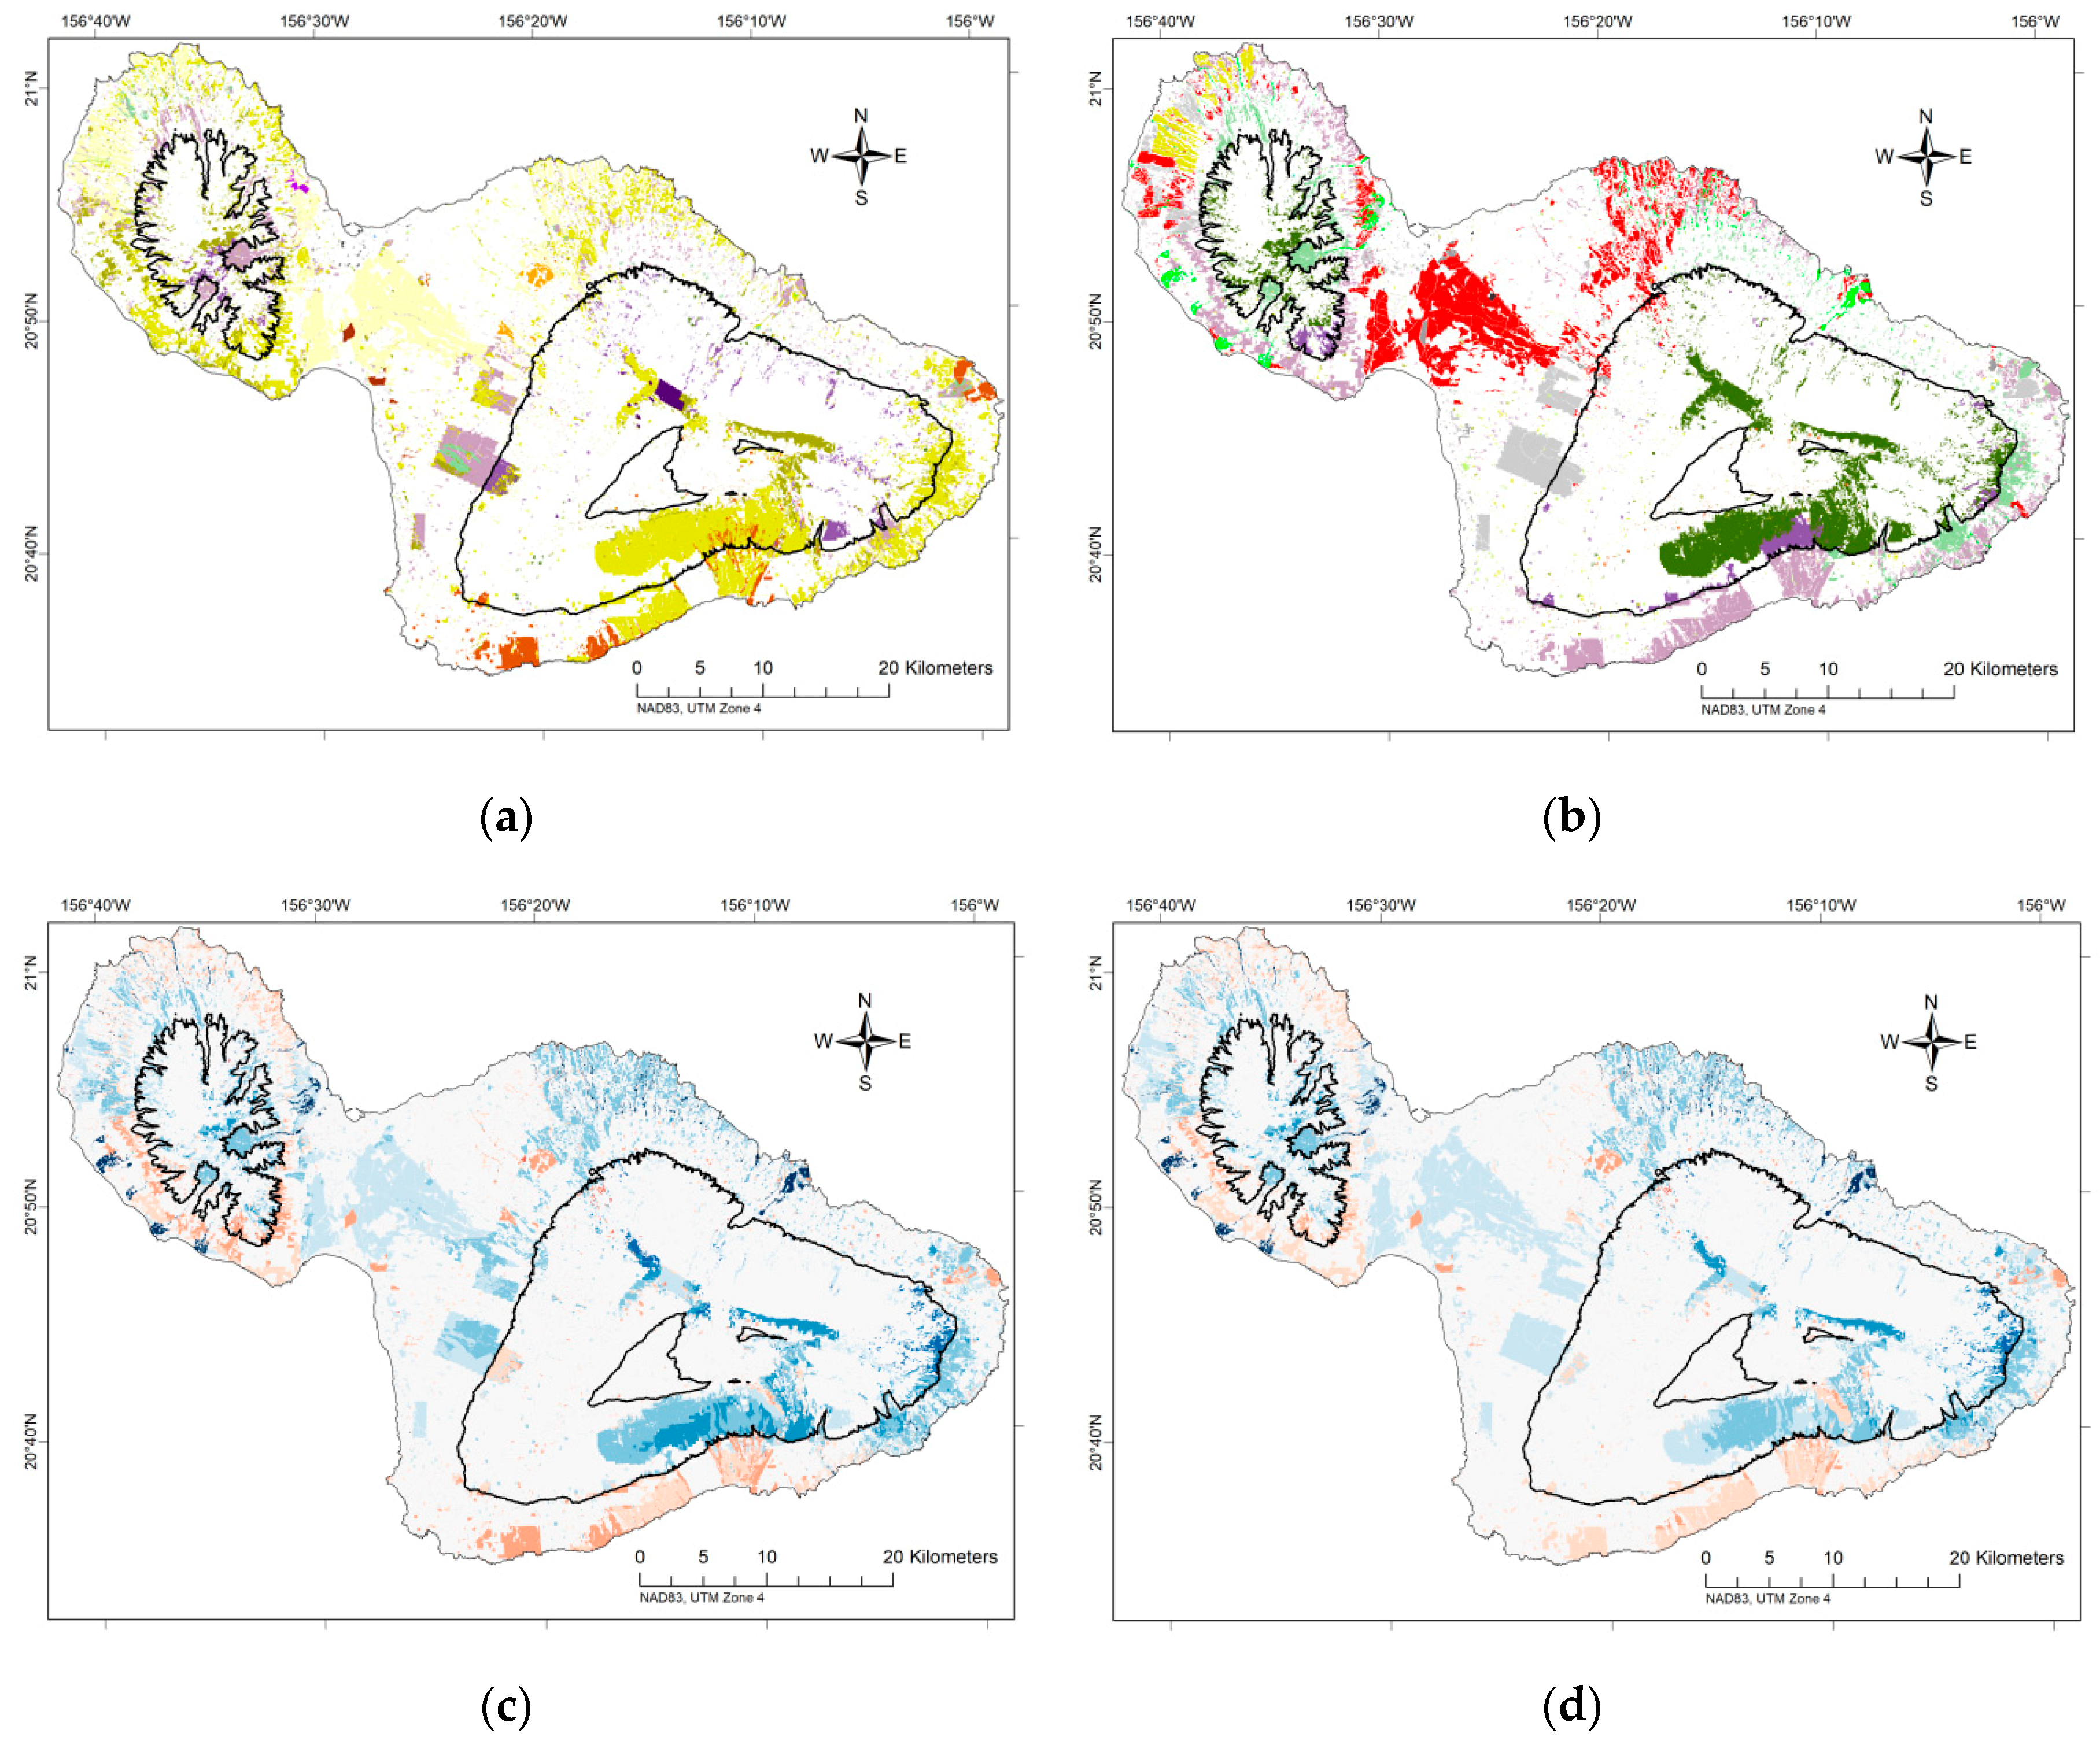
3.2. Effects of Future Land Cover Conditions under Projected Climates

This section describes the island-wide effects of future land cover and climate projections on groundwater recharge and other key water-budget model components including fog interception, irrigation, and ET. Results for the eight water-budget simulation scenarios described in this study are summarized by subarea in Mair [76].
The Future 1 land cover scenario differed from 2017 land cover by introducing high native forest protection and restoration, especially at elevations within the cloud zone, adding diversified agriculture in central Maui areas that were formerly fallow/grassland, and spatially limiting urban expansion with low- or medium-intensity development (Figure 5a,b). Under both the wet (Figure 5c) and dry (Figure 5d) future climates, recharge increased with the conversion of grassland to forest and associated increases in fog interception, although increases were more pronounced under the wet future climate. The exception to this trend was observed near the southern tip of the cloud zone in the West Maui Mountains. The most dramatic increases to recharge occurred in localized areas deemed suitable for taro cultivation, seen along west Maui’s southern and east Maui’s northern coastlines. However, it is important to note that model estimates of recharge for subareas with taro land cover had large uncertainty due to a lack of site-specific data. In this study, a constant annual recharge rate of 11,557 mm was used for taro land cover, regardless of location, and was equivalent to the mean annual recharge rate derived from four water-use studies for various taro fields in the state of Hawaiʻi [77,78,79,80]. The incorporation of diversified agriculture in central Maui also caused recharge to increase. Increased recharge occurred in areas where grassland was converted to new low-intensity urban development due to projected decreases in ET. Declines in recharge under both future climates were observed in areas with higher ET due to conversion from grassland to alien forest below the cloud zone, seen along the leeward areas of west and east Maui.
The Future 2 scenario represented a status-quo future for Maui land cover, extending existing land management and planning practices by instituting moderate native forest protections but engaging in no active restoration, leaving the central Maui isthmus as fallow/grassland, and building out urban development as outlined by County planning documents (Figure 6a,b). Some diversified agriculture was added to areas in windward east Maui. As Figure 6c,d show, these changes to land cover produced limited changes in recharge under both future climates. As in Future 1, new alien forest replacing grassland within the cloud zone resulted in increased recharge, especially under the wet future climate, but alien forest expansion below the cloud zone and within the cloud zone in southern west Maui generally reduced recharge. Low- and medium-intensity development and associated irrigation increases produced increased recharge in some areas with urban expansion.
Future 3 land cover incorporated aggressive urban development and a lack of native forest protection, allowing urban build-out to the limits of designated growth boundaries and alien forest to expand within all predicted suitable habitat. Biofuel production in central Maui replaced fallow/grassland cover (Figure 7a,b). This scenario resulted in the lowest increases to recharge island-wide under both future climates (Figure 7c,d). Recharge below the cloud zone (610 m) both increased and decreased in areas where alien forest cover expanded. Above the cloud zone, increases resulted from greater fog interception when non-forest cover converted to alien forest, but higher ET values due to the conversion from native forest to alien forest caused recharge to decrease. Conversion from fallow/grassland to biofuel cover caused recharge to increase in a large area of central Maui. Finally, the incorporation of high- and medium-intensity development along central Maui’s southern coastline produced localized increases in recharge due to increased irrigation, except for subareas that were formerly assigned as golf course land cover. Conversions from golf course to a high- or medium-intensity developed land cover produced a decline in recharge due to lower rates of irrigation.
The Future 4 land cover scenario represented a balanced conservation and development future for Maui, with emphasis on native forest protection and restoration, diversified agriculture and biofuel production, and moderate to high levels of urban development (Figure 8a,b). Similar to Future 1, increased native forest cover at higher elevations, conversions from fallow/grassland and alien forest to grassland, diversified agriculture, and tree plantations, and the addition of taro cultivation in coastal areas produced recharge increases under both future climates, where decreases were mostly confined to areas below the cloud zone where grassland was converted to alien forest (Figure 8c,d).
Figure 9 summarizes island-wide mean annual changes in the four water-budget components that were most impacted by the land cover change (fog interception, irrigation, total ET, and recharge), for each future land cover scenario. Changes shown are relative to the 2017 land cover under both climate projections (Table 2). Under the wet (Figure 9a) and dry (Figure 9b) future climates, all water-budget model components increased for all four future land cover scenarios. However, future scenarios 1 and 4 produced the greatest increases in mean annual recharge (+547 and +486 Mld, wet climate; +497 and +423 Mld, dry climate). For Future 2 land cover, island-wide recharge increased by 48 Mld (wet climate) and 29 Mld (dry climate). This was the only scenario in which island-wide change in recharge exceeded the island-wide change in irrigation, and the smaller difference in irrigation rates between 2017 and Future 2 land cover was due to the elimination of most agricultural activity in the central Maui isthmus. In Future 3, island-wide recharge increased by 34 Mld (wet climate) and 0.3 Mld (dry climate).

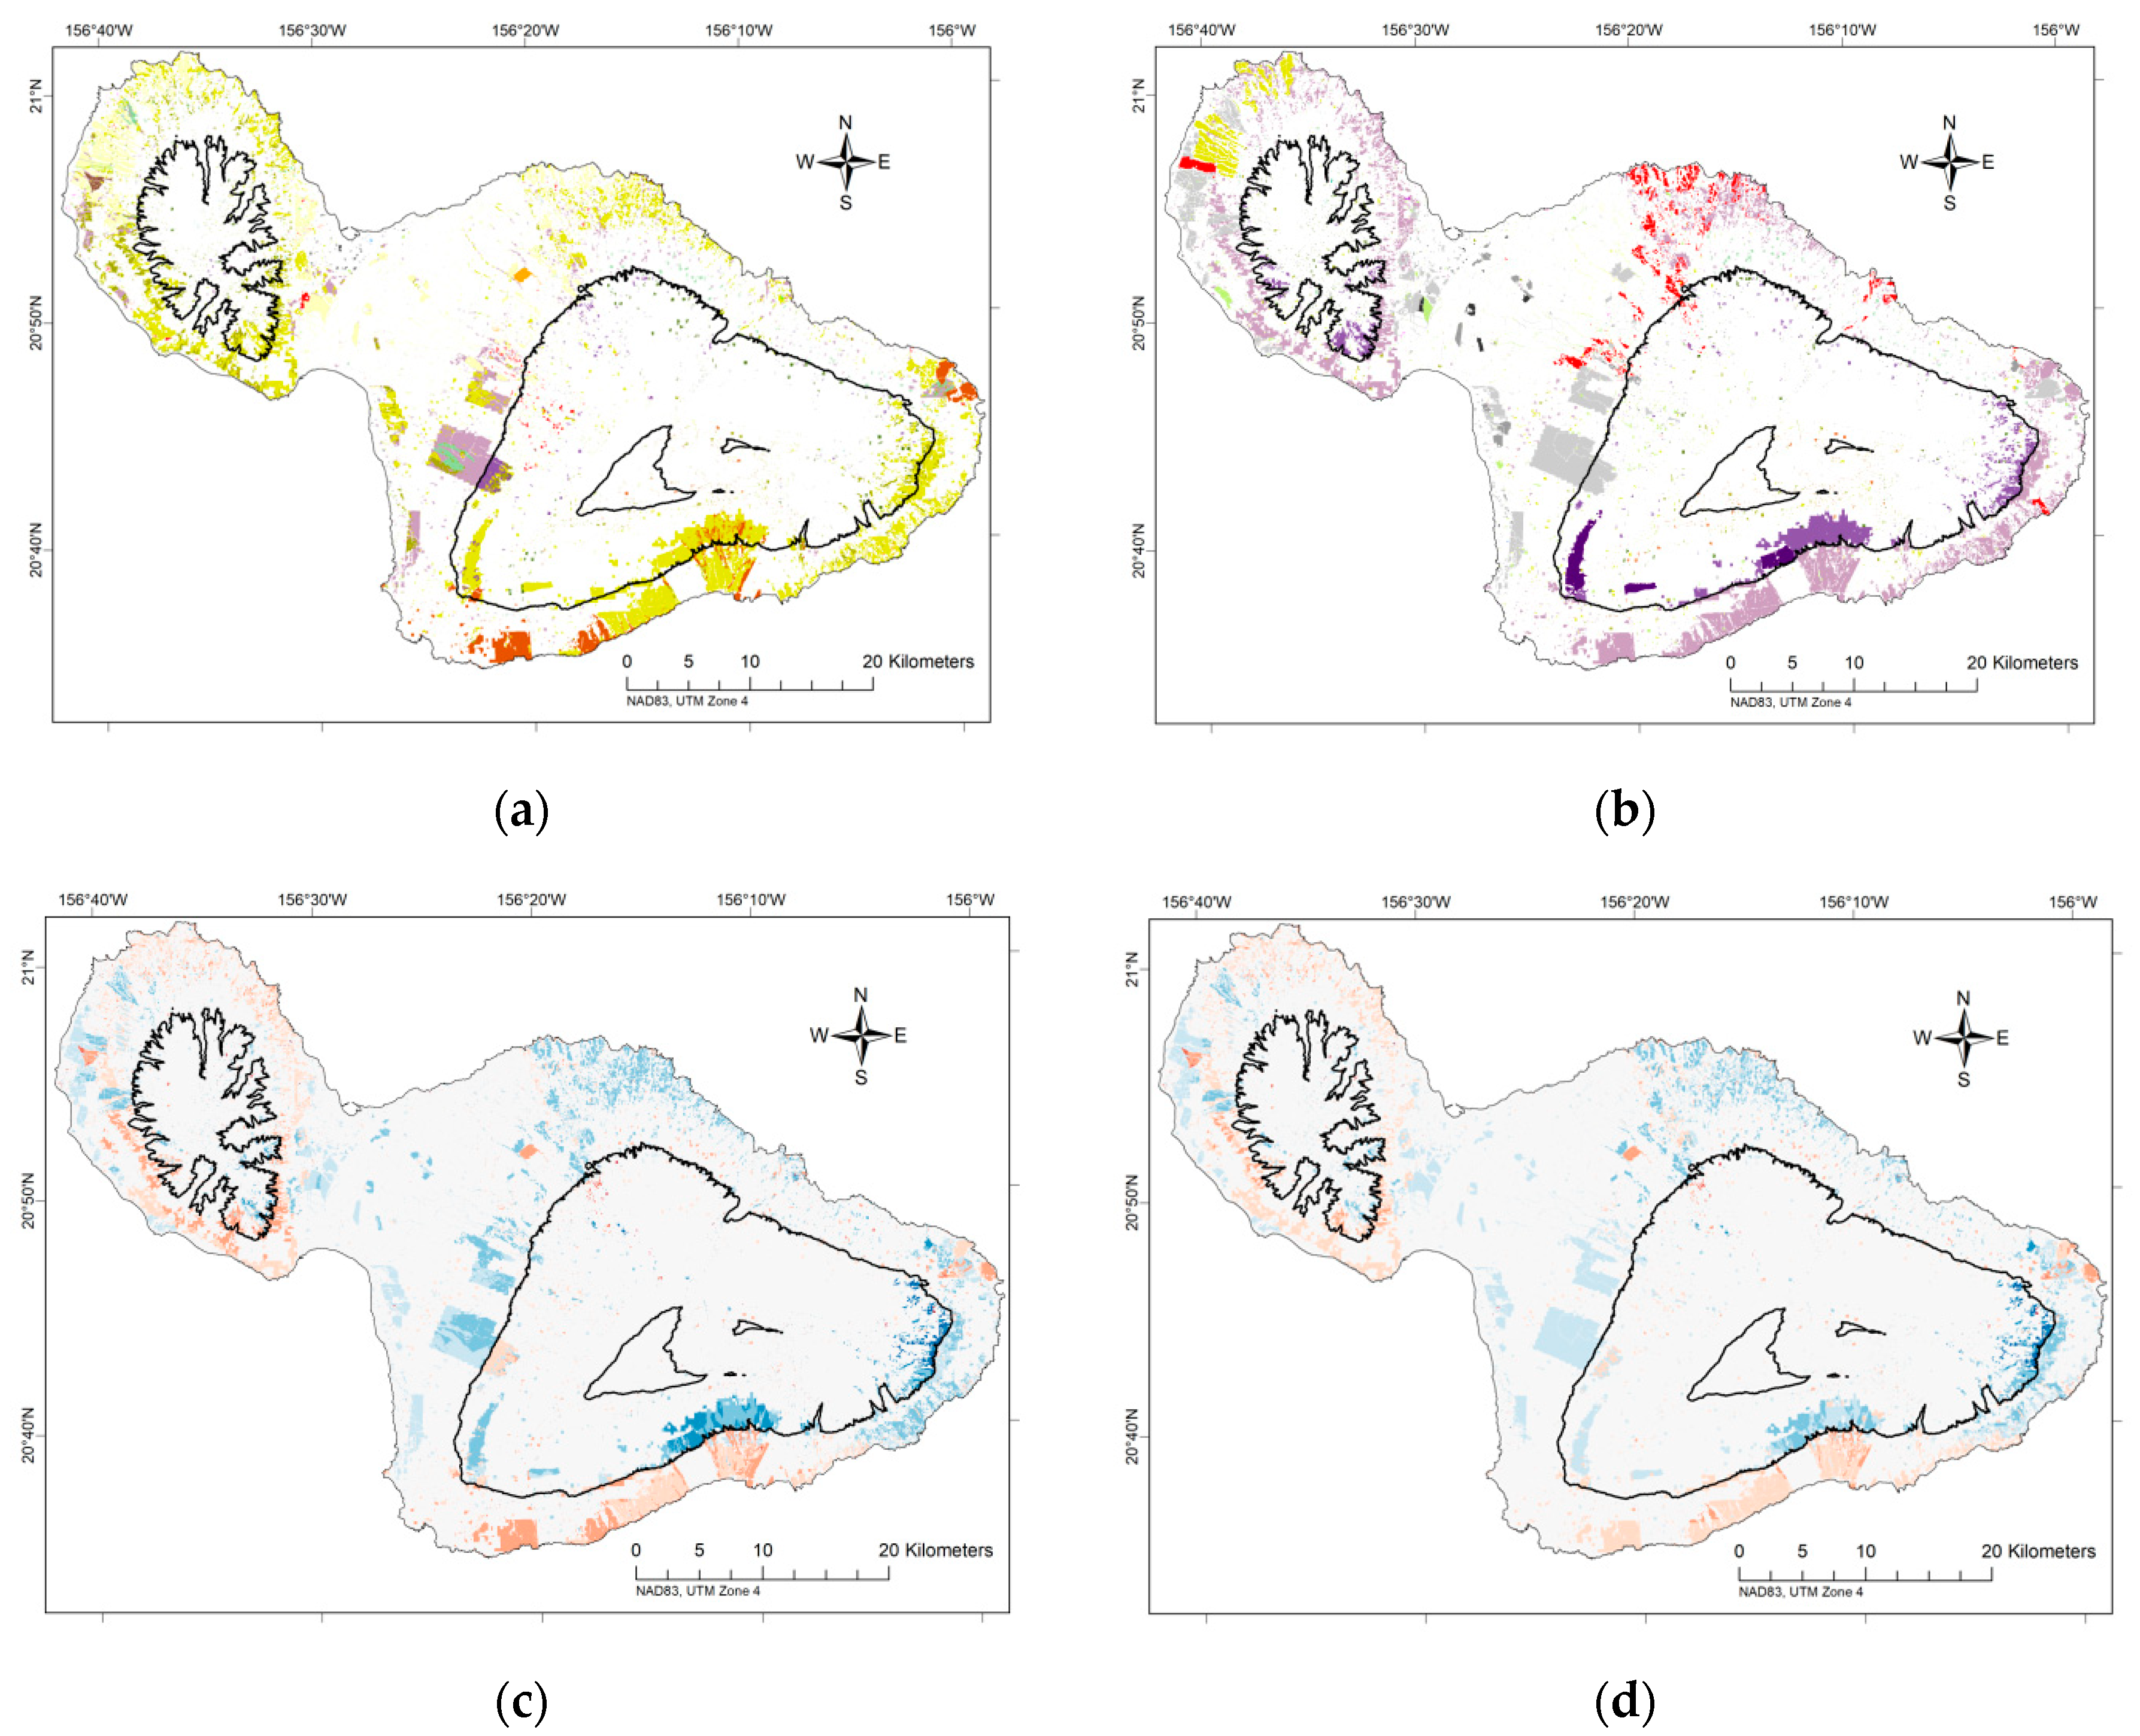
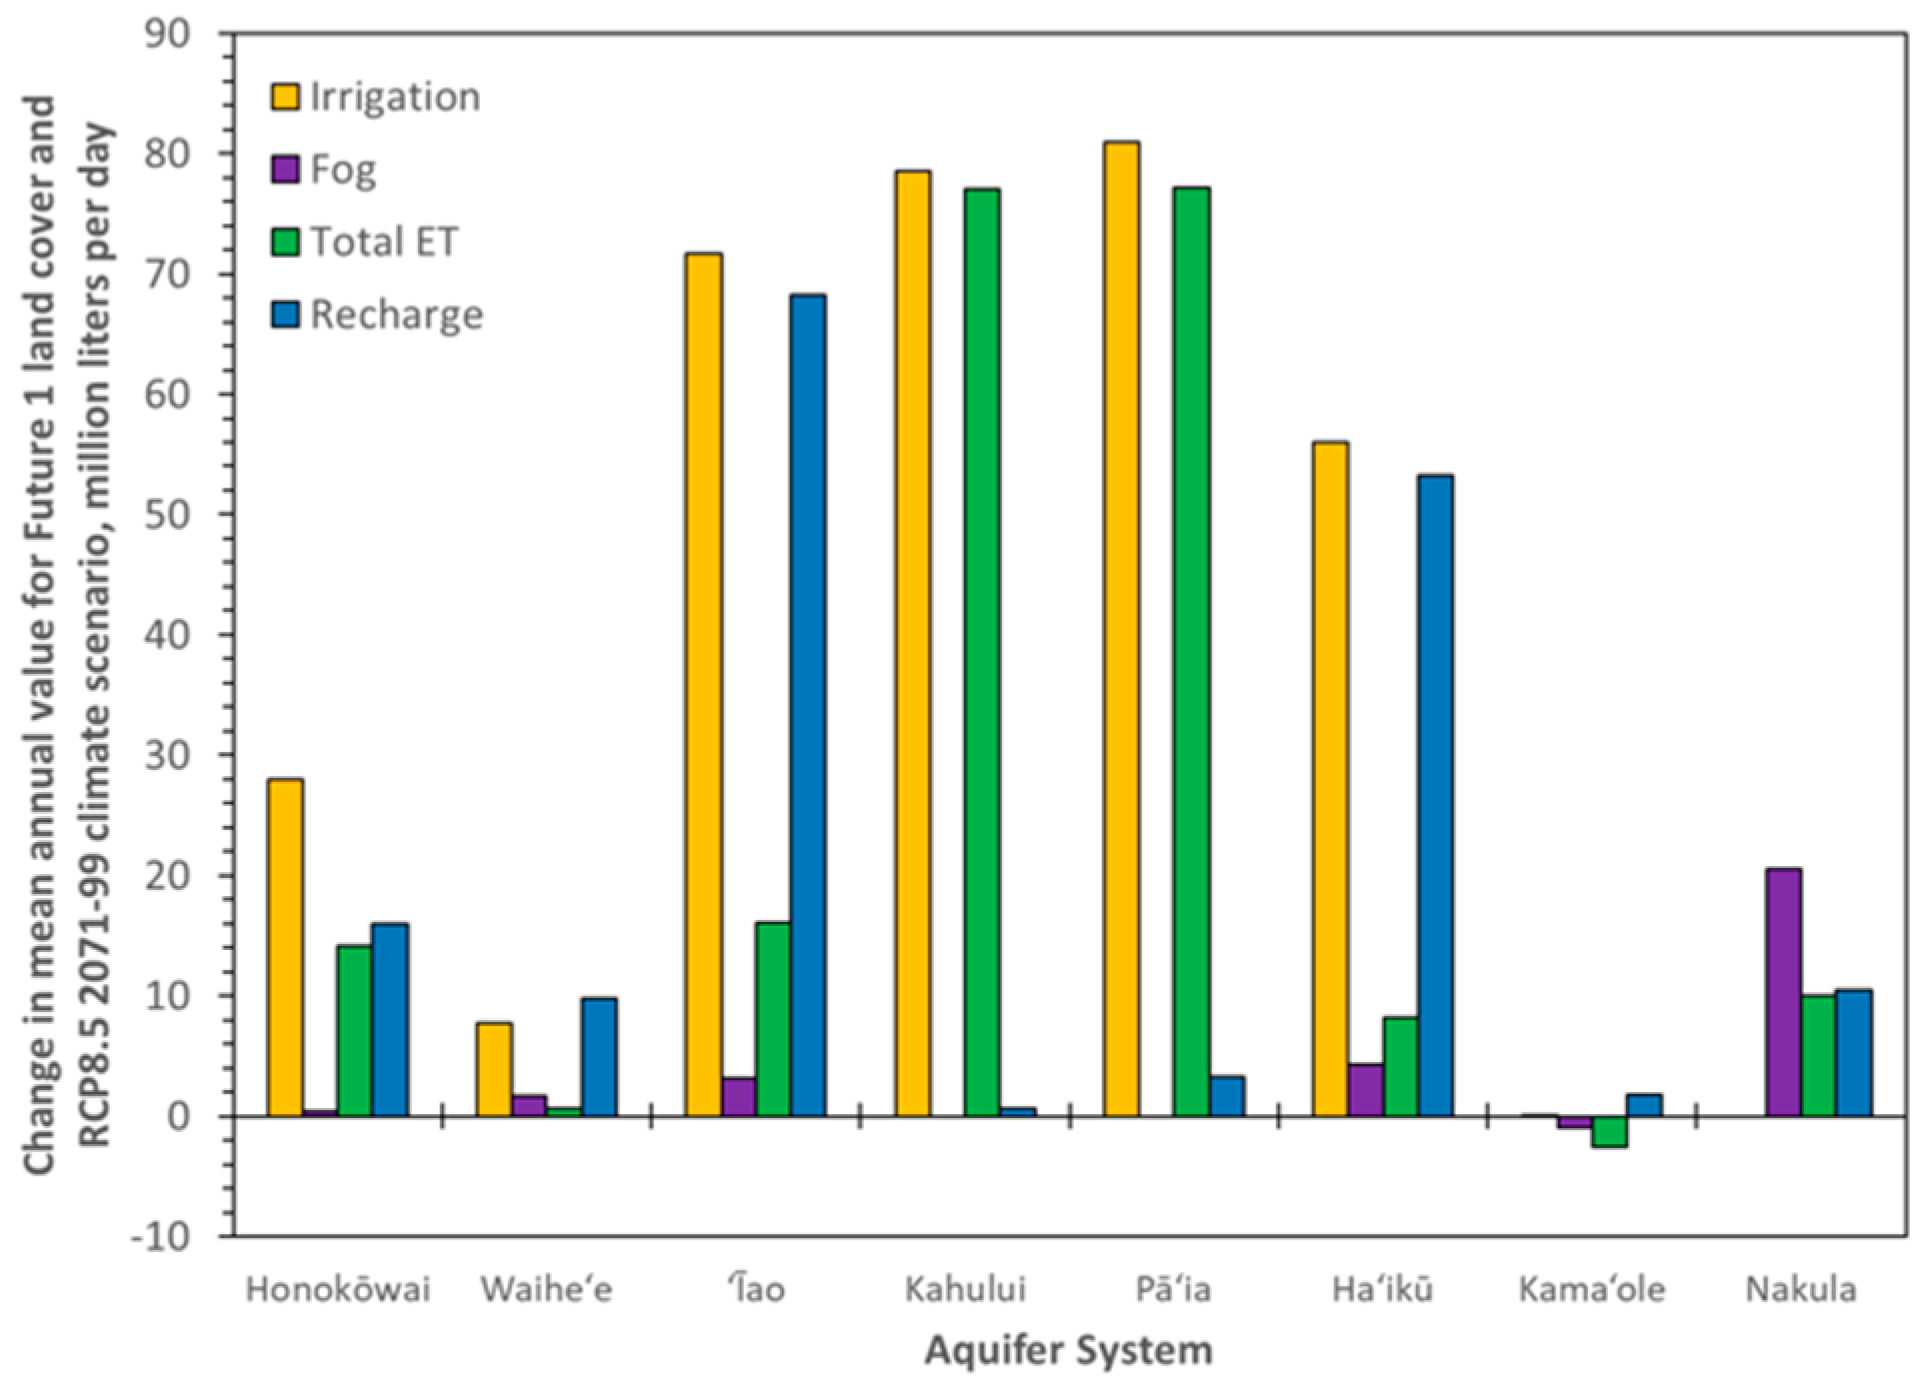
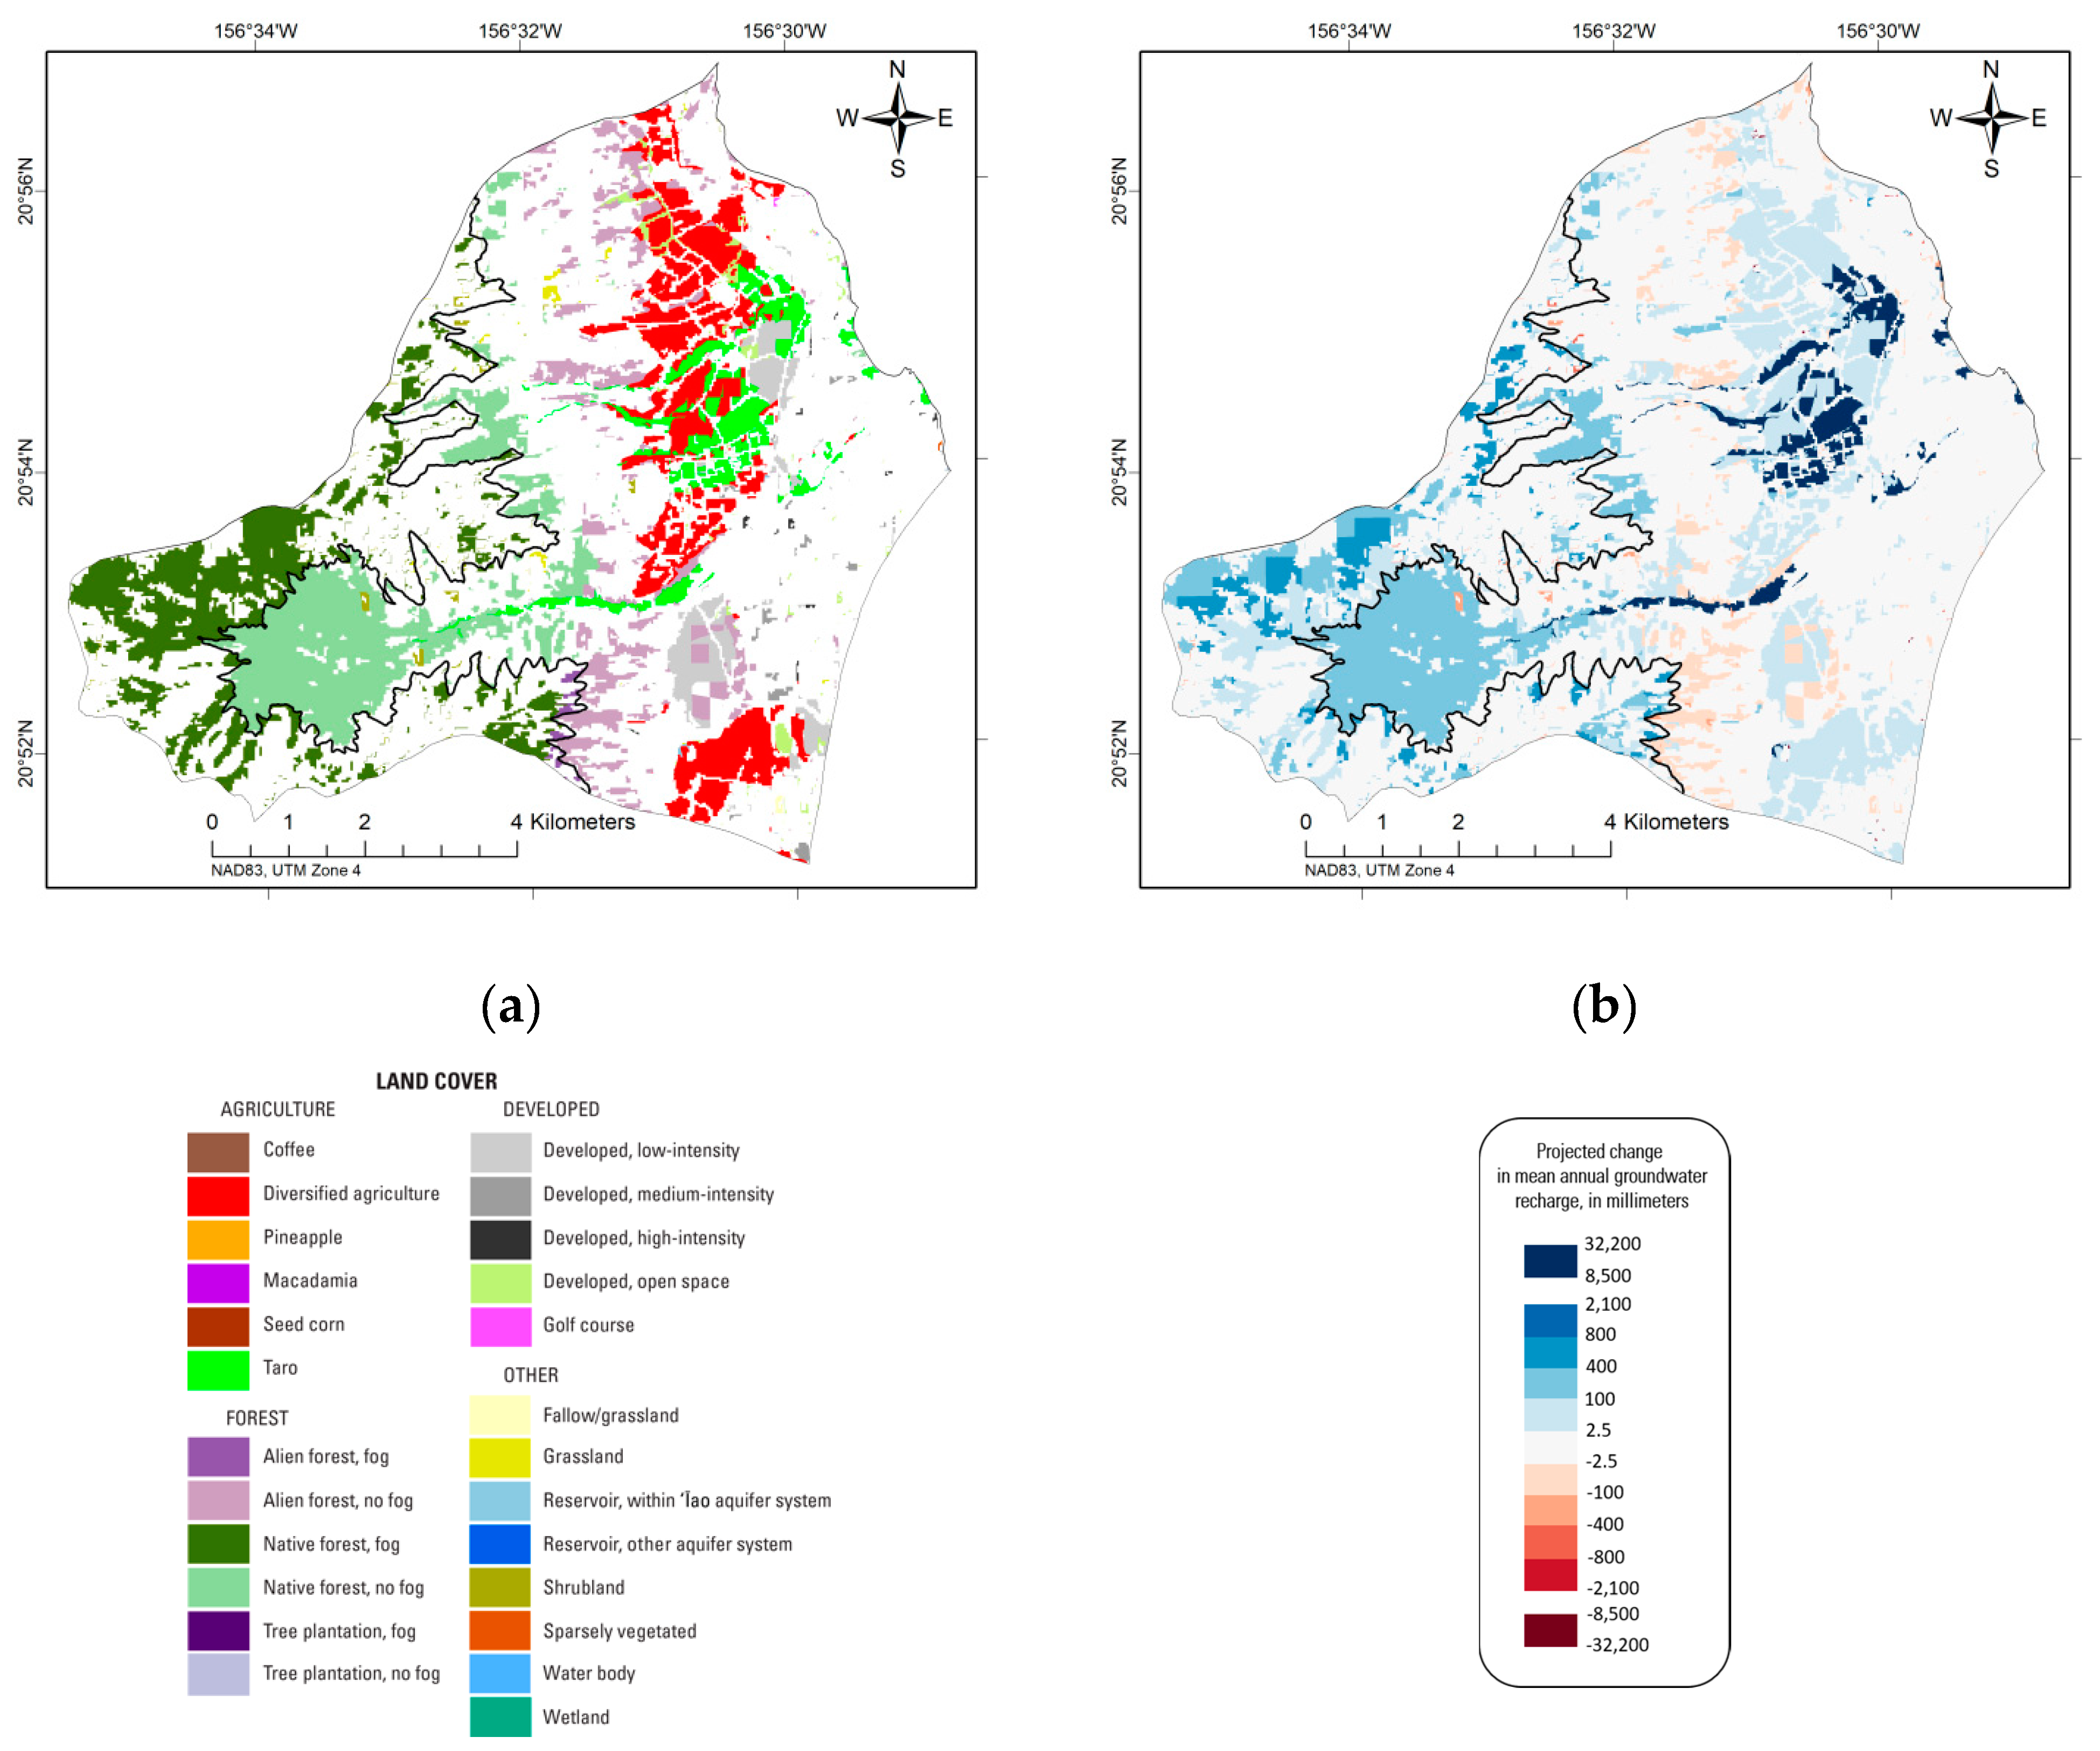
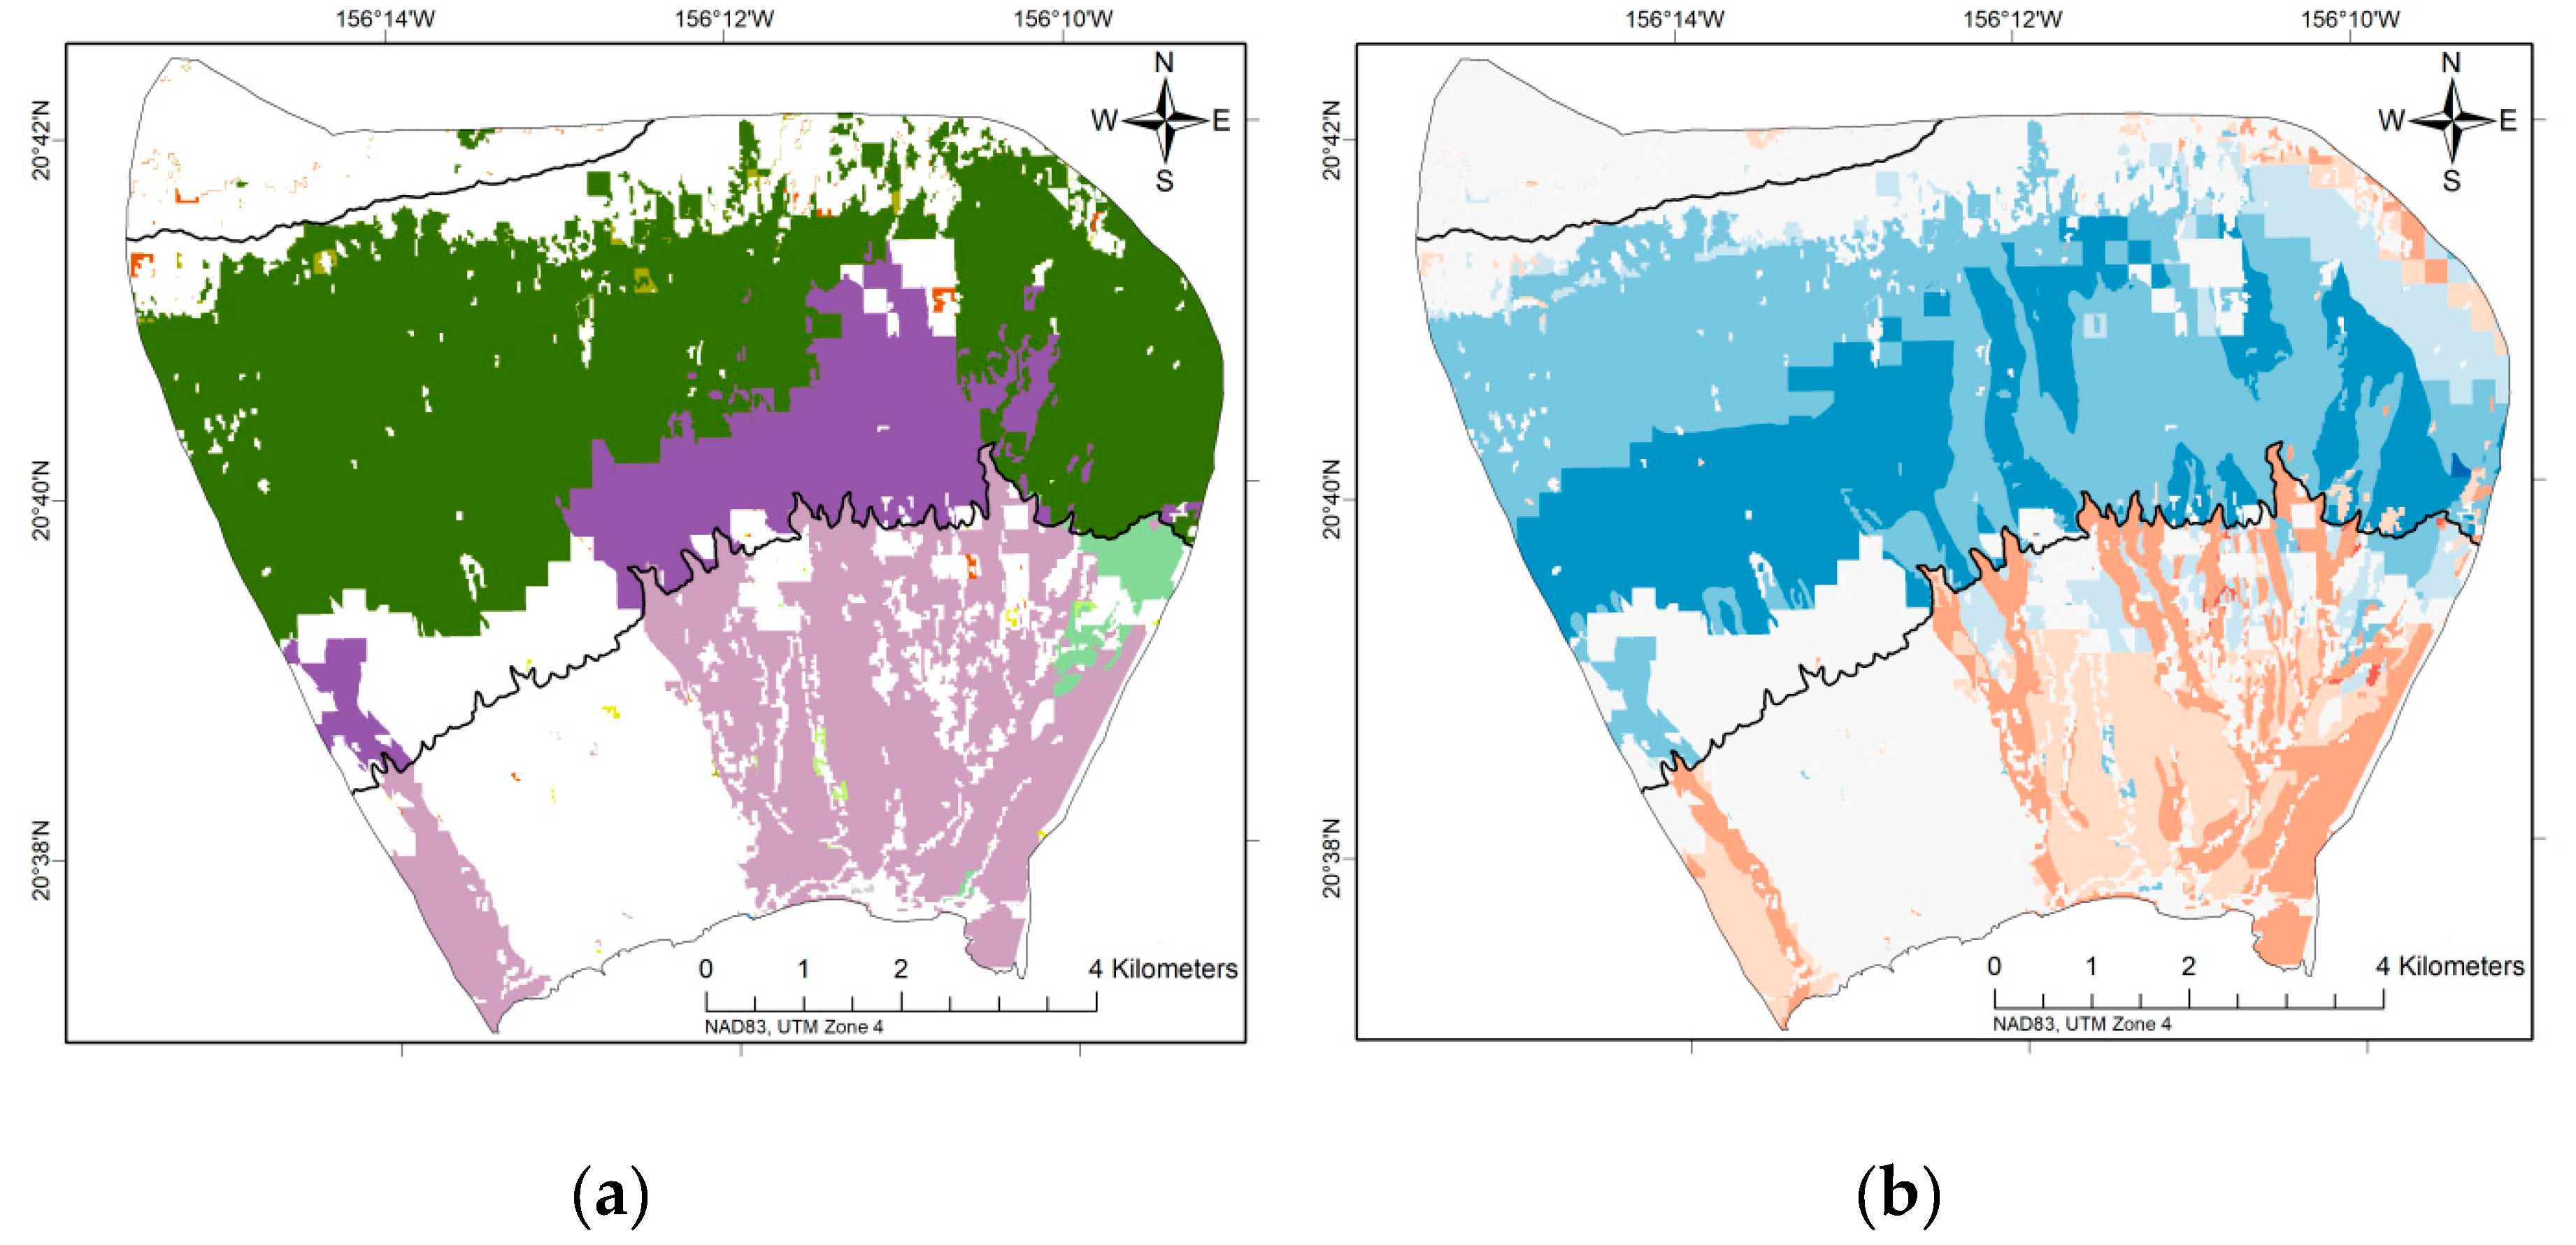
3.3. Localized Land Cover Conversions and Recharge Tradeoffs

Localized land cover conversions and recharge tradeoffs within management regions (i.e., aquifer systems) can be used to further explore the changes described above. Changes in mean annual irrigation, fog interception, total ET, and recharge for the dry future climate and Future 1 land cover were computed for eight selected aquifer systems (Figure 10). Substantial increases in estimated Future 1 irrigation rates, ranging from about 8 to 80 Mld, were computed for six of eight aquifer systems (Figure 10) due to conversions to diversified agriculture and taro land cover, land cover changes of interest for many stakeholders after the collapse of commercial sugarcane agriculture. Conversely, little to no change in estimated Future 1 irrigation rates were computed for the Kamaʻole and Nakula aquifer systems owing to the lack of conversions to irrigated agricultural land covers. Conversions to forested land covers above the cloud base enhanced estimated Future 1 fog interception rates by about 0.5 to 21 Mld in the Honokōwai, Waiheʻe, ʻĪao, Haʻikū, and Nakula aquifer systems. In response to increased rates of irrigation and fog interception, estimated Future 1 total ET increased by about 0.7 to 77 Mld in seven of the eight aquifer systems. However, the water that supplied much of this localized recharge was derived from irrigation water whose source was not modeled in this study (see Limitations, below). Estimated Future 1 total ET declined in the Kamaʻole aquifer system by about 2.5 Mld because of a decrease in canopy evaporation mainly due to the conversion of forest land cover to low-intensity developed land cover (lower rates of ET). The Future 1 land cover effectively increased estimated recharge rates in all eight aquifer systems by about 0.6 to 68 Mld. Table S3 contains mean annual water-budget components for the current and future land cover/climate combinations, by aquifer system and island-wide. Under the wet climate future, all 25 aquifer systems on the island saw increased recharge in Future 1 (Table S3).
For Future 2, changes by aquifer system were small and ranged from reductions of 9% (−3.1 Mld) in Lualaʻilua under the dry future climate to increases of up to 16% (+1.4 Mld) in Kahului under the wet future climate. Future 3 saw very large increases in recharge in areas where biofuel/diversified agriculture cover demanded greater irrigation, such as Kahului (+5.6 Mld (64%) wet climate; +0.6 Mld (15%) dry climate) and Pāʻia (+21 Mld (76%) wet climate; +9.1 Mld (77%) dry climate) aquifer systems. For Future 4, 24 of Maui’s 25 aquifer systems had recharge increases under the dry climate, and recharge increased in all aquifer systems under the wet future climate. The greatest increases occurred in areas with higher irrigation for diversified agriculture, such as central Maui, and aquifer systems that incorporated taro cultivation.

4. Discussion

The findings in this study of future land cover change and climate projections, alongside the companion report on current land cover and climate projections [40], articulate the tradeoffs between alternative land management actions for Maui decision-makers in three ways. First, the large range of climate impacts that may occur by the end of the century requires adaptive management decisions. Mair et al. [40] found that by holding 2017 land cover constant and comparing the 1978–2007 reference climate to the climate projections, the greatest changes to recharge occurred in the West Maui Mountains (both wet and dry climates), the wet windward areas of east Maui (wet climate only), and the southern, leeward areas of Haleakalā (both wet and dry climates). However, the direction of change was largely opposing, with contrasting climate effects on the aquifer system recharge for most of Maui’s 25 aquifer systems. The watershed partnerships that are managing higher elevation lands where the climate projections strongly diverged are predominantly concerned with native forest protection and restoration efforts, especially fencing for feral ungulates, which require significant financial and human capital. Emphasizing that the future climate in those regions could be much wetter or drier compared to today may assist upper watershed conservation planning under conditions of uncertainty. Furthermore, drying trends shown in both climate projections could affect future agricultural and groundwater development in areas targeted for urban expansion or increased diversified agriculture. This leads to the second point, which emphasizes the tradeoffs in groundwater recharge due to land cover change.
The future land cover scenarios can be used to compare and contrast potential gains and losses under alternative decision-making and land management. Island-wide recharge increased across all future land cover scenarios, for both the wet and dry future climates, but certain land cover changes strongly impacted groundwater recharge in localized areas. The greatest increases occurred in Futures 1 and 4 due to the substantial increases in estimated irrigation and fog interception rates. In the ʻĪao aquifer system, increases in mean annual recharge from 2017 land cover conditions under a dry future climate were 68 and 36 Mld for Futures 1 and 4, respectively. The large increases were primarily due to increased irrigation in response to the addition of taro cultivation (Figure 11a,b). Under the dry future climate, for example, irrigation in the ʻĪao aquifer system increased by 72 Mld for the Future 1 land cover scenario compared to the 2017 land cover. However, the ability of existing sources of irrigation water, such as nearby streams, to meet the increased demand was not evaluated in this study (see Limitations below). Hence, further analysis is needed to assess whether the projected increases for irrigation water can be met by existing surface water and groundwater sources. Also, site-specific data are needed to refine the estimated taro land cover recharge rate, which was assumed to be temporally and spatially constant for this study. During the development of the scenario narratives, stakeholders acknowledged that although significantly expanded taro cultivation was unlikely to occur, they were interested in seeing impacts on streamflow and nearshore ecosystems. As an irrigated crop, water for taro cultivation added recharge in coastal areas that could have substantial impacts on submarine groundwater discharge, with potentially positive environmental consequences. Because taro is not a purely consumptive crop, furthermore, some of the water is also returned directly to streams that flow into the ocean. Additional surface water or groundwater modeling analysis and data are needed to quantify the impacts of expanded taro cultivation on submarine groundwater discharge and streamflow to the ocean.
Irrigation patterns and quantities were also modified by the addition of diversified agriculture. In some areas, higher irrigation was offset by increases in ET, as was seen in the central Maui Kahului and Pāʻia aquifer systems (Figure 10). Most of the irrigation water in this region has historically come from streamflow diversions in other parts of the island, however, where its diversion is contested by Maui communities, cultural practitioners, and small farmers. The complex interactions between land cover and water supply and demand must, therefore, be considered both spatially and temporally, to better allocate resources in an equitable and sustainable manner in the context of a changing climate.
In most areas above the cloud zone (610 m), the conversion from grassland to any type of forest cover increased fog interception and recharge. The largest changes in fog interception occurred in Futures 1 and 4, where large areas of grassland were converted to forest. For example, the Nakula aquifer system is located along the leeward slopes of Haleakalā, where recharge under the dry future climate increased by 10, 3.8, 3.6, and 11 Mld across the four respective scenarios mainly due to increases in fog interception from conversion to native or alien forest. Nevertheless, increases were greatest where native forest was dominant, as seen in Future 1 (Figure 12a,b). On the other hand, where grassland (or fallow/grassland) was converted to alien forest below the cloud zone, recharge decreased. Watershed management at the upper elevations is costly, both in financial and human resource terms. Although the maintenance and restoration of native forest ecosystems have numerous ecological, aesthetic, and cultural resource benefits, it may be useful to consider the effects of alien forest species on transpiration and other hydrologic processes, for which additional field studies are needed. Meanwhile, prioritizing the protection of critical forest habitats, such as the upper elevations of the West Maui Mountains and mid-to-upper elevations of Haleakalā, for example, protects multiple ecosystem services (water and food supplies, nutrient cycling, erosion control, recreation, etc.) in the face of a changing climate.
Lastly, zoning regulations for Maui restrict urban and commercial development to primarily dry areas near the coast where less groundwater is available to support municipal demands. The aquifer system that largely supports Kīhei is operating already at 84% of its estimated sustainable yield [25], for example. Mair et al. [40] found that less—sometimes much less—groundwater recharge will be available for withdrawal in these areas compared to today. Projected decreases in groundwater recharge ranged from 27% to 72% in the Kamaʻole aquifer system under the dry and wet future climates, which implied a substantial decrease in groundwater resources in this area. On the other hand, large increases in central Maui aquifer recharge due to irrigation for diversified agriculture should not be interpreted as future water available for urban use. When those inputs are removed, urban expansion on Maui will be taking place in water-stressed areas that are projected to become more so under both the wet and dry future climates. However, land use planning offers stakeholders the opportunity to shape the future of water supplies.
The findings in this paper and Mair et al. [40], along with the associated spatial datasets containing the future land cover scenarios and water-budget model outputs, can assist managers island-wide as they plan for and adapt to the impacts of climate change. The spatially-explicit scenario development process directly linked policies and plans from multiple agencies to a set of plausible future changes in land cover on Maui. Furthermore, in developing the future scenario maps, the project team committed to using existing GIS data, plans, and land cover projections, which lent greater credibility to the results. For example, one of the main drivers for this work was to provide information that could be used in watershed restoration efforts by the Maui watershed partnerships that are targeting recharge enhancement, especially at the upper forested elevations in east and west Maui. Quantifying changes in recharge for a variety of plausible future forest conditions provides critical information needed to assess the potential costs and benefits of watershed management and restoration. Similarly, future urban expansion was derived from a Maui County Department of Planning project database and the model results clearly showed high-density urban development proceeding in some of the most water-stressed parts of the island.

Limitations of this Study

The results presented in this study relied on available physical data for simulating hydrological processes and physical conditions that affect groundwater recharge for a set of future land cover conditions. Lack of data or sparse, uneven distribution of data in space and time, and poor understanding of some hydrologically relevant processes may limit the precision and accuracy of water-budget model results. Detailed descriptions of the model exclusions and limitations are provided in [6,39,40]. Selected limitations related to quantifying the impacts of land cover change using the water-budget model are described in this section. First, recharge rates from taro land cover in the state of Hawaiʻi are not well known. A constant value for the rate of recharge was derived from limited data collected at taro sites on the islands of Kauaʻi and Oʻahu and assigned to all model subareas with a taro land cover, regardless of location. Hence, the recharge estimates computed for taro land cover may not be representative of actual taro recharge rates for the range of locations where taro might be cultivated on Maui and for the different cultivation practices that may be required. Additional Maui-specific data are needed to reduce the uncertainty in recharge estimates from taro land cover. Second, direct runoff was computed using externally generated seasonal runoff-to-rainfall ratios that are based on observed basin-integrated stream-gage data, where gage data are available, or an empirical equation developed through a regional-regression analysis [40]. The runoff-to-rainfall ratios were not computed for specific land cover classes and do not change when an assigned land cover changes from the 2017 land cover condition. Hence, the model estimates of runoff should not be used to assess changes in runoff for different land cover classes. Third, the irrigation water computed by the model was supplied as an unspecified external source and was not explicitly modeled. Furthermore, an evaluation to determine whether existing sources of irrigation water can meet the irrigation needs computed by the model for each land cover scenario was not conducted. Linkage to a groundwater or surface-water system could be accomplished by supplying the irrigation estimates and the spatially-distributed recharge estimates from the water-budget model to a groundwater or surface water model. Fourth, the differences in transpiration rates of native and alien forest species in the Hawaiian Islands are not well known. Hence, the model only distinguishes three types of forested land cover classes: native forest, alien forest, and tree plantation. The model can be modified to further distinguish forest land cover classes and their impacts on recharge estimates as information on transpiration for dominant forest species and their distribution (or potential distribution) becomes available. Fifth, no change in the type, number, distribution, or seepage rate of the onsite sewage disposal systems documented by Whittier and El-Kadi [81] was assumed for each of the future land cover scenarios. Improved understanding of the processes described above could help to reduce uncertainty associated with the water-budget model results. Finally, stakeholders expressed a desire for scenarios that included mid-century climate projections that would be more compatible with planning horizons (see Brewington et al. [67]). The climate scenarios selected for this study were designed to capture a range of projected changes in island-wide rainfall, and although they refer to end-of-century timelines, the projections may be reached before that time. Mid-century (2041–70) climate projections for Hawaiʻi do exist [70,82], however, and could provide additional information on the nearer-term potential impacts of climate change when combined with future land cover scenarios.

5. Conclusions

This project developed an integrated modeling framework for future groundwater recharge on the island of Maui, Hawaiʻi, using remote sensing and GIS data, climate information and projections, stakeholder input for scenario creation, and empirical data. Based on our findings we conclude that: (1) Remote sensing and the spatial data products that served as both the inputs and outputs of this work can provide realistic tools for integrating information from stakeholders across multiple sectors and management applications. The future land cover maps [68] are already being used for policy discussions, as visualization tools, and as inputs for other research projects, and the companion groundwater recharge shapefile outputs from this paper are available to stakeholders on Maui and the State of Hawaiʻi. (2) Appropriate land management strategies can help mitigate the effects of an uncertain future climate. Changing future land cover had impacts that were particularly notable for certain land cover types, with implications for spatial planning. The conversion of grassland to native or alien forest in all future land cover scenarios, for example, led to increased groundwater recharge at the upper elevations within the cloud zone. Lower elevation transitions to forest did not produce this effect due to higher ET. This highlights the need for more species-specific vegetation information regarding water interception and storage, including quantified differences between native and alien forest as well as conservation investments at the higher elevations that promote functional forest cover. (3) The addition of diversified agriculture in Futures 1 and 4 resulted in an increased demand for irrigation—sometimes a dramatic increase. While the central Maui isthmus is in transition out of sugarcane and potentially into other types of agriculture, for example, the primary landowner could consider planting climate-resilient crops with lower irrigation demand to reduce the diversions of streamflow from other parts of the island. (4) Modeled groundwater recharge can help natural resource managers and planners identify potential vulnerabilities and opportunities. For example, in watersheds in which planned increases in supply development coincide with a drier projected climate, freshwater managers can target alternative sources with increased projected recharge to mitigate potential shortages. The water-budget modeling framework presented here provides information on the “supply” side, whereas the numerical groundwater modeling approach incorporates the “demand” side (pumping, diversions, discharge, etc.) to better inform the availability of groundwater across the island.

Supplementary Materials

The following are available online at https://www.mdpi.com/2072-4292/11/24/3048/s1, Addendum S1: Description of the Water-Budget Model, Table S1: Land cover parameters, Table S2: Mean impervious fraction and canopy cover fraction for 2017 land cover conditions, Table S3: Mean annual water-budget components for 11 water-budget model scenarios for aquifer systems and all of Maui, Hawaiʻi.

Author Contributions

Conceptualization, V.K. and A.M.; methodology, L.B., V.K., and A.M.; formal analysis, L.B. and A.M.; investigation, L.B., V.K., and A.M.; resources, L.B. and A.M.; data curation, L.B. and A.M.; writing—original draft preparation, L.B.; writing—review and editing, L.B., V.K., and A.M.; project administration, V.K. and A.M.; funding acquisition, L.B. and V.K.

Funding

This research was funded by the National Oceanic and Atmospheric Administration’s Climate Program Office Pacific Regional Integrated Sciences and Assessments program, grant number NA10OAR4310216.

Acknowledgments

The authors thank Travis Hylton and Steve Anthony of the USGS-PIWSC for their technical support and scientific expertise. We also extend our gratitude to the many stakeholders on Maui and Oʻahu who contributed their expert knowledge, data, ideas, and enthusiasm to this work. Finally, the authors thank Delwyn Oki and three anonymous reviewers for their constructive comments.

Conflicts of Interest

The authors declare no conflict of interest. The funders had no role in the design of the study; in the collection, analyses, or interpretation of data; in the writing of the manuscript, or in the decision to publish the results.

References

  1. Giambelluca, T.W.; Diaz, H.F.; Luke, M.S.A. Secular temperature changes in Hawai’i. Geophys. Res. Lett. 2008, 35. [Google Scholar] [CrossRef]
  2. Keener, V.; Helweg, D.; Asam, S.; Balwani, S.; Burkett, M.; Fletcher, C.; Giambelluca, T.; Grecni, Z.; Nobrega-Olivera, M.; Polovina, J.; et al. Hawai’i and US Affiliated Pacific Islands. In Impacts, Risks, and Adaptation in the United States: Fourth National Climate Assessment, Volume II; US Global Change Research Program: Washington, DC, USA, 2018; pp. 1242–1308. [Google Scholar]
  3. Frazier, A.; Giambelluca, T.W. Spatial trend analysis of Hawaiian rainfall from 1920 to 2012. Int. J. Climatol. 2017, 37, 2522–2531. [Google Scholar] [CrossRef]
  4. Kruk, M.C.; Lorrey, A.M.; Griffiths, G.M.; Lander, M.; Gibney, E.J.; Diamond, H.J.; Marra, J.J. On the state of the knowledge of rainfall extremes in the western and northern Pacific basin. Int. J. Climatol. 2015, 35, 321–336. [Google Scholar] [CrossRef]
  5. Gingerich, S.B.; Oki, D.S. Ground Water in Hawai’i; US Geological Survey: Reston, VA, USA, 2000.
  6. Izuka, S.K.; Engott, J.A.; Rotzoll, K.; Bassiouni, M.; Johnson, A.G.; Miller, L.D.; Mair, A. Volcanic Aquifers of Hawai’i—Hydrogeology, Water Budgets, and Conceptual Models (ver. 2.0, March 2018); US Geological Survey: Reston, VA, USA, 2018; p. 158. [Google Scholar]
  7. Bassiouni, M.; Oki, D.S. Trends and shifts in streamflow in Hawai’i, 1913–2008. Hydrol. Process. 2013, 27, 1484–1500. [Google Scholar] [CrossRef]
  8. Anderson, H.W.; Duffy, P.D.; Yamamoto, T. Rainfall and Streamflow from Small Tree-Covered and Fern-Covered and Burned Watersheds in Hawaii: US Forest Service Research Paper PSW-34; Forest Service: Berkeley, CA, USA, 1966; p. 11.
  9. Wirawan, N. Vegetation and Soil-Water Regimes in a Tropical Rain Forest Valley on Oahu, Hawaiian Islands. Ph.D. Thesis, University of Hawai’i, Honolulu, HI, USA, 1978. [Google Scholar]
  10. Loague, K.; Lloyd, D.A.; Giambelluca, T.W.; Nguyen, A.; Sakata, B. Land misuse and hydrologic response: Kahoʻolawe, Hawai’i. Pac. Sci. 1996, 50, 1–35. [Google Scholar]
  11. Ziegler, A.D.; Giambelluca, T.W. Influence of revegetation efforts on hydrologic response and erosion, Kaho’olawe Island, Hawai’i. Land Degrad. Dev. 1998, 9, 189–206. [Google Scholar] [CrossRef]
  12. Gaskill, T.G.R. Hydrology of Forest Ecosystems in the Honouliuli Preserve: Implications for Groundwater Recharge and Watershed Restoration. Ph.D. Thesis, University of Hawai’i, Honolulu, HI, USA, 2004. [Google Scholar]
  13. Kagawa, A.; Sack, L.; Duarte, K.; James, S. Hawaiian native forest conserves water relative to timber plantation: Species and stand traits influence water use. Ecol. Appl. 2009, 19, 1429–1443. [Google Scholar] [CrossRef] [Green Version]
  14. Brauman, K.A.; Freyberg, D.L.; Daily, G.C. Forest structure influences on rainfall partitioning and cloud interception: A comparison of native forest sites in Kona, Hawai’i. Agric. For. Meteorol. 2010, 150, 265–275. [Google Scholar] [CrossRef]
  15. Takahashi, M.; Giambelluca, T.W.; Mudd, R.G.; DeLay, J.K.; Nullet, M.A.; Asner, G.P. Rainfall partitioning and cloud water interception in native forest and invaded forest in Hawai’i Volcanoes National Park. Hydrol. Process. 2011, 25, 448–464. [Google Scholar] [CrossRef]
  16. Perkins, K.S.; Nimmo, J.R.; Medeiros, A.C. Effects of native forest restoration on soil hydraulic properties, Auwahi, Maui, Hawaiian Islands. Geophys. Res. Lett. 2012, 39. [Google Scholar] [CrossRef] [Green Version]
  17. Perkins, K.S.; Nimmo, J.R.; Medeiros, A.C.; Szutu, D.J.; Von Allmen, E. Assessing effects of native forest restoration on soil moisture dynamics and potential aquifer recharge, Auwahi, Maui. Ecohydrology 2014, 7, 1437–1451. [Google Scholar] [CrossRef]
  18. Perkins, K.S.; Stock, J.D.; Nimmo, J.R. Vegetation influences on infiltration in Hawaiian soils. Ecohydrology 2018, 11, e1973. [Google Scholar] [CrossRef]
  19. Safeeq, M.; Fares, A. Interception losses in three non-native Hawaiian forest stands. Hydrol. Process. 2014, 28, 237–254. [Google Scholar] [CrossRef]
  20. DeLay, J.K. Forest Transpiration on Kīlauea Volcano, Hawai’i. Ph.D. Thesis, University of Hawai’i, Honolulu, HI, USA, 2015. [Google Scholar]
  21. Strauch, A.M.; Bruland, G.L.; MacKenzie, R.A.; Giardina, C.P. Soil and hydrological responses to wild pig (Sus scofa) exclusion from native and strawberry guava (Psidium cattleianum)—Invaded tropical montane wet forests. Geoderma 2016, 279, 53–60. [Google Scholar] [CrossRef] [Green Version]
  22. United States Census Bureau. American Fact Finder: Maui County, Hawai’i. Available online: https://factfinder.census.gov/faces/nav/jsf/pages/community_facts.xhtml?src=bkmk (accessed on 9 March 2018).
  23. Hawai’i Tourism Authority. Annual Visitor Research Report; Hawai’i Tourism Authority: Honolulu, HI, USA, 2017.
  24. Kozacek, C. Hawai’i River Restorations Reflect National Desire to Protect Water for Public Benefit. Available online: https://www.circleofblue.org/2014/world/Hawaii-river-restorations-emblematic-national-efforts-protect-water-public-benefit/ (accessed on 22 July 2019).
  25. Townscape, Inc. Hawai’i Water Plan, Water Resource Protection Plan Update 2019; Townscape, Inc.: Honolulu, HI, USA, 2019. [Google Scholar]
  26. Gingerich, S.B. Ground-Water Availability in the Wailuku Area, Maui, Hawai’i; US Geological Survey: Reston, VA, USA, 2008; p. 95.
  27. Gingerich, S.B.; Engott, J.A. Groundwater Availability in the Lahaina District, West Maui, Hawai’i; US Geological Survey: Reston, VA, USA, 2012; p. 90.
  28. Scanlon, B.R.; Healy, R.W.; Cook, P.G. Choosing appropriate techniques for quantifying groundwater recharge. Hydrogeol. J. 2002, 10, 18–39. [Google Scholar] [CrossRef]
  29. Healy, R.W. Estimating Groundwater Recharge; Cambridge University Press: Cambridge, UK, 2010. [Google Scholar]
  30. Giambelluca, T.W. Water Balance of the Pearl Harbor-Honolulu Basin, Hawaii, 1946–1975. Water Resources Research Center Technical Report 151; Water Resources Research Center: Honolulu, HI, USA, 1983; p. 151. [Google Scholar]
  31. Izuka, S.K.; Oki, D.S.; Chen, C.-H. Effects of Irrigation and Rainfall Reduction on Ground-Water Recharge in the Lihue Basin, Kauai, Hawaii; US Geological Survey: Reston, VA, USA, 2005; p. 48.
  32. Izuka, S.K.; Perreault, J.A.; Presley, T.K. Areas Contributing Recharge to Wells in the Tafuna-Leone Plain, Tutuila, American Samoa; US Geological Survey: Reston, VA, USA, 2007; p. 51.
  33. Engott, J.A. A Water-Budget Model and Assessment of Groundwater Recharge for the Island of Hawai’i; US Geological Survey: Reston, VA, USA, 2011; p. 53.
  34. Johnson, A.G. A Water-Budget Model and Estimates of Groundwater Recharge for Guam; US Geological Survey: Reston, VA, USA, 2012; p. 53.
  35. Mair, A.; Hagedorn, B.; Tillery, S.; El-Kadi, A.I.; Westenbroek, S.; Ha, K.; Koh, G.-W. Temporal and spatial variability of groundwater recharge on Jeju Island, Korea. J. Hydrol. 2013, 501, 213–226. [Google Scholar] [CrossRef]
  36. Engott, J.A.; Johnson, A.G.; Bassiouni, M.; Izuka, S.K.; Rotzoll, K. Spatially Distributed Groundwater Recharge for 2010 Land Cover Estimated Using a Water-Budget Model for the Island of O’ahu, Hawai’i (ver 2.0, December 2017); US Geological Survey: Reston, VA, USA, 2017; p. 49.
  37. Harlow, J.; Hagedorn, B. SWB modeling of groundwater recharge on Catalina Island, California, during a period of severe drought. Water 2019, 11, 58. [Google Scholar] [CrossRef] [Green Version]
  38. Engott, J.A.; Vana, T.T. Effects of Agricultural Land-Use Changes and Rainfall on Ground-Water Recharge in Central and West Maui, Hawai’i, 1926–2004; US Geological Survey: Reston, VA, USA, 2007; p. 56.
  39. Johnson, A.G.; Engott, J.A.; Bassiouni, M.; Rotzoll, K. Spatially Distributed Groundwater Recharge Estimated Using a Water-Budget Model for the Island of Maui, Hawai’i, 1978–2007 (ver. 2.0, February 2018); US Geological Survey: Reston, VA, USA, 2018; p. 53.
  40. Mair, A.; Johnson, A.G.; Rotzoll, K.; Oki, D.S. Estimated Groundwater Recharge from a Water-Budget Model Incorporating Selected Climate Projections, Island of Maui, Hawai’i; US Geological Survey: Reston, VA, USA, 2019; p. 46.
  41. Kepner, W.G.; Edmonds, C.M.; Watts, C.J. Remote Sensing and Geographic Information Systems for Decision Analysis in Public Resource Administration: A Case Study of 25 Years of Landscape Change in a Southwestern Watershed; US Environmental Protection Agency, Office of Research and Development: Washington, DC, USA, 2002.
  42. Hulse, D.W.; Branscomb, A.; Payne, S.G. Envisioning alternatives: Using citizen guidance to map future land and water use. Ecol. Appl. 2004, 14, 325–341. [Google Scholar] [CrossRef]
  43. Soliva, R.; Rønningen, K.; Bella, I.; Bezak, P.; Cooper, T.; Flø, B.E.; Marty, P.; Potter, C. Envisioning upland futures: Stakeholder responses to scenarios for Europe’s mountain landscapes. J. Rural Stud. 2008, 24, 56–71. [Google Scholar] [CrossRef]
  44. National Park Service. Using Scenarios to Explore Climate Change: A Handbook for Practitioners; National Park Service Climate Change Response Program: Fort Collins, CO, USA, 2013.
  45. Chaudhuri, G.; Clarke, K.C. The SLEUTH land use change model: A review. Environ. Resour. Res. 2013, 1, 88–104. [Google Scholar]
  46. Abuelaish, B.; Olmedo, M.T.C. Scenario of land use and land cover change in the Gaza Strip using remote sensing and GIS models. Arab. J. Geosci. 2016, 9, 274. [Google Scholar] [CrossRef] [Green Version]
  47. Berkhoff, K.; Herrmann, S. Modeling land use change: A GIS based modeling framework to support integrated land use planning (NabanFrame). In Advances in GIScience; Springer: Berlin, Germany, 2009; pp. 309–328. [Google Scholar]
  48. Liu, G.; Jin, Q.; Li, J.; Li, L.; He, C.; Huang, Y.; Yao, Y. Policy factors impact analysis based on remote sensing data and the CLUE-S model in the Lijiang River Basin, China. CATENA 2017, 158, 286–297. [Google Scholar] [CrossRef]
  49. Baker, J.P.; Hulse, D.W.; Gregory, S.V.; White, D.; Van Sickle, J.; Berger, P.A.; Dole, D.; Schumaker, N.H. Alternative futures for the Willamette River Basin, Oregon. Ecol. Appl. 2004, 14, 313–324. [Google Scholar] [CrossRef] [Green Version]
  50. Hulse, D.; Branscomb, A.; Enright, C.; Bolte, J. Anticipating floodplain trajectories: A comparison of two alternative futures approaches. Landsc. Ecol. 2009, 24, 1067–1090. [Google Scholar] [CrossRef]
  51. Guzy, M.R.; Smith, C.L.; Bolte, J.P.; Hulse, D.W.; Gregory, S.V. Policy research using agent-based modeling to assess future impacts of urban expansion into farmlands and forests. Ecol. Soc. 2008, 13, 37. [Google Scholar] [CrossRef] [Green Version]
  52. Flügel, W.-A.; Märker, M.; Moretti, S.; Rodolfi, G.; Sidrochuk, A. Integrating geographical information systems, remote sensing, ground truthing and modelling approaches for regional erosion classification of semi-arid catchments in South Africa. Hydrol. Process. 2003, 17, 929–942. [Google Scholar] [CrossRef]
  53. Delevaux, J.M.S.; Jupiter, S.D.; Stamoulis, K.A.; Bremer, L.L.; Wenger, A.S.; Dacks, R.; Garrod, P.; Falinski, K.A.; Ticktin, T. Scenario planning with linked land-sea models inform where forest conservation actions will promote coral reef resilience. Sci. Rep. 2018, 8, 1–21. [Google Scholar] [CrossRef]
  54. Kepner, W.G.; Ramsey, M.M.; Brown, E.S.; Jarchow, M.E.; Dickinson, K.J.M.; Mark, A.F. Hydrologic futures: Using scenario analysis to evaluate impacts of forecasted land use change on hydrologic services. Ecosphere 2012, 3, 1–25. [Google Scholar] [CrossRef]
  55. Giambelluca, T.; Chen, Q.; Frazier, A.G.; Price, J.P.; Chen, Y.-L.; Chu, P.-S.; Eischeid, J.K.; Delparte, D.M. Online rainfall atlas of Hawai’i. Bull. Am. Meteorol. Soc. 2013, 94, 313–316. [Google Scholar] [CrossRef]
  56. State of Hawai’i. Department of Land and Natural Resources. .Hawaii Statewide GIS Program; Aquifers: Honolulu, HI, USA, 2010. Available online: https://planning.hawaii.gov/gis/ (accessed on 9 September 2013).
  57. Kirch, P. Feathered Gods and Fishhooks: An Introduction to Hawaiian Archaeology and Prehistory; University of Hawai’i Press: Honolulu, HI, USA, 1985. [Google Scholar]
  58. Cooper, G.; Daws, G. Land and Power in Hawai’i: The Democratic Years; University of Hawai’i Press: Honolulu, HI, USA, 1990. [Google Scholar]
  59. Blackford, M. Fragile Paradise: The Impact of Tourism on Maui, 1959–2000; University of Kansas Press: Lawrence, KS, USA, 2001. [Google Scholar]
  60. Perroy, R.L.; Melrose, J.; Cares, S. The evolving agricultural landscape of post-plantation Hawai’i. Appl. Geogr. 2016, 76, 154–162. [Google Scholar] [CrossRef]
  61. Longman, R.J.; Diaz, H.F.; Giambelluca, T.W. Sustained increases in lower-tropospheric subsidence over the central tropical North Pacific drive a decline in high-elevation rainfall in Hawai’i. J. Clim. 2015, 28, 8743–8759. [Google Scholar] [CrossRef]
  62. Mair, A. Land Cover Map for the Island of Maui, Hawaii, 2017 (ver. 1.2, November 2018); US Geological Survey Data Release: Reston, VA, USA, 2018.
  63. Tanji, M. Operations Winding down at HC&S. The Maui News 2016. Available online: https://www.mauinews.com/news/local-news/2016/12/operations-winding-down-at-hcs/ (accessed on 29 October 2019).
  64. University of Hawai’i at Hilo. Statewide Agricultural Land Use Baseline 2015; Spatial Data Analysis and Visualization Laboratory: Hilo, HI, USA, 2016. [Google Scholar]
  65. Johnson, A.G. Mean Annual Water-Budget Components for the Island of Maui, Hawaii, for Average Climate Conditions, 1978–2007 Rainfall and 2010 Land Cover (version 2.0, November 2017); US Geological Survey Data Release: Reston, VA, USA, 2017.
  66. US Geological Survey. Landfire Existing Vegetation Type. Available online: https://www.landfire.gov/evt.php (accessed on 9 December 2013).
  67. Brewington, L.; Keener, V.; Finucane, M.; Eaton, P. Participatory scenario planning for climate change adaptation using remote sensing and GIS. In Comprehensive Remote Sensing, Volume 9: Applications for Societal Benefits; Liang, S., Walsh, S.J., Eds.; Elsevier: Amsterdam, The Netherlands, 2017; pp. 236–252. [Google Scholar]
  68. Brewington, L. Maui Future Land Cover Scenarios (ver. 1.1, January 2018). Available online: https://eastwestcenter567-my.sharepoint.com/:u:/g/personal/brewingl_eastwestcenter_org/EXctdZNrlT9Lrc6V3vcATTcBdI59f09PSaXieHVaIRqp5w?e=BDlFpl (accessed on 10 December 2019).
  69. Timm, O.; Diaz, H.F. Synoptic-statistical approach to regional downscaling of IPCC twenty-first century climate projections: Seasonal rainfall over the Hawaiian Islands. J. Clim. 2009, 22, 4261–4280. [Google Scholar] [CrossRef] [Green Version]
  70. Elison Timm, O.; Giambelluca, T.W.; Diaz, H.F. Statistical downscaling of rainfall changes in Hawai’i based on the CMIP5 global model projections. J. Geophys. Res. Atmos. 2015, 120, 92–112. [Google Scholar] [CrossRef]
  71. Zhang, C.; Wang, Y.; Hamilton, K.; Lauer, A. Dynamical downscaling of the climate for the Hawaiian Islands. Part I: Present day. J. Clim. 2016, 29, 3027–3048. [Google Scholar] [CrossRef] [Green Version]
  72. Zhang, C.; Wang, Y.; Hamilton, K.; Lauer, A. Dynamical downscaling of the climate for the Hawaiian Islands. Part II: Projection for the late twenty-first century. J. Clim. 2016, 29, 8333–8354. [Google Scholar] [CrossRef] [Green Version]
  73. Frazier, A.G.; Giambelluca, T.W.; Diaz, H.F.; Needham, H.L. Comparison of geostatistical approaches to spatially interpolate month-year rainfall for the Hawaiian Islands. Int. J. Climatol. 2016, 36, 1459–1470. [Google Scholar] [CrossRef] [Green Version]
  74. Mair, A. Mean Annual Water-Budget Components for the Island of Maui, Hawaii, for Projected Climate Conditions, CMIP3 A1B 2080-99 Scenario Climate and 2017 Land Cover; US Geological Survey Data Release: Reston, VA, USA, 2019.
  75. Mair, A. Mean Annual Water-Budget Components for the Island of Maui, Hawaii, for Projected Climate Conditions, CMIP5 RCP8.5 2071-99 Scenario Rainfall and 2017 Land Cover; US Geological Survey Data Release: Reston, VA, USA, 2019.
  76. Mair, A. Mean Annual Water-Budget Components for the Island of Maui, Hawaii, for a Set of Eight Projected Climate and Future Land-Cover Scenarios; US Geological Survey Data Release: Reston, VA, USA, 2019.
  77. Miles, K. Report on Study of Water Requirements of Taro in Hanapepe Valley; Territory of Hawai‘i and McBryde Sugar Co.: Numila, HI, USA, 1931; p. 52. [Google Scholar]
  78. Watson, L.J. Observations made with respect to irrigation and growth of taro at certain patches at Waiāhole and Kahaluu. In Reppun v. Board of Water Supply; Watson, L.J., Ed.; City & County of Honolulu Board of Water Supply, Water Resources Division: Honolulu, HI, USA, 1964. [Google Scholar]
  79. De la Pena, R.S.; Melchor, F.M. Water use and efficiency in lowland taro production. In Proceedings of the Symposium of the International Society for Tropical Root Crops, Lima, Peru, 21–26 February 1983. [Google Scholar]
  80. Berg, N.; McGurk, B.; Calhoun, R.S. Hydrology and Land Use Effects on the Hanalei National Wildlife Refuge, Kauai, Hawaii, Final Report; Interagency Agreement 14-48-0001-94588; USDA Forest Service: Albany, CA, USA, 1997; p. 62.
  81. Whittier, R.B.; El-Kadi, A.I. Human and Environmental Risk Ranking of Onsite Sewage Disposal Systems for the Hawaiian Islands of Kauai, Maui, Molokai, and Hawaii; Department of Geology and Geophysics, University of Hawaii: Honolulu, HI, USA, 2014; p. 253. [Google Scholar]
  82. Elison Timm, O. Future warming rates over the Hawaiian Islands based on elevation-dependent scaling factors. Int. J. Climatol. 2017, 37, 1093–1104. [Google Scholar] [CrossRef]
Figure 1. The Island of Maui: (a) Aquifer sectors and systems [56]; (b) Selected geographic features and rainfall isohyets representing lines of equal mean annual rainfall in mm (modified from [55]).
Remotesensing 11 03048 g001
Figure 2. Land cover map representing 2017 conditions for the Island of Maui [62].
Remotesensing 11 03048 g002
Figure 3. Downscaled future mean annual rainfall anomalies expressed as a fraction of the 1978–2007 reference period mean: (a) Wet future climate; (b) Dry future climate. The wet climate projection shows a 10% increase in island-wide mean annual rainfall, whereas the dry climate projection shows a 13% decrease.
Remotesensing 11 03048 g003
Figure 4. Mean annual groundwater recharge (in mm) for 2017 land cover conditions under (a) Wet future climate; (b) Dry future climate.
Remotesensing 11 03048 g004
Figure 5. (a) 2017 land cover. Only areas subject to change in Future 1 land cover scenario are shown; (b) Future 1 land cover change from 2017 land cover conditions. Only areas with changes to land cover are shown. Change in mean annual recharge for Future 1 land cover and (c) Wet future climate; (d) Dry future climate. The solid contour lines represent the base (610 m) or top (2500 m) of the cloud zone (see Figure 2).
Remotesensing 11 03048 g005aRemotesensing 11 03048 g005b
Figure 6. (a) 2017 land cover. Only areas subject to change in Future 2 land cover scenario are shown; (b) Future 2 land cover change from 2017 land cover conditions. Only areas with changes to land cover are shown. Change in mean annual recharge for Future 2 land cover and (c) Wet future climate; (d) Dry future climate. The solid contour lines represent the base (610 m) or top (2500 m) of the cloud zone (see Figure 2).
Remotesensing 11 03048 g006aRemotesensing 11 03048 g006b
Figure 7. (a) 2017 land cover. Only areas subject to change in Future 3 land cover scenario are shown; (b) Future 3 land cover change from 2017 land cover conditions. Only areas with changes to land cover are shown. Change in mean annual recharge for Future 3 land cover and (c) Wet future climate; (d) Dry future climate. The solid contour lines represent the base (610 m) or top (2500 m) of the cloud zone (see Figure 2).
Remotesensing 11 03048 g007aRemotesensing 11 03048 g007b
Figure 8. (a) 2017 land cover. Only areas subject to change in Future 4 land cover scenario are shown; (b) Future 4 land cover change from 2017 land cover conditions. Only areas with changes to land cover are shown. Change in mean annual recharge for Future 4 land cover and (c) Wet future climate; (d) Dry future climate. The solid contour lines represent the base (610 m) or top (2500 m) of the cloud zone (see Figure 2).
Remotesensing 11 03048 g008aRemotesensing 11 03048 g008b
Figure 9. Change in island-wide mean annual fog interception, irrigation, total ET, and recharge (in Mld) from 2017 land cover conditions under: (a) Wet future climate; (b) Dry future climate.
Remotesensing 11 03048 g009
Figure 10. Change in mean annual irrigation, fog interception, total ET, and recharge (in Mld) from 2017 land cover conditions for eight selected aquifer systems, under the Future 1 land cover scenario and dry future climate.
Remotesensing 11 03048 g010
Figure 11. (a) Future 1 land cover change from 2017 land cover conditions for ʻĪao aquifer system; (b) Change in recharge under a dry future climate. The solid contour line represents the base of the cloud zone at 610 m.
Remotesensing 11 03048 g011
Figure 12. (a) Future 1 land cover change from 2017 land cover conditions for the Nakula aquifer system; (b) Change in recharge under a dry future climate. The solid contour lines represent the base (610 m) or top (2500 m) of the cloud zone (see Figure 2).
Remotesensing 11 03048 g012aRemotesensing 11 03048 g012b
Table 1. Description of current and future land cover scenarios.
Land Cover ScenarioScenario Description
2017 land coverMap of Maui land cover that is representative of 2017 conditions [62].
Future 1 A conservation-focused future with high native forest restoration and low urban development. Traditional taro cultivation is restored to suitable areas, and diversified agriculture replaces former sugarcane in central Maui.
Future 2 A status-quo future in which no new native forest is restored, alien forest expands, all planned development projects are fully built out, tree plantation agriculture is promoted on ranchlands, and former sugarcane in central Maui remains fallow/grassland.
Future 3 1A development-focused future with low investment in conservation, resulting in island-wide alien forest expansion, build-out of all projects to the limits of Maui urban development boundaries, and biofuel crop production replaces former sugarcane in central Maui.
Future 4 1A future in which high native forest restoration and high urban development coexist, traditional taro agriculture is restored to suitable areas, tree plantation agriculture is promoted on ranchlands, and biofuel crop production replaces former sugarcane in central Maui.
1 In the Future 3 and 4 land cover scenario maps, areas in central Maui associated with a biofuel crop were assigned a diversified agriculture land cover classification.
Table 2. Island-wide mean annual rain, fog interception, irrigation, total ET, and recharge (in Mld) for two reference land cover/climate conditions: 2017 land cover and dry future climate, and 2017 land cover and wet future climate (modified from Mair et al. [40]).
Projected Climate ScenarioRain (Mld)Fog interception (Mld)Irrigation (Mld)Total ET (Mld)Recharge (Mld)
Wet future climate11,66276913436325208
Dry future climate925557813531074010

