Article

A New Remote Sensing Approach to Enrich Hydropower Dams’ Information and Assess Their Impact Distances: A Case Study in the Mekong River Basin

1
Department of Geography, Environment, and Spatial Sciences, Michigan State University, East Lansing, MI 48823, USA
2
Center for Global Change and Earth Observations, Michigan State University, East Lansing, MI 48823, USA
3
Asia Hub, Nanjing Agricultural University, Nanjing 210095, China
*
Author to whom correspondence should be addressed.
Remote Sens. 2019, 11(24), 3016; https://doi.org/10.3390/rs11243016
Submission received: 14 October 2019 / Revised: 8 December 2019 / Accepted: 12 December 2019 / Published: 14 December 2019
(This article belongs to the Section Remote Sensing in Geology, Geomorphology and Hydrology)

Abstract

:
Hydropower dam information such as construction and completion timings is often incomplete and missing in existing dam databases, and the hydropower dam’s adjacency impact distance, which is important to the surrounding environment, is also lacking for many dams. In this study, we developed a new remote sensing approach to specifically determine the timings and to assess the influencing distance on land use and land cover at the above and below dam areas. We established the new remote sensing method by identifying levels shifts in trajectories of Normalized Difference Vegetation Index (NDVI) indicators and by identifying the change point in entropy coefficient of variation (CV) variations to allow an auto-acquisition of the information above at the water basin level. We used three geospatial datasets including 1) a 30-year Landsat time series, 2) an annual Landsat Normalized Difference Vegetation Index (NDVI) composite, and 3) digital elevation model (DEM) data. We applied the proposed method to the Mekong River Basin (MRB) in Southeast Asia, where hydropower dam constructions have increased significantly since the 1990s. Results suggested that we were able to obtain the desired information for 67 Mekong hydropower dams successfully. Pearson correlation tests were used to validate timing results against official records, and the correlation coefficients were found to be 0.96 and 0.90, respectively, for construction and completion timing determination. We discovered that the buffer radius of a Mekong dam’s adjacency impact on land use and land cover was usually 4.0-km and 2.5-km in the above and below dam area. The data determined from this study may fill important information gaps in existing dam databases, and the approach developed in this case may be generalized to the other watersheds of the world, where hydropower dams exist. However, essential dam information is either incomplete or unavailable.

Graphical Abstract

1. Introduction

The last century has witnessed a dramatic increase in hydropower dam constructions, especially in regions where the population increases while economic development and climatic fluctuations grew at an unprecedented rate [1,2]. However, even though hydropower dams’ information is critical in effective dam management at the watershed level [3,4], the authors found that it is either lacking or missing in existing dam databases. Unreliable dam information and apparent records insufficiency, as undependable input parameters, would reduce the outcome accuracy of models designed to uncover hydropower dam’s impacts on hydrology, ecology, biodiversity, and the environment.
Three widely used global dam databases were taken as examples including Global georeferenced database of dams (GOOD), Global reservoir and dam database (GRanD), and Global power plant database. GOOD contains the most records (e.g., 38500), but it only has the dam geo-location information [5]. Though the number of recorded dams in GRanD (e.g., 7250) and the Global power plant database (e.g., 29910) is smaller than that of GOOD, these two have included more dam attributes such as dam commission year, crest height, construction dimension, and more [6,7]. Sometimes, records of the same dam from different databases were found to be inconsistent. For instance, the Beaver dam in the United States of America was built in the 1960s. The specific commission year was 1963 in GRanD but was 1965 in the Global power plant database. The authors believed this kind of record discrepancy needs to be solved for better data quality.
According to the technical documentation of different dam databases, the most common way to receive hydropower dams’ attributes was to collect, compile, and validate them from resources like public reports, project documentation, literature, media articles, and Google Earth [5,6,7]. Such an arduous, manual procedure was labor-intensive, time-consuming, and could be problematic. The uncertainty in database reliability was consequently increased, with the value of data reduced unintentionally. It is necessary, therefore, to develop a new approach to obtain the essential information of a hydropower dam with higher efficiency and accuracy. One of the most straightforward ways was to take advantage of continuous and frequent dam observations.
Remote sensing allows large-scale consecutive land surface observations at different spatial resolutions since the early 1970s [8]. Multi-spatial and temporal resolution satellite imageries and remote sensing methods combined with techniques in Geographic Information Science (GIS) and spatial data analysis fields have been applied in many studies to address questions regarding the hydropower dam influence. They were mainly used to determine and quantify the landscape patterns shifts [9,10], hydrological alterations [11,12], ecological responses [13,14], and geological deformations [15,16] induced by dam constructions from small areas to large regions.
Taking advantage of remote sensing capabilities, we developed a new, satellite data-based approach to (1) determine hydropower dam construction and completion timings, and (2) assess the spatial extent of hydropower dam impact on land use and land cover at the above and below dam areas. First, precise project timing information improves the data reliability, and the adjacency impact distance of a dam enriches the database diversity. Second, knowing dam project timings can help parameterize hydrology, ecology, biodiversity, and agriculture models for hydropower dam impact assessments at different construction phases (e.g., before, during, and after construction), and determining its spatial influencing distance will allow better understandings of the environmental and ecological consequences of a hydropower dam at different subdivisions separated by the dam [17,18,19,20]. Furthermore, this method was proposed to return the desired information for dams within the same large watershed simultaneously.
In this study, we chose the Mekong River Basin (MRB) as a case study site to demonstrate the feasibility of the new remote sensing method. Since 1956, a total number of 320 hydro projects have been implemented in this region [21,22,23] to mitigate frequent floods and droughts caused by increasingly extreme climate variability [24,25,26] and uneven water resource distribution [27]. This river basin covers an immense catchment area of 795,000 km2 [28] and breeds one of the most significant regions of biodiversity worldwide [29,30,31]. However, large human-managed hydropower dams exert a significant threat on the basin’s biodiversity [32,33,34] and hydrology [35,36]. An efficient and reliable approach to derive hydropower dam timing information and its impact distance becomes even more necessary for the MRB, from the perspectives of both water resources management and environmental and ecological sustainable conservations.

2. Materials and Methods

2.1. Data Used

In this study, we mainly used Landsat imagery and digital elevation model (DEM) data to help estimate the hydropower dam’s construction and completion timings, and to assess the consequent spatial extent of the dam’s impact on land use and land cover at the above and below dam areas. We downloaded an MRB boundary shapefile from the OpenDevelopmentMekong website (https://opendevelopmentmekong.net/). Official construction of the start year information was collected from the United Nations Climate Change website and completion year records were obtained from the Water, Land, and Ecosystems (WLE) Greater Mekong Dam database, which was updated in September 2017 [21]. We double-checked the records using the available information from resources such as open-source project documentation and articles in the local news. These data were prepared for result validation.

2.1.1. Remote Sensing Data

Two Landsat datasets were used in this study. The first is the 30-m Landsat 5/7/8 TM/ETM+/OLI annual greenest-pixel Top of Atmosphere (TOA) reflectance product from 1988 to 2017, which was acquired from the Google Earth Engine (GEE) [37,38] data repository. 1988 is the earliest year available when this Landsat product covers the entire basin while 2017 is the last year of the product. Each image contains original Landsat bands and a ‘greenness’ band. The latter is composed of pixels of the highest Normalized Difference Vegetation Index (NDVI) value calculated from all available United States Geological Survey (USGS) Landsat scenes throughout the whole year. First, we chose red/near-infrared (NIR) bands and produced an annual maximum NDVI images from 1988 to 2017. Then, we validated the chronologically-stacked NDVI dataset using the greenness band and clipped this time series into the MRB boundary.
The second dataset is the 2017 Landsat 8 annual NDVI composite, which comprises the most recent NDVI pixels from all available Landsat images of 2017. We used this image to help extract above and below dam areas to assess its spatial impact extent on land use and land cover. A key piece of information in this case is the elevation. We used the “ALOS World 3D-30m” (AW3D30) product by the Japan Aerospace Exploration Agency (JAXA), published in May 2016, and downloaded this data from the official project website (http://www.eorc.jaxa.jp/ALOS/en/aw3d30/index.htm) [39,40].

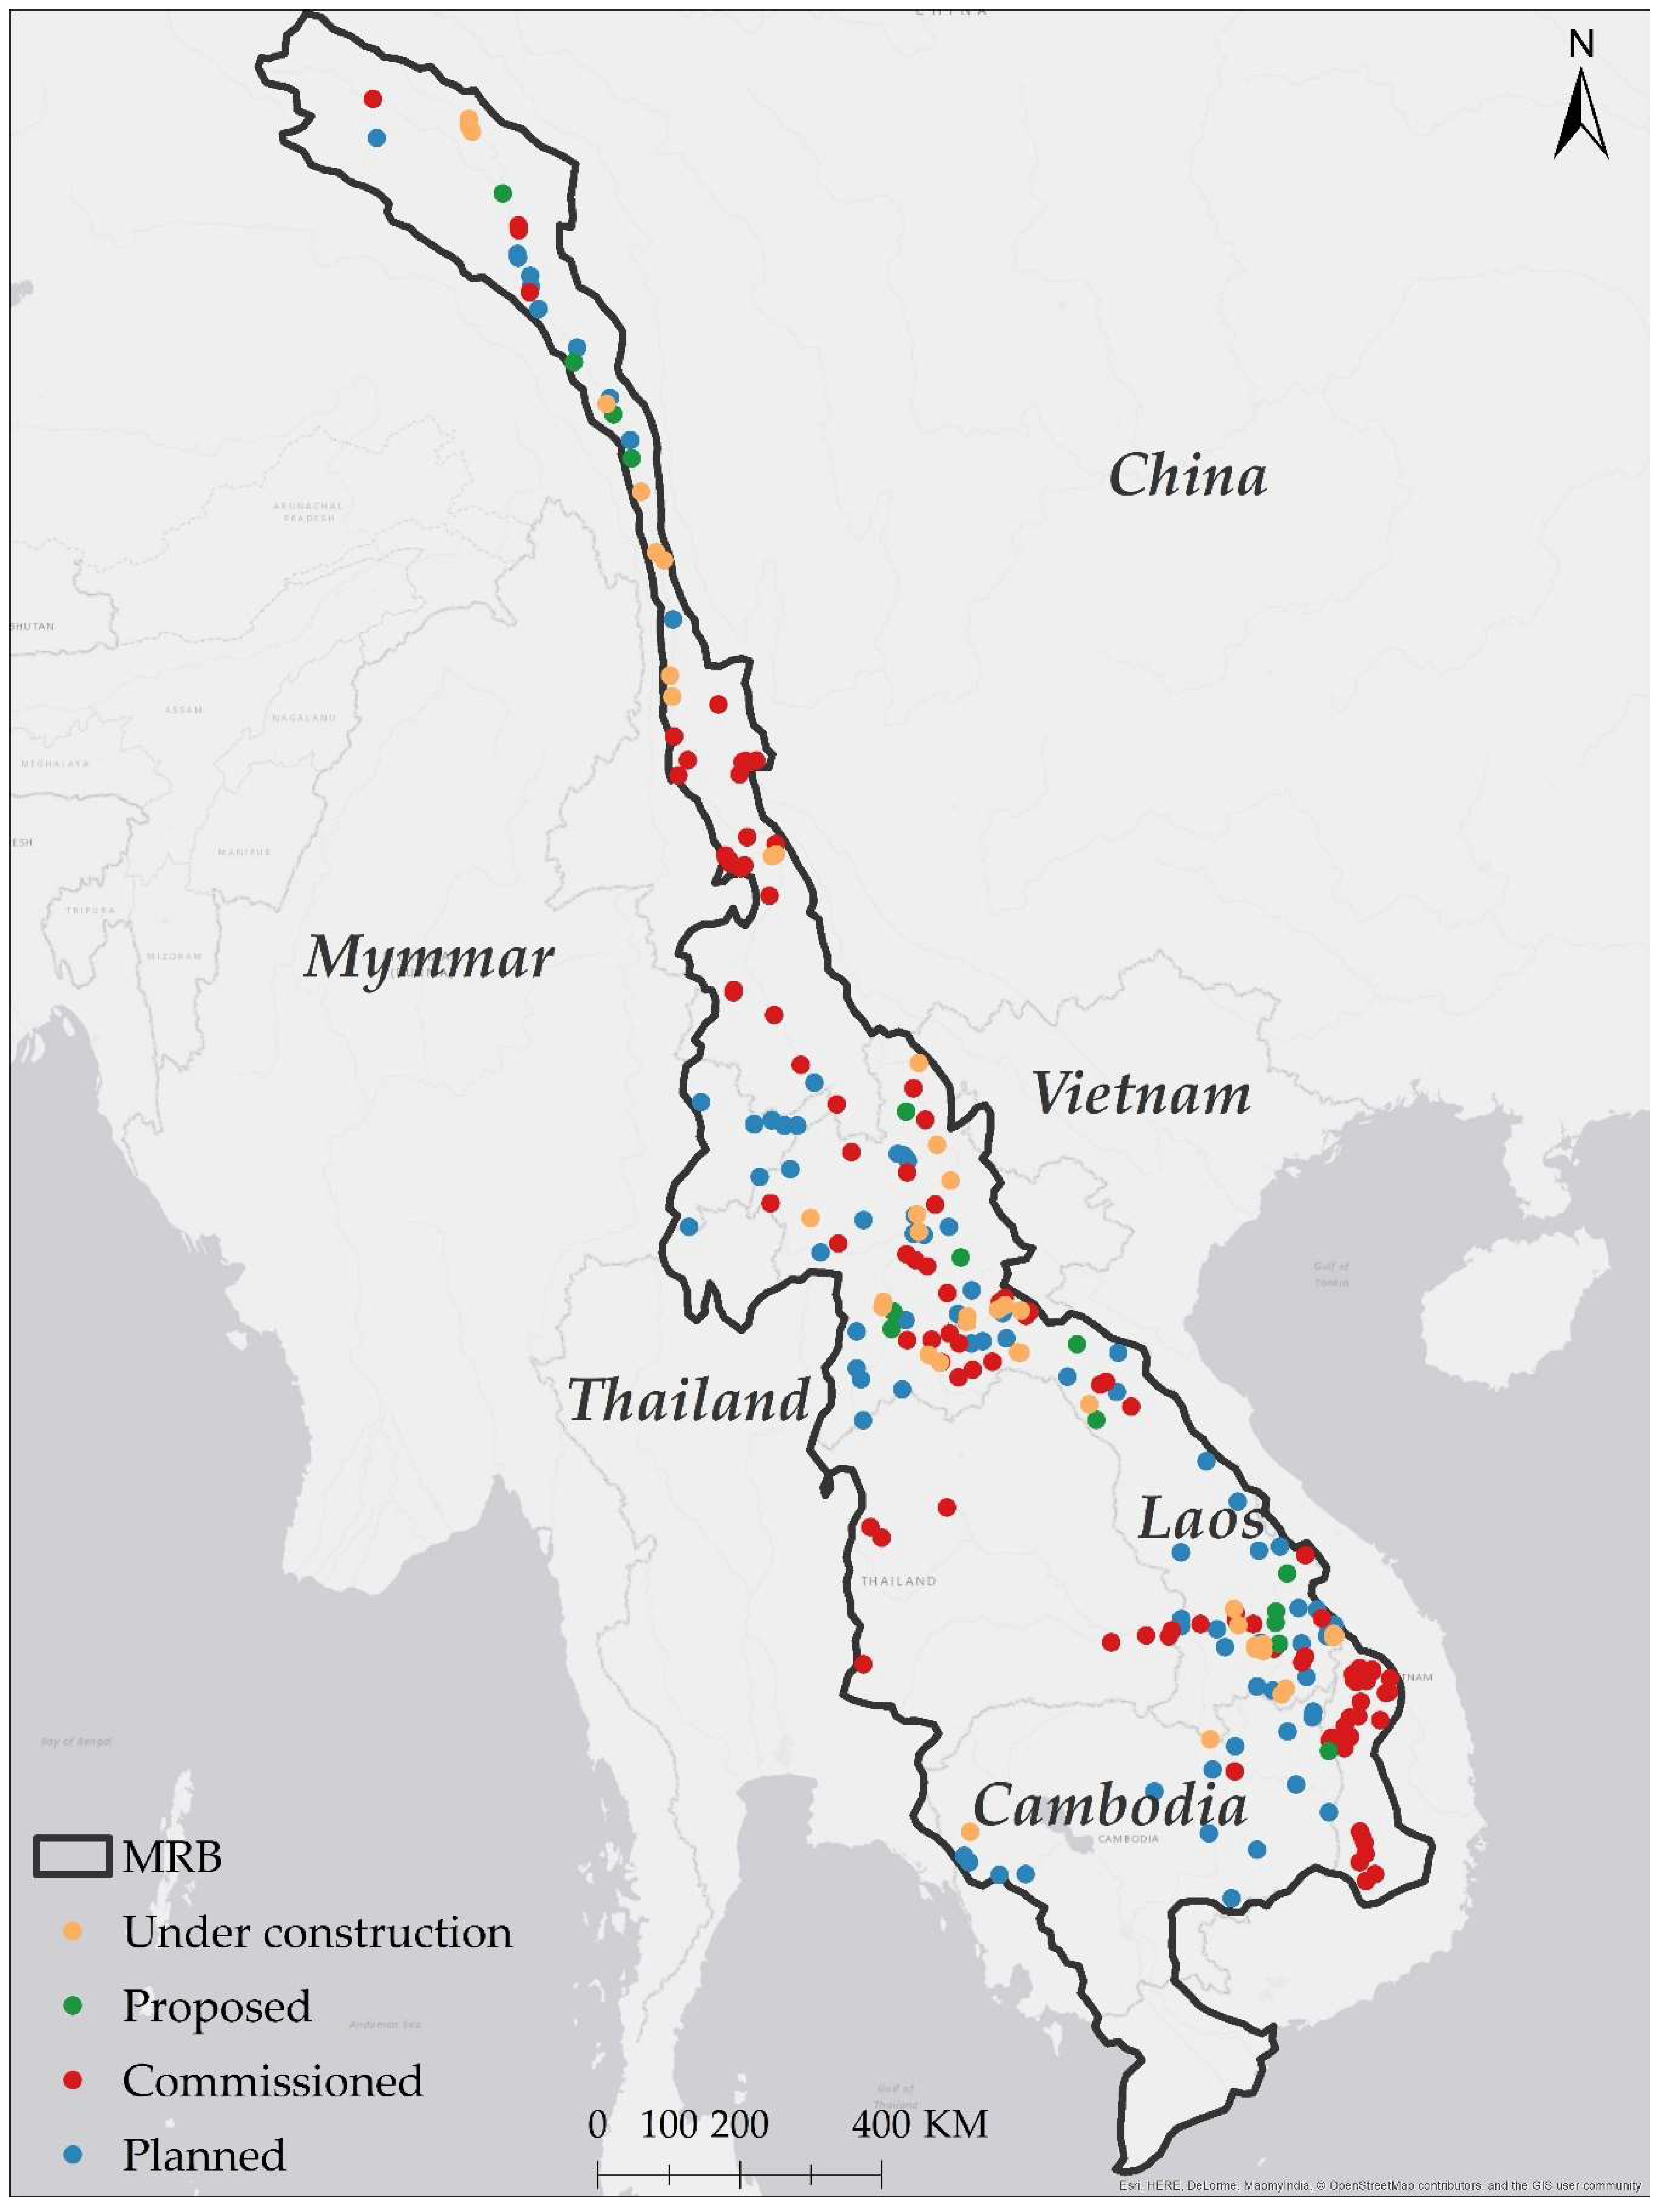
2.1.2. MRB Hydropower Dam Data

According to the WLE Greater Mekong Dam database [21], 102 hydropower dams have been completed and committed to working in this river basin by 2017. Forty-one hydropower dams are being built, which mainly distribute in two countries (China and Lao People’s Democratic Republic). Five of them are very large hydropower projects with installed capacity over or close to 1000 Megawatt (MW). Ninety-three hydropower dams have been planned and proposed to finish by 2030 in China, Lao People’s Democratic Republic, Myanmar, Vietnam, and Cambodia (see Figure 1 and Table 1).
Many hydropower dam characteristics have been recorded in the WLE Greater Mekong Dam database [21], project name, country, river, latitude, longitude, function, status, commission year, installed capacity, and mean annual-generated energy. However, due to nondisclosure agreements, research staff of the Greater Mekong CGIAR Research Program who produced the WLE Greater Mekong Dam database [21] had no means to acquire complete dam information. Only columns of geolocation, function, and current status have full records. The construction start year information is lacking. The dam completion year is recorded in the column named commission year and is available for 82 out of the total 102 hydropower dams.
Given the fact that the applied Landsat dataset started from 1988, we removed 15 hydropower dams committed before 1988. Therefore, the total number of eligible working hydropower dams with solid completion year records was 67 dams. We collected construction start year information in the project design documents from the clean development mechanism sub-page (https://cdm.unfccc.int/about/index.html) of the United Nations Climate Change website (https://unfccc.int/). Five of them were found to have no construction start year information. Lastly, a full list of Mekong hydropower dams with official timing records and assigned dam IDs were produced (see Table 2).
Geo-coordinates of these 67 hydropower dams were extracted from the WLE Greater Mekong Dam database [21] and verified using the Google Earth Pro. The geo-information was compiled and converted in ArcMap 10.2 and exported as a Zipped Keyhole Markup Language (KMZ) file for further spatial computation and analysis in GEE.

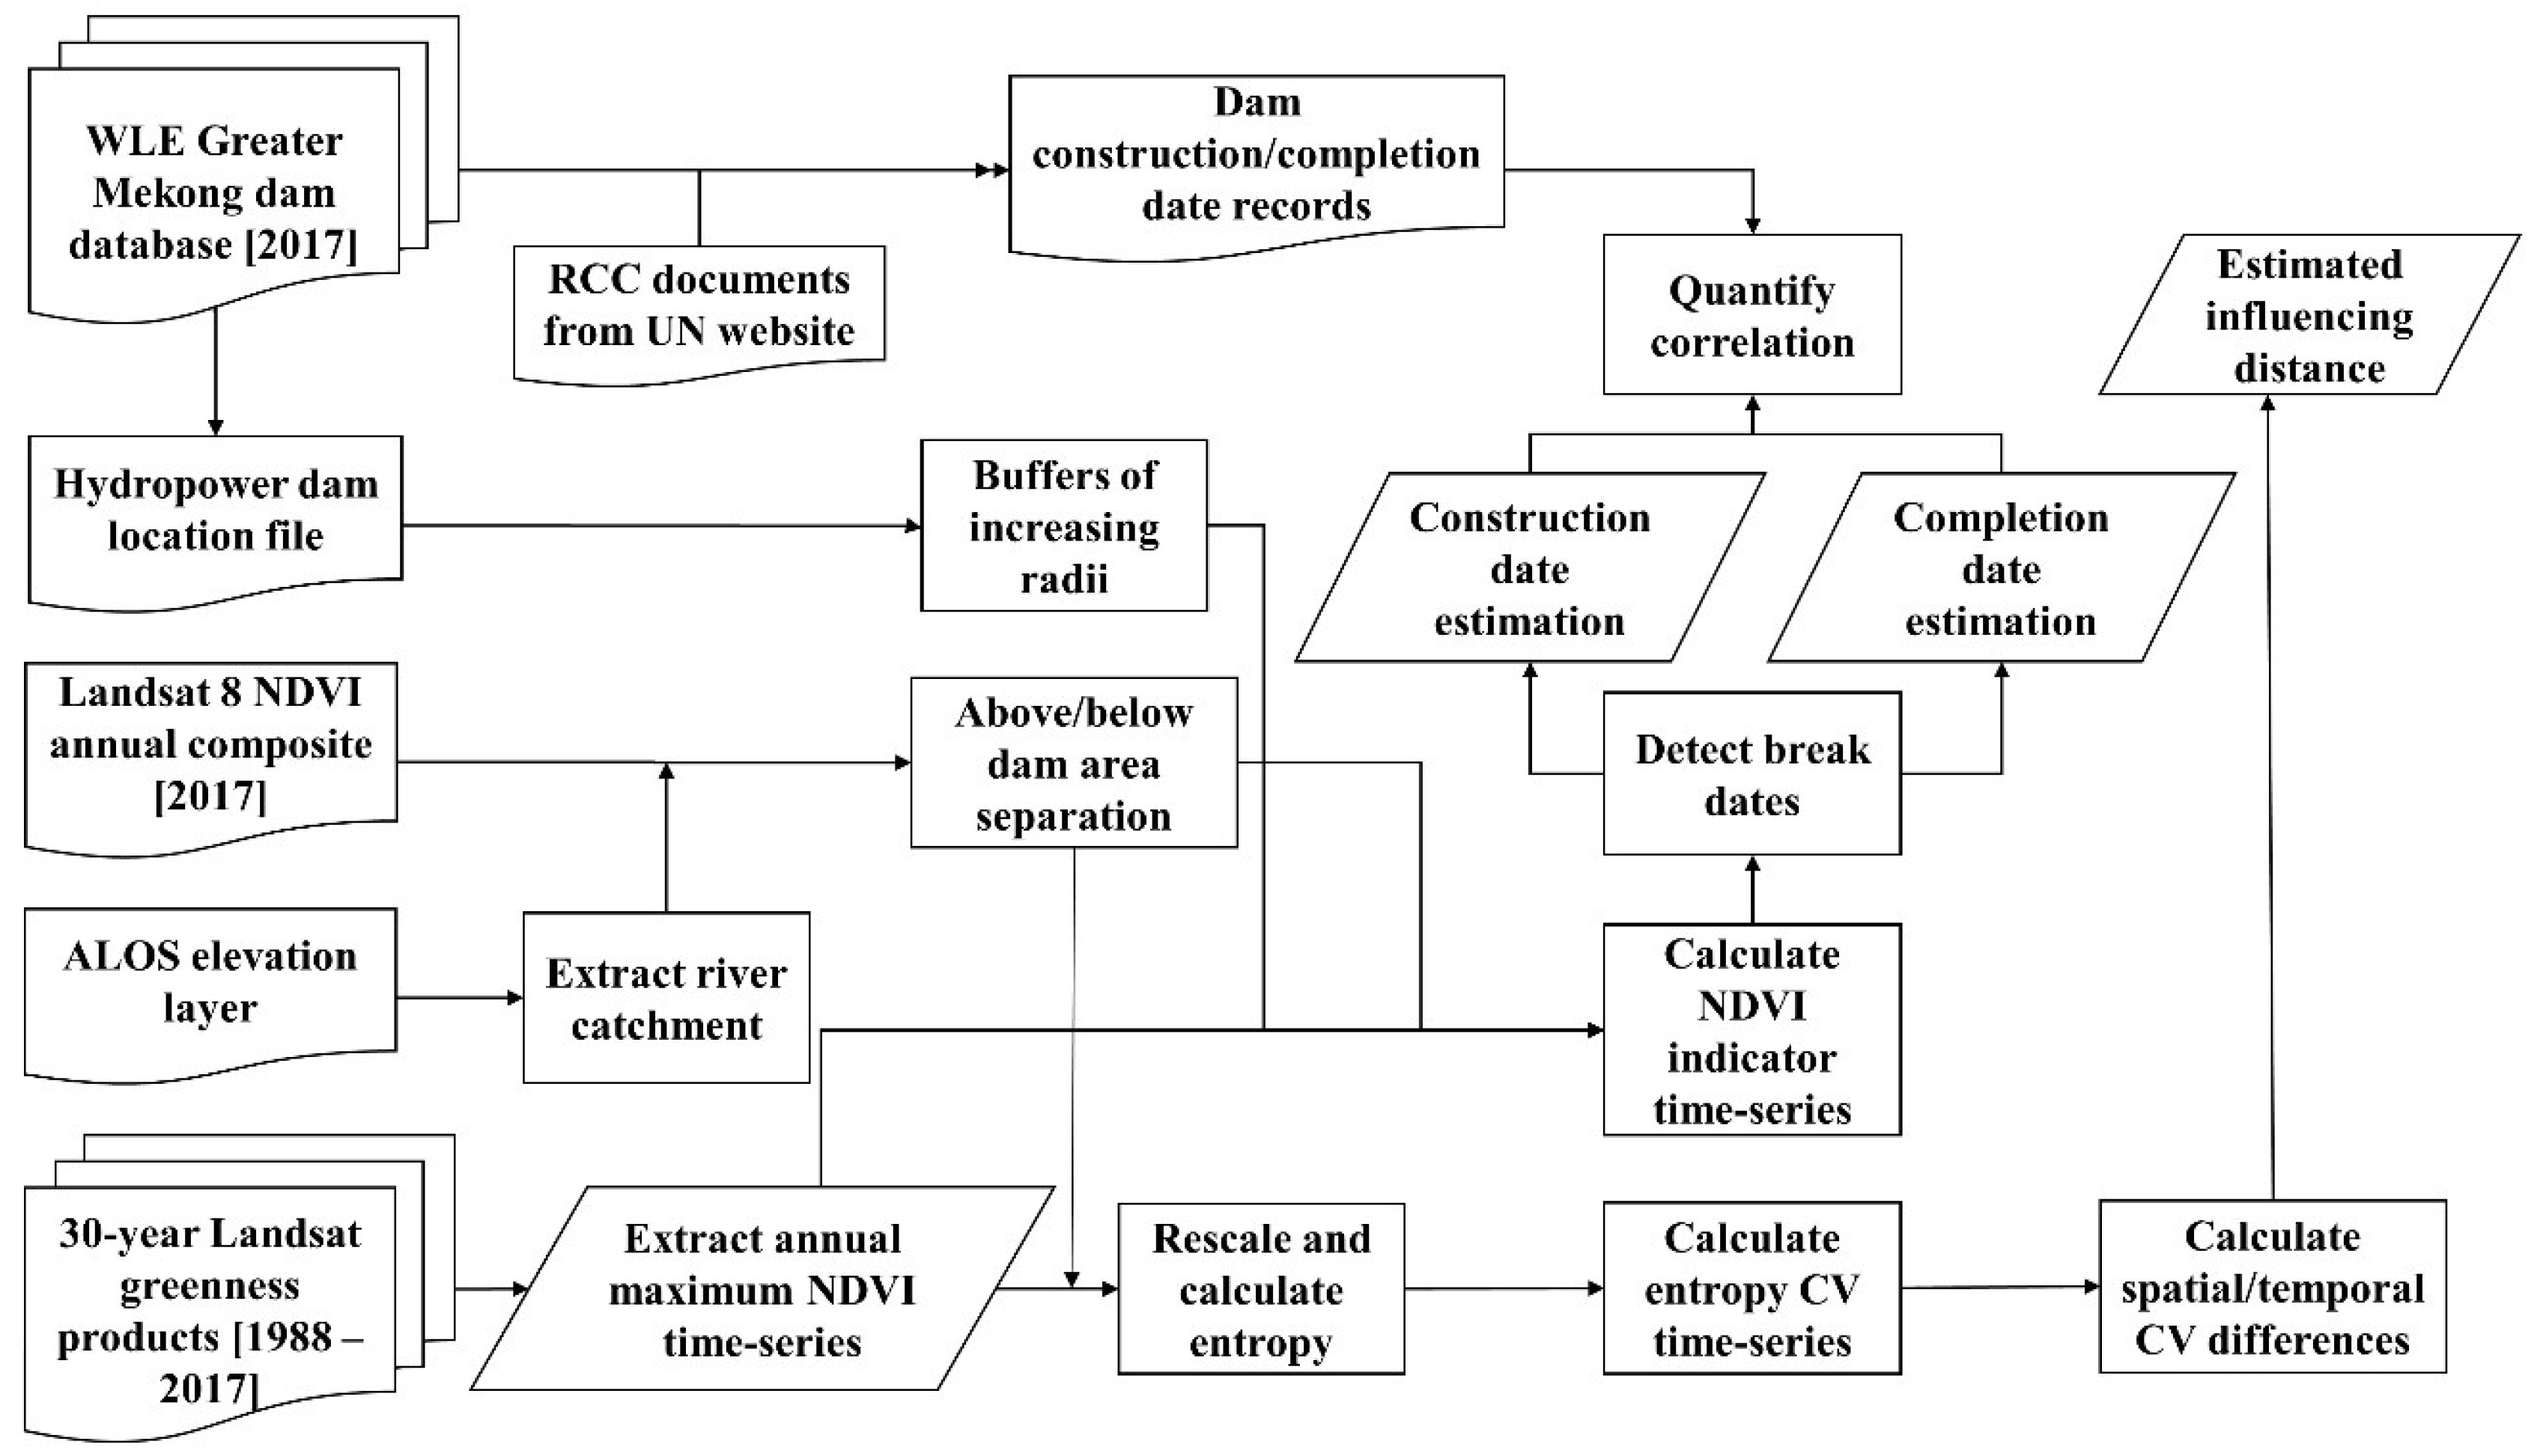
2.2. The New Remote Sensing Approach

The newly proposed remote sensing method (see Figure 2) was established based on the three principles: (1) land cover change differed at areas separated by a hydropower dam body during the entire construction phase, (2) the hydropower dam’s influence on surrounding land use diminished the land cover changes as the distance to the dam enlarged and differed at the above and below dam areas, and (3) the land cover change caused by the construction activity only occurred within a relatively small area while the dam’s adjacency impact took place over a larger space.
First, we separated land surrounding a hydropower dam into three subdivisions: buffer, above dam area, and below dam area. The buffer area is the circle centered at the dam site centroid. The above dam area is located at the subregion where the river water has not flown through the dam, and, usually, water is accumulated in this area. The below dam area is the subregion where river water flows through the dam. It includes the river channel and vegetation on the river banks. We believed that the construction work caused different land cover changes between the above dam area and the below dam area. In addition, these changes would be reflected through the level shifts in the long-term trajectories of some indicators, which could be generated from the remote sensing imagery.
Second, applied NDVI-based indicators included NDVI mean, standard deviation (SD), and a coefficient of variation (CV). CV, which is also known as the coefficient of dispersion, is of significant importance in geoscience since it allows comparisons among variates regardless of scale effects [41]. Time-serial statistics of these three indicators were generated and applied to determine the timings of construction and completion. Results were compared with the year’s information in Table 2 to assess the capability of this remote sensing approach.
Third, the impact distance of a hydropower dam on adjacent land use and land cover was estimated using spatial and temporal entropy CV differences for Mekong hydropower dams at the above and below dam areas. We assumed that the influence caused by an operating hydropower dam might be different in these areas. In this study, we did not focus on the specific land cover transitions because each dam and its influenced surrounding lands had their unique pattern and story. We were interested in the maximum impact extent of a dam.

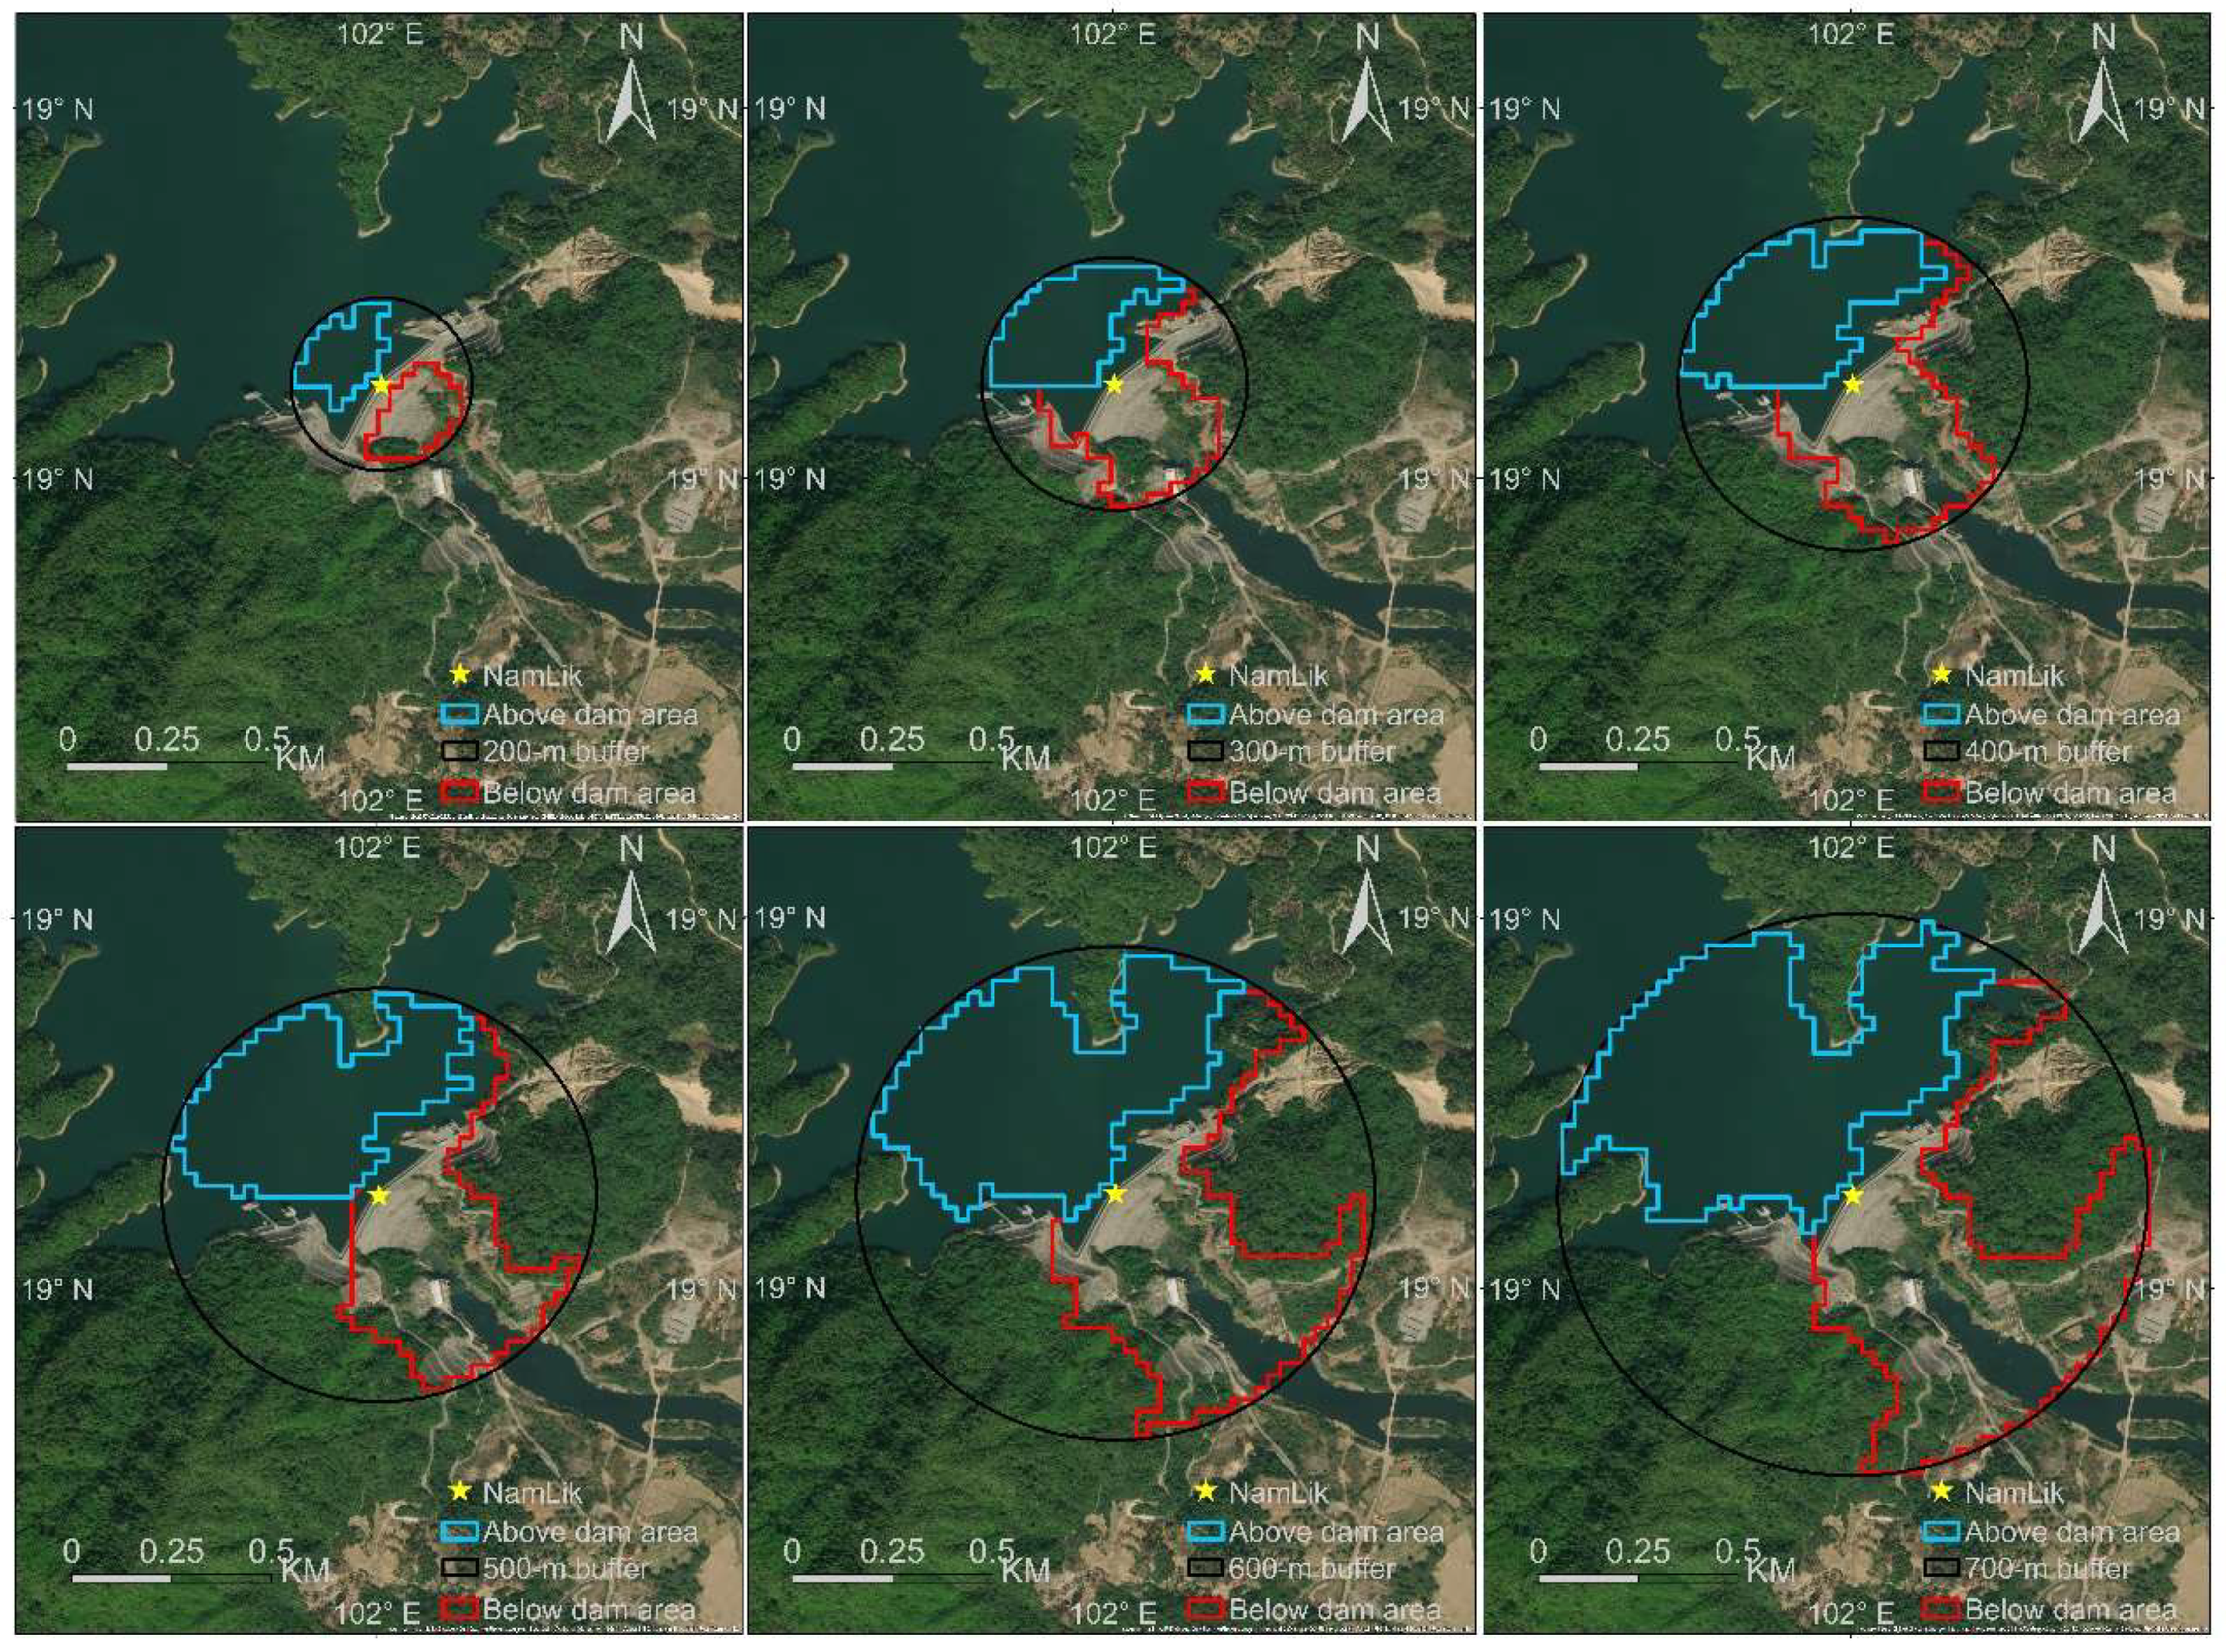
2.2.1. Differentiated Above Dam Area and Below Dam Area

We assumed that there was an optimal distance threshold at which the change points in NDVI-based indicators’ trajectory could best determine the construction and completion timings. Thus, we performed spatial calculations above the dam area, below the dam area, and buffers using increasing distances: the buffers’ radii rose from 200-m to 700-m in 100-m increments. The reasons we chose these buffer sizes were that (1) as discussed in the first paragraph of Section 2.2, the land cover changes caused by constructional activity were limited within the project site, of which the size was usually no larger than 700-m by visually checking dam construction sites using Google Earth Pro, (2) the omitted 100-m buffer radius was too short showing enough land surface variations for change detection, and (3) the 100-m interval was adequate to capture the changes gradually. A radius length smaller/larger than this might cause unnecessary computational redundancy/insufficiency.
In this case, we defined different combinations of the indicator, area, and radius as different scenarios. For example, we performed a time-serial NDVI mean calculation at the area above the dam using a buffer radius size of 500 m for a selected dam. Then we named this case as “Above area_500m_Mean” and counted it as one scenario. For every dam, the number of calculations was determined by the product of three indicators (e.g., NDVI mean, SD, and CV), six different lengths of buffer radius (e.g., 200-m, 300-m, …, 700-m), and three different extraction areas (e.g., above dam area, below dam area, and buffer), which equaled 54 (3 × 6 × 3) calculations. Since the number of studied hydropower dams was 67 dams, the total number of analyzed scenarios for all dams’ timing determination was 3618 (54 × 67).
To separate the above and below dam areas, first, we created a buffer centered at a hydropower dam and then extracted river catchments by dichotomizing elevation within this buffer. Specifically, pixels of the first 70% elevation data were aggregated as catchment because water always flows from a high altitude to a low altitude. Then, we used the NDVI percentage to determine the above and below dam areas within the catchment. The spatial NDVI mean value of the above dam area should be smaller due to the emergence of the affiliated water storage reservoir. Therefore, we produced NDVI-based subregions using the 2017 Landsat 8 annual composite, which represented the most recent land use and land cover pattern after all 67 hydropower dams began to function. We merged pixels of the first 40% NDVI values to be above the dam area and grouped the left 60% as below the dam area. After that, we refined the results by eliminating small patches with fewer than 40 pixels. Lastly, all raster images were converted into vector masks for future computations.

2.2.2. Construction Start and Completion Timing Determination

The trajectory of each indicator was expected to exhibit structural level shifts, either upward or downward, in response to the hydropower dam impacts on water redistribution and vegetation coverage. The first level shift should show up right after the construction started and continued as the work went on. The second level shift would emerge when the construction was finished and the new land pattern close to the dam site was formed. Such a level shift is usually endogenous and can be recognized by checking and assessing abrupt deviations in the stability of a linear regression model. Generally, the last observation in a segment consequence is called a breakpoint. Let us assume that there are n breakpoints that interrupt the consistency of a linear regression. Then, the total number of segments should be n + 1, and the model can be defined by the equation below.
y i = x i × b j + u i   ( i = i j 1 + 1 ,   , i j ,   j = 1 ,   ,   n + 1 )
where j stands for the segment index. In the 1990s, Bai et al. [42,43,44,45] proposed and established the foundation of time-serial breakpoints detection, which can be simplified as the minimization of the residual sum of squares (RSS) for Equation (1). The time node where a breakpoint emerges is interpreted as a break date.
Statistics and finance are two major fields where a majority of research regarding structural change detection has been carried out [46,47,48,49,50,51]. To the best of the authors’ knowledge, few studies have been made in geoscience. Our study adopted and applied this algorithm to reveal significant structural breaks with a deterministic trend in the 30-year trajectories of NDVI-based indicators. In this scenario, we considered identified breakpoints as possible construction and completion timings.
Specifically, time-serial NDVI mean, SD, and CV statistics for all 3618 scenarios were generated by applying a reducer method to the 30-year Landsat greenest-pixel products using vector masks produced in Section 2.2.1. The reducer method is an Earth Engine JavaScript-based function that allows image aggregations over space, time, bands, arrays, and other data structures, and can be called using the “ee.Reducer()” command at the GEE platform [37,38]. Final numeric outcomes were exported from GEE in a comma-separated values (CSV) file format. The R-based code was developed to detect breakpoints and break dates. We first created a time-serial object in R using the GEE-exported statistics for every scenario. Then we called both breakpoints and break dates detection functions from the “strucchange” package [52] within for-loops and exported possible timings in terms of calendar years for the 67 Mekong hydropower dams. Several large hydropower dams were observed to have more than two break date results, which was mainly because the construction activity had been in abeyance for a while during the entire project period.

2.2.3. Entropy-Based Hydropower Dam Influencing Distance Above and Below the Dam Areas

To identify the extent of a hydropower dam’s spatial impact on land use and land cover above and below the dam areas, we computed time-serial entropies using NDVI to investigate the potential maximum influencing distance in terms of a buffer radius. The radius size ranged from 500-m to 6-km and equally increased using a 500-m increment. Both the radius size and increment size were larger than those used for timing determinations in Section 2.2.1. This was because, as mentioned in the first paragraph of Section 2.2, the dam’s adjacency impact on land use and land cover changes was more significant and prolonged than what happened during the construction phase. According to the work of Zhao et al., the maximum threshold distance of the Manwan hydropower dam was 5000 to 6000 m [53]. Thus, we adopted 6000 m as the upper limit. Similar to the selection of a 100-m interval for timing detection, the 500-m interval was an optimal one that prevented unnecessary computational redundancy and insufficiency.
In this study, the indicator we used to evaluate the change extent was the image entropy in terms of NDVI. Entropy is the randomness measurement of a region and can be expressed by the equation below.
E n t r o p y = i = 0 N g 1 P ( i ) × ln P ( i )
where Ng denotes the number of distinct gray levels in the quantized image and P(i) represents the probability of each pixel value. This metric has been applied in many remote sensing studies for image classification [54,55,56]. In this case, we used it to evaluate land use and land cover change dynamics caused by a functioning hydropower dam. We hypothesized that such change dynamics would diminish at a certain distance, and the difference between entropy CV values at different distances could represent the magnitude of hydropower dam influence over space. We assumed a higher value indicated a more dramatic land use and land cover change given the increasing complexity of land cover and more specialized land use.
First, we produced buffers centered at a hydropower dam body with radii equally increasing from 500-m to 6-km in 500-m increments. Second, we separated the buffers into two subdivisions above and below the dam areas. To include as much as land surface, we enlarged the areas into semicircles. Third, we rescaled NDVI values from [−1–1] to [0–255] for the 30-year Landsat greenest-pixel collection to meet the discrete-valued input requirement for entropy computation. After that, we calculated time-serial CVs of entropy (kernel size = 3) and averaged the statistics within the separated areas. Then, we produced CV differences between every two adjacent semicircles (e.g., CV1000-CV500, CV1500-CV1000, …, CV5500-CV5000, CV6000-CV5500). Lastly, we calculated the interannual amplitude (maximum-minimum) of CV difference after a hydropower dam started to work. These steps were repeated for 65 hydropower dams in the GEE platform because the Lower Sesan 2 and Xekaman-Sanxay hydropower dam were both finished in 2017, which was the last year of available datasets.

3. Results

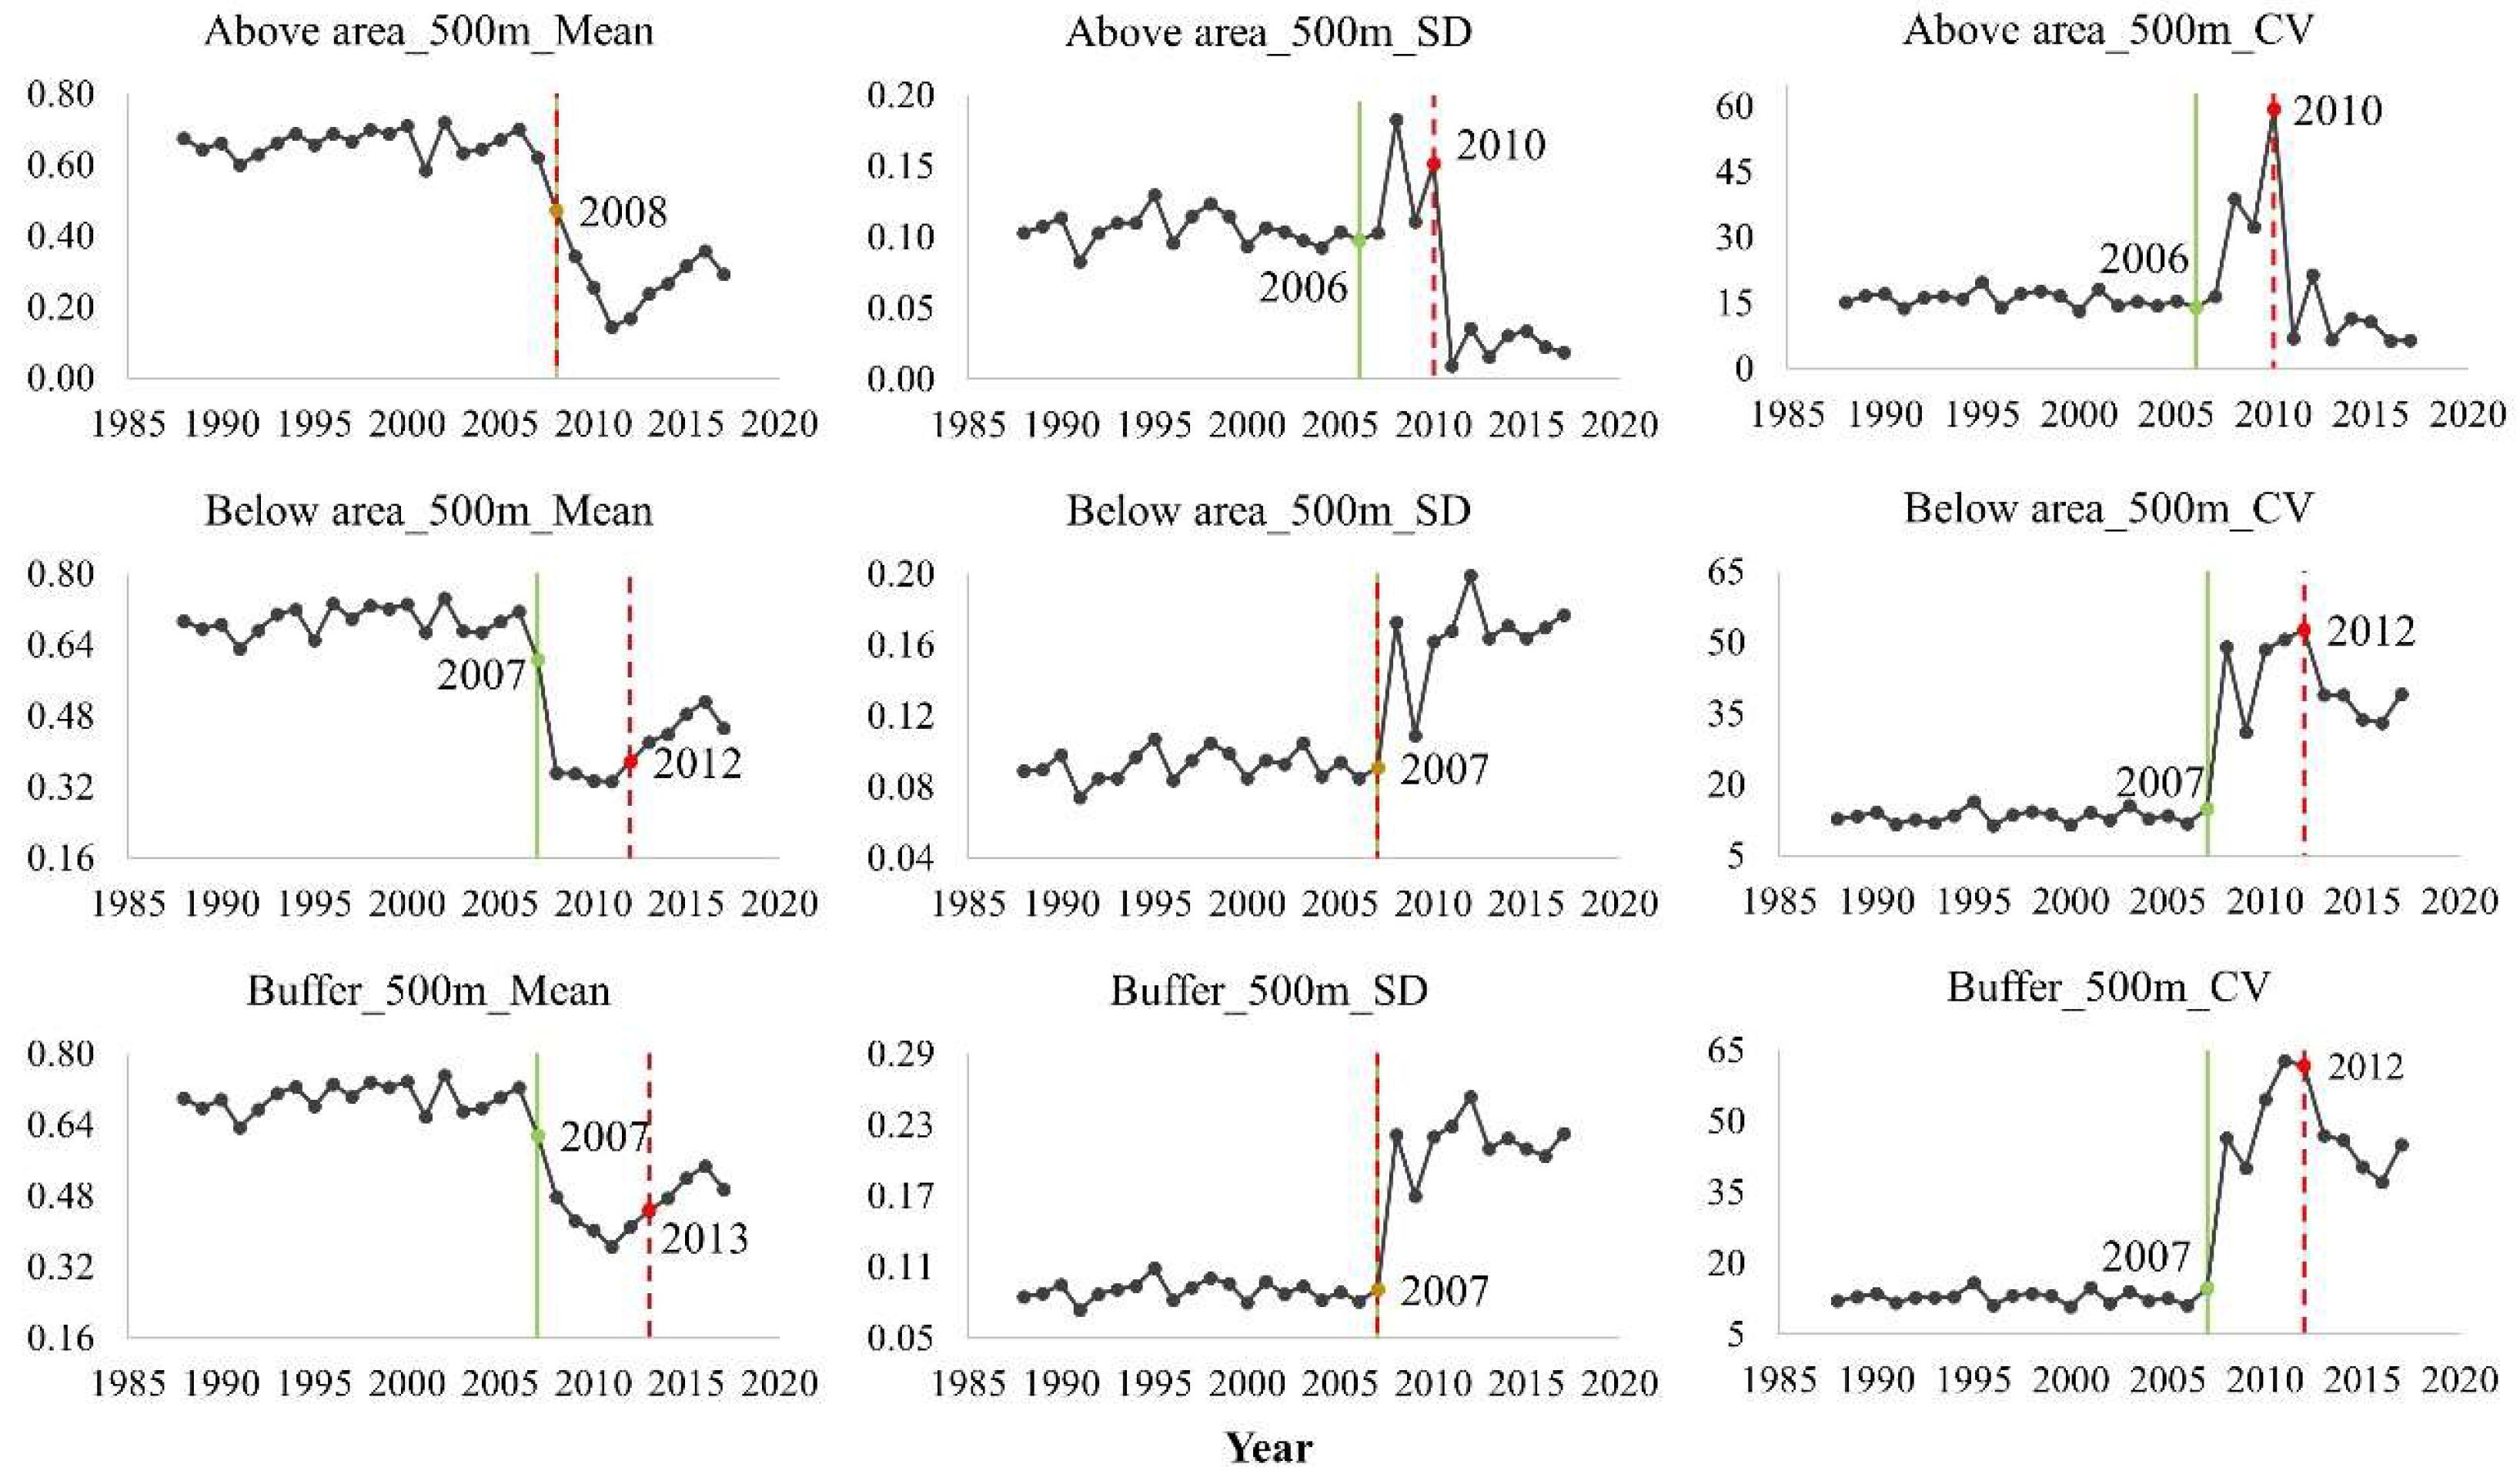
3.1. Timing Determination

Figure 3 gives an example of the above/below dam area separation for the Nam Lik 1-2 hydropower dam in Lao People’s Democratic Republic. This dam (18.793782°N, 102.116714°E) lies on the Nam Lik River, northwest of Vientiane city. Project construction started on 15 August 2007, and was finished in April 2011. The installed power station has a capacity of 100 MW with an annual gross power generation of 435 Gigawatt hours (Gwh) [21]. According to this figure, we were able to conclude that, after a hydropower project was finished, the above dam area mainly comprised part of the water storage reservoir and vegetation, while the area below a hydropower dam was a mosaic of the watercourse, construction body, and some riverine vegetation. Similar boundary files were created for the other 66 hydropower dams. According to Figure 3, the shape of the above/below dam area was irregular and does not have a smooth boundary. This was because the authors used the elevation and NDVI-based subareas to separate the buffer. These subareas were decided using the assigned elevation/NDVI percentage.
Figure 4 illustrates the 30-year NDVI mean/SD/CV curves of the Nam Lik 1-2 hydropower dam at the above dam area, below dam area, and buffer using the 500-m radius. Similar long-term trajectories were also generated using 200-m, 300-m, 400-m, 600-m, and 700-m radii. Usually, the break dates’ detection method returned two breakpoint estimations. Occasionally, the results overlapped together, as shown in the above area_500m_Mean, below area_500m_SD, and Buffer_500m_CV charts because of the failure of some combinations to generate the level shifts caused by the construction. According to Figure 4, two-thirds of the scenarios successfully captured the exact construction start year of the Nam Lik 1-2 project, while two out of nine gave the correct completion year. These ratios varied among different hydropower dam cases. In addition, we noticed that the year lag between an approach determination and the relevant official record was frequently between 0 and 2.

3.2. Correlation Analyses and Accuracy Assessment for Timing Determination

Table 3 and Table 4 gives the Pearson correlation test results between the approach determined timings of construction and completion and relevant records for all scenarios. All p-values were smaller than 0.01. For the above/below dam areas and buffer, we highlighted the highest correlation value in red. For determining the construction start year, the below area_400m_mean scenario shows the highest correlation value, which is as high as 0.96. For determining the completion year, the highest one equals 0.90, which occurs in the above area_500m_SD scenario.
From Table 3 and Table 4, we also noticed that the buffer radii at which the highest correlation value occurred were no larger than 500 m. This was because the dimension of constructional work, which contributed most to the level shifts in NDVI indicators’ trajectories, was approximately 500 m in length. We suggest that researchers who are interested in applying our approach to the other water basins initially start with this number in preliminary experimental trials.
Besides the conventional Pearson correlation tests, we also performed accuracy assessments for timing determinations using the 500-m radius. We calculated year lags between the remote sensing approach derived construction and completion timings and corresponding records. If the value equals 0, then it is a 100% accurate determination. We counted the outcome numbers of 0-year, 1-year, and 2-year lags and divided these numbers by the total number of hydropower dams used for timing determination. Then we got the percentage of different year lags in different scenarios, as displayed in Figure 5.

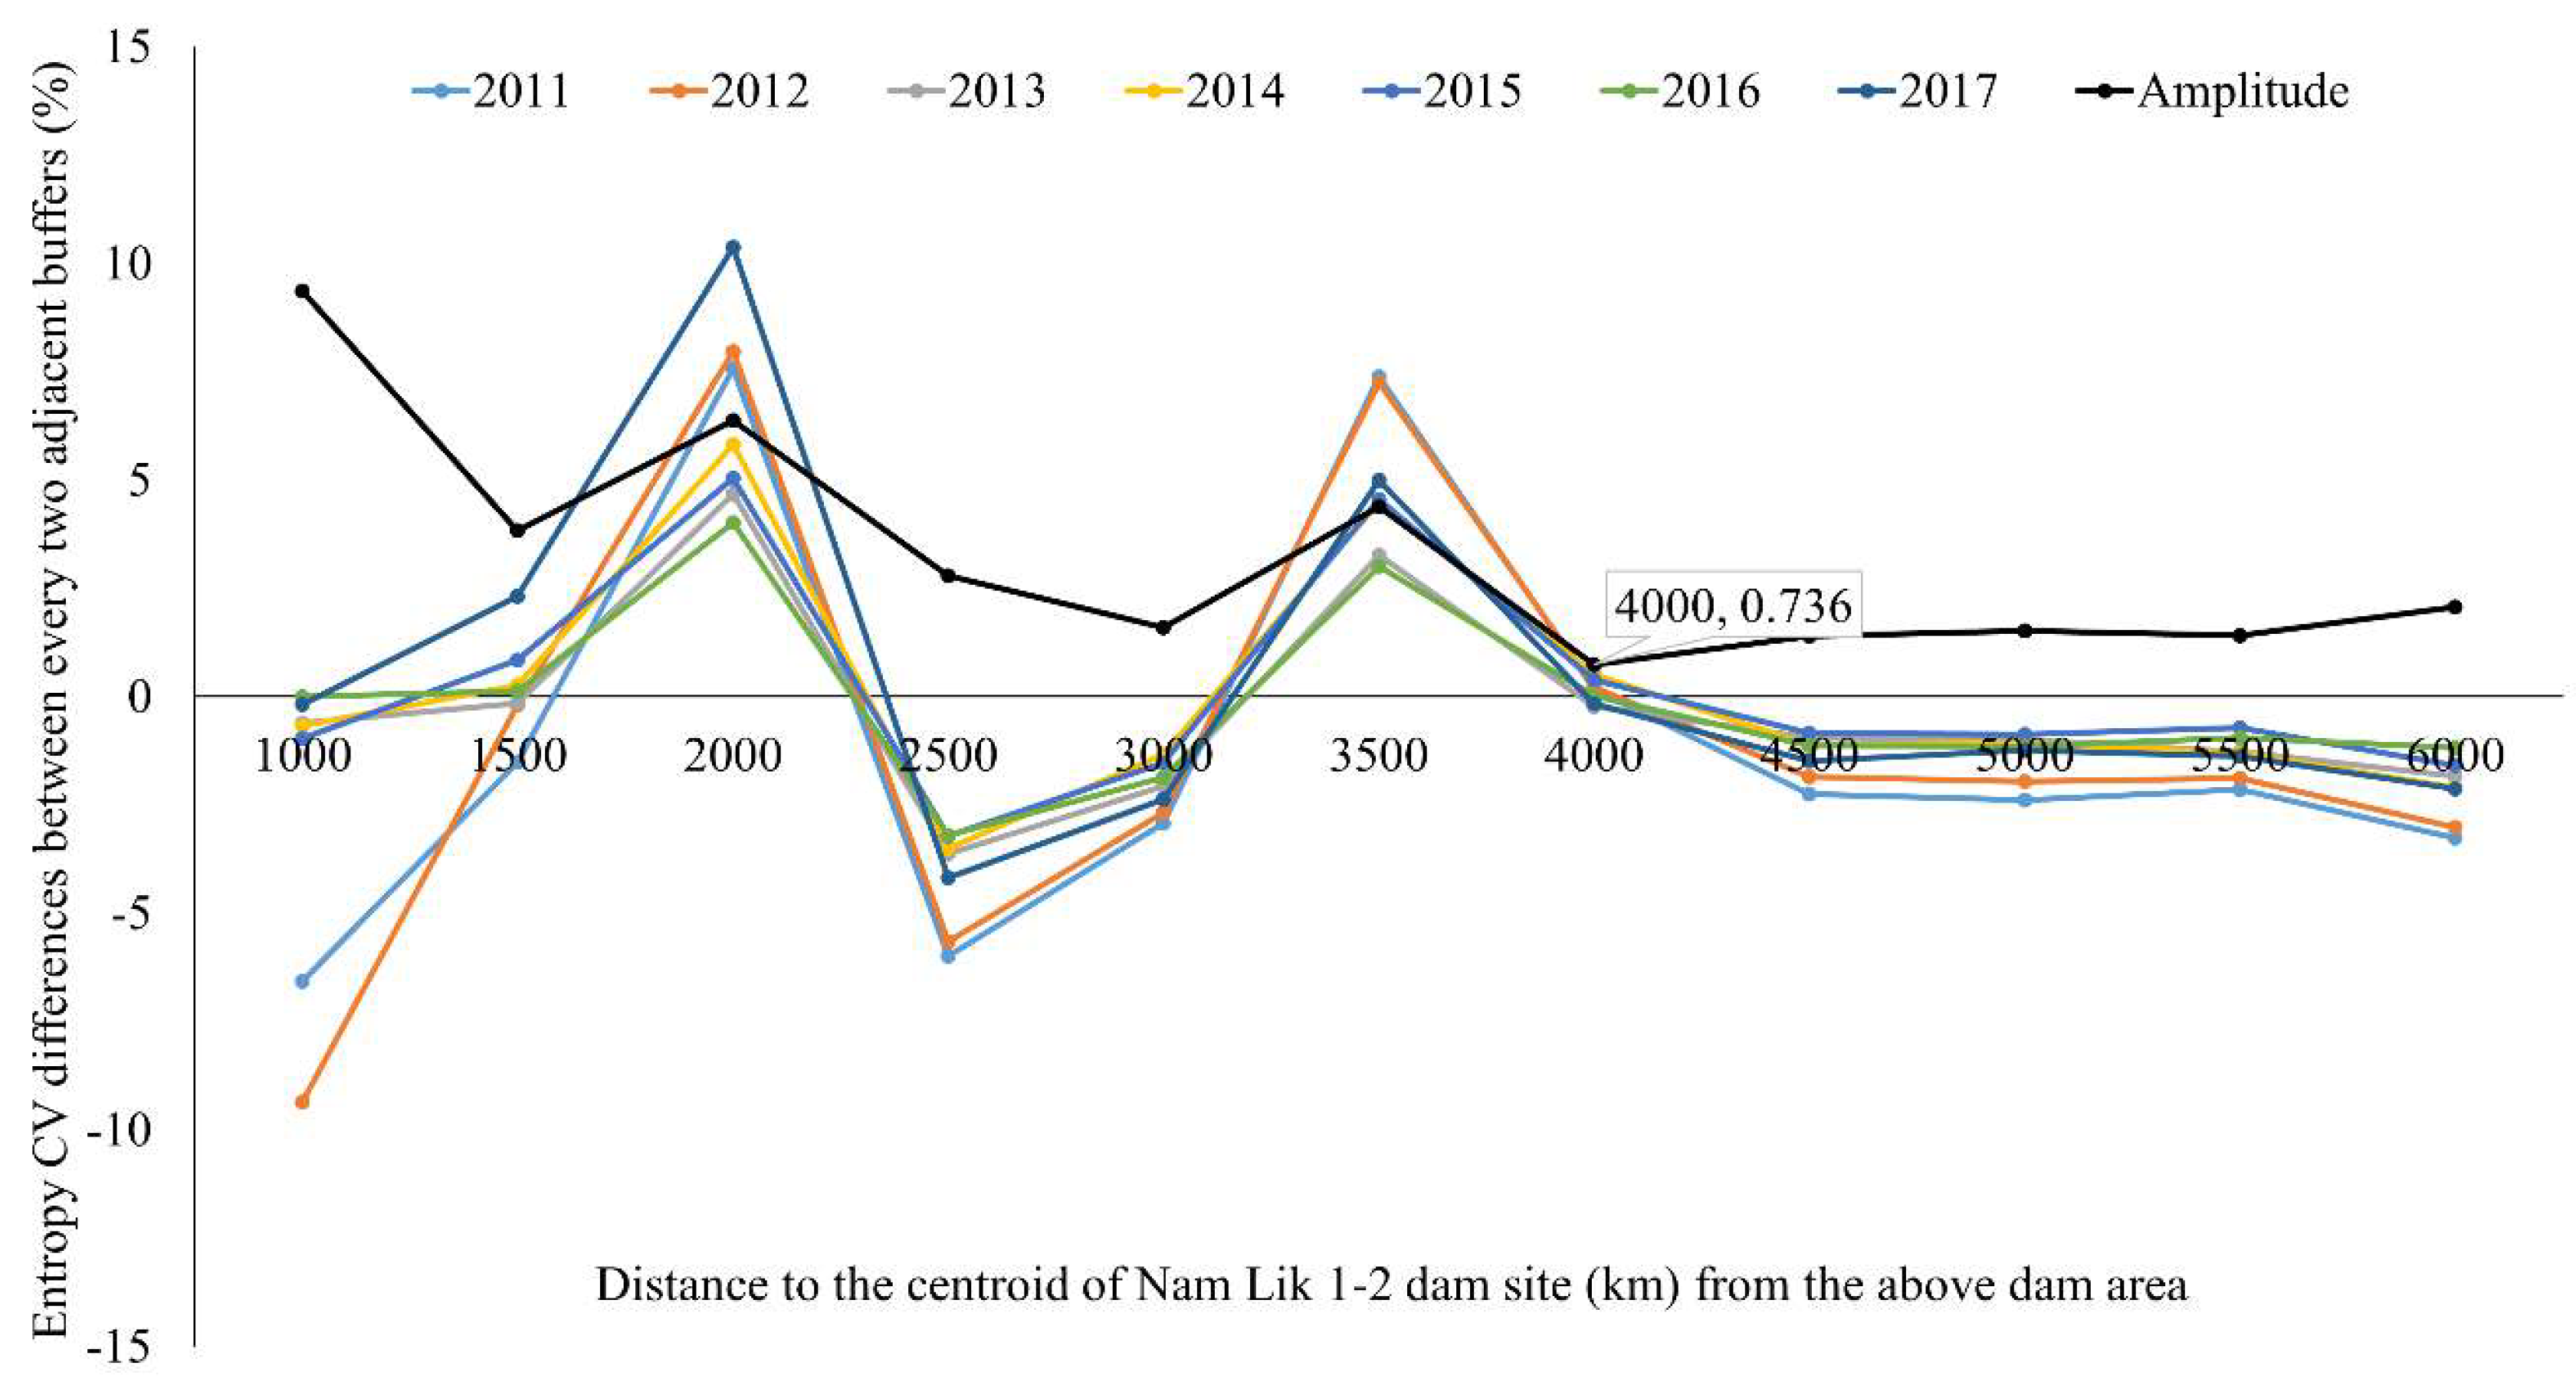
3.3. Hydropower Dam’s Impact Extent Above and Below the Dam Areas

Figure 6 exhibits the distance-based entropy CV differences above the dam semicircles of the Nam Lik 1-2 hydropower dam after its operation in 2011 and the temporal amplitude of a CV difference from 2011 to 2017 (black line). The X-axis label refers to the radial difference category. For example, if x = 1500, the paring y value means the spatial entropy CV differences between buffers with a radius of 1500 m and 1000 m. There is an evident declining trend in Figure 6 as the distance increases. We also discovered similar patterns in spatial entropy CV differences for the other 64 hydropower dams. These supported our hypothesis that the spatial influence of a hydropower dam on land use and land cover change gradually diminished as it came further away from the water infrastructure.
To find the maximum spatial extent of a hydropower dam’s impact on adjacent land use and land cover, we applied two criteria including 1) identifying the change points where amplitude of the CV difference went down first and then rose up, and 2) the amplitude value was no larger than 1%, which had been commonly accepted for statistical significance determination [57]. For the Nam Lik 1-2 hydropower dam, the change point occurred at (4000, 0.736), which indicated a maximum influencing distance of 4000 m. Within this 4000-m semicircle, the amplitude line continuously reduced, which implied the CV difference became less clear further away from the Nam Lik 1-2 dam after 2011. Assume there is a piece of grassland, 3600 m away from the dam, which was converted into agriculture land given a greater water supply in 2014. Such a change would increase both spatial and temporal CV differences. If there were no land use or land cover changes outside the 3600-m boundary after 2014, CV differences would become much larger first and then gradually reduce to about 0.
According to Table 5, Table 6, Table 7, and Table 8, we can conclude that (1) the maximum spatial influencing the distance of a Mekong hydropower dam on nearby land use and land cover is no larger than 5.5 km, (2) the common impact extent at the above dam area is 4.0 km while the one below the dam is 2.5 km, and (3) a Mekong hydropower dam usually has a larger influencing distance at the above dam area than below the dam area. Additionally, 45% of the checked dams showed this rule. To the best of the authors’ knowledge, few studies have been performed to identify the spatial impact extent of a Mekong hydropower dam. One relevant study performed by Zhao et al. claimed they found 5.0 km and 3.0 km as land use and land cover impact distances above and below the dam areas for the Manwan hydropower dam, which is located in the Upper Mekong River Basin [53]. This work can help verify our estimations.

3.4. Dam Capacity and Dam Influencing Distance

Conventionally, it is believed that a hydropower dam with a larger capacity shall have a more far-reaching spatial impact on neighboring land use and land cover, but this is not always true, according to our estimations. Sometimes a hydropower dam of a larger installed capacity has less influence on surrounding lands. In this study, there were cases that a hydropower dam of a larger installed capacity was found to have a shorter influencing radius than the one of a smaller capacity in a certain region. For instance, the capacity of the Nam Theun 2 and the Sesan 4 hydropower dam is 1075 MW and 360 MW [21], while the approach estimated dam influencing distance above the dam area is 3.0 km and 4.0 km, respectively. To examine any potential relationship between installed dam capacity and the dam’s spatial influencing distance on the adjacent land use and land cover change, we tested the Pearson correlation between these two characteristics of all 65 Mekong hydropower dams. The correlation value was 0.31 with a p-value equal to 0.0095 (≤ 0.01) for the above dam area, and 0.12 for the below dam area, which implied that the spatial influencing distance of a hydropower dam on land use and land cover could be partially related to its capacity. However, this was not the only factor that determined its adjacency impact extent. Future studies can be performed to reveal what contributes to a hydropower dam’s influencing distance.

4. Discussion

4.1. Possible Factors Causing Differentiated Impacts at Different Stages

Before the construction started, there was little difference between land use and land cover above/below the dam areas such as a similar open river surface size and vegetation robustness. During the construction phase, the mainstream was closed and diverted, and a cofferdam was built. Both areas had experienced a dramatic land use and land cover change, which could result in apparent variations in the time-serial NDVI curves. Theoretically, land pattern alterations during the construction process could be reflected through the first level shift in trajectories of NDVI mean, SD, and the CV indicator. These land cover changes usually occurred at the construction site. After the hydroelectric infrastructure was completed, water accumulated in the water storage reservoir above the dam, the open water surface expanded, and vegetation coverage consequently reduced within a certain distance. These changes would presumably lead to another level shift in the trajectories. Overall, there was more water in the above dam area. Therefore, corresponding spatial NDVI mean should significantly decrease. NDVI SD/CV values above/below dam areas and buffer would first increase due to construction activity and then decrease as the water-land-vegetation mosaic becomes more stable since the completion year. In addition, such changes would take place over a much larger space because the regional hydrology had been altered and this influenced the land use and ecology ultimately. Local residents could obtain more water for irrigation agriculture and this boosted more converted cropland and increased the regional population density. Given the fact that the water storage reservoir is located above the dam area, this region was believed and proved to receive more impact than below the dam area.

4.2. Optimal Area, Indicator, and Buffer Radius Size Combination for Timing Determination

In Figure 4, several subplots of the Nam Lik 1-2 hydropower dam only returned one break date detection result instead of two, which implied that, for some combination of indicator, area, and radius size, they were not able to reflect the expected level shifts in the time-serial trajectories that occurred at different construction stages. Using the “Above area_500m_Mean” subplot as an example, it only returned the year 2008 because there was only one apparent and detectable level shift in its trajectory. The same situations happened in the subplots of “Below area_500m_SD” and “Buffer_500m_SD.” They indicated that not all combinations could generate satisfying outcomes.
In Table 3, a combination of “Below area_400m_Mean” returned the highest correlation value of 0.96 because this area had experienced a more dramatic land use and land cover change at the early stage of civil work. Specifically, a barrage or a diversion dam was built to alter the natural waterway, and excavation of spillways took place to discharge surplus water, which resulted in less water in the original river channel. According to the area separation criteria in Section 2.2.1, the construction site was spatially assigned below the dam area, which leads to an increased land use and land cover complexity by enlarging concrete or bare land occupation. All these reduced the open river surface and vegetation coverage below the dam area and, thus, lessened its spatial NDVI mean, and the decreasing magnitude was more significant than that above the dam area and buffer.
For the completion year determination, it was another story. The “Above area_500m_SD” exhibited a higher sensitivity (see Table 4). We believed this was a major consequence of the water impoundment in the water storage reservoir of this area. As shown in Figure 3, the water surface above the dam area dramatically expanded at the end of the construction stage since a reservoir began to emerge. Meanwhile, land use and the land cover pattern below the dam area gradually became similar to what it used to be before the project was initiated. Therefore, the spatial SD value of the area above the dam increased first and then sharply dropped down. Such a sudden decrease did not occur in the SD curve below the dam area and was averaged to be ignored over the buffer. The spatial SD value below the dam area slightly increased when construction activity began, but it was hard to tell whether it would increase or decrease at the end-stage. Overall, spatial SD above the dam area had experienced the most significant changes over the entire construction period.

4.3. Approach Improvement

From Figure 5, we can tell that (1) the accuracy of determining the construction start year is generally higher than determining the completion year, (2) calculations performed in scenarios below the dam area give more precise results than those above the dam area and buffer scenarios, and (3) nearly 80% of construction start year determinations have no more than a two-year deviation compared to official records while this ratio is much smaller for determining the completion year.
First, the higher accuracy of determining the construction start year is in accordance with the higher correlation value in Table 3. We believed this was because land use and land cover change occurred immediately when a project started and such a change continued along with the civil work, while the impacts from a hydropower dam on nearby land use and land cover did not take effect as soon as a project was finished. Actually, it usually took several years for an accumulated adjacency impact to become recognizable after the close project date. The year lag between the determined completion year and the official record was, therefore, larger than the construction start year, which resulted in lower accuracy of the completion year determination. Second, as discussed above, the dam area below had gone through a more dramatic land use and land cover change during the construction period. Such a phenomenon provided more clues for break date detection, which contributed to higher accuracies of determining the construction start year. Lastly, for part of the one-year deviations, it was usually because the civil work started late in the second half of the construction year, which leads to insignificant within-year land use and land cover change close to the construction site. Since it had passed the peak season of vegetation, the annual maximum NDVI value would not change significantly. In this case, the first level shift in long-term NDVI based on trajectories was postponed by one year.
The authors believed that many of the one-year deviations could be eliminated by taking advantage of new remote sensing datasets with a finer temporal resolution, such as the Landsat 32-day NDVI composite product, which provides more frequent spatial observations at a 30-m resolution. Using relatively-high temporal resolution datasets would help avoid such a deviation, especially for those started or finished in the second half of the year. For those two-year deviations, the previously mentioned measure would help to primarily reduce a part of them by converting a two-year deviation to a one-year deviation. A further step can be carried out by using enhanced vegetation index (EVI) [58] or a wide dynamic range vegetation index (WDRVI) [59,60] that alleviate the NDVI saturation problem in tropical regions covered by a dense vegetation canopy.

4.4. Applications in Change Detection, Ecology, and Hydrology

The current results had already filled the blanks in the WLE Greater Mekong Dam database, such as construction and completion timing as well as dams’ adjacency impact extent above and below the dam areas. The authors would like to continue applying it to fill similar blanks in any of the sizeable global dam databases such as GOOD, GRanD, and the Global power plant database, as illustrated in the introduction. This novel remote sensing method established on data-intensive computations is also believed to be further applicable in (1) the precise detection of land use and land cover change caused by sudden events with prolonged impacts such as dam constructions, continuous flooding/droughts, and urban (re)developments, (2) the extraction of characteristics that cannot be easily measured and acquired such as for influences of artificial infrastructures and extreme climate events in nature, and (3) the evaluation of how man-made buildings have altered certain ecosystem services. It allows the user to know (1) the exact time when the sudden events occur and disappear, and (2) the extent of influence of the events. Moreover, it generates specific statistical information for the outcomes that can be adopted by researchers and practitioners who run simulation and evaluation models for hydrology and ecology studies [61,62,63]. It provides more accurate and innovative attributes to help reduce the model workload and to increase the reliability of the model outputs. For example, our work might help to figure out the hot spot regions where the most changes occurred.

5. Conclusions

In this study, we developed a new remote sensing approach to determine hydropower dam construction and completion timings and to assess its influencing distance on nearby land use and land cover using elevation data, an annual Landsat composite, and long-term Landsat imagery. This approach has been successfully applied to the large MRB using 3618 scenarios with high correlation outcomes (e.g., 0.96 and 0.90) for timing determination, which confirms the feasibility and capability of this approach to enhance the existing dam database by filling the blanks in records. Adjacency impact distances of Mekong hydropower dams above the dam area and below the dam area were generated and provided for the first time. We proved that entropy-based statistics were valuable for dam impact detection, and a large hydropower project with the installed capacity value might not have a more prolonged impact on surrounding land use and land cover change than the one with a lower installed capacity. Moreover, the above dam area usually experiences more land use and land cover changes than below the dam area.
Information on hydropower dam construction and completion timings as well as the spatial adjacency impact distance is essential, since it can benefit other research work, especially in the environment, ecology, biodiversity, and hydrology fields by using more accurate and reliable hydropower dam statistics. Furthermore, this remote sensing method provides the possibility to allow sudden events detection and to characterize new attributes of these events. This approach can be extended to other vital watersheds that have experienced similar issues with intensified hydropower dam constructions such as Congo and Amazon basins [2,19] for better water resource management. As the first study to characterize hydropower dams at the river basin level, it is also believed to be of great value to decision-makers and to a much wider audience engaged in a more strategic hydropower dam development that requires sufficient statistical supports.

Author Contributions

Conceptualization, J.Q. and Z.L. Methodology, Z.L. and J.Q. Software, Z.L. Validation, Z.L. Formal analysis, Z.L. Investigation, Z.L. Resources, Z.L. Data curation, Z.L. Writing—original draft preparation, Z.L. Writing—review and editing, J.Q. Visualization, Z.L. Supervision, J.Q. Project administration, J.Q. Funding acquisition, J.Q.

Funding

The Asian Pacific Network grant (ARCP2013-FP25-Wu), NASA’s Land Cover and Land Use Program grant (NNX15AD51G), NASA’s IDS grant (80NSSC17K0259), and USDA (MICL02264) through the AgBioResearch at Michigan State University funded this research.

Conflicts of Interest

The authors declare no conflict of interest.

References

  1. Lehner, B.; Reidy Liermann, C.; Revenga, C.; Vorosmarty, C.; Fekete, B.; Crouzet, P.; Doll, P.; Endejan, M.; Frenken, K.; Magome, J.; et al. Global Reservoir and Dam Database, Version 1 (GRanDv1): Dams, Revision 01; NASA Socioeconomic Data and Applications Center (SEDAC): Palisades, NY, USA, 2011. [Google Scholar]
  2. Zarfl, C.; Lumsdon, A.E.; Berlekamp, J.; Tydecks, L.; Tockner, K. A global boom in hydropower dam construction. Aquat. Sci. 2014, 77, 161–170. [Google Scholar] [CrossRef]
  3. Rahaman, M.M.; Varis, O. Integrated water management of the Brahmaputra basin: Perspectives and hope for regional development. Nat. Resour. Forum 2009, 33, 60–75. [Google Scholar] [CrossRef]
  4. Wang, L.; Xu, L.; Wang, X.; You, W.J.; Tan, W. Knowledge portal construction and resources integration for a large scale hydropower dam. Syst. Res. Behav. Sci. 2009, 26, 357–366. [Google Scholar] [CrossRef]
  5. Mulligan, M.; Saenz-Cruz, L.; van Soesbergen, A.; Smith, V.T.; Zurita, L. Global Dams Database and Geowiki: Version 1. 2009. Available online: http://globaldamwatch.org/good2/ (accessed on 1 October 2019).
  6. Byers, L.; Friedrich, J.; Hennig, R.; Kressig, A.; Li, X.; Mccormick, C.; Valeri, L.M. Global Database of Power Plants; World Resources Institute: Washington, DC, USA, 2019. [Google Scholar]
  7. Lehner, B.; Fekete, B.; Reidy, C.; Vörösmarty, C.J. Global Reservoir and Dam Database (GRanD); NASA: Palisades, NY, USA, 2010. [Google Scholar]
  8. Toth, C.; Jóźków, G. Remote sensing platforms and sensors: A survey. ISPRS J. Photogramm. Remote Sens. 2016, 115, 22–36. [Google Scholar] [CrossRef]
  9. Arias, M.E.; Cochrane, T.A.; Piman, T.; Kummu, M.; Caruso, B.S.; Killeen, T.J. Quantifying changes in flooding and habitats in the Tonle Sap Lake (Cambodia) caused by water infrastructure development and climate change in the Mekong Basin. J. Environ. Manag. 2012, 112, 53–66. [Google Scholar] [CrossRef] [PubMed]
  10. Kuenzer, C.; van Beijma, S.; Gessner, U.; Dech, S. Land surface dynamics and environmental challenges of the Niger Delta, Africa: Remote sensing-based analyses spanning three decades (1986–2013). Appl. Geogr. 2014, 53, 354–368. [Google Scholar] [CrossRef]
  11. El Bastawesy, M.; Gabr, S.; Mohamed, I. Assessment of hydrological changes in the Nile River due to the construction of Renaissance Dam in Ethiopia. Egypt. J. Remote Sens. Space Sci. 2015, 18, 65–75. [Google Scholar] [CrossRef] [Green Version]
  12. Velpuri, N.M.; Senay, G.B. Assessing the potential hydrological impact of the Gibe III Dam on Lake Turkana water level using multi-source satellite data. Hydrol. Earth Syst. Sci. 2012, 16, 3561–3578. [Google Scholar] [CrossRef] [Green Version]
  13. Xu, X.; Tan, Y.; Yang, G.; Li, H.; Su, W. Impacts of China’s Three Gorges Dam Project on net primary productivity in the reservoir area. Sci. Total Environ. 2011, 409, 4656–4662. [Google Scholar] [CrossRef]
  14. Ouyang, W.; Hao, F.H.; Zhao, C.; Lin, C. Vegetation response to 30 years hydropower cascade exploitation in upper stream of Yellow River. Commun. Nonlinear Sci. Numer. Simul. 2010, 15, 1928–1941. [Google Scholar] [CrossRef]
  15. Tantianuparp, P.; Shi, X.; Zhang, L.; Balz, T.; Liao, M. Characterization of landslide deformations in three Gorges area using multiple inSAR data stacks. Remote Sens. 2013, 5, 2704–2719. [Google Scholar] [CrossRef] [Green Version]
  16. Zhou, W.; Li, S.; Zhou, Z.; Chang, X. Remote sensing of deformation of a high concrete-faced rockfill dam using InSAR: A study of the Shuibuya dam, China. Remote Sens. 2016, 8, 255. [Google Scholar] [CrossRef] [Green Version]
  17. Aguiar, F.C.; Martins, M.J.; Silva, P.C.; Fernandes, M.R. Riverscapes downstream of hydropower dams: Effects of altered flows and historical land-use change. Landsc. Urban Plan. 2016, 153, 83–98. [Google Scholar] [CrossRef]
  18. Lin, Z.; Qi, J. Hydro-dam—A nature-based solution or an ecological problem: The fate of the Tonlé Sap Lake. Environ. Res. 2017, 158, 24–32. [Google Scholar] [CrossRef]
  19. Winemiller, K.O.; McIntyre, P.B.; Castello, L.; Fluet-Chouinard, E.; Giarrizzo, T.; Nam, S.; Baird, I.G.; Darwall, W.; Lujan, N.K.; Harrison, I.; et al. Balancing hydropower and biodiversity in the Amazon, Congo, and Mekong. Science 2016, 351, 128–129. [Google Scholar] [CrossRef] [Green Version]
  20. Zhao, Q.; Liu, S.; Deng, L.; Dong, S.; Yang, Z.; Yang, J. Landscape change and hydrologic alteration associated with dam construction. Int. J. Appl. Earth Obs. Geoinf. 2012, 16, 17–26. [Google Scholar] [CrossRef]
  21. WLE. Dataset on the Dams of the Irrawaddy, Mekong, Red and Salween River Basins; WLE: Vientiane, Laos, 2017. [Google Scholar]
  22. Grumbine, R.E.; Dore, J.; Xu, J. Mekong hydropower: Drivers of change and governance challenges. Front. Ecol. Environ. 2012, 10, 91–98. [Google Scholar] [CrossRef] [Green Version]
  23. Molle, F.; Foran, T.; Käkönen, M. Contested waterscapes in the mekong region: Hydropower, livelihoods and governance. In Contested Waterscapes Mekong Region: Hydropower, Livelihoods and Governance; Earthscan: London, UK, 2012; pp. 1–426. ISBN 9781849770. [Google Scholar]
  24. Eastham, J.; Mpelasoka, F.; Ticehurst, C.; Dyce, P.; Ali, R.; Kirby, M. Mekong River Basin Water Resources Assessment: Impacts of Climate Change; CiteSeer: University Park, PA, USA, 2008; p. 153. [Google Scholar]
  25. Keskinen, M.; Chinvanno, S.; Kummu, M.; Nuorteva, P.; Snidvongs, A.; Varis, O.; Västilä, K. Climate change and water resources in the lower Mekong River Basin: Putting adaptation into the context. J. Water Clim. Chang. 2010, 1, 103–117. [Google Scholar] [CrossRef]
  26. Lauri, H.; De Moel, H.; Ward, P.J.; Räsänen, T.A.; Keskinen, M.; Kummu, M. Future changes in Mekong River hydrology: Impact of climate change and reservoir operation on discharge. Hydrol. Earth Syst. Sci. 2012, 16, 4603–4619. [Google Scholar] [CrossRef]
  27. Ringler, C. Optimal Water Allocation in the Mekong River Basin; ZEF Discussion Papers on Development Policy: Bonn, Germany, 2001. [Google Scholar]
  28. Food and Agriculture Organization of the United Nations (FAO). Mekong River Basin; FAO: Rome, Italy, 2011. [Google Scholar]
  29. Mekong River Commission (MRC). Annual Report 2017; MRC: Phnom Penh, Cambodia, 2017. [Google Scholar]
  30. Mekong River Commission (MRC). State of the Basin Report 2003; MRC: Phnom Penh, Cambodia, 2003. [Google Scholar]
  31. Mekong River Commission (MRC). State of the Basin Report 2010; MRC: Phnom Penh, Cambodia, 2010. [Google Scholar]
  32. Baran, E.; Myschowoda, C. Dams and fisheries in the Mekong Basin. Aquat. Ecosyst. Health Manag. 2009, 12, 227–234. [Google Scholar] [CrossRef]
  33. Ferguson, J.W.; Healey, M.; Dugan, P.; Barlow, C. Potential effects of dams on migratory fish in the Mekong River: Lessons from salmon in the fraser and Columbia Rivers. Environ. Manag. 2011, 47, 141–159. [Google Scholar] [CrossRef] [PubMed]
  34. Li, J.; Dong, S.; Peng, M.; Yang, Z.; Liu, S.; Li, X.; Zhao, C. Effects of damming on the biological integrity of fish assemblages in the middle Lancang-Mekong River basin. Ecol. Indic. 2013, 34, 94–102. [Google Scholar] [CrossRef]
  35. Lu, X.X.; Li, S.; Kummu, M.; Padawangi, R.; Wang, J.J. Observed changes in the water flow at Chiang Saen in the lower Mekong: Impacts of Chinese dams? Quat. Int. 2014, 336, 145–157. [Google Scholar] [CrossRef]
  36. Räsänen, T.A.; Koponen, J.; Lauri, H.; Kummu, M. Downstream hydrological impacts of hydropower development in the Upper Mekong Basin. Water Resour. Manag. 2012, 26, 3495–3513. [Google Scholar] [CrossRef]
  37. Gorelick, N. Google Earth Engine. In Proceedings of the AGU Fall Meeting, San Francisco, CA, USA, 3–7 December 2012; Volume 15, p. 11997. [Google Scholar]
  38. Gorelick, N.; Hancher, M.; Dixon, M.; Ilyushchenko, S.; Thau, D.; Moore, R. Google Earth Engine: Planetary-scale geospatial analysis for everyone. Remote Sens. Environ. 2017, 202, 18–27. [Google Scholar] [CrossRef]
  39. Takaku, J.; Tadono, T.; Tsutsui, K. Generation of high resolution global DSM from ALOS PRISM. Int. Arch. Photogramm. Remote Sens. Spat. Inf. Sci. 2014, 40, 243–248. [Google Scholar] [CrossRef] [Green Version]
  40. Tadono, T.; Ishida, H.; Oda, F.; Naito, S.; Minakawa, K.; Iwamoto, H. Precise Global DEM Generation by ALOS PRISM. ISPRS Ann. Photogramm. Remote Sens. Spat. Inf. Sci. 2014, II–4, 71–76. [Google Scholar] [CrossRef] [Green Version]
  41. Brown, C.E. Coefficient of Variation. In Applied Multivariate Statistics in Geohydrology and Related Sciences; Springer: Berlin/Heidelberg, Germany, 1998; pp. 155–157. [Google Scholar]
  42. Bai, J. Estimation of a change point in multiple regression models. Rev. Econ. Stat. 1997, 79, 551–563. [Google Scholar] [CrossRef]
  43. Bai, J. Estimating multiple breaks one at a time. Econ. Theory 1997, 13, 315. [Google Scholar] [CrossRef] [Green Version]
  44. Bai, J. Least squares estimation of a shift in linear processes. J. Time Ser. Anal. 1994, 15, 453–472. [Google Scholar] [CrossRef] [Green Version]
  45. Bai, J.; Perron, P. Estimating and testing linear models with multiple structural changes. Econometrica 1998, 66, 47. [Google Scholar] [CrossRef]
  46. Boamah, N.A.; Loudon, G.; Watts, E.J. Structural breaks in the relative importance of country and industry factors in African stock returns. Q. Rev. Econ. Financ. 2017, 63, 79–88. [Google Scholar] [CrossRef]
  47. Hansen, B.E. The New Econometrics of Structural Change: Dating Breaks in U.S. Labor Productivity. J. Econ. Perspect. 2001, 15, 117–128. [Google Scholar] [CrossRef] [Green Version]
  48. Jouini, J.; Boutahar, M. Structural breaks in the U.S. inflation process: A further investigation. Appl. Econ. Lett. 2003, 10, 985–988. [Google Scholar] [CrossRef]
  49. Perron, P.; Zhu, X. Structural breaks with deterministic and stochastic trends. J. Econom. 2005, 129, 65–119. [Google Scholar] [CrossRef]
  50. Rudebusch, G.D.; Wu, T. Accounting for a shift in term structure behavior with no-arbitrage and macro-finance models. J. Money Credit Bank. 2007, 39, 395–422. [Google Scholar] [CrossRef] [Green Version]
  51. Wallack, J.S. Structural Breaks in Indian Macroeconomic Data. Econ. Polit. Wkly. 2003, 46, 4312–4315. [Google Scholar]
  52. Kleiber, C.; Hornik, K.; Leisch, F.; Zeileis, A. Strucchange: An r package for testing for structural change in linear regression models. J. Stat. Softw. 2002, 7, 1–38. [Google Scholar]
  53. Zhao, Q.; Liu, S.; Deng, L.; Dong, S.; Yang, Z.; Liu, Q. Determining the influencing distance of dam construction and reservoir impoundment on land use: A case study of Manwan Dam, Lancang River. Ecol. Eng. 2013, 53, 235–242. [Google Scholar] [CrossRef]
  54. Cloude, S.; Pottier, E. An entropy based classification scheme for land applications of polarimetric SAR. IEEE Trans. Geosci. Remote Sens. 1997, 35, 68–78. [Google Scholar] [CrossRef]
  55. Jat, M.K.; Garg, P.K.; Khare, D. Monitoring and modelling of urban sprawl using remote sensing and GIS techniques. Int. J. Appl. Earth Obs. Geoinf. 2008, 10, 26–43. [Google Scholar] [CrossRef]
  56. Maselli, F.; Conese, C.; Petkov, L. Use of probability entropy for the estimation and graphical representation of the accuracy of maximum likelihood classifications. ISPRS J. Photogramm. Remote Sens. 1994, 49, 13–20. [Google Scholar] [CrossRef]
  57. Manderscheid, L. V Significance Levels. 0.05, 0.01, or? J. Farm. Econ. 1965, 47, 1381–1385. [Google Scholar] [CrossRef]
  58. Huete, A.R.; Liu, H.; van Leeuwen, W.J.D. The use of vegetation indices in forested regions: Issues of linearity and saturation. In Proceedings of the IEEE International Geoscience and Remote Sensing Symposium Proceedings, Remote Sensing—A Scientific Vision for Sustainable Development, Singapore, 3–8 August 1997; Volume 4, pp. 1966–1968. [Google Scholar]
  59. Vina, A.; Henebry, G.M.; Gitelson, A.A. Satellite monitoring of vegetation dynamics: Sensitivity enhancement by the wide dynamic range vegetation index. Geophys. Res. Lett. 2004, 31, 1–4. [Google Scholar] [CrossRef] [Green Version]
  60. Aguilar-Amuchastegui, N.; Henebry, G.M. Characterizing tropical forest spatio-temporal heterogeneity using the wide dynamic range vegetation index (WDRVI). Int. J. Remote Sens. 2008, 29, 7285–7291. [Google Scholar] [CrossRef]
  61. Räsänen, T.A.; Someth, P.; Lauri, H.; Koponen, J.; Sarkkula, J.; Kummu, M. Observed river discharge changes due to hydropower operations in the Upper Mekong Basin. J. Hydrol. 2017, 545, 28–41. [Google Scholar] [CrossRef]
  62. Schilt, C.R. Developing fish passage and protection at hydropower dams. Appl. Anim. Behav. Sci. 2007, 104, 295–325. [Google Scholar] [CrossRef]
  63. Hay, B.J. Sediment and water discharge rates of Turkish Black Sea rivers before and after hydropower dam construction. Environ. Geol. 1994, 23, 276–283. [Google Scholar] [CrossRef]
Figure 1. Spatial distribution of hydropower dams (planned/commissioned/proposed/under construction) in the Mekong River Basin region according to the Water, Land, and Ecosystems Greater Mekong Dam database.
Remotesensing 11 03016 g001
Figure 2. A new remote sensing approach to determine hydropower dams’ construction and completion timings and to assess their influencing distance on land use and land cover at the above and below dam areas. This approach was first applied to the Mekong hydropower dams over the entire Mekong River Basin.
Remotesensing 11 03016 g002
Figure 3. Above dam area, below dam area, and buffer of the Nam Lik 1-2 hydropower dam, in Lao People’s Democratic Republic, with the buffer radius size increasing from 200-m to 700-m at a 100-m interval. The blue, red, and black lines depict the boundary of the above dam area, the below dam area, and the buffer at different distances.
Remotesensing 11 03016 g003
Figure 4. Thirty-year Landsat NDVI mean, standard deviation (SD), and coefficient of variation (CV) trajectories, and the approach determined project construction and completion timings of the Nam Lik 1-2 hydropower dam. The light green vertical line marks approach determined the construction start year, and the red, dotted line highlights the completion year. The above area, below area, and buffer each represents the area where water accumulates, the area where water flows out from the dam, and the circle centered at the dam site.
Remotesensing 11 03016 g004
Figure 5. Percentage of year lags between the remote sensing approach determined construction and completion timings and relevant records at the above/below dam areas and a buffer 500 m away from every hydropower dam. The bars represent consecutive percentage values. The green bar represents the accuracy of the construction’s start timing estimations, while the red one shows the accuracy of completion timing estimations.
Remotesensing 11 03016 g005
Figure 6. Entropy coefficient of variation (CV) differences and temporal amplitude between every two adjacent semicircles (e.g., CV1000-CV500, …, CV6000-CV5500) after the Nam Lik 1-2 hydropower dam functioned in 2011. Calculations were performed for the above dam area. The y-axis shows the entropy CV difference in terms of percentage, and the x-axis represents the distance to the centroid of the Nam Lik 1-2 hydropower dam site.
Remotesensing 11 03016 g006
Table 1. Quantity and status of hydropower dams in the Mekong River Basin (MRB) region. Information was retrieved from the Water, Land, and Ecosystems (WLE) Greater Mekong Dam database.
StatusTotal Number of Hydropower Dams
Commissioned102
Planned78
Proposed15
Under construction41
Table 2. A full list of Mekong hydropower dams with construction and completion timings.
Project NameIDConstruction Start YearCompletion YearProject NameIDConstruction Start YearCompletion Year
A Luoi020072012Nam Ngeip 3A3420112014
Buôn Kốp120032009Nam Ngiep 23520112015
Buon Tua Srah220042009Nam Ngum 23620052011
Dachaoshan319972003Nam Ngum 53720082012
Dak Doa420082011Nam Ou 23820122016
Dak Ne5NR *2009Nam Ou 53920122016
Dak N’Teng620092011Nam Ou 64020122016
Dak Po7NR *2015Nam San 3A4120122015
Dak Psi 3820082012Nam San 3B4220122015
Dak Psi 49NR *2007Nam Song Diversion4319951996
Dak Psi 51020082010Nam Theun 24420052009
Dak Ro Sa1120032007Nan Rong Tian4520142015
Dak Ru1220062008Nanhe 14620062009
Dray Hinh 21320032007Nuozadu4720042014
Gongguoqiao1420092012Pak Mun4819901994
GuaLanZi1520132016Plei Krong4920032009
GuoDuo1620122015Sesan 35020022006
Houay Ho1719931999Sesan 3A5120032007
Houay Lamphan Gnai1820102015Sesan 45220042009
Hua Na1919921995Sesan 4A5320072013
Jinfeng2019971998Sre Pok 35420052009
Jinghong2120032009Sre Pok 45520082010
Jinhe2220012004Theun-Hinboun5619941998
Longdi23NR *2007Theun-Hinboun exp.5720082013
Longqingxia24NR *2006Upper Kontum5820102014
Lower Sesan 22520142017Xe Kaman 15920112016
Miaowei2620092016Xe Kaman 36020062011
Nam Beng2720102016Xekaman-Sanxay6120112017
Nam Khan 22820112015Xeset 26220052009
Nam Khan 32920122016Xiangda6320062007
Nam Leuk3019962000Xiaowan6420022010
Nam Lik 1-23120072011XunCun6519961999
Nam Mang 13220132016Yali6619932000
Nam Mang 33320022004
*: short for no record.
Table 3. Pearson correlation results between the remote sensing approach determined the construction start year and the construction start year records in Table 2.
Radius Length (m)Above AreaBelow AreaBuffer
2000.830.810.82
3000.750.710.69
Mean4000.760.960.67
5000.730.940.72
6000.700.680.69
7000.700.610.67
2000.880.880.77
3000.870.660.94
Standard Deviation (SD)4000.860.840.89
5000.930.890.89
6000.640.830.87
7000.690.760.93
2000.570.890.85
3000.660.870.84
Coefficient of variation (CV)4000.890.820.86
5000.580.850.88
6000.490.720.75
7000.780.730.78
Table 4. Pearson correlation results between the remote sensing approach determined the completion year and the completion year records in Table 2.
Radius Length (m)Above AreaBelow AreaBuffer
2000.660.670.71
3000.710.550.55
Mean4000.710.810.51
5000.690.780.56
6000.660.530.57
7000.630.470.54
2000.800.760.69
3000.830.550.86
Standard Deviation (SD)4000.780.740.84
5000.900.750.85
6000.710.710.81
7000.700.610.85
2000.510.770.76
3000.630.790.78
Coefficient of variation (CV)4000.880.640.79
5000.610.570.81
6000.610.590.77
7000.770.540.73
Table 5. Summarized Mekong hydropower dam influencing distances on nearby land use and land cover at the above dam area.
Influencing Distance at the Above Dam Area (km)Number of Hydropower Dams
2.02
2.510
311
3.56
4.017
4.53
5.010
5.56
Table 6. Summarized Mekong hydropower dam influencing distances on nearby land use and land cover below the dam area.
Influencing Distance Below the Dam Area (km)Number of Hydropower Dams
1.53
2.04
2.513
37
3.511
4.09
4.55
5.010
5.53
Table 7. A Mekong hydropower dam list with assigned ID, installed capacity, and estimated influencing distance on nearby land use and land cover above the dam area.
Project NameIDInstalled Capacity (MW)Influencing Distance Above the Dam Area (km)Project NameIDInstalled Capacity (MW)Influencing Distance Above the Dam Area (km)
A Luoi01704.0Nam Ngeip 3A34443.0
Buôn Kốp12804.0Nam Ngiep 2351805.5
Buon Tua Srah2862.5Nam Ngum 2366155.0
Dachaoshan313505.0Nam Ngum 5371204.0
Dak Doa4143.0Nam Ou 2381204.0
Dak Ne5134.0Nam Ou 5392405.5
Dak N’Teng6152.5Nam Ou 6401805.0
Dak Po7452.5Nam San 3A41693.0
Dak Psi 38103.0Nam San 3B42455.5
Dak Psi 497.53.0Nam Song Diversion4362.5
Dak Psi 510123.5Nam Theun 24410753.0
Dak Ro Sa11163.0Nan Rong Tian4582.5
Dak Ru124.82.0Nanhe 146403.0
Dray Hinh 2139005.0Nuozadu4758505.5
Gongguoqiao144.82.5Pak Mun481363.5
GuaLanZi151605.0Plei Krong491003.0
GuoDuo16152.14.0Sesan 3502605.0
Houay Ho17883.0Sesan 3A51964.0
Houay Lamphan Gnai18NR *4.0Sesan 4523604.0
Hua Na19162.5Sesan 4A53634.0
Jinfeng2017504.5Sre Pok 3542203.5
Jinghong21603.5Sre Pok 4556003.0
Jinhe2210.082.5Theun-Hinboun562204.5
Longdi23162.5Theun-Hinboun exp.572225.0
Longqingxia2416705.0Upper Kontum582505.0
Lower Sesan 2251400NA **Xe Kaman 1592904.0
Miaowei26362.0Xe Kaman 3602505.5
Nam Beng271305.5Xekaman-Sanxay6145NA **
Nam Khan 228603.5Xeset 262762.5
Nam Khan 3291.54.0Xiangda630.84.5
Nam Leuk30604.0Xiaowan6442004.0
Nam Lik 1-2311004.0XunCun65783.5
Nam Mang 132644.0Yali667204.0
Nam Mang 333405.0
*: short for no record. **: short for no applicability.
Table 8. A Mekong hydropower dam list with assigned ID, installed capacity, and estimated influencing distance on nearby land use and land cover below the dam area.
Project NameIDInstalled Capacity (MW)Influencing Distance Below the Dam Area (km)Project NameIDInstalled Capacity (MW)Influencing Distance Below the Dam Area (km)
A Luoi01704.0Nam Ngeip 3A34443.5
Buôn Kốp12803.5Nam Ngiep 2351804.5
Buon Tua Srah2862.5Nam Ngum 2366155.5
Dachaoshan313503.5Nam Ngum 5371204.5
Dak Doa4143.0Nam Ou 2381204.0
Dak Ne5134.0Nam Ou 5392405.0
Dak N’Teng6153.0Nam Ou 6401805.0
Dak Po7452.5Nam San 3A41692.5
Dak Psi 38103.5Nam San 3B42455.0
Dak Psi 497.52.0Nam Song Diversion4361.5
Dak Psi 510122.5Nam Theun 24410754.0
Dak Ro Sa11162.5Nan Rong Tian4582.5
Dak Ru124.82.0Nanhe 146403.0
Dray Hinh 2139005.5Nuozadu4758502.0
Gongguoqiao144.82.5Pak Mun481361.5
GuaLanZi151605.5Plei Krong491003.5
GuoDuo16152.15.0Sesan 3502602.5
Houay Ho17882.5Sesan 3A51963.5
Houay Lamphan Gnai18NR *4.0Sesan 4523603.0
Hua Na19162.0Sesan 4A53633.5
Jinfeng2017505.0Sre Pok 3542204.0
Jinghong21602.5Sre Pok 4556003.5
Jinhe2210.083.0Theun-Hinboun562204.0
Longdi23162.5Theun-Hinboun exp.572225.0
Longqingxia2416705.0Upper Kontum582504.5
Lower Sesan 2251400NA **Xe Kaman 1592904.5
Miaowei26361.5Xe Kaman 3602505.0
Nam Beng271305.0Xekaman-Sanxay6145NA**
Nam Khan 228603.5Xeset 262762.5
Nam Khan 3291.53.5Xiangda630.83.0
Nam Leuk30604.0Xiaowan6442005.0
Nam Lik 1-2311003.5XunCun65782.5
Nam Mang 132644.5Yali667204.0
Nam Mang 333403.0
*: short for no record. **: short for not applicable.

