1. Introduction
There is a wide agreement in the scientific community today that forests play a major role in the global carbon cycle where forest degradation and conversion act as a source of carbon to the atmosphere and forest (re-) growth is a carbon sink [
1]. Knowledge about the status and changes of forest structural parameters is important for the assessment of forest carbon stocks for national forest inventories in the context of reducing emissions from deforestation and forest degradation (REDD) and as a base input for the estimation of the forest above-ground biomass (AGB) which represents a key component in global carbon cycle models. Remote sensing has proven to be the most effective means to monitor the extent and qualitative as well as quantitative parameters of forests across wide areas from regional to global level [
2,
3]. In terms of the global carbon cycle, AGB is the most important forest variable. In general, it can be assessed from three different types of remote sensing data: passive optical, light detection and ranging (LiDAR), and synthetic aperture radar (SAR) data. A comprehensive summary of studies that aim at quantifying forest biomass from satellite sensors was compiled by [
3]. AGB estimates from optical remote sensing data mostly rely on vegetation indices that parameterize the photosynthetic activity of vegetation. They imply a relationship between the foliage and the total AGB of a vegetation stand, which is further used to estimate AGB. Since the major part of AGB in forests is composed of non-photosynthetic (woody) components, such approaches imply high uncertainties. The major challenge in AGB mapping from optical data is the saturation of the signal after canopy closure which especially hampers the estimation of high-level AGB [
4]. However, recent studies confirmed the general ability of optical systems like Landsat to map AGB at biomass levels around 70 Mg/ha [
5].
The saturation problem can be overcome by sensors, which are able to penetrate through the canopy and interact with the forest constituents. For instance, LiDAR and interferometric SAR (InSAR) systems generally provide the necessary technique because they are able to penetrate the canopy of a forest and deliver information about the vertical structure of a forest stand. LiDAR data produce high-accuracy canopy height models (CHM) but the main drawback of LiDAR data to date is the limited coverage of large areas. However, InSAR data are available at regional to global scale from different spaceborne SAR missions and recently have shown their capability to estimate parameters of the three-dimensional structure in forest stands [
6,
7,
8,
9]. The coherence between two independent SAR acquisitions provides the key measure that can be related to parameters of the canopy. If other decorrelations than the volume decorrelation (such as temporal, signal to noise ratio, etc.) are minimized, it can be used to parameterize the vertical structure of a forest stand and thus provides a measure to directly relate to AGB. On a global scale, constellations with minimal temporal decorrelation are to date only available from the C-band mission SRTM [
10] and the X-band mission TanDEM-X [
11]. In general, three different approaches exist to estimate parameters of the vertical structure from InSAR acquisitions without temporal decorrelation: 1. physical modeling, 2. modeling of the canopy surface and subtraction of a terrain height from an available DTM, and 3. empirical modeling of the relationship between vertical structure and the SAR signal.
Physical models are usually based on an inversion of a model that aims at predicting the radar scattering of a natural surface from a complex set of object parameters that are retrieved from ground measurements of, for example, forest structural parameters. In general, the inversion of such models is only applicable to full-polarized InSAR (PolInSAR) data due to the problem of an unbalanced inversion function with more unknowns than knowns when only one single polarization is available [
12]. Another constraint is that the maximum vegetation height that can be retrieved is limited by the penetration depth of the SAR signal which is a function of the wavelength and the structural properties of the forest stand [
13]. This is the main reason why most applications of scattering and vertical structure model inversion rely on low frequency like L- or P-band PolInSAR data [
7,
14]. The effect of wavelength on retrieving forest height from the random volume over ground (RVoG), a two-layer and vertical structure model, and its inversion was recently demonstrated by [
15] who compared X-, C-, and L-band and found that the RMSE of forest height inversion increased with increasing frequency. Nevertheless, single-polarized X-band InSAR data are used in scattering models under simplified assumptions or when ancillary data are available to replace missing scattering information of the ground layer [
16,
17,
18,
19,
20]. Compared to these simplified scattering models, the second approach is dependent on the availability of ancillary data, e.g., a digital terrain model to derive information about the ground height. If this information is available, e.g., from national topographical surveys, the subtraction approach provides a simple but robust means to produce the InSAR height which is widely used as a proxy for the canopy height [
21,
22,
23]. A comparison of the InSAR to the dominant (top) height of the canopy reveals that InSAR height underestimates the actual height of the forest [
24,
25]. Thus, the penetration depth of the SAR signal has to be accounted for when modeling the vertical structure and related AGB, especially when compared to other data sources [
26]. Recent studies revealed the general discrepancies of the retrieved height values between the two modeling approaches and stated the importance of defining the term “height” in relation to the modeled and ground data [
27].
Alternatively, empirical models are frequently used to estimate vertical stand structure parameters from the InSAR information. Here, the magnitude of the X-band coherence of TanDEM-X has proven its capabilities to predict Lorey’s height, stem volume [
21], and AGB [
28]. In the following, the coherence refers to the magnitude of coherence. In addition to coherence, radar backscatter is known to be sensitive to stand structural parameters even if it does not allow for a direct estimation of forest height or biomass [
29]. Ref. [
30] demonstrated the sensitivity of X-band backscatter to vegetation density. On the other hand, ref. [
31] compared different remote sensing sensors (C- and L-band SAR) and concluded that, in general, models based on coherence mostly outperform backscatter in terms of correlation strength with forest structural parameters. Other studies however confirmed the general ability of X-band backscatter to model biophysical variables of forest stands [
32,
33].
All three approaches imply benefits and limitations from the technical point of view. They underline the general ability of satellite-based InSAR data, especially low-frequency data like L- and P-band for the assessment of the vertical structure of forest stands that can be adapted to monitoring forest carbon stocks over large areas. However, the high-frequency TanDEM-X mission is the only spaceborne single-pass interferometer mission to date. Therefore, its potential to estimate forest structure parameters was frequently studied in the past and should be studied in more detail enabling large scale assessment of forest structures with TanDEM-X. Only a few studies investigated the transferability of methods to other environments and the impact of forest stratification on model performance [
34]. The majority of studies was on boreal [
8,
14,
16,
18,
19,
21,
24] and tropical [
15,
22,
25,
28,
33] forests. In addition, the quality and accuracy of a model depend on the definition of the reference forest height that is investigated. Forest height is normally retrieved by aggregation of individual trees in a defined spatial area (e.g., sample plot), which depends on the type of aggregation and thus, forest height is an abstract statistical concept [
35]. Therefore, in the present study, a detailed sensitivity analysis of X-band coherence to different forest structural parameters in temperate forests was carried out based on an empirical modeling approach. The aim was to better understand the factors that have an impact on the estimation of forest structural variables from X-band data, particularly the vertical structure of forests, and to propose sensor and environmental settings for the large scale assessment of forest resources based on X-band satellite data. The sensitivity analysis also included the backscatter coefficient of the X-band data in order to fully evaluate the relations between TanDEM-X bistatic data and forest structural parameters. It was carried out for three test sites in temperature forests in Germany and for TanDEM-X acquisitions during different seasons. This enabled an assessment of the transferability of the results between environments and under different conditions.
2. Materials and Methods
2.1. Field Data
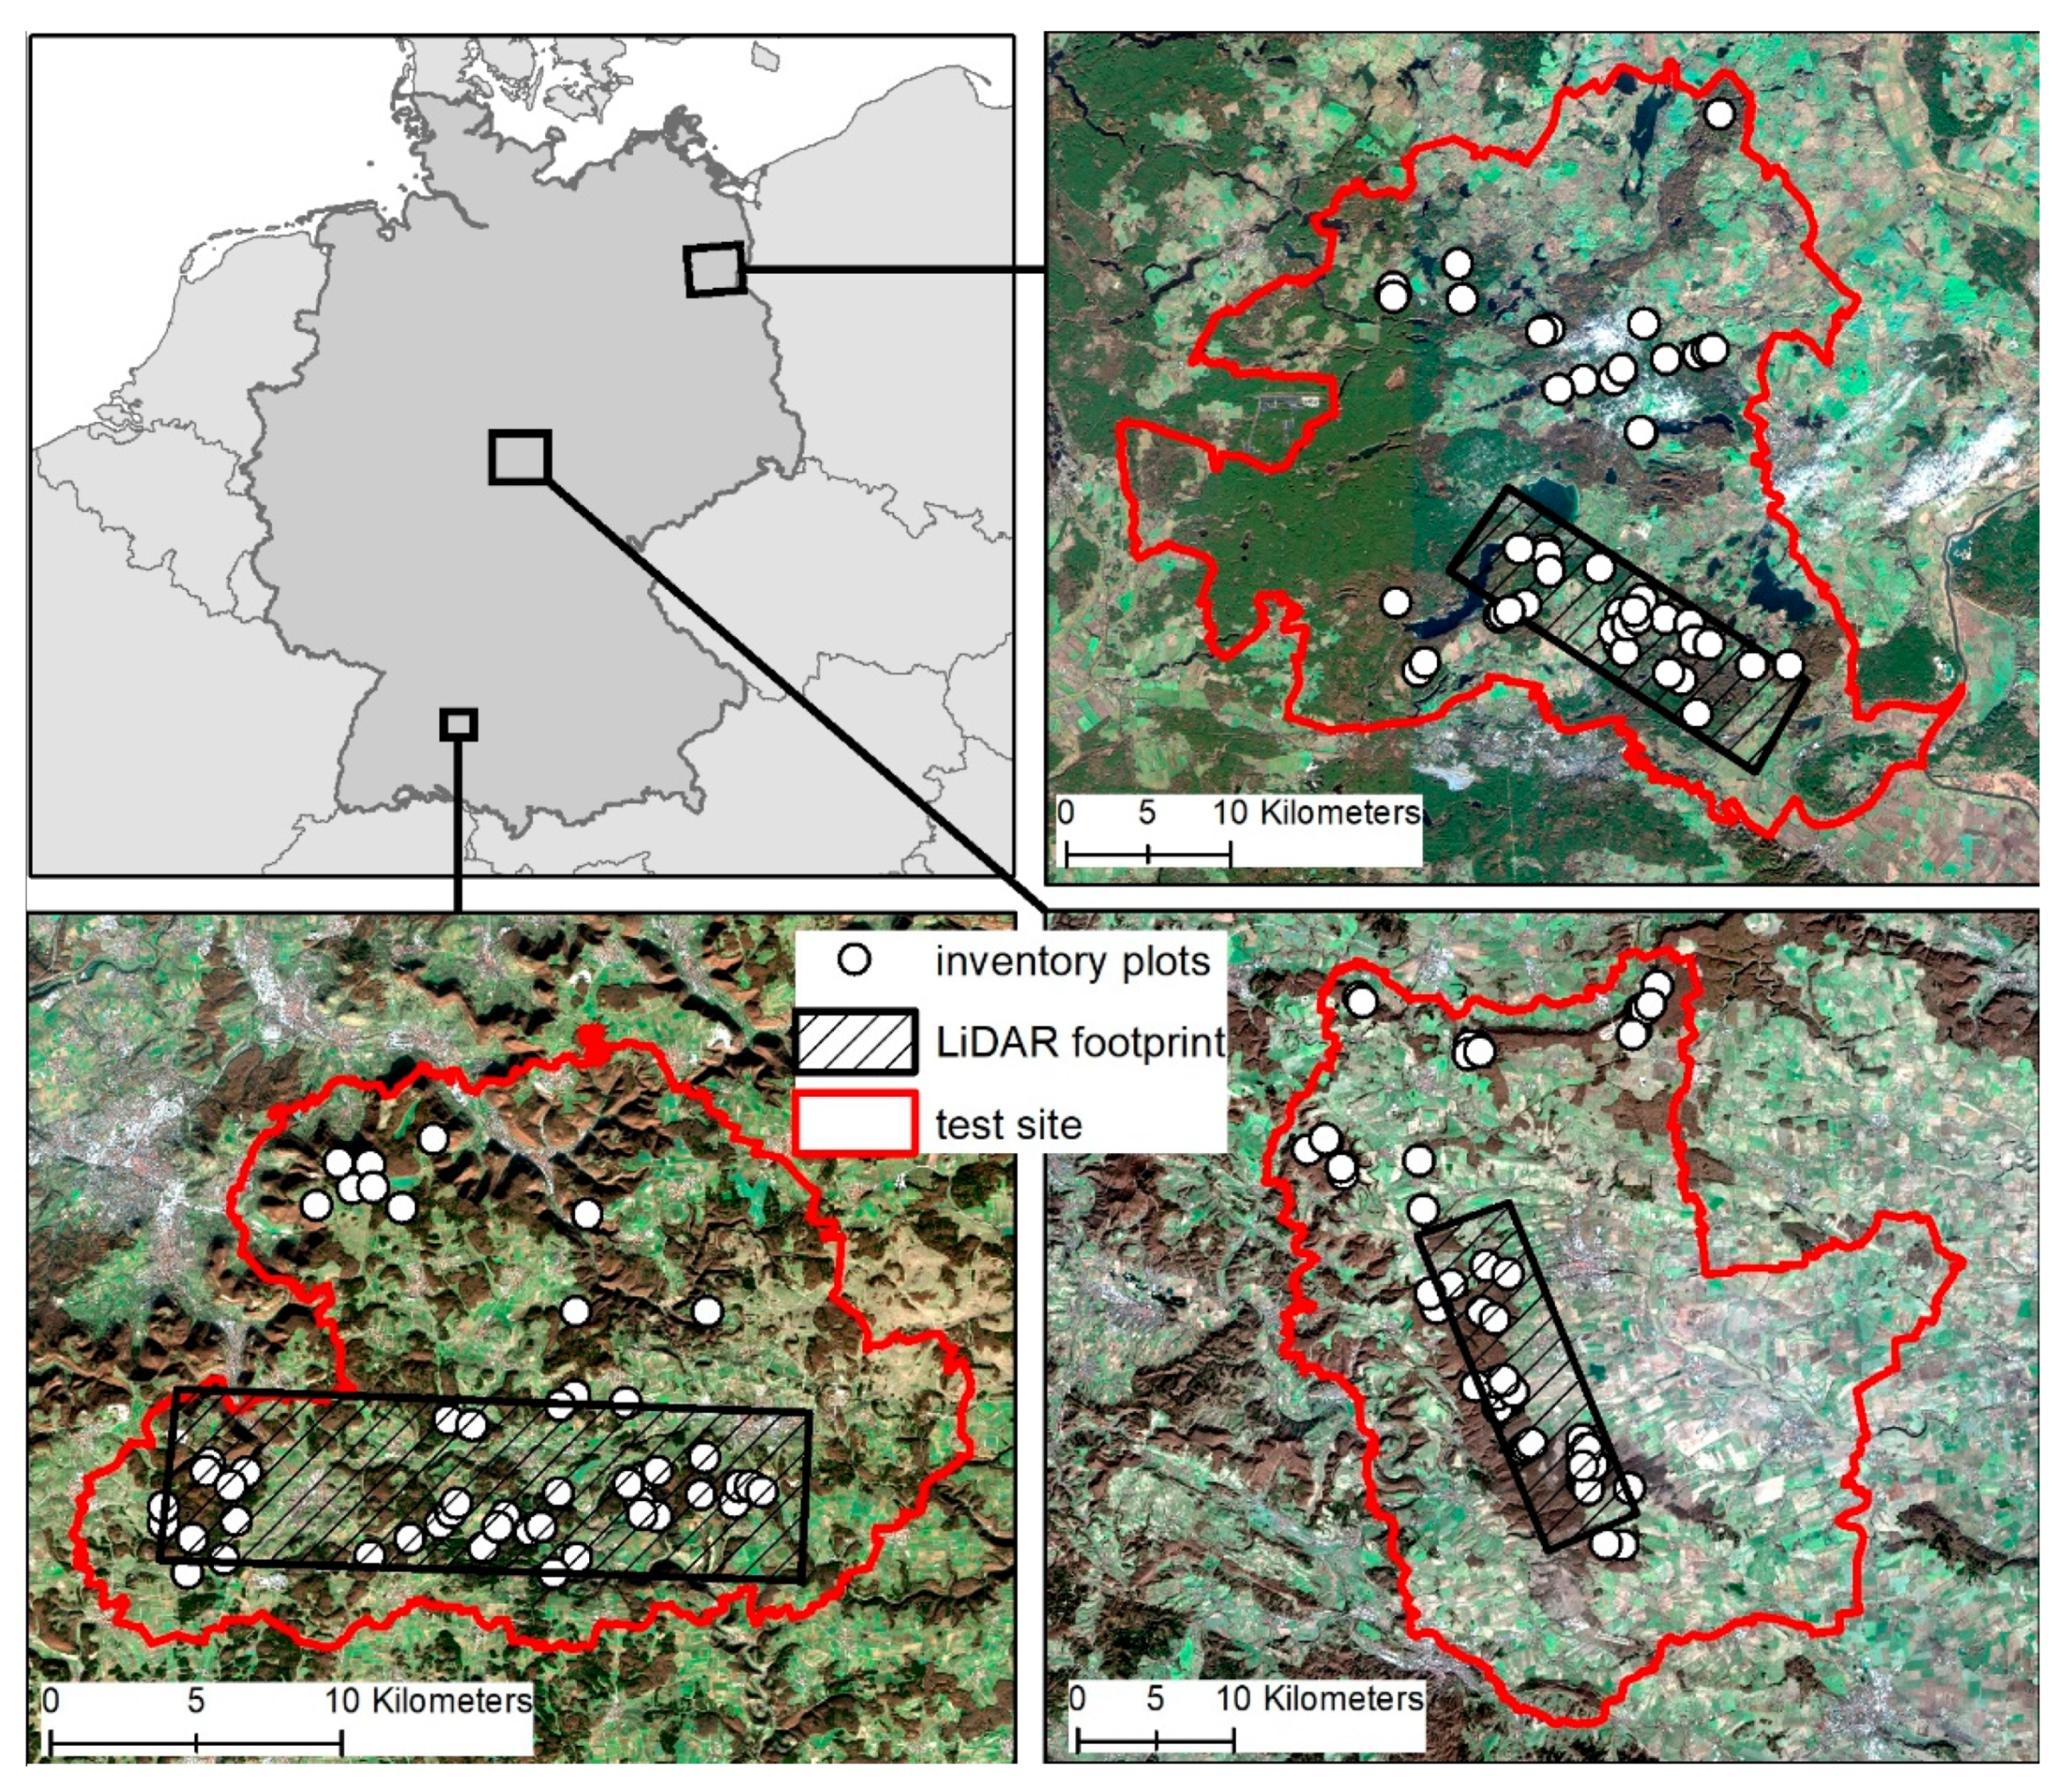
The three study sites in Germany are situated along a gradient from northeast to southwest (
Figure 1). They form part of the German Biodiversity Exploratories, a long-term and large-scale research project that aims at understanding the relationships between biodiversity, ecological processes, and land use and management changes [
36]. The sites differ in landscape heterogeneity and dominant tree type (
Table 1). All sites comprise pure as well as mixed deciduous and coniferous stands. The development stages of the managed stands range from pole wood to immature timber and mature timber where mature timber is dominating in two of three sites.
The Schorfheide-Chorin site covers an area of about 1292 km
2 and is dominated by intensively managed pine monocultures and beech forests. The most common tree species in the area are
Pinus sylvestris (51%) and
Fagus sylvatica (34%). The landscape is characterized by the glacial forming process and has elevations ranging from 2 to 139 m a.s.l. The Hainich site covers around 1306 km
2 and is part of the largest closed forest area of broad-leaved trees in Germany with dominating mixed beech forests. The most common tree species in the area are
Fagus sylvatica (72%) and
Fraxinus excelsior (11%). Elevation ranges from 165 to 532 m a.s.l. The size of the third site, Schwäbische Alb is approximately 422 km
2. It is characterized by submontane to montane plateaus with elevations in the study site from 395 to 878 m a.s.l. Beech forests, mixed forests, and intensely managed spruce monocultures are typical for this area [
36]. The most common tree species are
Fagus sylvatica (43%) and
Picea abies (38%).
Field data were collected between 2014 and 2016 for a total of 124 sample plots of one-hectare size (100 m × 100 m) over the three study sites. The plots were selected using a stratified random sample with forest use intensity and soil depth as the main strata [
36]. Within each plot, plant species and diameter at breast height (
dbh) measured in 1.3 m above ground, were recorded for all trees with a
dbh > 7 cm [
37]. The plots were classified according to their forest type and development stage. Tree height was measured for a representative subsample of trees across frequently occurring tree species within a plot and was estimated for the remaining trees using stand height curves as described in [
37]. From the individual field measurements within each plot, a number of stand parameters were calculated for each plot that directly or indirectly represent the forest height. Forest height in general describes the difference between the canopy height and the ground height within a forest stand. Different concepts for the definition of forest height exist. They are either related to the mean height of all trees within a defined area (mean tree height) or to the height of only a subset of the tallest trees within the stand (dominant tree height or top tree height). Other height parameters describe the distribution of tree height within the stand (e.g., measures of variance) and are used as proxies to evaluate the vertical structure/structural diversity of forest stands. Additionally, in forest management, a number of more comprehensive measures are derived from the height together with the trunk area and/or volume to assess the entire woody component of a tree.
In this study, arithmetic mean height (
hM) and the 95th percentile of tree height (
h95) were calculated from the entire sample of all measured trees within the plot area of one hectare.
hM is a standard measure of mean height, whereas
h95 represents the top height and thus is more related to the forest canopy height of a stand [
38]. In addition, the standard deviation of tree height (
hSD) was used as a measure of the 3D-structure and variability within a stand. Lorey’s height (
hL) in m is the mean tree height weighted by its basal area. It is often used in remote sensing studies since it provides a measure of forest height that is less affected by thinning and mortality of smaller trees [
38]:
where
hi is the height of tree
i,
n the number of available trees, and
BAi is the basal area of tree
i.
BA is a common measure to describe the stand density taking into account the stem diameter [
39]. It is defined as the trunk-cross sectional area in m² per unit area:
where
dbh is the diameter at breast height and
A is the plot area (i.e., one hectare in our study). Wood volume (
VOL) in m³/ha was additionally included in the analysis. It was estimated as a function of
dbh and tree height using adapted empirical tree specific linear regressions for the dominating tree types in the study sites as described in [
37]. Out of the 124 forest plots, 104 plots covered the footprints of the TanDEM-X data that were available for this study.
2.2. Satellite Data
Datasets from the bistatic TanDEM-X mission were used for this study. This mission operates two X-band SAR satellites flying in close formation in order to acquire single-pass interferometric SAR data. The primary goal of the TanDEM-X mission was the generation of a global digital elevation model [
11]. Both sensors of the TanDEM-X mission are able to transmit and receive the electromagnetic wave with a phased-array X-band antenna having a carrier frequency of 9.65 GHz [
40], which results in a wavelength of about 3.1 cm. One sensor acts as a transmitter and receiver (monostatic/active) while the other only receives (bistatic/passive) the electromagnetic waves in the operational bistatic mode. However, during the mission lifetime, the sensors also operated in other, experimental modes and all datasets are available to the scientific community on request.
The TanDEM-X acquisitions that were used also contributed to the creation of the global TanDEM-X digital elevation model by the German Aerospace Center for the respective area. Thus, all scenes were acquired in horizontal polarization (HH, transmit, and receive) and bistatic StripMap mode at a nominal resolution of about 3 m. Data were delivered in a coregistered single look slant range complex (CoSSC) format. In total, eight acquisitions were used (
Table 2). Two scenes were available for each of the three study areas, covering the winter and summer period in comparable sensor configurations. Two additional acquisitions for the core site Hainich were used to investigate the impact of varying acquisition parameters on the sensitivity to monitor structural parameters.
Table 2 additionally lists the weather conditions during the overflight (mean air temperature and precipitation sum for the day of overflight) that were recorded at the closest weather station of the Climate Data Center of Deutscher Wetterdienst (DWD).
2.3. Processing of Satellite Data
The TanDEM-X CoSSC data were processed in two separate workflows following the concept of the study to analyze the sensitivity of backscatter and coherence with respect to forest structure parameters.
The radar backscatter measures the amplitude of the scattered wave and was accounted for by calibrating the amplitude values to gamma naught (
γ0) backscatter coefficients. Gamma naught represents the ratio between the incident power and the scattered power for a reference area that is perpendicular to the line of sight from the sensor to an ellipsoidal model of the ground surface [
41]. The brightness of the scattered waves is affected by the terrain. Therefore, terrain flattening was performed to compensate for the local slope in the processing of
γ0 by dividing the backscatter by a factor for the local illuminated area:
where
β0 is the backscatter in relation to the slant range of the SAR system, also referred to as the radar brightness.
K is a scalar calibration constant and
 is a factor for the terrain corrected local illuminated area that is given by the ratio of the illuminated area in slant range to the plane that is perpendicular to the line of sight from the sensor [
41]. The terrain flattened gamma naught values were multilooked with 5 to 6 looks in range and 6 looks in azimuth depending on the orbit and slant range position. The refined Lee filter [
42] was applied to remove speckle effects using a window size of 7 × 7 pixels.
The magnitude of the interferometric coherence (|γ|) describes the degree of correlation between two complex radar images [
43]. It is a measure of quality for the phase measurement in interferometric SAR analysis (e.g., DEM generation). It is affected by instrument and acquisition parameters as well as topography and properties of the surface that is imaged, e.g., soil and vegetation structural parameters. Since the true coherence based on the expectation value is usually unknown, the interferometric coherence must be estimated with the mean value of neighboring pixels assuming ergodicity for the coherence [
44]. In the present study, the coherence was estimated with a moving window of 9 × 9 pixels. In general, decorrelation of the coherence is caused by different, independent factors that are described in detail in [
11]. For TanDEM-X, the temporal decorrelation can be neglected due to the almost simultaneous acquisitions. Decorrelation that was caused by other factors than the volume scattering of the vegetation was removed from the signal (see [
26] for more details). As a result, the volume of coherence
γVol can be retrieved as:
where
γSNR is the signal-to-noise ratio (SNR) coherence. It is a function of the SNR of the individual channels of the bistatic acquisition and can be calculated from the NESZ pattern that is available for every single TanDEM-X dataset [
26].
Both products—volume coherence and backscatter coefficient—were transformed to ground range in the cartographic reference system WGS1984 UTM Zone 32 (Schwäbische Alb, Hainich) and 33, respectively (Schorfheide-Chorin), and resampled to a uniform pixel size of 12 m.
2.4. Analysis
Prior to the sensitivity analysis of the TanDEM-X data, a variance analysis (Mann–Whitney U test for two independent samples, Kruskal–Wallis test for more than two groups of data) was applied to the field data in order to test for the hypothesis that the distribution of the forest parameters is identical over the subsamples. The underlying assumption of this test was that the subsamples (e.g., forest type: deciduous vs. coniferous) of the investigated forest plots are representative and comparable and do not affect the overall relation between X-band data and forest parameter.
The mean values of volume coherence
γVol, as well as γ0 backscatter coefficient values, were then extracted from all available TanDEM-X datasets for all pixels whose center coordinates fall inside the respective 100 m × 100 m plot area. They were tested as independent variables in a univariate linear correlation model to analyze the relationship between the forest and SAR parameters:
where
xi is the SAR variable (
γVol;
γ0) and
yi the forest parameter to be predicted for the plot
i,
α is the intercept (bias),
β is the slope, and
εi is the error term of the linear regression for that plot. A linear relation between the SAR variables and forest parameters was observed e.g., by [
45,
46], and other studies. Since it requires a linear scaling of the input variables the gamma naught data were not logarithmically scaled to dB values.
The validation of results was based on the calculation of the Pearson correlation coefficient r. The overall significance of the linear models was estimated from an F-test and the definition of critical p-values at 99.9%, 99%, and 95% significance level. For each test site, a TanDEM-X acquisition during wintertime and summertime was considered and the corresponding mean values for all plots were aggregated to a single variable for winter and summer respectively. In addition to the evaluation of all plots, the sample was split by forest type, study site, and development stage. Furthermore, for the Hainich test site, two additional TanDEM-X datasets were evaluated against further sensor characteristics (baseline, incidence angle, and height of ambiguity).
All relations were investigated for the InSAR volume coherence as well as for the backscatter coefficient as an independent variable and the five forest structural variables (h95, hL, hM, hSD, and VOL) as dependent variables. All empirical models were evaluated based on a combination of strength, direction, and significance yielding a categorization of the model accuracy in six categories ranging from high to marginal significance with positive (+) and negative (*) slopes of the regression line for the respective relation.
3. Results
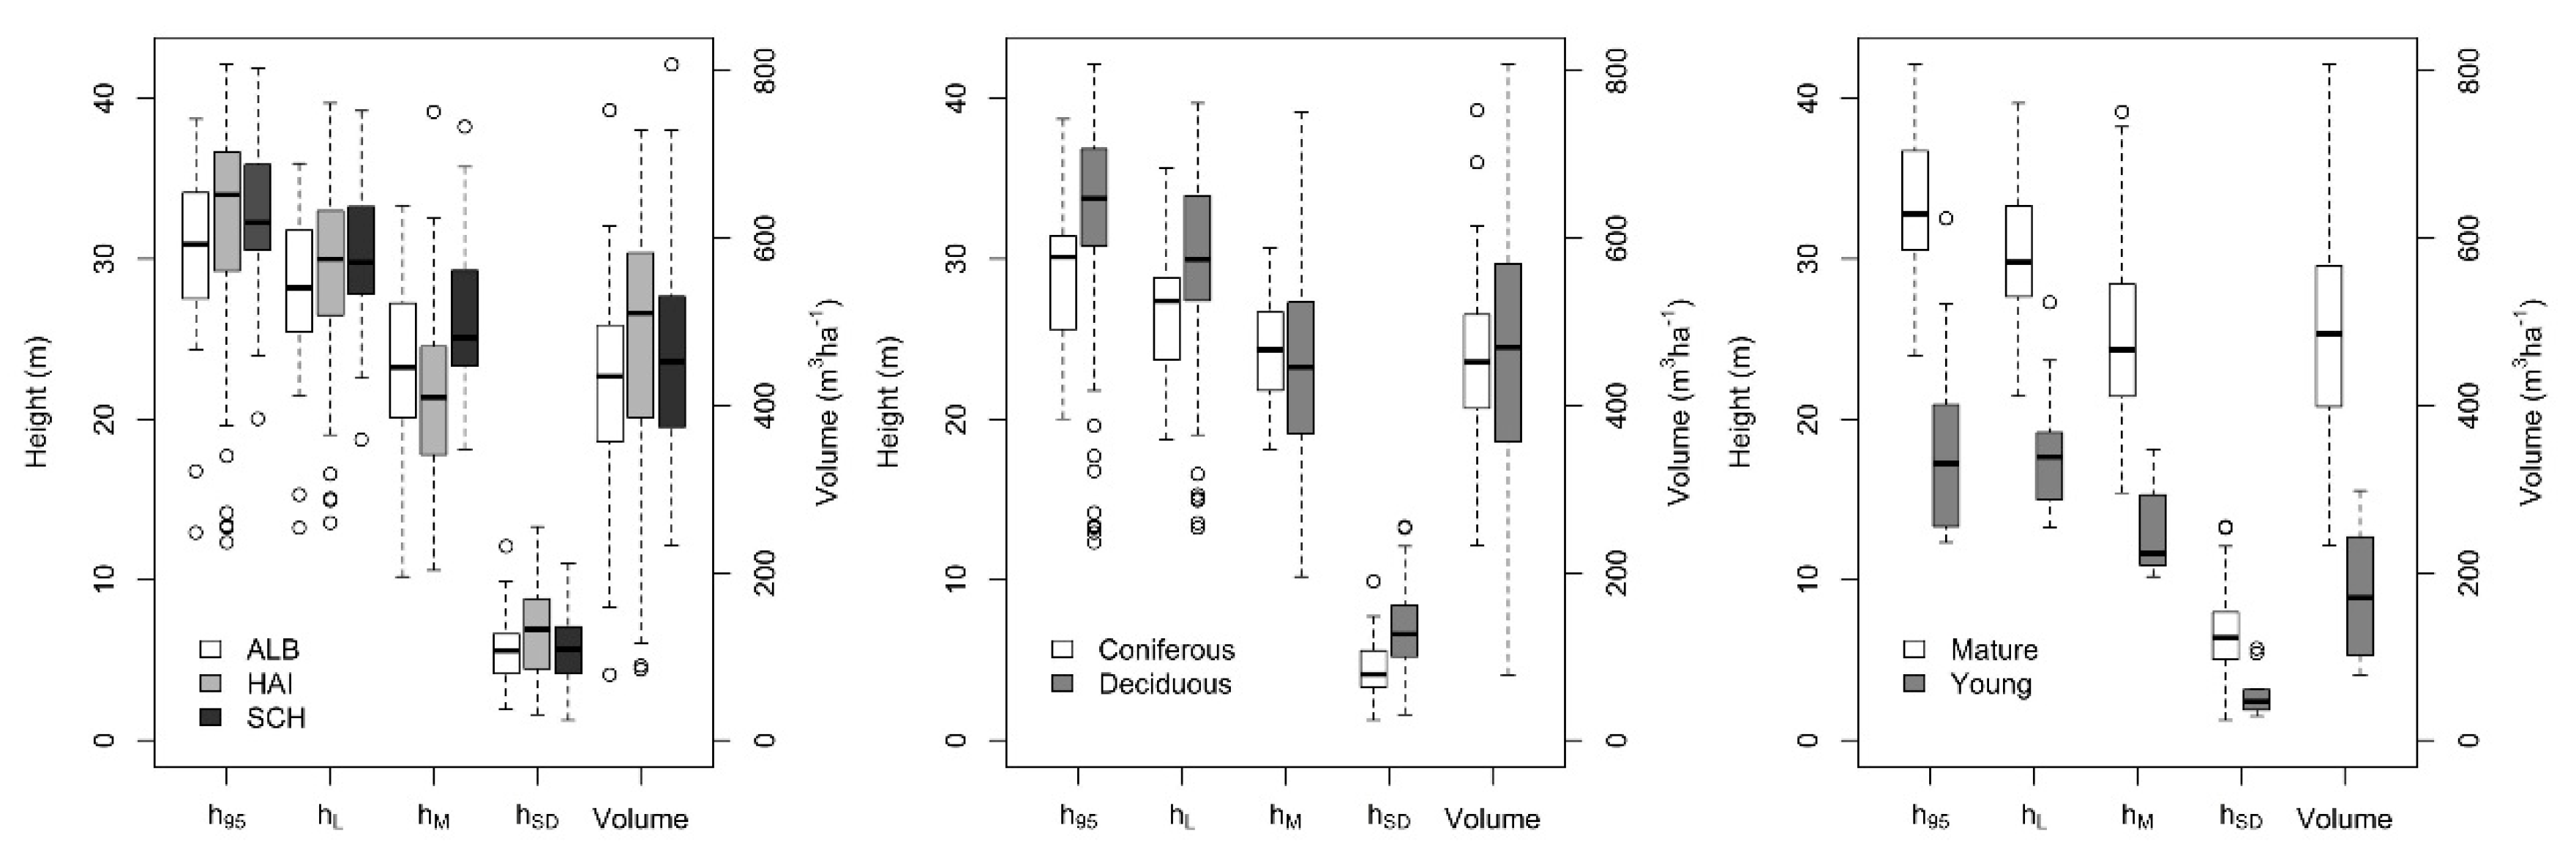
A summary of the calculated plot attributes at the level of all 104 plot across the three study sites is given in
Figure 2. The Kruskal–Wallis test revealed on the one hand that the distributions of all forest parameters, except
hM, were not statistically different between the three study sites. On the other hand, when separating all plots across the three sites by forest type (deciduous vs. coniferous), the Mann–Whitney-U test pointed out that all parameters except
hM and
VOL showed significantly different distributions. The same applies to a stratification of the whole dataset by the development stage (young vs. mature stands). Here, the distribution of all forest parameters was significantly different between the development stages. In general, the sample of forest stands across the three sites reflected a large heterogeneity of forest structural characteristics and management intensity. In the following, the sensitivity of the SAR signal for variations in these forest structural parameters was tested over the gradient of all three sites as well as for the different stratification schemes (forest type, development stage). This enabled a comprehensive assessment of the relations between the TanDEM-X signal and forest structural parameters.
3.1. Sensitivity Analysis across All Three Test Sites
The summary of the linear models for all available plots (
Table 3) reveals that the relationships between TanDEM-X acquisitions and forest height parameters were more significant during wintertime compared to summertime. Furthermore, the volume coherence of the two complex bistatic images yielded considerably higher significant relationships in terms of
r- and
p-values compared to the backscatter coefficient of the single (master) TanDEM-X image. Coherence showed highly significant linear relations to all tested forest parameters for the winter acquisitions and to
h95,
hL, and
hSD for the summer acquisition. The relation between volume coherence and forest parameters was always negative, i.e., an increase in the forest variable is associated with a decrease in coherence. On the contrary, the slope of the regression line for the models that used backscatter as independent variable is positive for all significant relations, i.e., an increase in the forest variable was accompanied by an increase in the backscatter coefficient. However, only
hSD showed a significant positive trend. When the sample was split by forest type, deciduous forests, in general, were more significant in winter whereas the significance for the relations between forest variables and volume coherence in coniferous forests was higher in summer. The slopes of the linear empirical models were comparable between the different forest types for the same forest parameter (
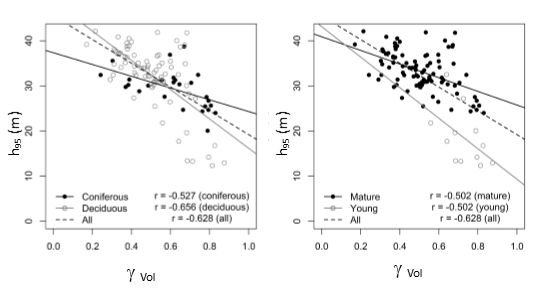
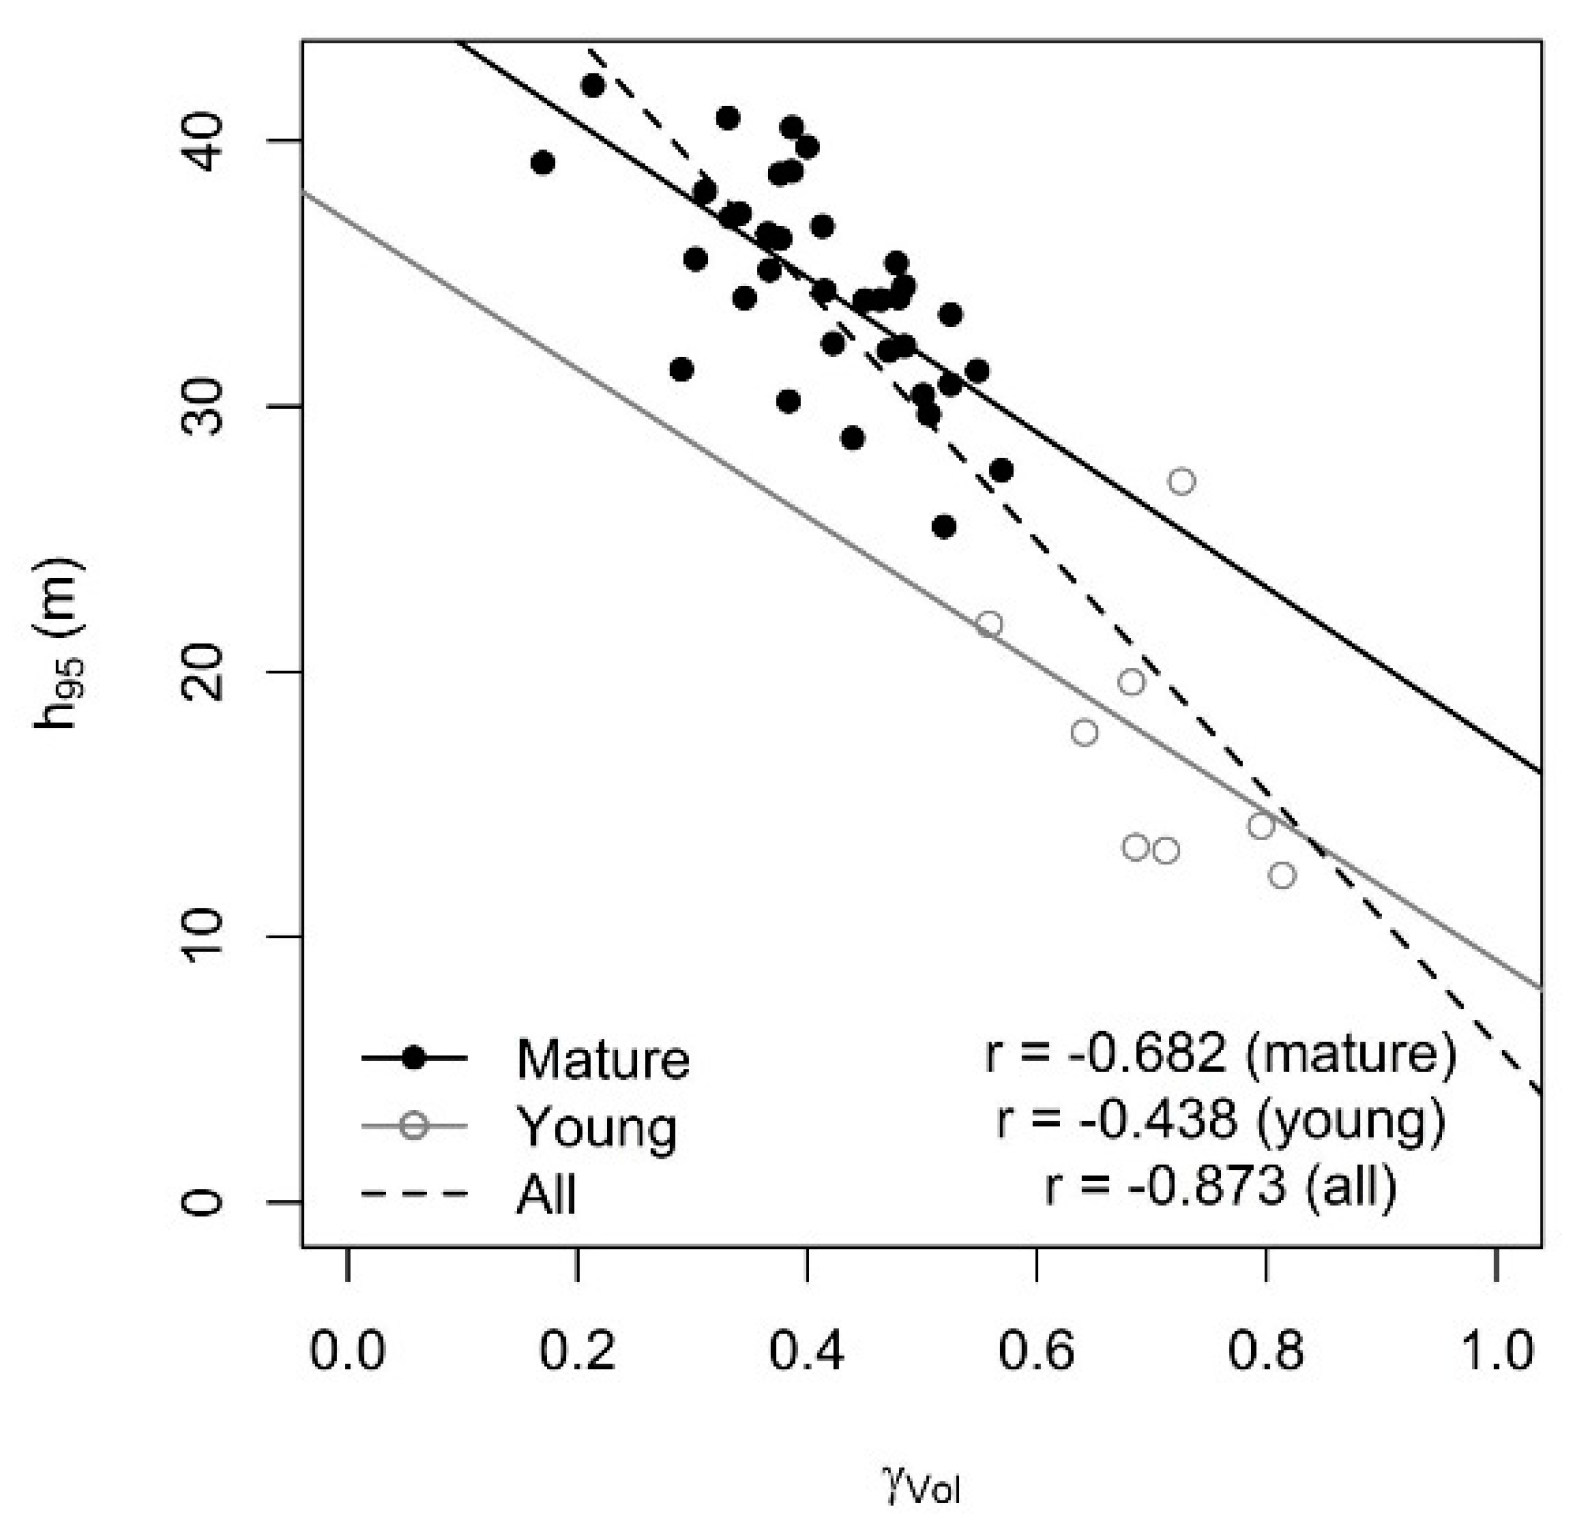
Figure 3a). It is worth noting that the general significance of the models did not improve after forest type stratification. Comparable effects were observed for the stratification of the forest plots by the development stage (compare
Figure 3b for the relation between volume coherence and
h95 for young and mature forests). However, the detailed analysis of the stratification by the development stage was restricted to this site since the sample for young forest stands was small compared to mature forest stands and the majority of young stands occurred in one test site (HAI).
In contrast to coherence, the models that are based on backscatter did not reveal any significant relations, except for a weak negative relation between backscatter and VOL in deciduous forests.
3.2. Sensitivity Analysis at the Level of the Study Site
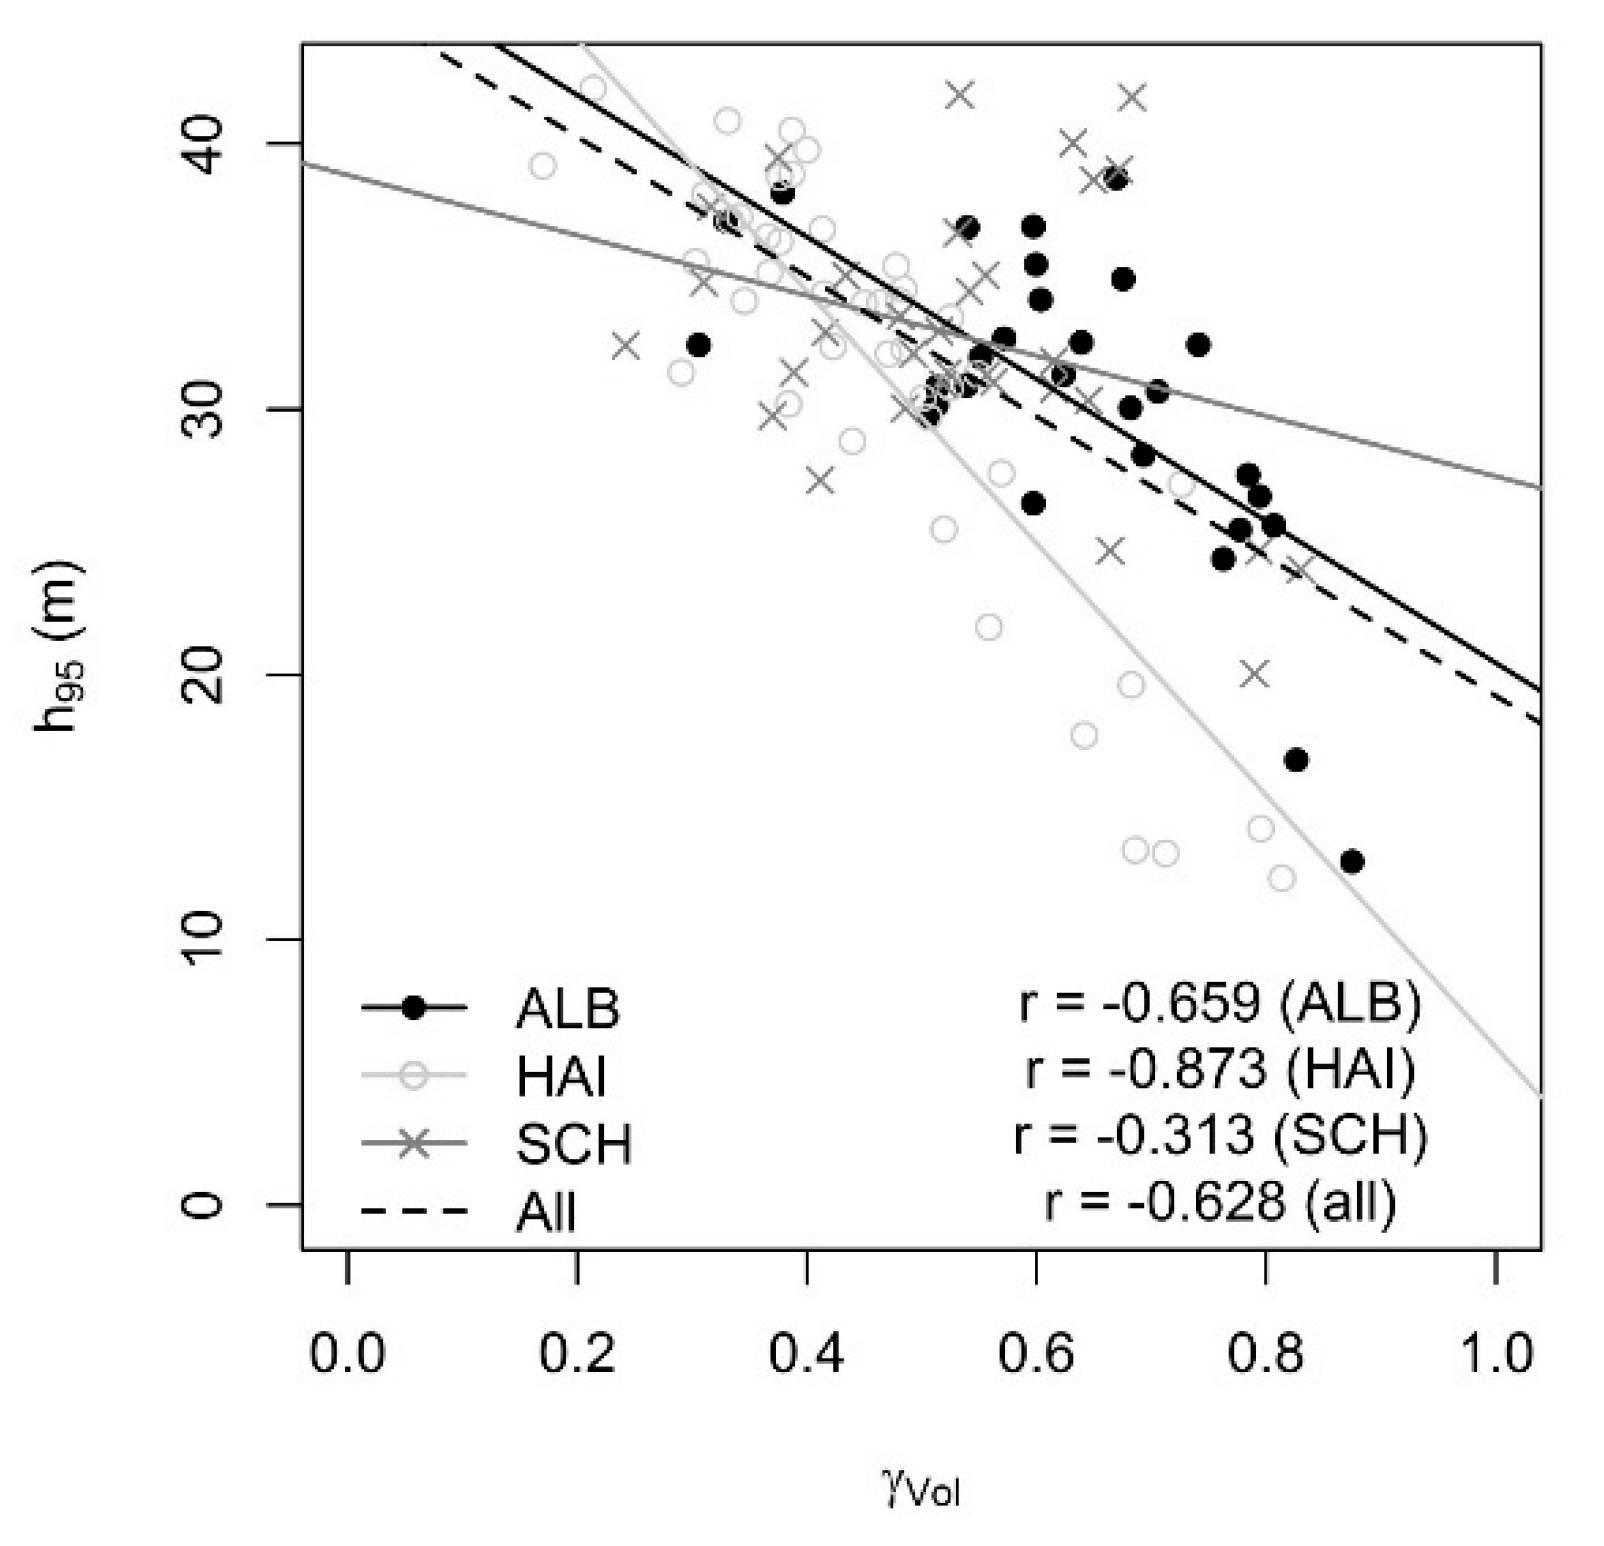
Subsequently to the investigation of the whole set of 104 plots, the sample was divided by the study site in order to confirm the higher-level relations. The results also indicate that at the site level, TanDEM-X acquisitions during wintertime resulted in higher significant relationships to forest height parameters compared to summertime in all three sites (
Table 4). In general, volume coherence yielded considerably better results in terms of model significance compared to backscatter in Schwäbische Alb and Hainich. The study site Schorfheide-Chorin showed opposing results with higher significant relations for backscatter compared to coherence as an independent variable. The slope direction for the significant models, again, showed contrasting trends for coherence and backscatter, e.g., the relation between volume coherence and the observed forest structural parameters was negative and positive for most forest parameters and the backscatter coefficient. The slopes of the trend lines for the linear empirical models were comparable between the three study sites as can be seen for the relation between volume coherence and
h95 in
Figure 4. In general, all forest parameters showed at least one highly significant relation to one of the SAR variable in one of the three sites. However, weaker sensitivity was observed for
hM compared to other forest structural parameters.
At the site level, a further stratification in two classes (mature vs. young forests) was carried out in order to investigate the effect of the development stage of the forest stands as a categorical variable in the sensitivity analysis. Since the number of samples for young forests was too small for the sites Schwäbische Alb (
n = 3) and Schorfheide-Chorin (
n = 1), only the Hainich site could be considered for this part of the analysis. In general, the separation by development stage leads to a decrease in model significance based on volume coherence for mature stands compared to all stands in Hainich (
Table 5). This is more frequently observed for the acquisitions during the summertime (
h95,
hL,
hSD) compared to the winter scenes (
VOL). Young stands only sparsely show any significant relations between volume coherence and plot parameters, the overall sensitivity is extremely low compared to the consideration of all plots. A scatterplot of the volume coherence against
h95 clearly demonstrates a clustering in the distribution of forest parameters and the coherence values with high coherence and low top tree height in young stands and lower coherence and higher top heights in mature stands (
Figure 5). However, the slope of the trend line is almost identical for both groups of the development stage.
Considering the backscatter coefficient, in part, it is positively impacted by stratification, however, only a few significant relations are observed and they are only present for mature stands. Young stands do not display any significant relation between backscatter and forest structural parameters, but due to the small sample size, the results for this category should be treated carefully.
3.3. Impact of Sensor Parameters on Relation between SAR Signal and Forest Structural Parameters
With regard to data availability and based on the results from the previous sections (weak relations between forest parameters and backscatter), the impact of varying sensor parameters on the relation between SAR data and forest structural parameters was only investigated based on volume coherence data for the study site Hainich. Four TanDEM-X scenes with variations in sensor parameters (baseline, incidence angle, and height of ambiguity) and time of acquisition (two in wintertime, one in late summer, and one in autumn) were available (
Table 6). Even if this small set does not allow for a systematic evaluation of the impact of sensor parameters, a number of qualitative remarks seem feasible.
The two acquisitions in wintertime, in general, show higher sensitivity to the forest structural parameters compared to the other two TanDEM-X scenes in summer and autumn. Amongst these two winter acquisitions, the scene of 22 February 2012 with the smallest baseline and highest height of ambiguity yielded highly significant results over all observed plot parameters. In comparison, the autumn acquisition performs worst. In general, all acquisitions are sensitive to the main structural parameters that describe the canopy height (hL, h95) and vertical structure of forest stands (hSD).
4. Discussion
The study investigated the sensitivity of X-band SAR data to structural components of forest stands in temperate forests of different composition and management intensity in three different landscapes. Despite the heterogeneity within and between the sites, the overall structure of the forest plots regarding the observed forest parameters in the three sites was comparable (
Figure 2). Thus, the patterns of the empirical models from one site were assumed to be reproducible in the other sites. Empirical models were tested for the entirety of all plots across the different sites (
Table 3). In general, the relation between volume coherence and the investigated forest parameters was negative, both for the complete sample and at the level of the study site. Volume coherence decreased when the value of the forest structural parameter that is related to the height of the forest stand increased [
24,
47]. The highest sensitivity of the X-band was found for the relationship between coherence and the forest parameters that parameterize the canopy height (
hL,
h95) and the vertical component of the forest structure (
hSD) which can be used as a proxy for the vertical layering of the stands [
48]. On the other hand, factors that describe the overall composition of the stand (mean tree height, and volume) had a weaker impact on the SAR signal. Increasing forest top tree height, in general, leads to more penetration of the SAR signal into the canopy and an increase in scattering and thus decorrelation of the phase. This has been observed also for X-band in forests [
24,
49]. Based on this fundamental relation, the general sensitivity of coherence for forest structural parameters was confirmed in different studies, e.g., for stem volume [
21,
50], Lorey’s height [
21,
51], and tree height [
47,
52].
In contrast to volume coherence, higher X-band backscatter values coincided with higher values of the respective forest parameter. In general, the relations between the backscatter coefficient and forest structural parameters were found to be considerably weaker compared to coherence for the TanDEM-X data. This is in accordance with [
28] who investigated the relations between forest variables (AGB) and TanDEM-X coherence as well as backscatter. [
53] confirmed that in general, X-band backscatter does not contribute to AGB and stem volume estimations. One explanation for this could be the X-band backscatter signal saturation, which was reported even at low levels of AGB [
33]. The following discussion thus focuses on the results based on the volume coherence.
Highly significant correlations between volume coherence and forest structural parameters were observed for both summer and winter acquisitions of TanDEM-X (
Table 3). Overall, the winter acquisitions lead to more significant empirical relationships for the entire dataset as well as for deciduous forests. This was also observed by [
54] for the assessment of the vertical structure from TanDEM-X InSAR data. Our results confirmed that leaf-off conditions are favorable in deciduous forests for monitoring structural parameters with X-band coherence where penetration is higher and thus the volume coherence contains more information about vertical structure compared to leaf-on conditions [
54]. Accordingly, coniferous stands were not affected by season or, in parts, even show a higher significance for summer acquisitions of TanDEM-X. The impact of the seasonal conditions on the relation between coherence at C-band and forest structural parameters was also investigated by [
50]. They suggested that the absolute level of coherence contributes significantly to the strength of the correlation between coherence and stem volume. A lower level of coherence was in general associated with summer/autumn observations and higher levels to winter observations [
50], thus, the results confirmed the above mentioned seasonal behavior of X-band volume coherence. Exceptions from this general trend are supposed to be attributed to anomalies in weather conditions, e.g., frozen/unfrozen conditions in winter [
53] or presence of water on stem, leaves or in the atmosphere [
26]. Note that also the baseline and the respective height of ambiguity affects the absolute level of coherence.
The stratification of the entire sample of 104 forest plots by different categorical variables at the stand level (forest type, study site, and development stage) was carried out to investigate the validity of the found relations in other environments under similar conditions. The main outcome, here, was that a separation by forest type (deciduous/coniferous) did not improve the overall relations between volume coherence and forest structural parameters and that all significant relations were negative, independent of forest type (
Table 3). This is in opposition to other findings that underlined the impact of stratification on the relation between SAR data and forest parameters and even showed opposing trends in models after separation of the total sample [
34,
52]. A general criticism of applying models across different forest types was issued by [
29] who claimed that scatterplots of SAR variables against forest structural variables show clusters within the distribution that are related to the strata and thus, the statistical relationship might not reflect the actual relation within each cluster. In contrast, the stratification by forest type (deciduous/coniferous) did not result in different distributions and relations in our study. This is in line with other studies revealing that different tree types do not have a major effect on modeling forest structural parameters, at least during leaf-on conditions [
55,
56].
The stratification of the total sample by study site indicated that the general relations between coherence and forest parameters are reproducible at the site level (
Table 4). The slopes of the trend lines were comparable between the sites, indicating that the site as a categorical variable did not contribute to a clustering of the data distribution (
Figure 4). [
34] confirms a significant impact of the site on the model performance for two substantially different forests in Spain and Denmark. However, in our study, the Schorfheide site indicated generally less significant relationships compared to the other sites. This could be based on the fact that only one young forest plot was available in Schorfheide and thus, forest height was generally at the same level across the plots. Another explanation for the weaker performance in Schorfheide is the lower tree density. More open forests lead to a higher penetration of the X-band and thus to a more diffuse scattering. On the contrary, the open stands in Schorfheide show less saturation of the X-band backscatter, which is in accordance with [
34]. This leads to a higher sensitivity of backscatter to forest structural parameters at this site.
A different effect was observed for the stratification by the development stage (
Table 5). In the present study, the separation in young and mature forests clearly indicated two clusters in the scatterplot of volume coherence against forest parameters. The slope of the trend line between the two categories was identical but the trend of mature forests showed a notable bias compared to young forests (
Figure 5). It was found that, in general, the separation by development stage had the most obvious effect on the sensitivity of the X-band to forest structural parameters. This is in line with [
25] who reported a significant impact of both slope and bias on the relation between InSAR height parameters and stem volume when the sample was stratified by stand parameters.
The comparison of TanDEM-X single-polarized data over one study site for different acquisition configurations underlined the advantage of leaf-off conditions for X-band based forest assessments and the impact on the relation between X-band coherence and forest parameters that describe the vertical structure at the stand level (
Table 6). The height of ambiguity in three out of four TanDEM-X acquisitions was close to the top tree height of the study site. Best results in terms of model significance were achieved with a height of ambiguity that is considerably above the top tree height (65.8 m). If the height of ambiguity is in the range of the top tree height, the phase cannot be unwrapped without ambiguity [
57], on the other hand, very small baselines and higher height of ambiguity lead to limitations in sensitivity of the phase to forest vertical structure [
45,
58,
59]. Thus, the optimal height of ambiguity for forest vertical structure assessment from X-band InSAR data is above the maximum stand height and should not exceed 100 m [
45].
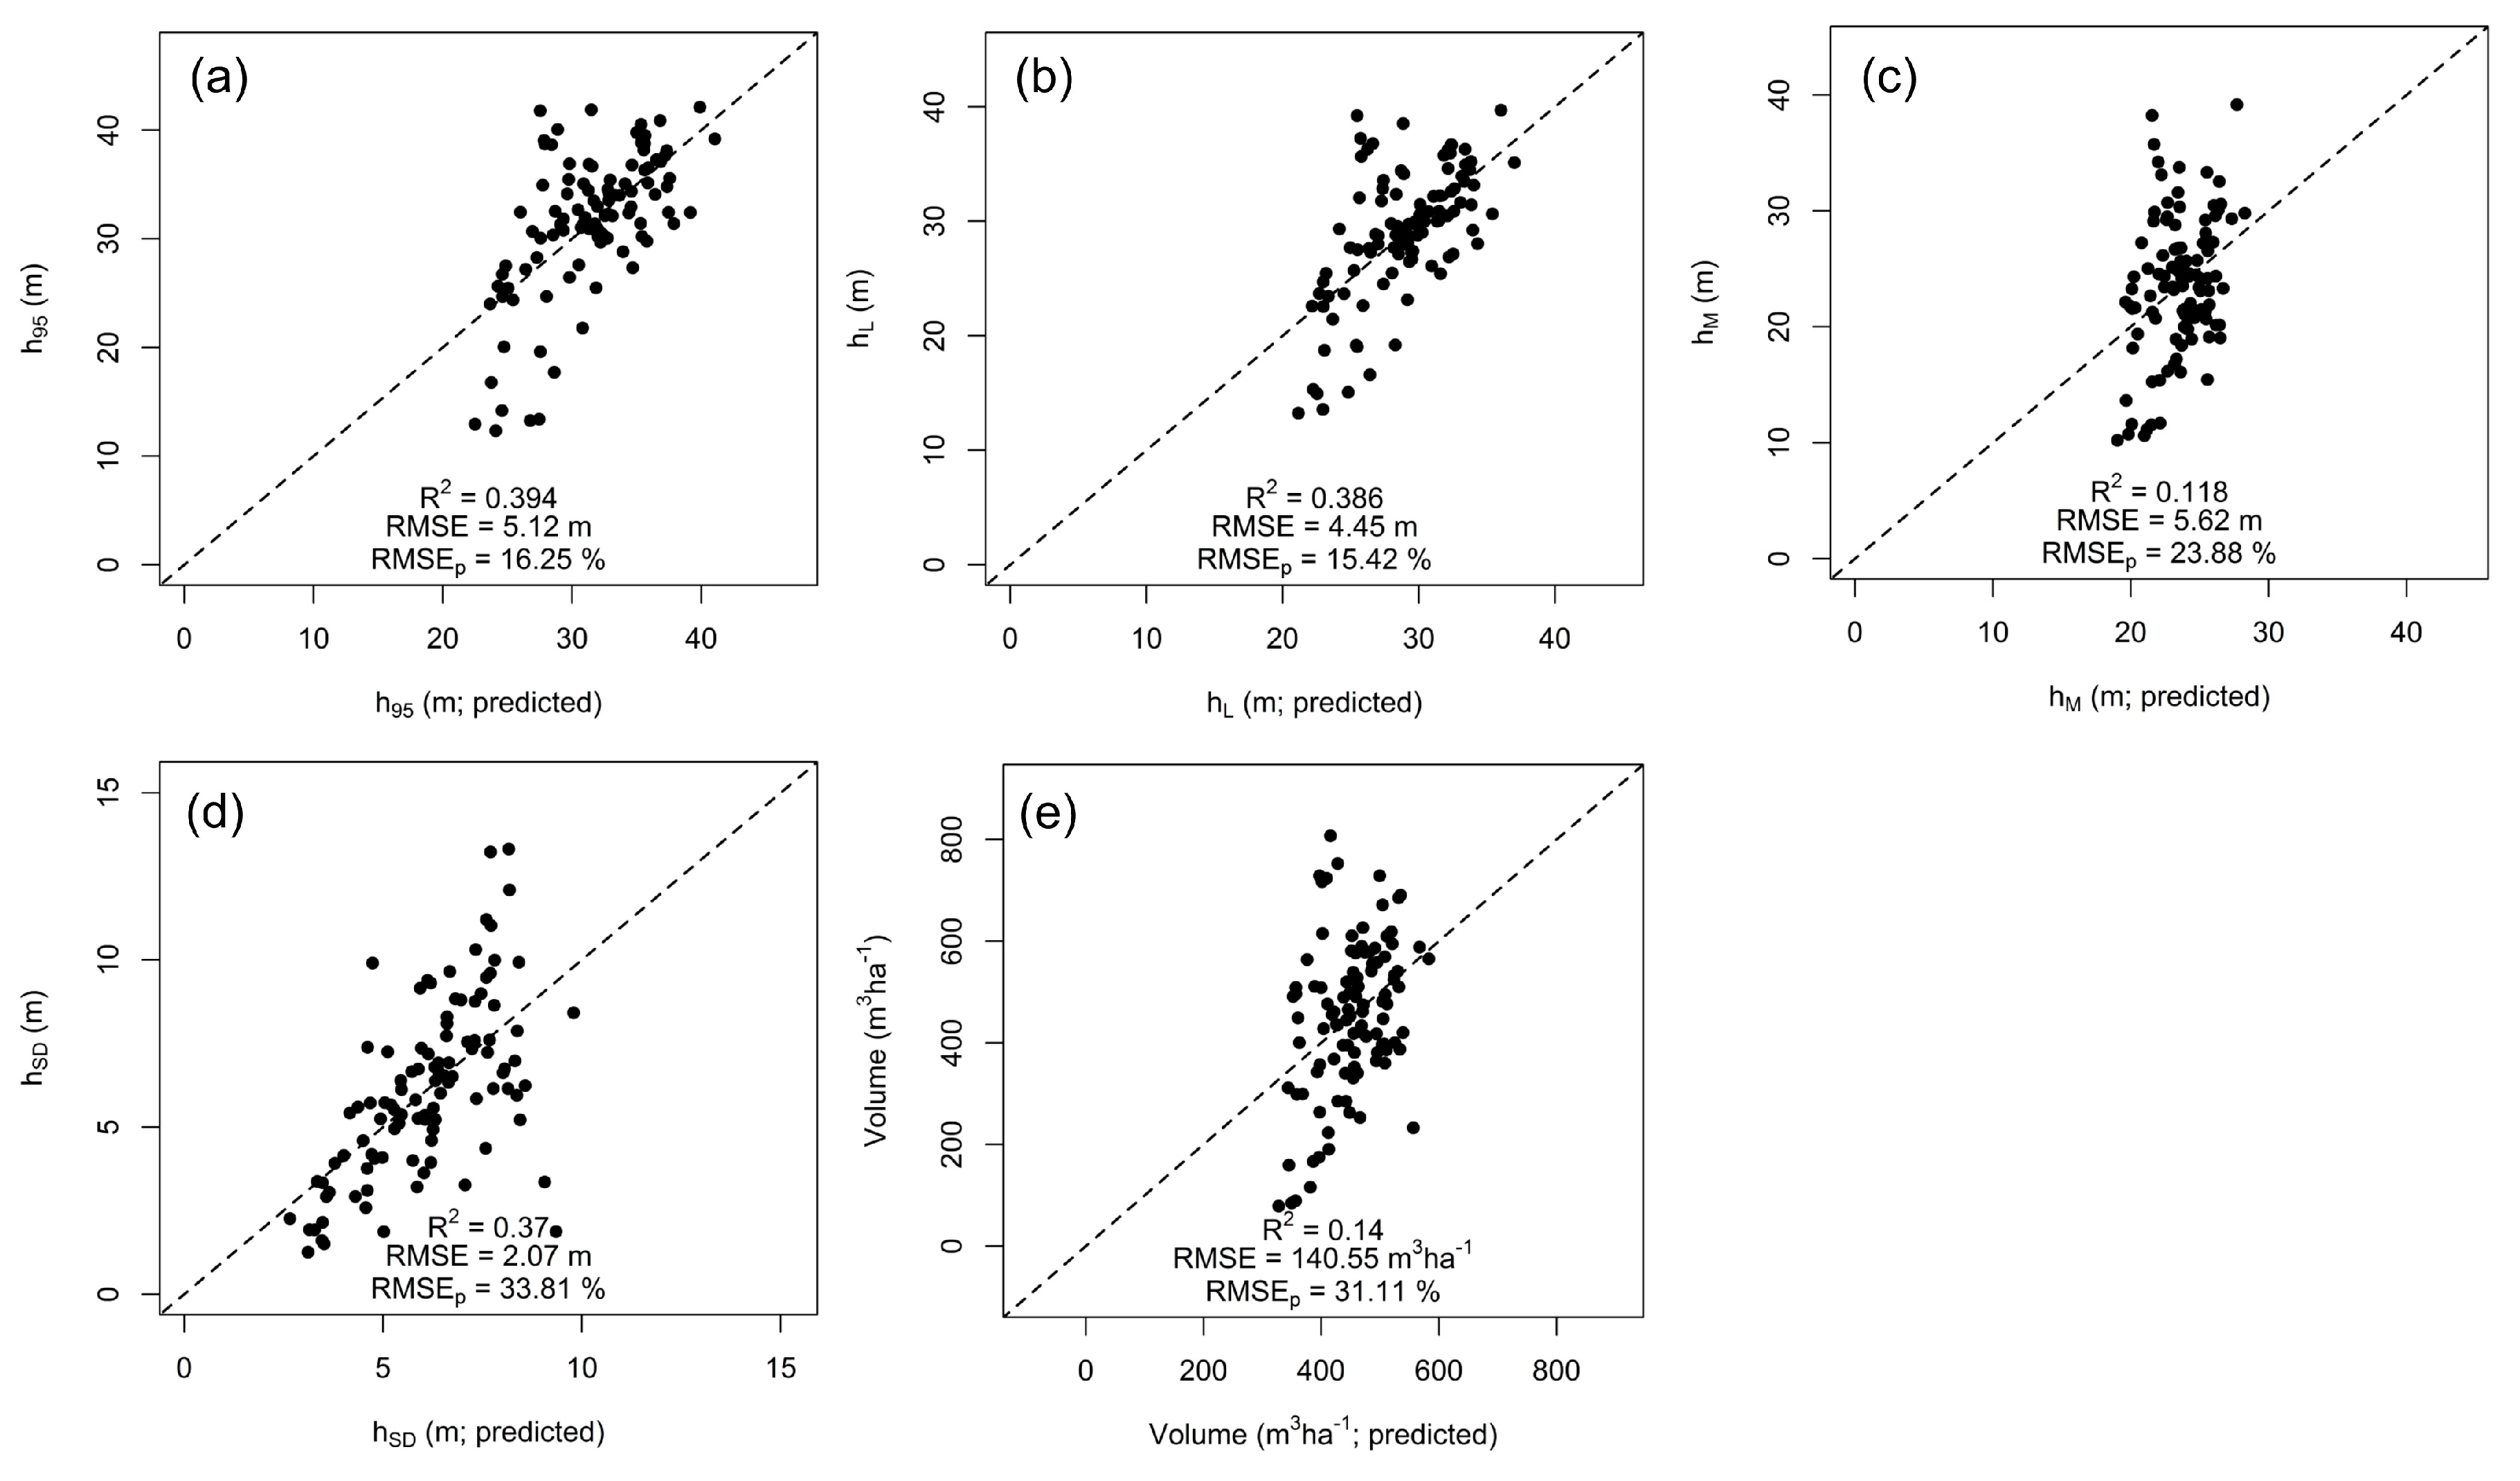
Based on the sensitivity analysis of single-pol TanDEM-X coherence to forest structural parameters, empirical linear models were tested in terms of the ability to predict the forest parameters (
Figure 6). Most accurate predictions were achieved for parameters that define the upper canopy and the vertical structure of the stand (
h95,
hL) compared to parameters that express the overall composition of the forest at the stand level (
hM.
VOL). The accuracy in terms of the coefficient of determination and the
RMSEp is comparable to other studies based on single-pol X-band InSAR data that used ancillary data for the ground phase [
21,
58] or evaluated physical models for the prediction of forest structural parameters [
20].


