Article

Analysis of Clay-Induced Land Subsidence in Uppsala City Using Sentinel-1 SAR Data and Precise Leveling

by
Jonas Fryksten
1,* and
Faramarz Nilfouroushan
1,2
1
Department of Computer and Geospatial Sciences, University of Gävle, 801 76 Gävle, Sweden
2
Department of Geodetic Infrastructure, Geodata Division, Lantmäteriet, 801 82 Gävle, Sweden
*
Author to whom correspondence should be addressed.
Remote Sens. 2019, 11(23), 2764; https://doi.org/10.3390/rs11232764
Submission received: 30 October 2019 / Revised: 20 November 2019 / Accepted: 22 November 2019 / Published: 24 November 2019

Abstract

:
Land subsidence and its subsequent hazardous effects on buildings and urban infrastructure are important issues in many cities around the world. The city of Uppsala in Sweden is undergoing significant subsidence in areas that are located on clay. Underlying clay units in parts of Uppsala act as mechanically weak layers, which for instance, cause sinking of the ground surface and tilting buildings. Interferometric Synthetic Aperture Radar (InSAR) has given rise to new methods of measuring movements on earth surface with a precision of a few mm. In this study, a Persistent Scatterer Interferometry (PSI) analysis was performed to map the ongoing ground deformation in Uppsala. The subsidence rate measured with PSI was validated with precise leveling data at different locations. Two ascending and descending data sets were analyzed using SARPROZ software, with Sentinel-1 data from the period March 2015 to April 2019. After the PSI analyses, comparative Permanent Scatterer (PS) points and metal pegs (measured with precise leveling) were identified creating validation pairs. According to the PSI analyses, Uppsala was undergoing significant subsidence in some areas, with an annual rate of about 6 mm/year in the line-of-sight direction. Interestingly, the areas of great deformation were exclusively found on postglacial clay.

Graphical Abstract

1. Introduction

The latest ice age, that began about 100 000 years ago and ended about 10,000 years ago, had an enormous impact on the near-surface geology in Sweden [1]. A consequence of the ice melting and the time after, with a significant land uplift, were the mighty layers of clay that were formed [2]. One of the most significant drawbacks of clay, as a foundation for human development, is its mechanical properties that makes it a weak layer, which have consequences like subsidence [3] and swelling and shrinkage [4]. Subsidence in clay can occur as a natural process but also because of an increased level of stress, caused by additional loads from human activity or a lowering of the ground water table [5]. In urban areas, subsidence can cause serious problems on the built environment, like tilting buildings, caused by uneven subsidence, and a ground surface that subside faster than buildings that have pile foundation.
In Sweden, some cities are located on clay and are characterized by uplift and land subsidence phenomena similar to many other cities of the world, for instance London [6] and Las Vegas [7]. These cities are subsiding in different rates, and many of them are undergoing rapid development and densification, so knowledge about the large-scale subsidence could be important in the long-term planning of a city. There are different geodetic techniques to measure subsidence, where the very accurate precise leveling is the most traditional and most used in the field of civil engineering in Sweden [8]. Another technique, which can accurately be used on a large scale, is the satellite based Interferometric Synthetic Aperture Radar (InSAR) technique, where the key concept is to calculate the phase difference between two SAR images, by creating interferograms [9,10]. For accurate deformation monitoring (mm-precision), traditional InSAR have some considerable limitations and to overcome this, many images over the same area and from different times can be used, in which certain pixels are selected and studied in terms of phase difference through time. This multi-image technique is commonly called Persistent Scatterer Interferometry (PSI) and is suitable when measuring urban subsidence, because of the high accuracy [11,12].
For this study, Sentinel-1 radar data from the European Space Agency (ESA) was used. Many studies have been carried out where the PSI technique has been applied with Sentinel-1 data to monitor deformations of the ground surface. Crosetto et. al. [13] were among the first to apply the PSI technique with Sentinel-1 data. They achieved promising results, even though the studied period was rather short, from October 2014 to April 2015. Newer studies have been performed, for instance, by Del Soldato et. al. [14] and Roccheggiani et. al. [15]. In the former, about 300 Sentinel-1 images were used in three analyses considering a two – three years study period, to investigate the subsidence rate in an area in central Italy. In the later, about 320 images were used in a three years study period, to analyze the ground displacement caused by underground tunneling. Sentinel-1 data can also be used in PSI analyses for other applications than ground surface monitoring, like measuring deformations of important infrastructure like dams and bridges [16,17,18].
In the application of subsidence monitoring, validation studies between precise leveling and the PSI technique, with data from other satellites than Sentinel-1, have been performed. Hung et. al. [19] used 20 ENVISAT images from two years in an agricultural area in Taiwan. They found that the Root Mean Square (RMS) of all the differences in vertical displacement rates from the PSI-analyses and precise leveling was 6 mm/year. Karila et. al. [20] compared the subsidence rate, in an urban environment in Finland, measured with PSI and precise leveling. In that study, PSI analyses were performed with ERS and ENVISAT data from 14 years and the agreements were rather good, as the differences between precise leveling and PSI were between −0.9 mm/year and +0.6 mm/year, with a mean at 0.03 mm/year.
In this study, Sentinel-1 radar images, collected between March 2015 and April 2019, were processed and analyzed with PSI technique, to accurately measure the subsidence rate in Uppsala, which is an urban area built on clay. Furthermore, the results from the PSI analyses were validated with metal pegs that have been measured with precise leveling. The goal of this study is mainly to generate a deformation map of Uppsala to understand the ongoing heterogeneous deformations and to highlight risk zones, which are undergoing a relatively higher subsidence rate. In addition, a geological and geodetic data analysis was carried out to examine the correlation between deformation rates, detected in this study, and the type of quaternary deposits. Moreover, we will analyze how accurate Sentinel-1 data can measure subsidence rate, when the PSI technique is applied, and how well Sentinel-1 PSI and precise leveling agree in validation for our study area.
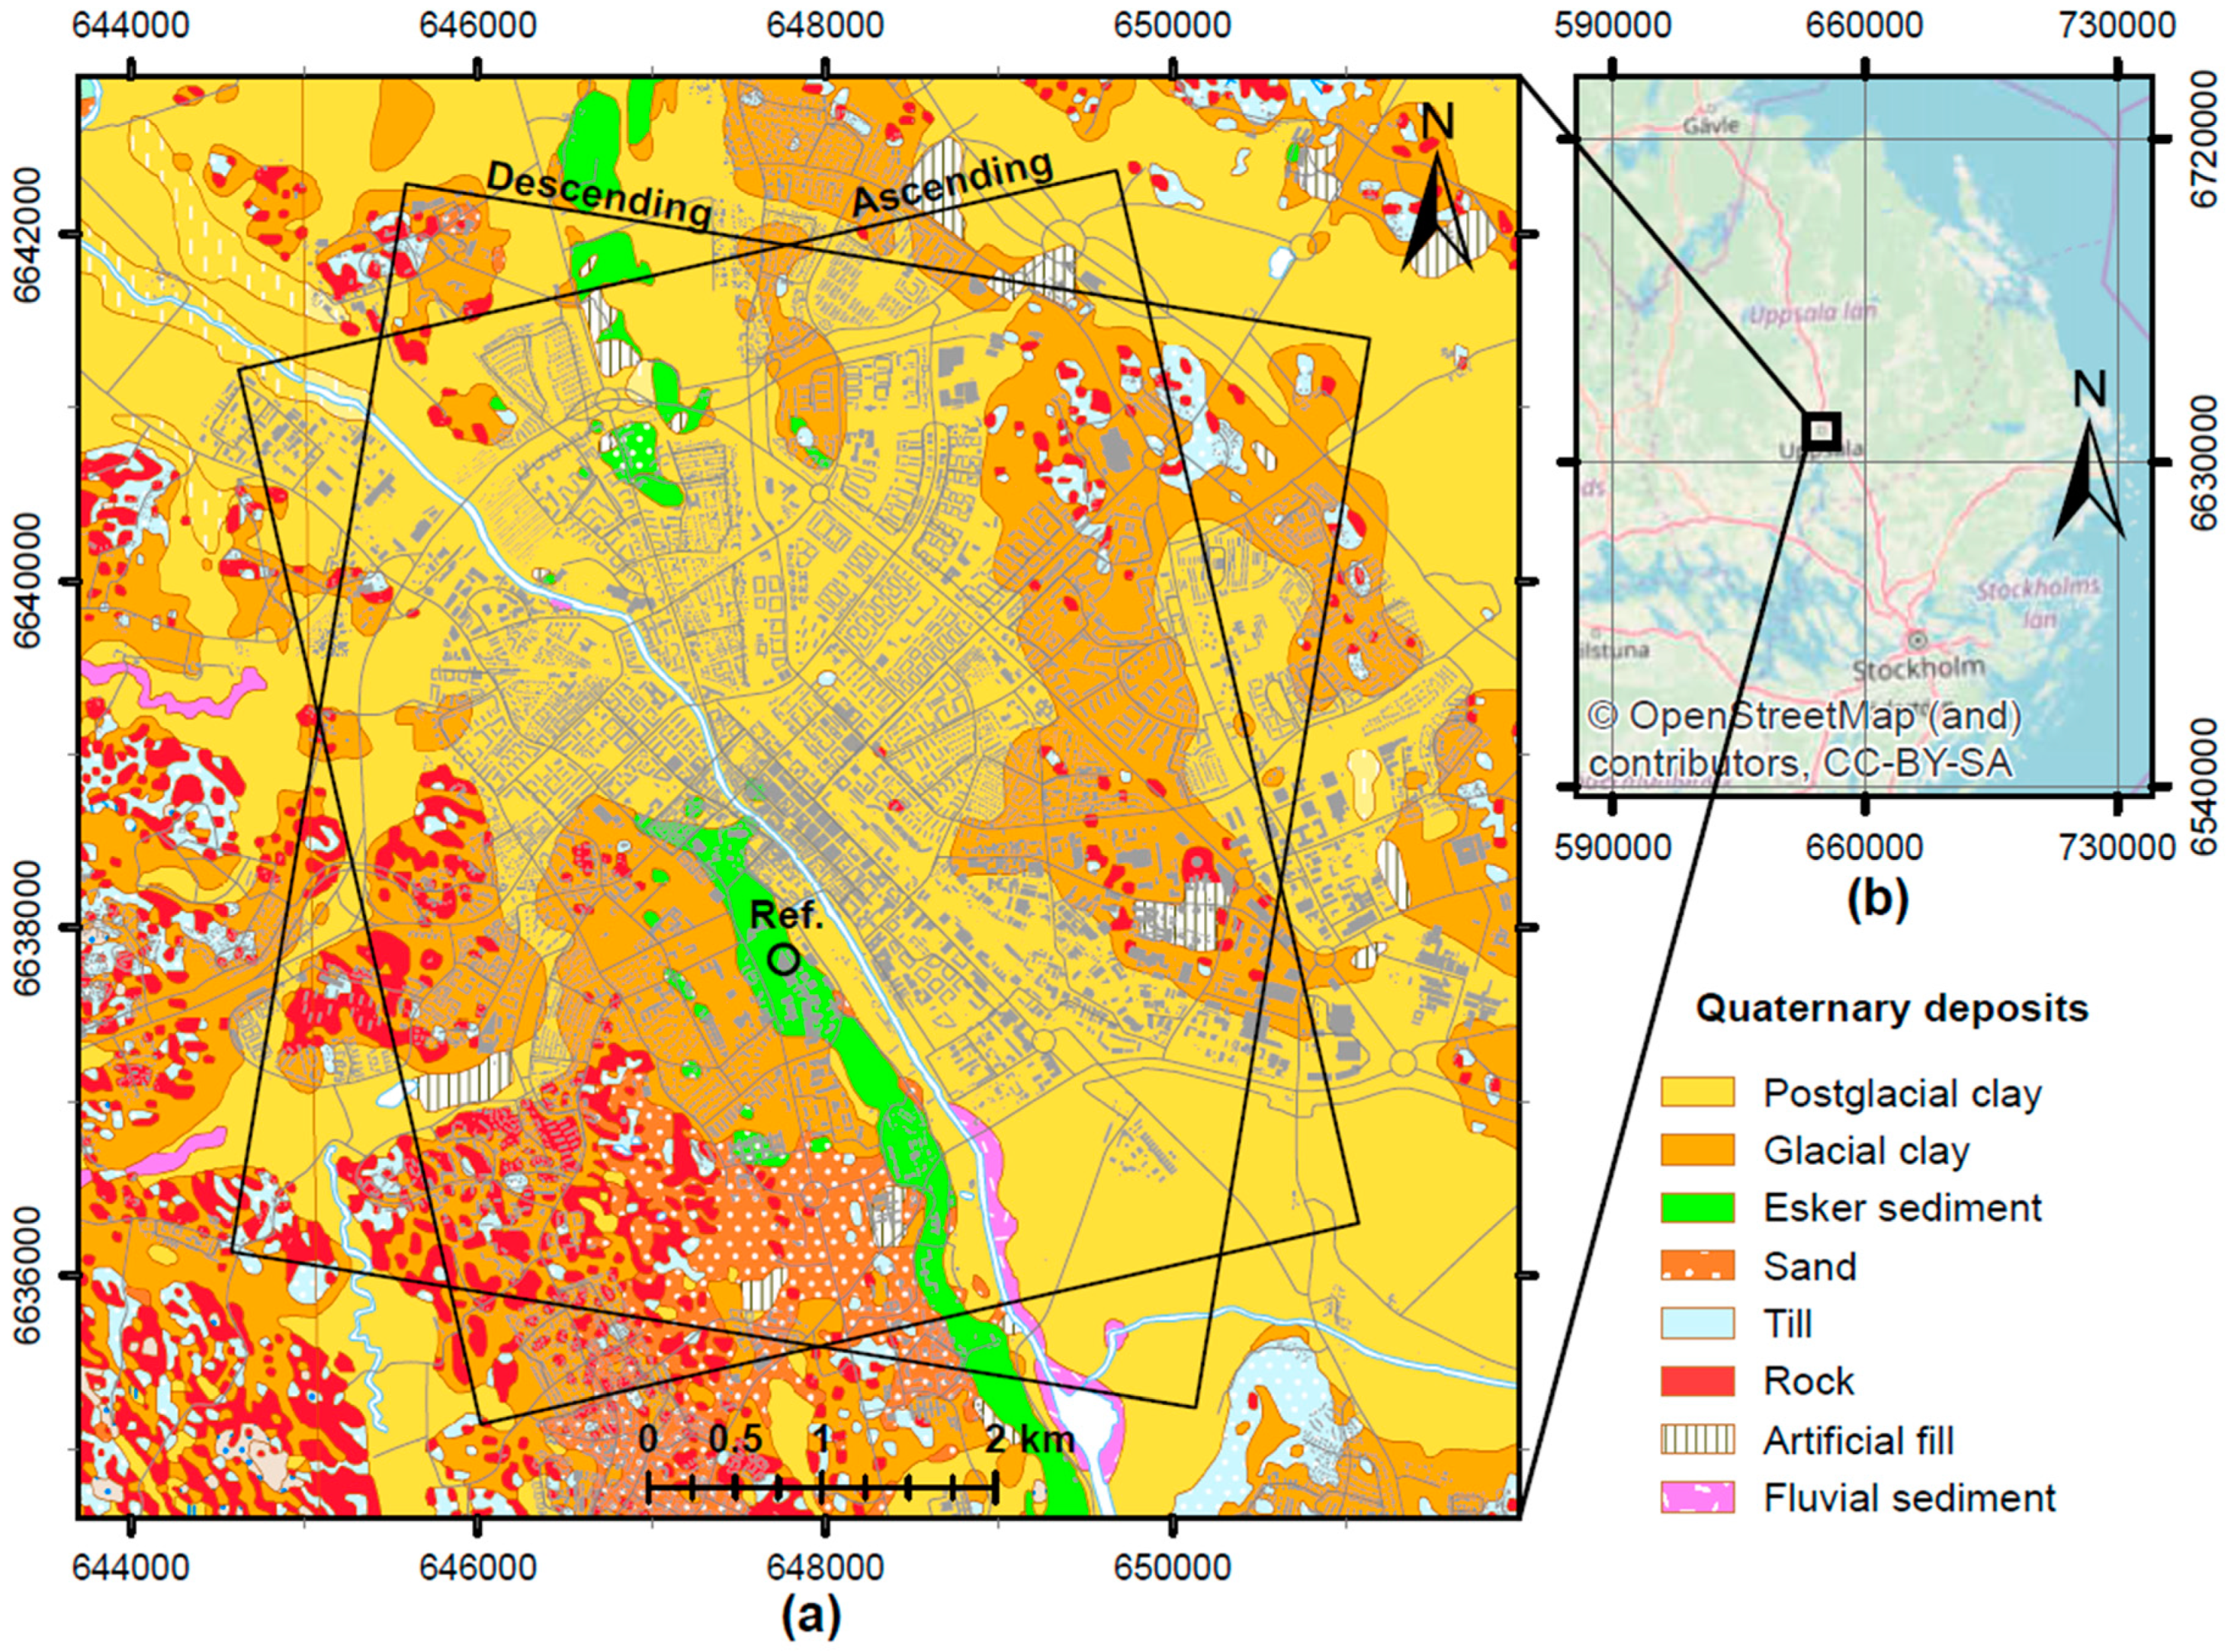
2. Study Area

Our study covers an area of about 38 km2, for both ascending and descending satellite images, and includes the main buildings and infrastructures of Uppsala (Figure 1). The city of Uppsala with a population of about 220,000 is located just north of Stockholm (Figure 1) and it is the fourth-largest city in Sweden. Uppsala is situated on top of some varying near-surface geology, which makes it an interesting target for large-scale deformation studies. According to the quaternary deposits map from the Geological Survey of Sweden (SGU) [21] there is an esker (Uppsalaåsen) going in a north-south direction in the middle of the city, on which some old and important buildings are located, such as the city hospital, castle and cathedral. Big parts of the city though is built on clay, seen in Figure 1. Postglacial clay is the dominant deposit in the city and most parts of the modern city center is located on it. Areas of glacial clay are typically found in higher elevation. In Uppsala, the glacial clay is varved with layers of silt, while the postglacial clay is mostly homogeneous and organic content can occur, which makes it a gyttja-bearing clay [1]. In some places, the clay layer is massive with a thickness of almost 100 m [22]. Based on a few sparse precise leveling measurements, a subsidence rate of about 5–10 mm/year in areas located on thick layers of clay have been reported [23]. However, there has been no comprehensive accurate subsidence analysis in this city and no InSAR-generated deformation map exists.
Pile foundation is the dominant foundation type on modern buildings on clay in Uppsala and these building do not subside, in general. Nevertheless, there are a lot of old buildings in the city center that are “floating” on the clay, which means they are not standing on piles and are therefore subsiding in about the same rate as the surrounding ground surface. In Uppsala, different problems caused by subsidence can be observed on several buildings and in Figure 2, some typical examples of problems are shown.

3. Data and Methods

3.1. Sentinel-1 Data Sets

To measure the ground deformation with the PSI technique, C-band Sentinel-1 SLC products from ESA were analyzed. In total, 42 scenes from the ascending pass direction, and 44 from the descending, were used (Table 1). The selected study periods were from March 2015 to April 2019, for the ascending data set, and from June 2015 to April 2019, for the descending data set. The temporal resolution was about one month, with some exceptions. For the winter season, slightly less data was used, due to the snow cover that usually causes poorer coherence. Furthermore, in some periods data were lacking, which changed the intended monthly temporal resolution. The longest period of no data availability was for the descending data set between late October 2015 to early June 2016.

3.2. Precise Leveling Measurements

The consulting company Bjerking AB in Uppsala has established and measured a precise leveling network with many metal pegs (Figure 3) on different buildings in Uppsala city center. These metal pegs on the buildings have not been measured on a regular basis. Some buildings have been measured only at a few occasions but during a very long time (decades), while other buildings have been measured at many occasions during a shorter time (1–2 years). This difference in temporal resolution between different buildings was caused by the request of the property owners for measurements. The precise leveling measurements have been performed between different benchmarks in and around the city. These benchmarks are maintained by the city and are referenced to the official height system, which currently is RH 2000. The absolute heights in the height system of the benchmarks and the metal pegs mounted on building are of no interest in this study though, as only relative movements are important. The precise leveling data collected by Bjerking AB will be used in this study to validate our deformation rates obtained by PSI analyses. According to the precise leveling data from Bjerking AB, it can be assumed that the subsidence rate in Uppsala is linear for the study period (about 4 years).

3.3. Methods

In this study, the PSI analyses were performed in the software SARPROZ, which can do all necessary steps in a PSI analysis and produce time series of deformation [24]. The SARPROZ software has been successfully tested for different applications including urban subsidence studies [25,26,27,28]. SARPROZ can handle data from different sensors, including Sentinel-1. In this study, single-master baseline configurations were used and the pixel selection was based on amplitude stability and temporal coherence [15]. The time series resulting from the PSI analyses were generated for each Permanent Scatterer (PS) point and then compared with the subsidence rates resulting from repeated leveling measurements between metal pegs in areas of great subsidence.

3.3.1. PSI Analyses

In SARPROZ, one PSI analysis was done with the ascending data set and one with the descending. The software automatically downloaded precise orbits for each image, and NASA’s Shuttle Radar Topography Mission (SRTM) with a resolution of 3 arc seconds as Digital Elevation Model (DEM) [29]. Each scene was “clipped” and extracted into only containing an area of about 32 km2, covering central Uppsala, seen in Figure 1. The master image in each analysis was automatically selected by the software. The single-master interferogram formations by the SARPROZ software are shown in Figure 4.
The weather at the date of the chosen master images were controlled at CELSIUS weather observations, to see that there was no precipitation or snow cover for the chosen dates [30]. Co-registration was then performed in the software.
The data sets were geocoded manually through a Ground Control Point (GCP) that could be identified in both the reflectivity map, produced by SARPROZ, and in an ordinary satellite image, and in this case, Google Earth was used. The GCP was chosen on an isolated object of high reflection in an area that otherwise had low reflectivity, which made it easier to identify the specific object that was used as the GCP. The same GCP was used to geocode both the ascending and descending data sets.
The atmospheric phase component was estimated in the location of the Permanent Scatterer Candidates (PSCs), which were selected based on the Amplitude Stability Index (ASI), with a threshold value set to 0.8 [15], which correspond to a Dispersion of Amplitude (DA) of 0.2. The DA (or the ASI), are efficient parameters in choosing pixels with low phase standard deviation, if the DA is lower than 0.4 (ASI higher than 0.6) [31,32]. In the atmospheric phase component estimation, the displacement was set to be linear for all points. The arbitrary reference point with the assumption of the zero velocity was chosen on a relatively new building situated on top of the esker, for both the ascending and descending analyses, and can be seen in Figure 1.
The final multi-temporal analyses generated time series of deformation in the location of the PSs, which were selected based on two parameters: the ASI and the temporal coherence. To be selected as a PS in this study, the pixel had to have an ASI of at least 0.64 (DA less than 0.36) and a coherence of at least 0.70. The ASI threshold was set to a lower value than in the selection of PSCs, so that a sufficiently large amount of PSs would be selected for analyses. After the selection of PSs, they were geocoded and exported from the software and transformed to PS points.

3.3.2. Correlation between Subsidence Zones and Quaternary Deposits

Since the deformation maps resulting from both ascending and descending analyses had similar subsidence rates, we only focused on one of them and used the ascending PS points for further geological analysis. The ascending PS points and their annual displacement rates were analyzed based on the near-surface geology at the location of the points. As such, differences in displacement rates between deposits could be analyzed. The PS points were visualized together with the quaternary deposits map from the Geological Survey of Sweden [21] (Figure 1), as a base layer, for a visual interpretation.

3.3.3. Validation of the Results with Precise Leveling

Buildings that had generated one or more PS point from both the ascending and descending analyses, and that had also been measured with precise leveling in an adequate way, were identified and considered as possible validation objects. From the many metal pegs mounted on the foundation, the most representative peg was chosen for each PS point on a building. This was done by looking at which part of the building had radar reflection generating a PS point, and then identify the representative metal peg. Validation object 1 is used as an example in Figure 5 to show how the pair points were chosen. A PS point together with a representative metal peg was called a validation pair. The distances between the selected metal pegs and the corresponding PS points were a few meters (shown in Figure 5) and the old building for this comparison was about 15 meters high. To assess if precise leveling measurements for objects were adequate, which mean they could be compared with PSI measurements, the time span of the precise leveling measurements were analyzed. If leveling had occurred within the time span of the PSI analysis, or during a very long, precise leveling measurements were considered adequate. Furthermore, validation objects were only selected in areas of great subsidence, which had PS points with a relatively higher subsidence rate ranging between 3 to 6 mm/year. However, as we said before, for validation of our results, we were restricted to only those PS points that had the nearby metal pegs, which had been measured with precise leveling and could provide a reliable displacement rate.
The movements of all PS points from the PSI analysis are in respect to one stable reference point on the esker, while movements measured in precise leveling (on metal pegs) are in respect to a specific benchmark, and these benchmarks could be moving in respect to the very stable PSI reference on the esker. To overcome this problem of relative movements, another requirement had to be fulfilled for possible validation objects to become a validation object. This was that the part of the building, in which the benchmark was mounted, that had been used in the precise leveling measurement, for an object, was represented by a PS point. Consequently, in the validation of the PSI, there had to be PS points representing both the benchmark and one or more metal pegs on the object, so that a relative movement for validation with the precise leveling could be generated. This relative movement of a PS point was generated by taking the time series values of the PS point representing the metal peg and subtract them with the one representing the benchmark.
All movements measured in the PSI analyses were in the direction of Line-Of-Sight (LOS), while movements measured in precise leveling were vertical. To do a comparison between the two techniques, the movements measured in the PSI were transformed to vertical, according to Equation 1, where m v was the movement in the vertical direction, m L O S was the movement in the LOS direction and i was the incidence angle. By doing so, it was assumed that all movements taking place at an object were vertical. If horizontal movements existed at an object, this would be seen in differences between the ascending and descending analyses. The ratio between a length in the LOS direction and in the vertical direction was 1.28 for the ascending analysis (incidence angle = 38.8°) and 1.20 for the descending analysis (incidence angle = 33.3°).
m v = m L O S / cos i

4. Results

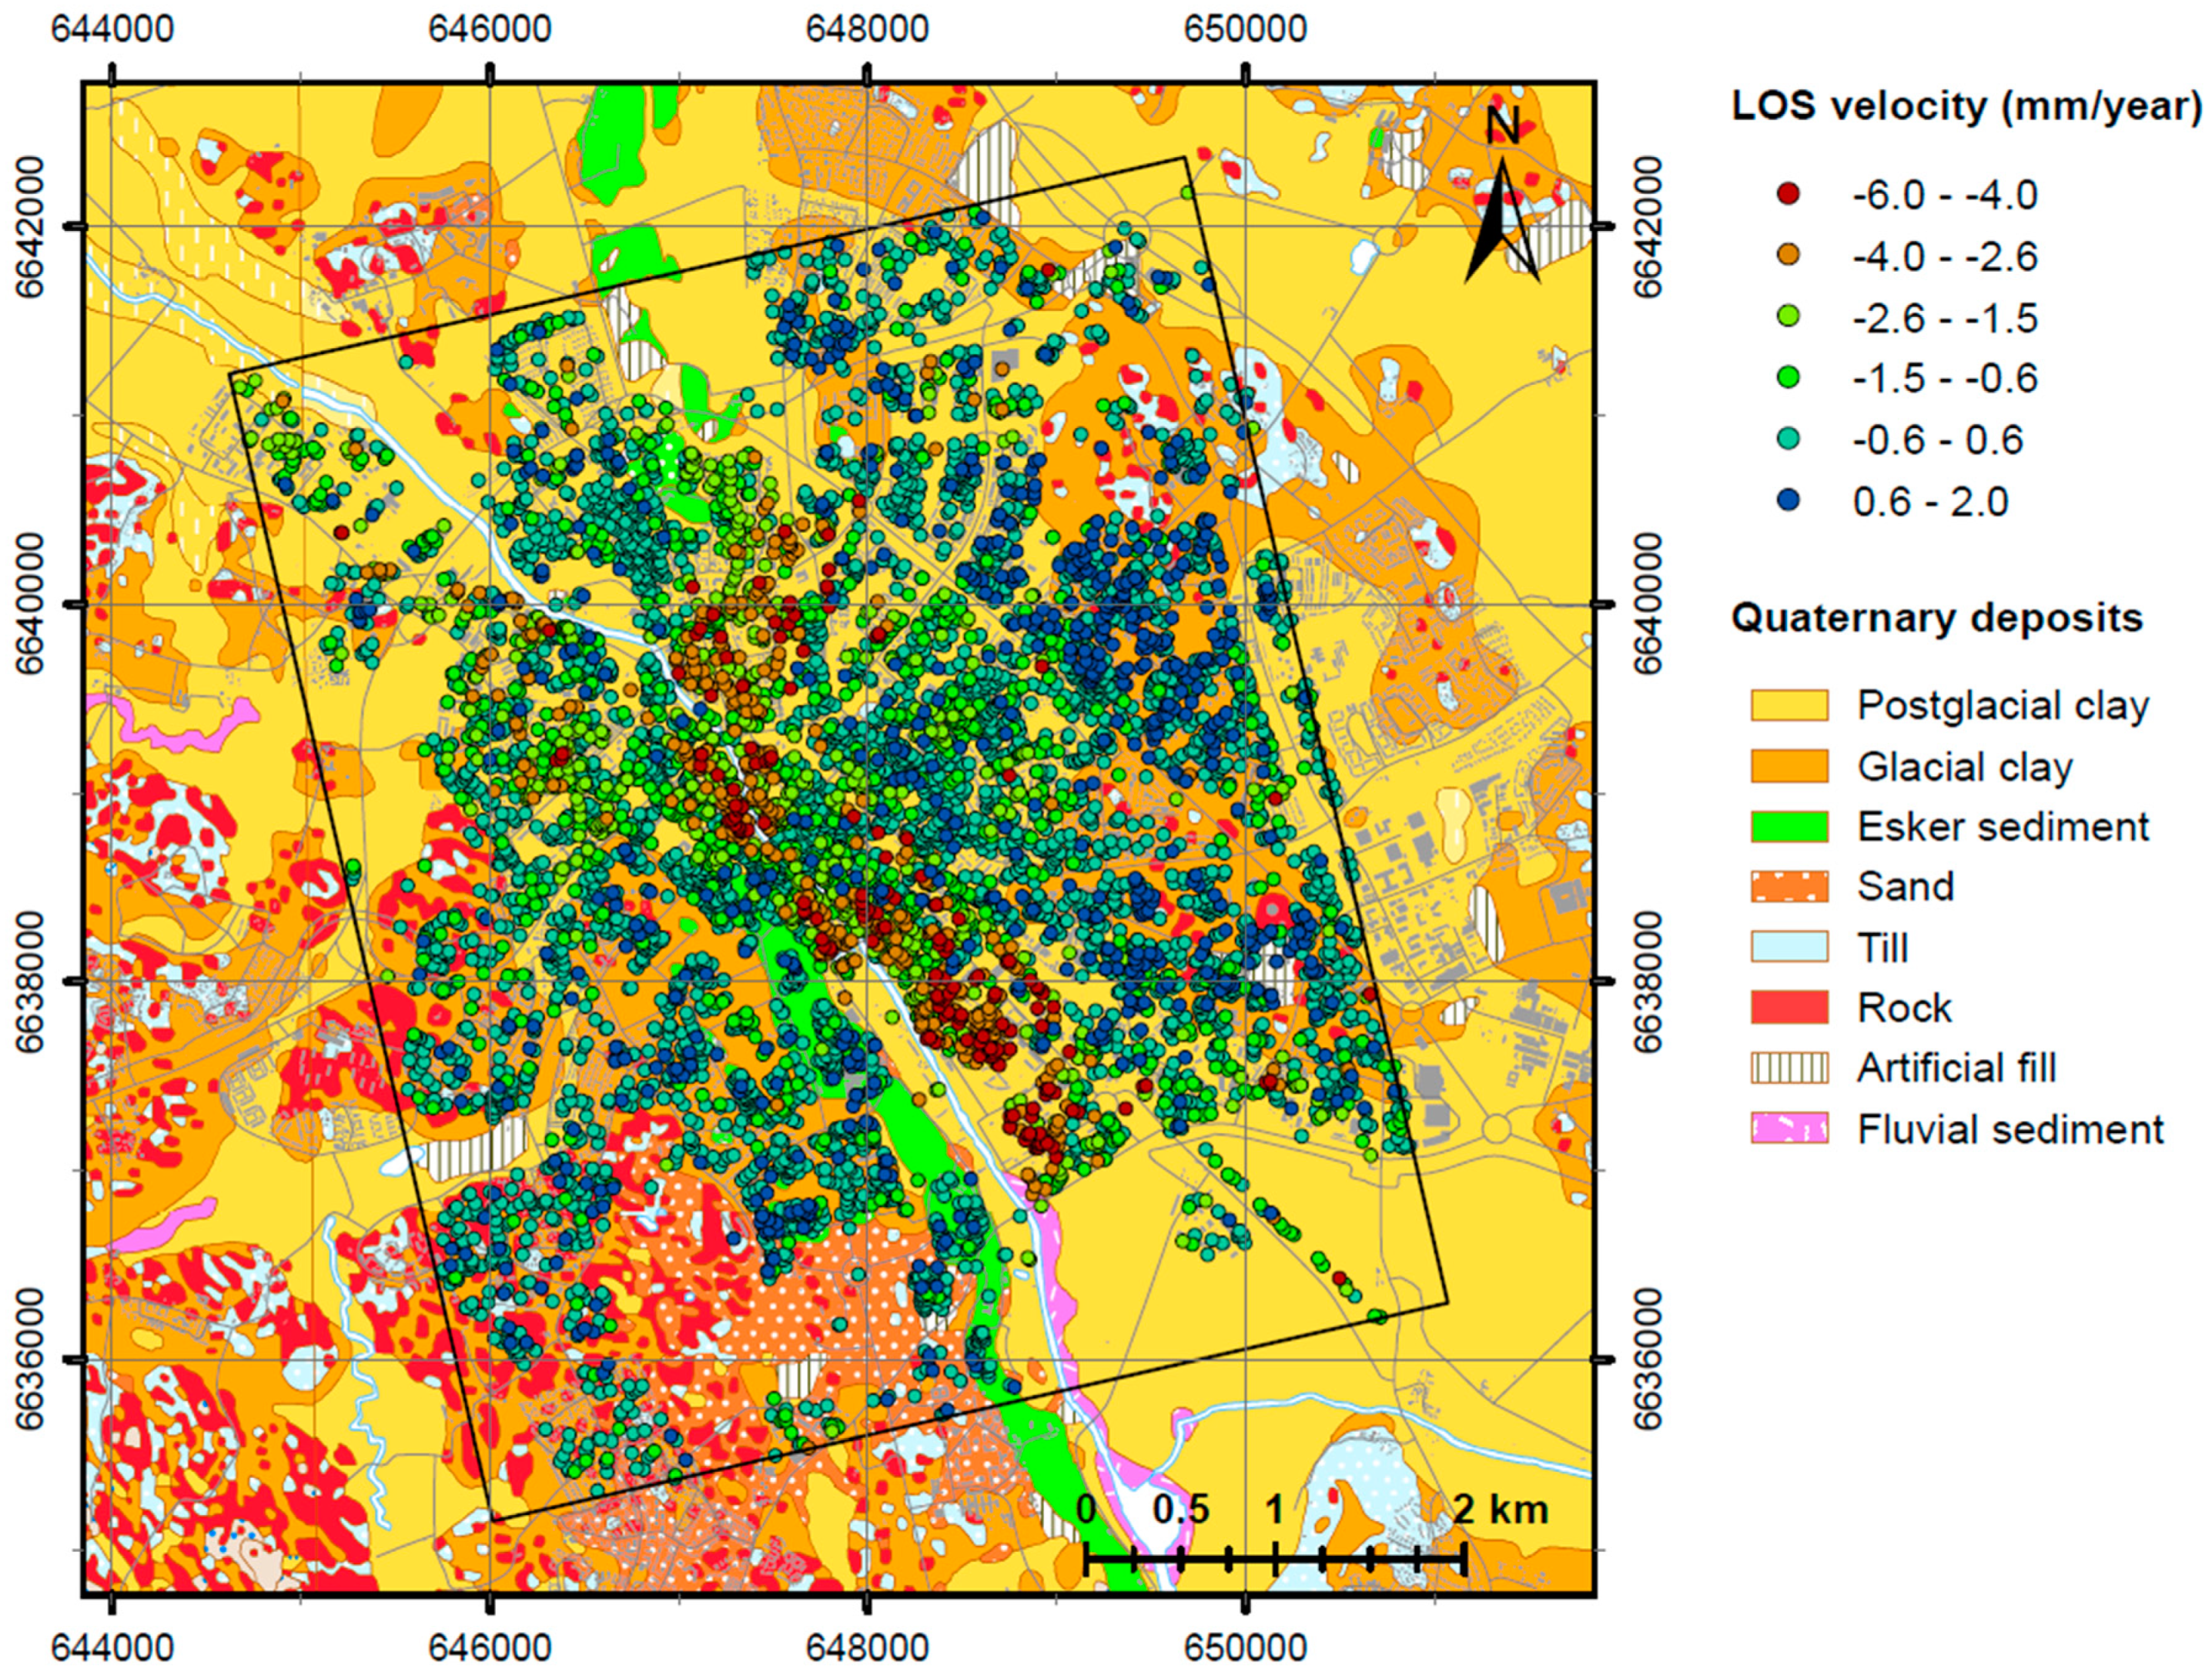
In our analysis, PS points in the multi-temporal analyses, were selected to have an ASI higher than 0.64 and a temporal coherence higher than 0.7. This resulted in about 6 900 PS points for each analysis (ascending and descending data sets), which equals to about 215 PS points/ km2 in the whole study area. In the urban area, the density of PS points were higher, with about 750 PS points/ km2 for both analyses. With only a few expectations, buildings were the only kind of object resulting in PS points. The maps, which show the analyzed PS points locations, for the ascending and descending analyses, are shown in Figure 6.
The results from the two analyses showed a good agreement. The two independent ascending and descending data sets identified the same two major areas of great subsidence, where the cumulated displacements were up to about 25 mm in 4 years in the LOS direction, and they could be observed just southeast and north of the city center (Figure 6). With respect to the reference point, chosen for PSI analysis, there were significantly more PS points of negative movements (away from the SAR sensor), than of positive (towards the SAR sensor), for both the ascending and descending analyses, and the displacement rates in the LOS direction were found in the range between −6 mm/year and +2 mm/year. The resulting PS maps and their rates indicted that the city of Uppsala has been subsiding in many areas at least in this 4-years period.
It is also important to note that PS points with a relatively fast rate of subsidence, between 3 to 6 mm/year, were observed close to or along the railway in the southeastern part of the study area. This suggests that a segment of about 3 km of the railway, observed in our study area, has been deforming in this period (Figure 6).

5. Discussion

Our PSI analyses of 4-years Sentinel data showed that a big part of the city is subsiding with up to 6 mm/year in the LOS direction. The distribution of this deformation is not homogenous and the maps of the PS points (Figure 6) appeared somehow speckle in the areas of great subsidence, with points of high subsidence (red) mixed with more stable points (green and yellow). This raise the question if the subsurface deposits influence the ground surface subsidence. However, part of this heterogeneous deformation could also be explained by different foundation types among buildings in the same area, where buildings standing on piles being more stable than non-piled buildings, which subside in about the same rate as the surrounding ground surface.
In the following sections, firstly the deformation maps generated by SAR analysis is compared and correlated with the quaternary deposits map and then the results are validated with precise levelling measurements.

5.1. Correlation between Subsidence Zones and Quaternary Deposits

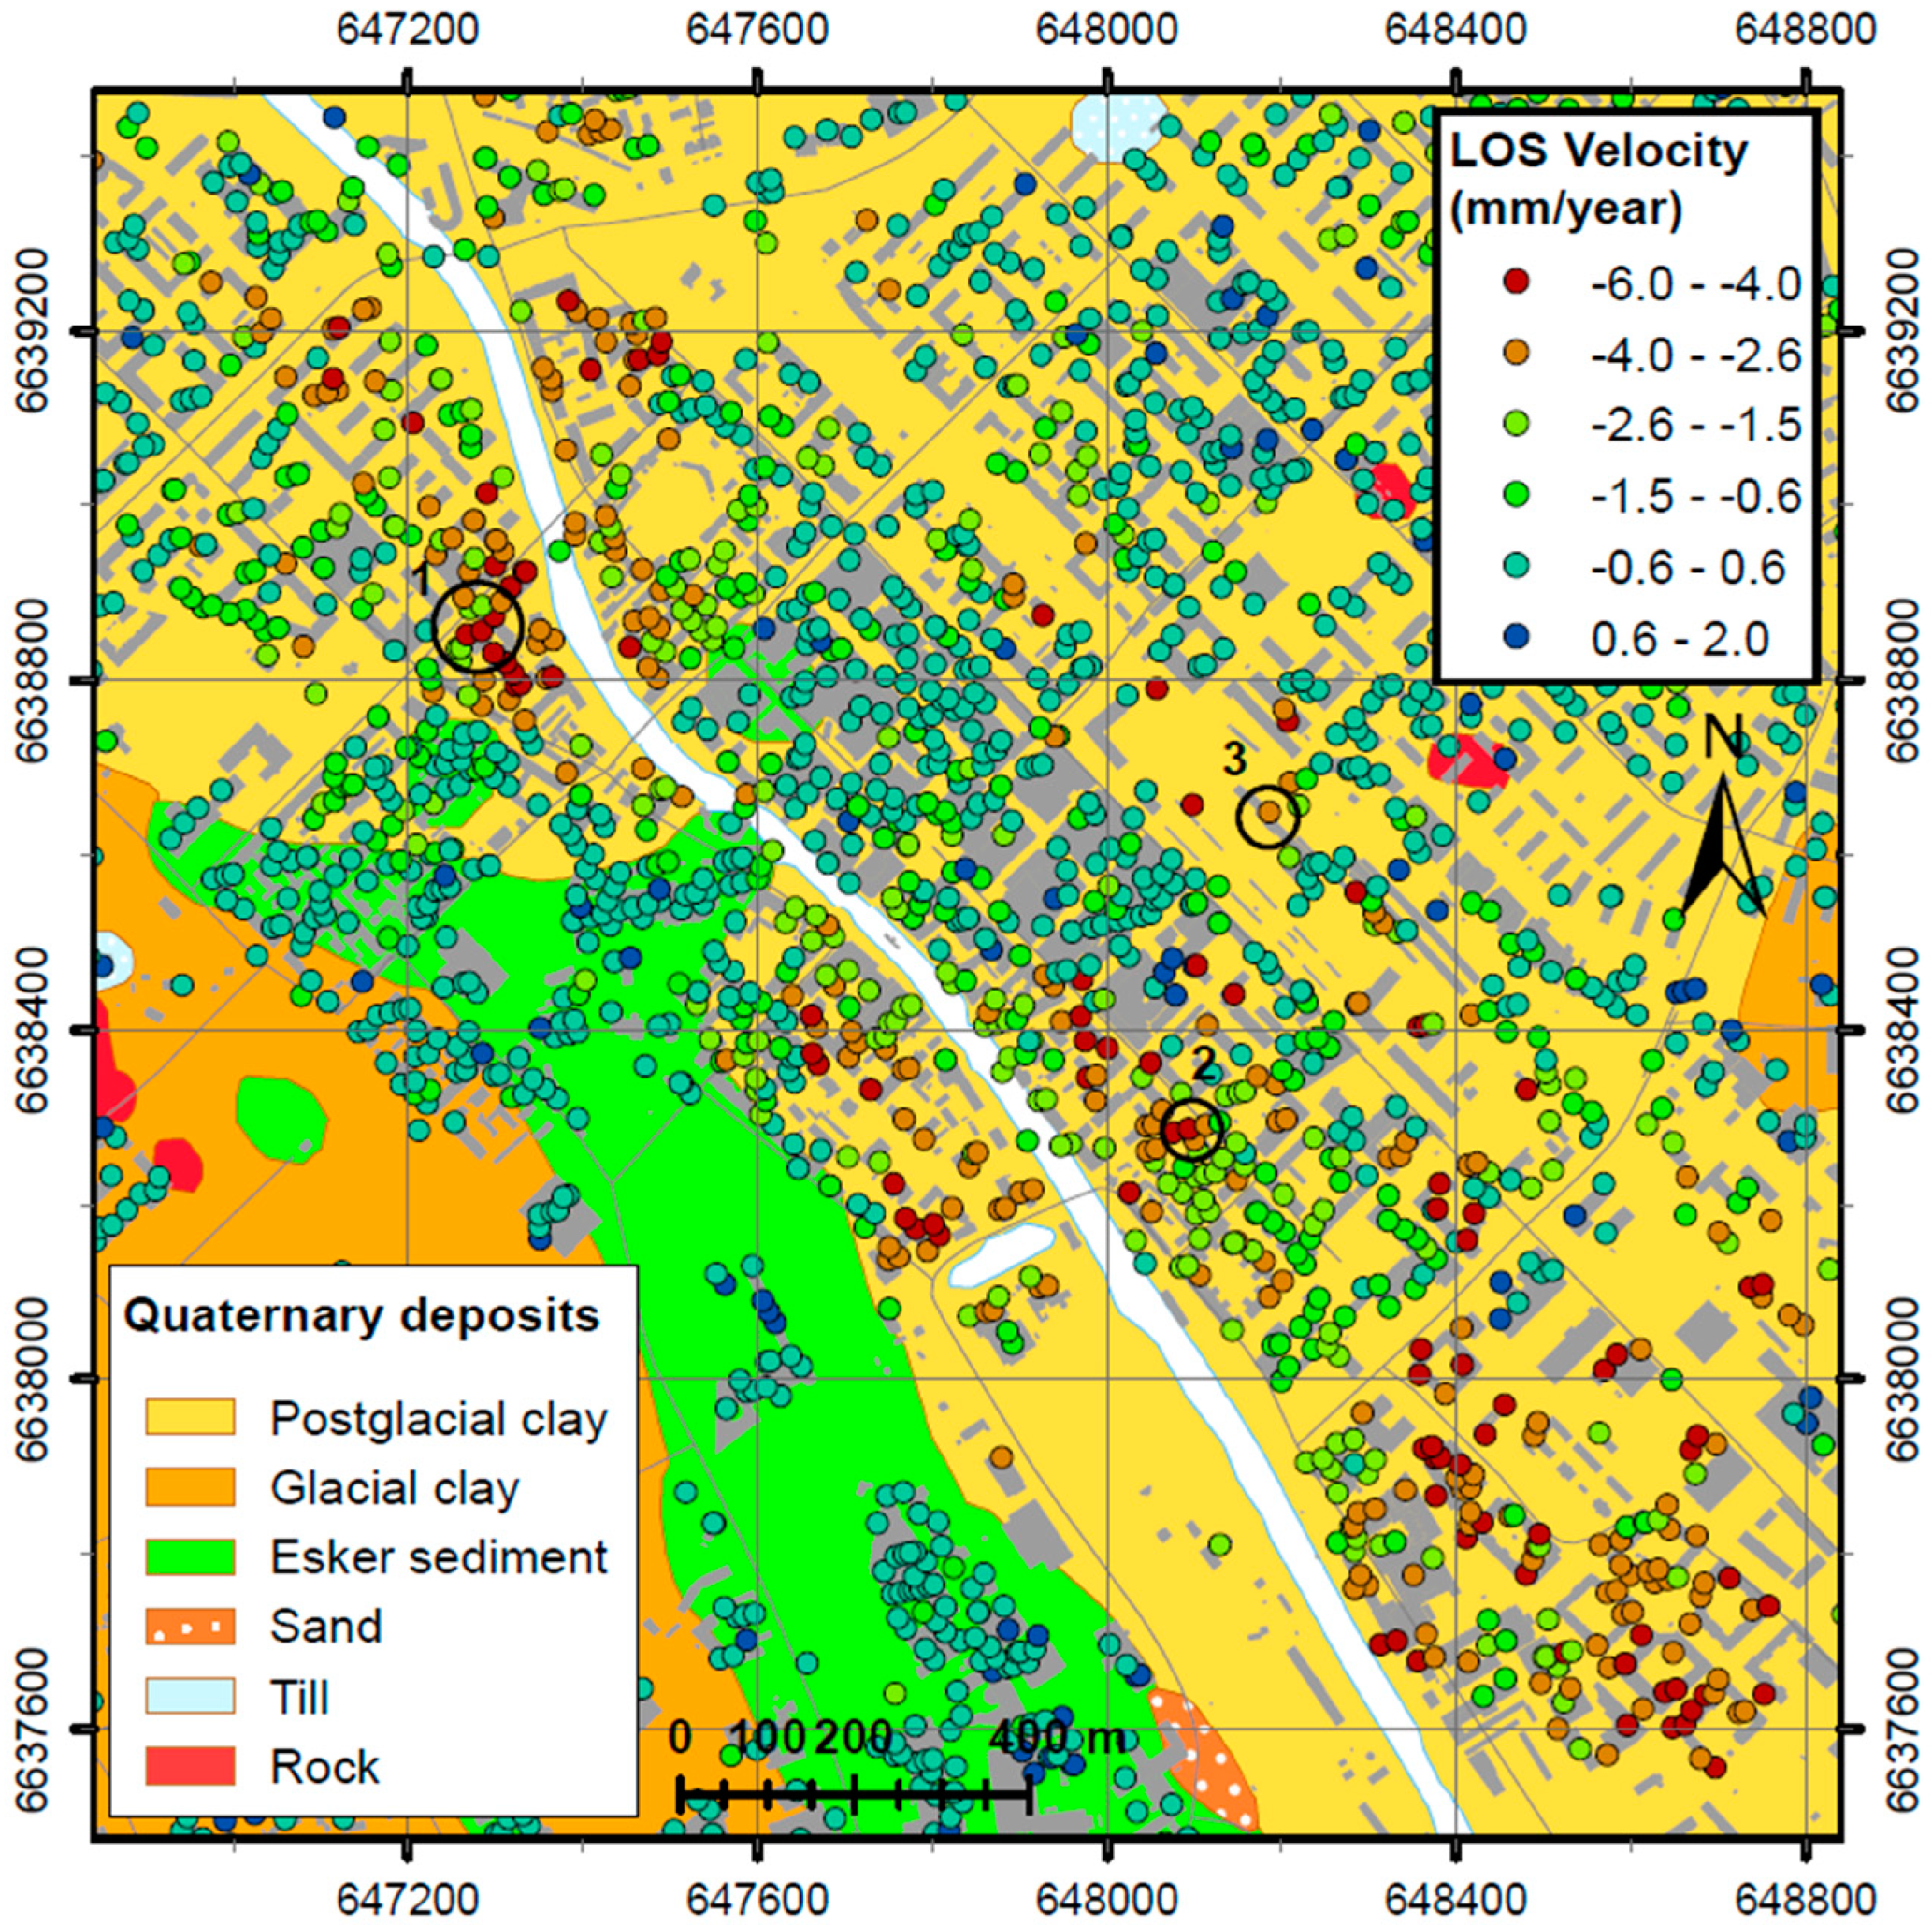
The ascending PS points were analyzed based on the quaternary deposits map, to see how different deposits affect the displacement. In Figure 7, a map of these PS points is shown with the quaternary deposits map as background. It appears that in the areas of great subsidence, the deposit consist of postglacial clay. It also appears that buildings located on other deposits are significantly more stable, even those on glacial clay.
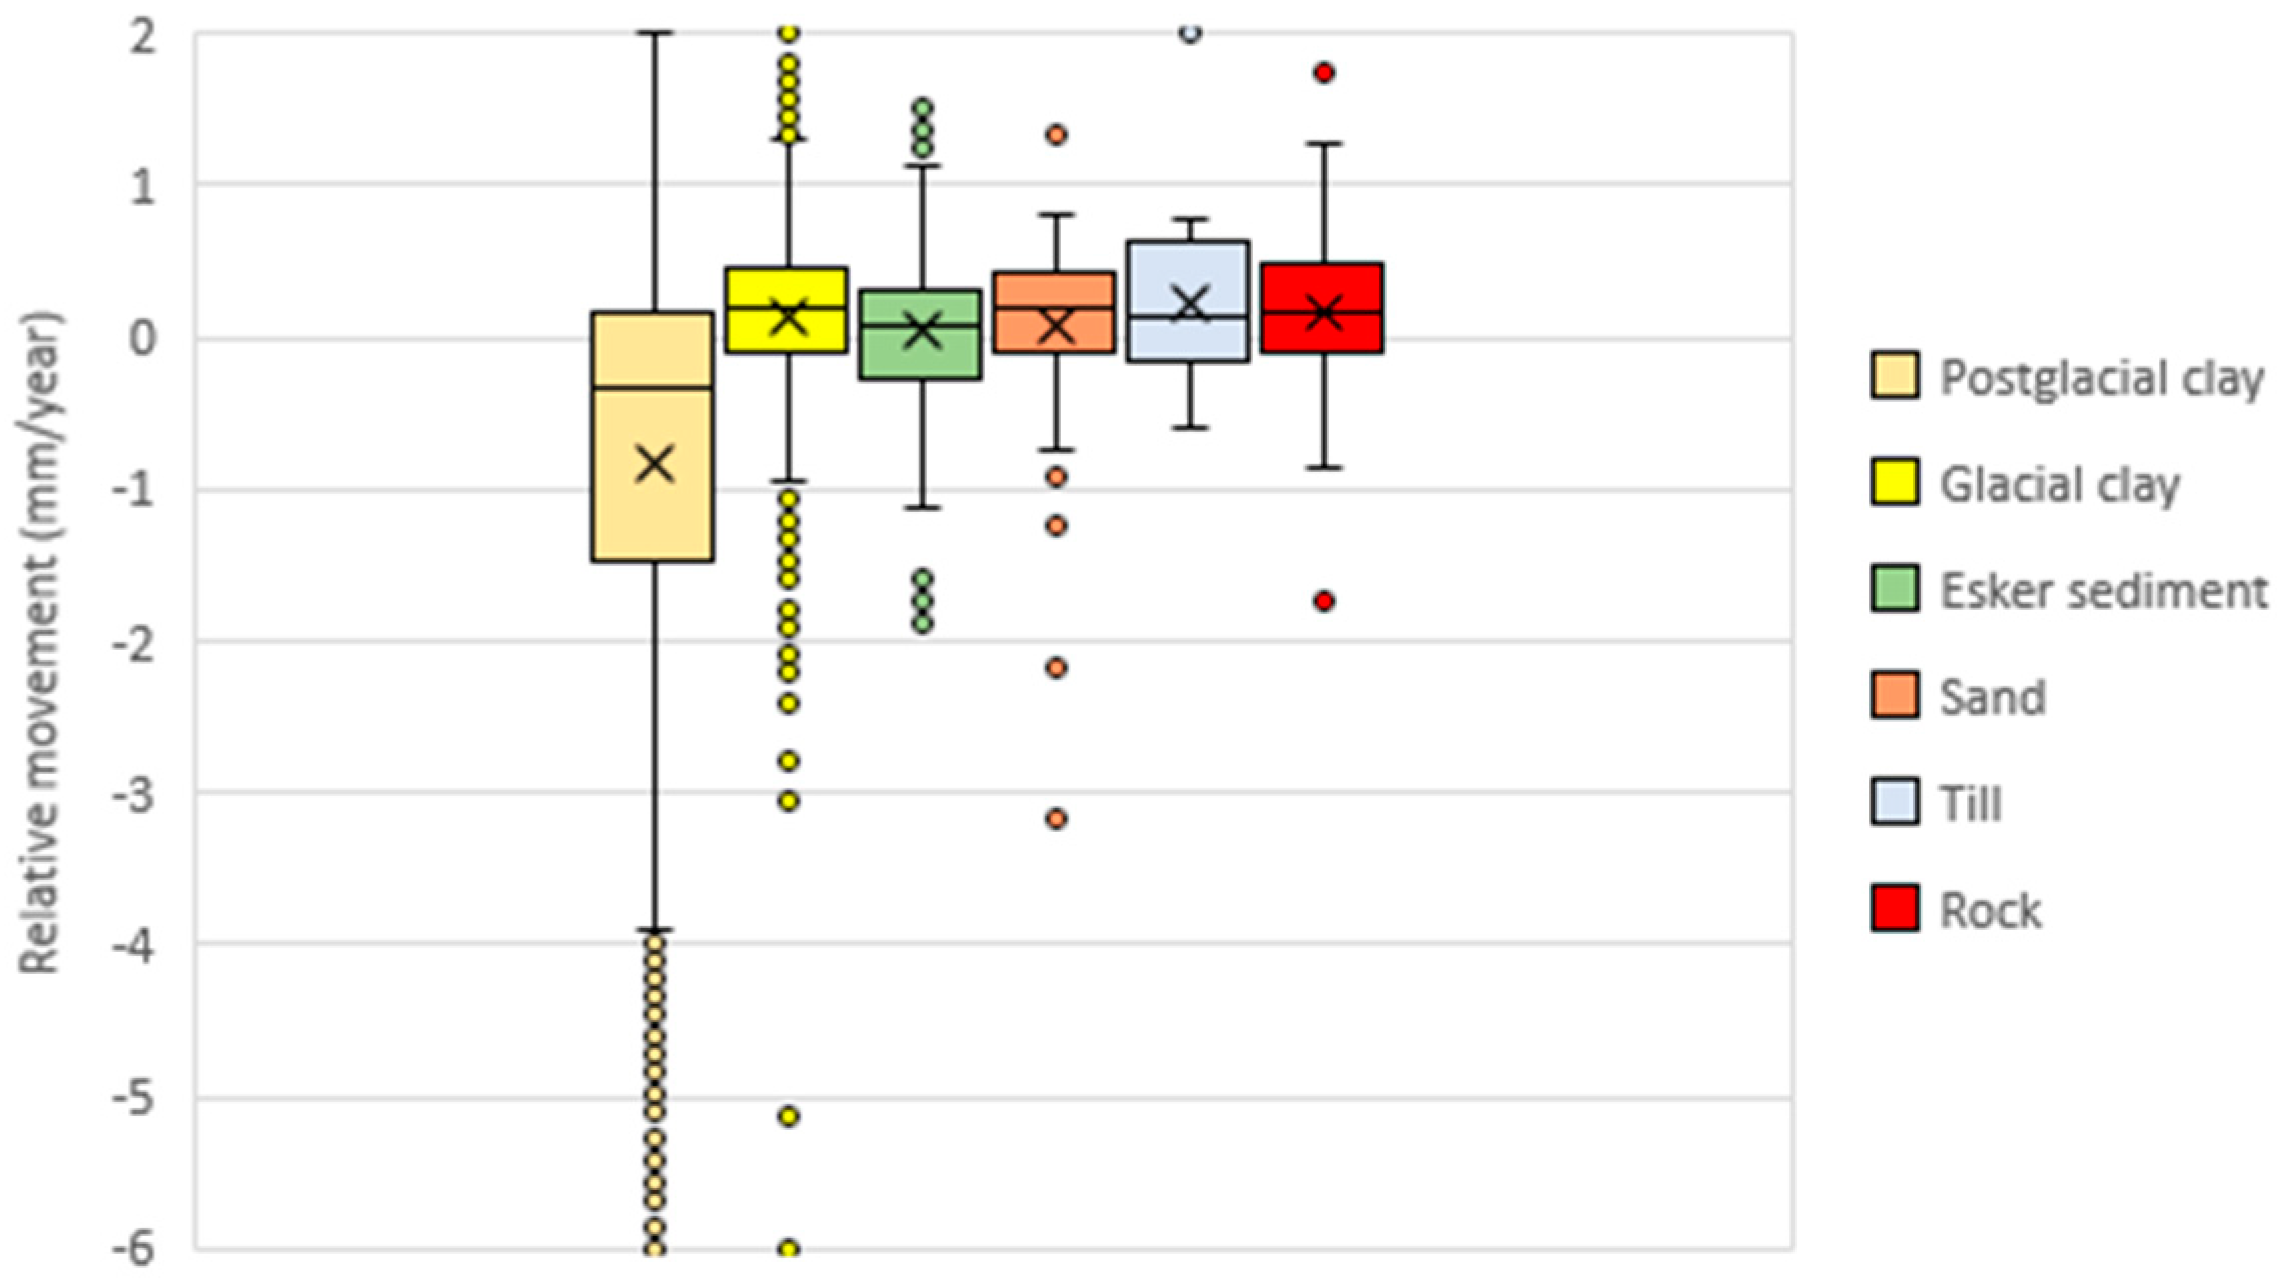
Tor make further detailed analysis, the PS points were grouped based on the near-surface deposit under the point and then visualized in a box plot, which can be seen in Figure 8. The PS points on the esker had a median and mean value very near zero and the variation was equally great on the negative and positive side. This was expected, as the reference point with zero velocity was placed on a building on the esker. All quaternary deposits except postglacial clay had a similar distribution of the PS points’ movement, as the mean and the median were near zero and the mid 50 % values (between the first and third quartile) were all found between −0.3 and +0.6 mm/year. The only deposit that stood out was postglacial clay, where the mid 50 % values were found between −1.5 and +0.2 mm/year and where there existed significantly more high negative values.
It is interesting to note that the buildings located on postglacial clay subside significantly faster than those on glacial clay (Figure 8). Glacial clay is older than postglacial clay, which means that the subsidence rate caused by creep should be lower [5], and glacial clay is usually found in higher elevation and is not as deep as postglacial clay, and clay depth is tighly correalated with subsidence rate. Furthermore, the glacial clay in Uppsala has silt layers, which makes it less prone to subside at an equally rapid rate.

5.2. Validation of the Results with Precise Levelling

The subsidence in the study area can be a result of both primary consolidation, which is caused by an increasement of the effective normal stress (from additional loads for instance), and secondary consolidation (creep), which is a natural process caused by time [33,34]. Clay subsidence is highly affected by the consolidation, which is caused by the very low drainage rate in clay and have important consequences like gradually generated deformations that can take a very long time to be fully created [35]. The consolidation process, and therefore clay subsidence, is of a non-linear nature, as the deformation rate decreases through time. If considering a relatively short time (about 10 years), the deformation rate caused by creep will not change considerably, as this has occurred during a very long time [33]. In Uppsala, most areas are mature, which make them more likely to be affected by creep and not very much of primary consolidation. Because of this, even a few, or rather old, measurements from precise leveling can contribute significantly in validation of our InSAR results and also to check if the ongoing subsidence, detected by InSAR for 4-years period, has had the same trend in the past where leveling measurements are available.
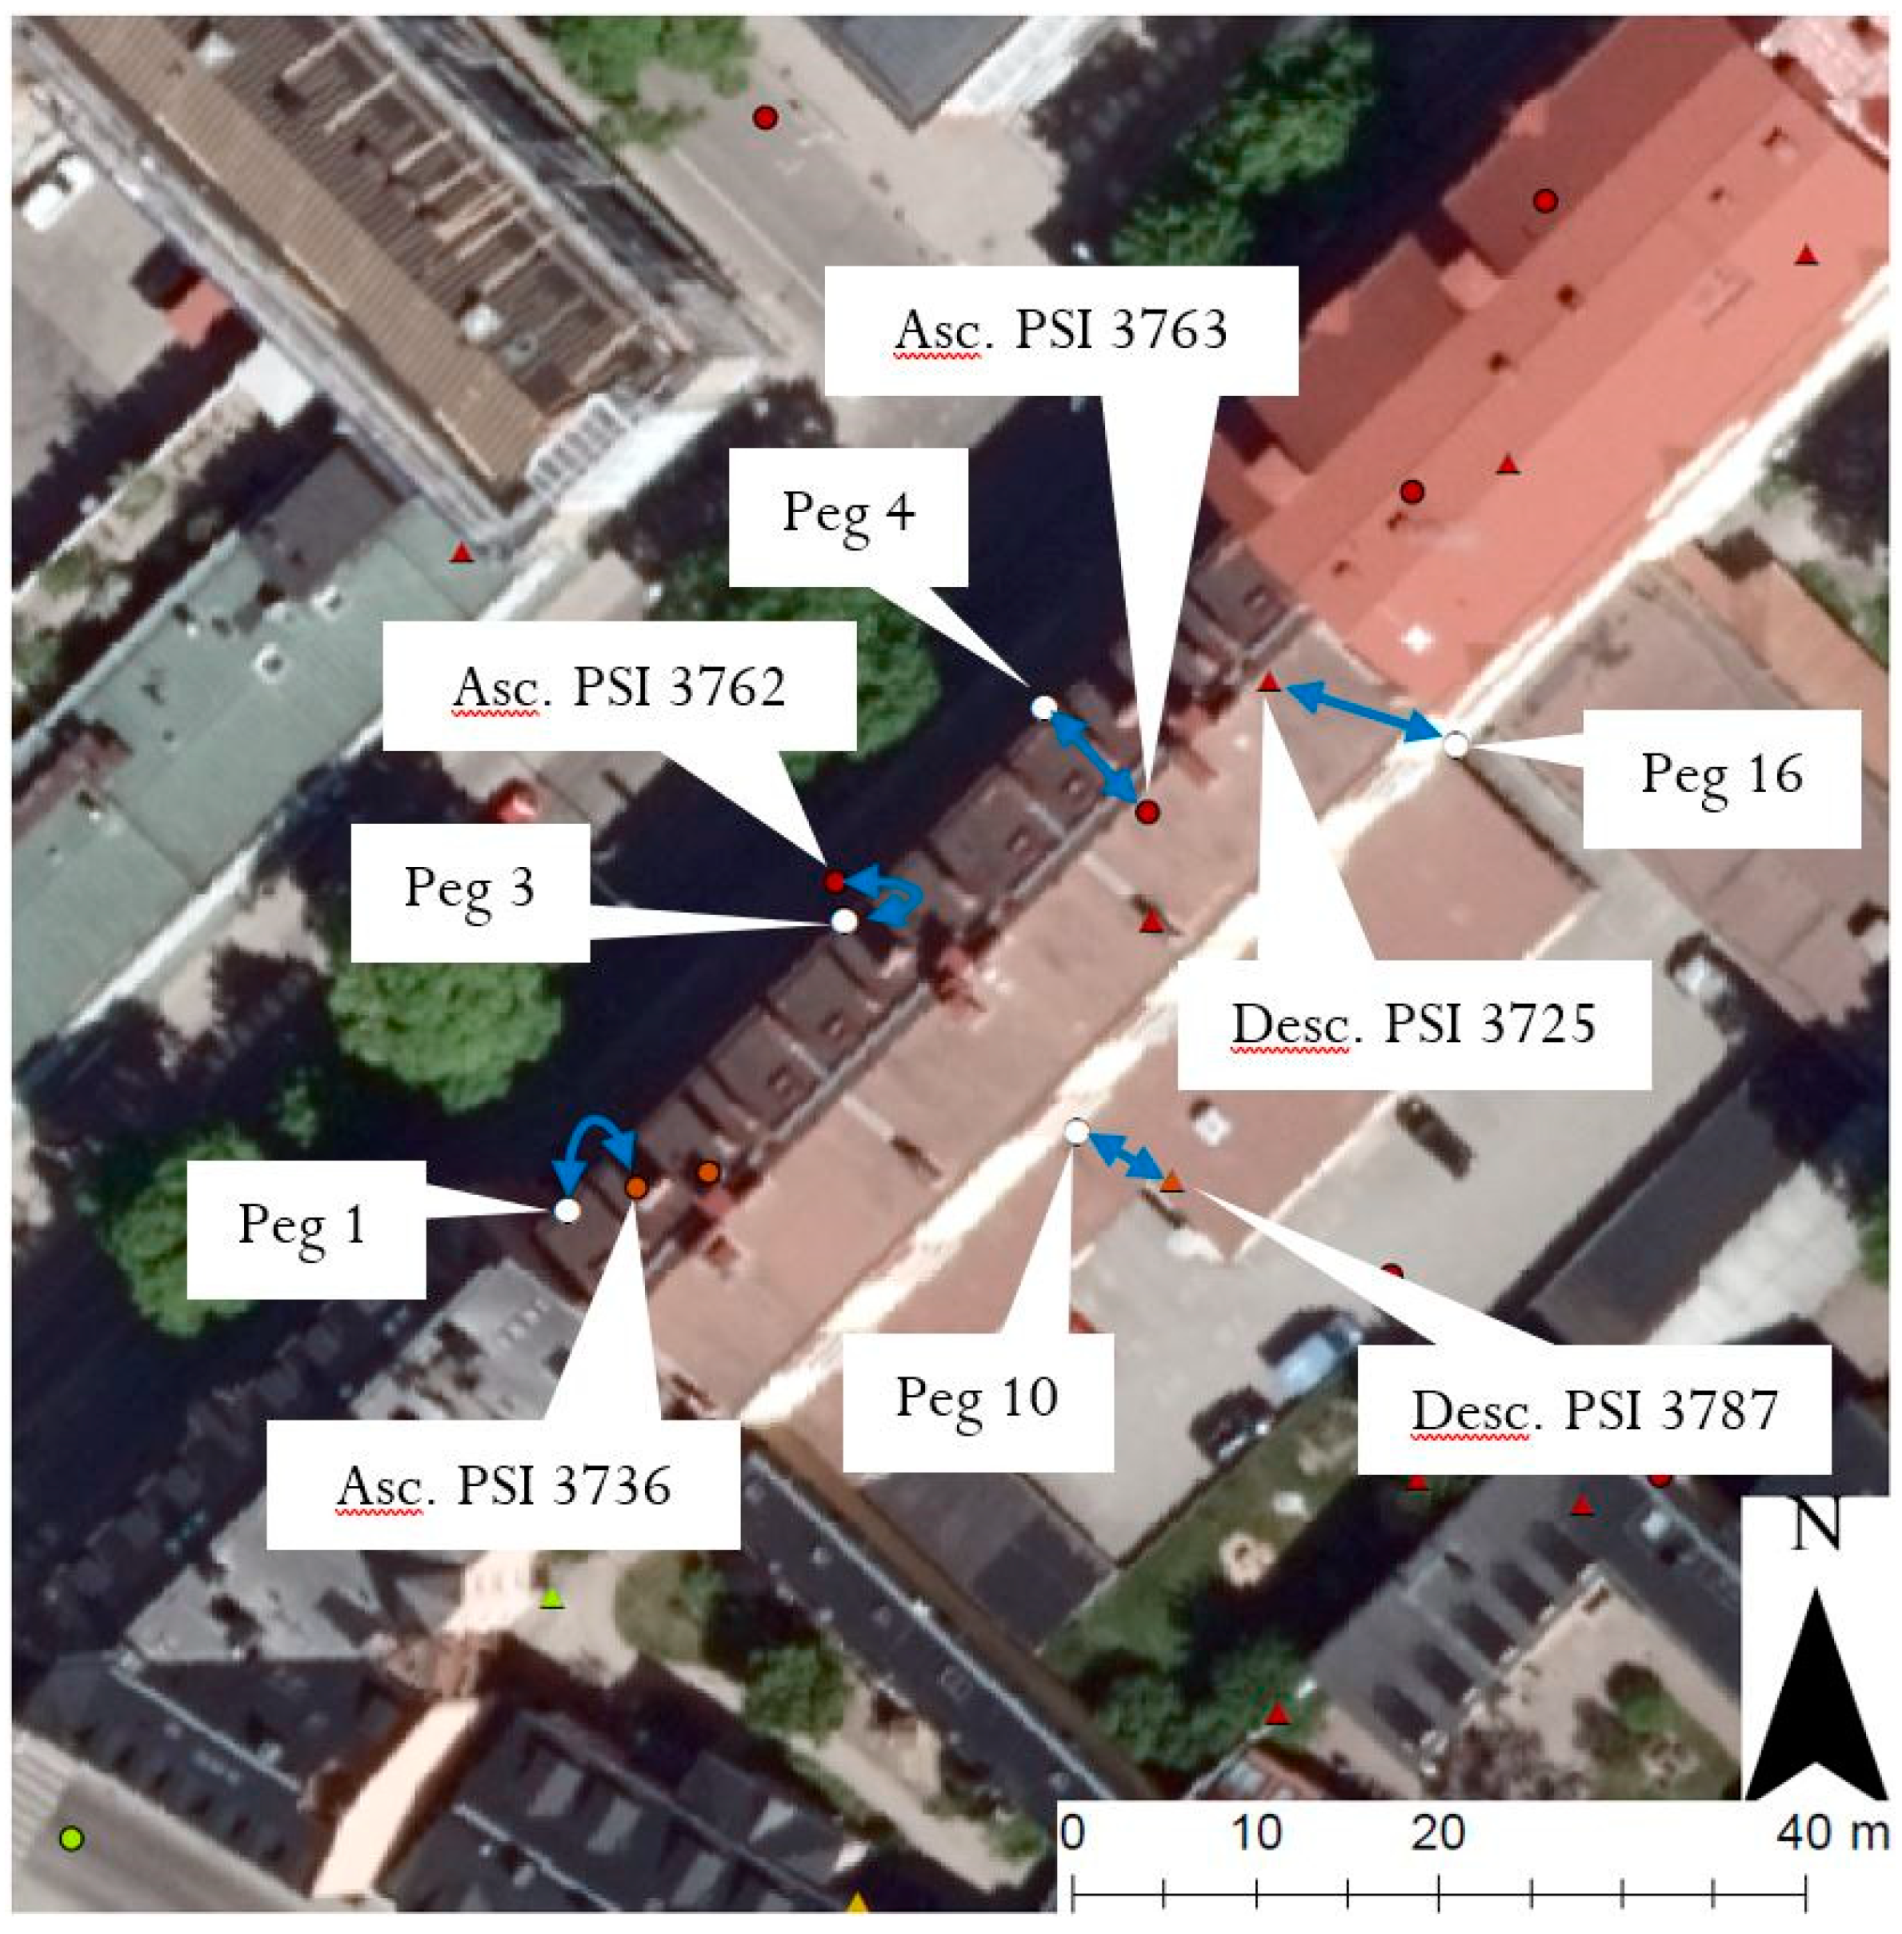
Uppsala city center is located on varying near-surface geology, with the esker and the deep clay that are found relativelly close to the esker in some places [22]. This was seen at the displacement rates of the PS points, where small displacements were observed on the esker and relatively big displacement rates were seen relatively near the esker in some places. Figure 9 shows a large scale map of the city center only, where differences in displacement rates in rather small areas, which can cause uneven settlements of buildings, can be observed. For validation of the results, three validation objects were identified in areas of rather great subsidence, which had PS points with a relatively higher subsidence rate ranging between 3 to 6 mm/year, and their locations can be seen in Figure 9. In these three validation objects, in total ten validation pairs were identified, where six were from the ascending analysis and four were from the descending.
Validation object 1 was a building located in an area where the clay depth is rapidly increasing in the northeast direction [22] and therefore, the building is subsiding unevenly, with about 3 mm/year in the southwest part and about 6 mm/year in the northeast part, according to the precise leveling. Three validation pairs from the ascending analysis and two pairs from the descending could be identified. The metal pegs have been measured with precise leveling several times between 2005 and 2018 but only the two latest measurements, in July 2013 and October 2018, were used when the displacement rates were calculated.
Validation object 2 was a building located in an area of rather high subsidence and according to the precise leveling, the building is subsiding with about 7.5 mm/year. Two validation pairs from the ascending analysis and one from the descending could be identified at this object. The metal peg used in the descending validation pair (peg 29), was also used in one of the ascending validation pair. The metal pegs have been measured with precise leveling four times between 1998 and 2015 but only the two latest measurements, in May 2005 and September 2015, were used when the displacement rates were calculated.
Validation object 3 was the old station building at the railway station. One validation pair from the ascending analysis and one from the descending could be identified at this object and the same metal peg was used in both validation pairs. The metal peg has been measured with precise leveling in May 2017 and January 2018 and the displacement rate was calculated for this period.
In Figure 10, the validation pairs from all three objects are shown, where the time series of the PS points and their corresponding validation metal pegs are aligned, for a visual comparison. The displacement rates for the PS point time series and metal pegs in all validation pairs are shown in Table 2. In Figure 10 and Table 2, the movements of the PS points have been transformed to the vertical direction and are relative to the PS point representing the benchmark, for a fair comparison.
According to Table 2, the difference in displacement rates between the PS points and the metal pegs (precise leveling - PSI) in all validation pairs were rather small and in the range between −0.9 mm/year and 0.9 mm/year, which also can be seen on the trend lines in Figure 10. The mean of the differences was 0.00 mm/year, while the RMS of the differences was 0.58 mm/year. At validation object 1, the differences were in the range between −0.3 mm/year and +0.5 mm/year. Because of the small difference, the uneven subsidence of the building could also be seen with the PSI technique at object 1. At validation object 2, the differences were in the range between −0.9 mm/year and 0.9 mm/year. One of the ascending PS points was underestimating the subsidence rate, while the other one overestimated it. The descending PS point was underestimating the subsidence rate. The two PS points that had peg 29 as validator (one ascending and one descending) did both underestimate the subsidence rate. At validation object 3, the differences were in the range between −0.7 mm/year and +0.3 mm/year. The ascending PS point was overestimating the subsidence rate, while the descending PS point was underestimating the subsidence rate.
The standard deviations of the time series were found in the range between 1.2 mm and 3.3 mm. This difference is caused by different coherence of the PS points at the metal pegs and by different coherence at the PS points representing the benchmark, which were different for different validation objects and analysis (ascending or descending).

5.3. Limitations and Uncertainties

There are many natural and anthropic factors that play a role in land subsidence which takes place at different spatio-temporal scale [36]. However, the determination of the contribution of each factor needs several sources of in situ data, which were not available for this study. We only focused on subsurface deposit types and interestingly found a very good correlation between them and the upper surface deforming zones.
In the validation of the PS displacement rates with precise leveling data there were several uncertainties involved. The identification of validation pairs was not straight forward, because of the limited spatial resolution of the PSI analysis (about 3 m in range and 22 m in azimuth). As such, it was not obvious which part of a building that was the main reflector. Furthermore, the PS points were georeferenced to the earth surface, but buildings are 3D objects and the satellites are looking at the earth from the side. These factors had to be considered when analyzing the PS points on the buildings. The issues stated above are extra important to consider in areas where the displacement rate can vary rather fast in a small area, for instance where the geological properties are changing rapidly, or on buildings that are tilting. The geocoding of the SAR data sets was also a source of uncertainty due to the relatively low spatial resolution of C-band Sentinel-1 data. Other uncertainties are, for instance, the assumption of no horizontal movements and that metal pegs were mounted in buildings’ foundation, while PS points in general probably were caused by roof reflection. The impact of uncertainties is not as big in areas of uniform subsidence with buildings that are not tilting, or if only a general knowledge of subsidence is interesting and not building-specific movements. Nevertheless, our PS analysis showed a rather good agreement with precise leveling data despite these uncertainties.
Unfortunately, the temporal resolution of the available precise leveling data for metal peg was not consistent. They have not been measured on a regular basis and the occasion of measurements differed between the validation objects. At object 2, for instance, the displacement rate was calculated between the two latest measurements in 2005 and 2015. This displacement rate can differ to the one in the period of the PSI analyses (2015–2019). Nevertheless, the displacement rate should not change very much between the two periods and the validation here is therefore adequate. At validation object 3, precise leveling have only occurred for eight months, which makes this object less reliable. However, this object is undergoing great subsidence and that is why this object is used despite the short time it has been measured.
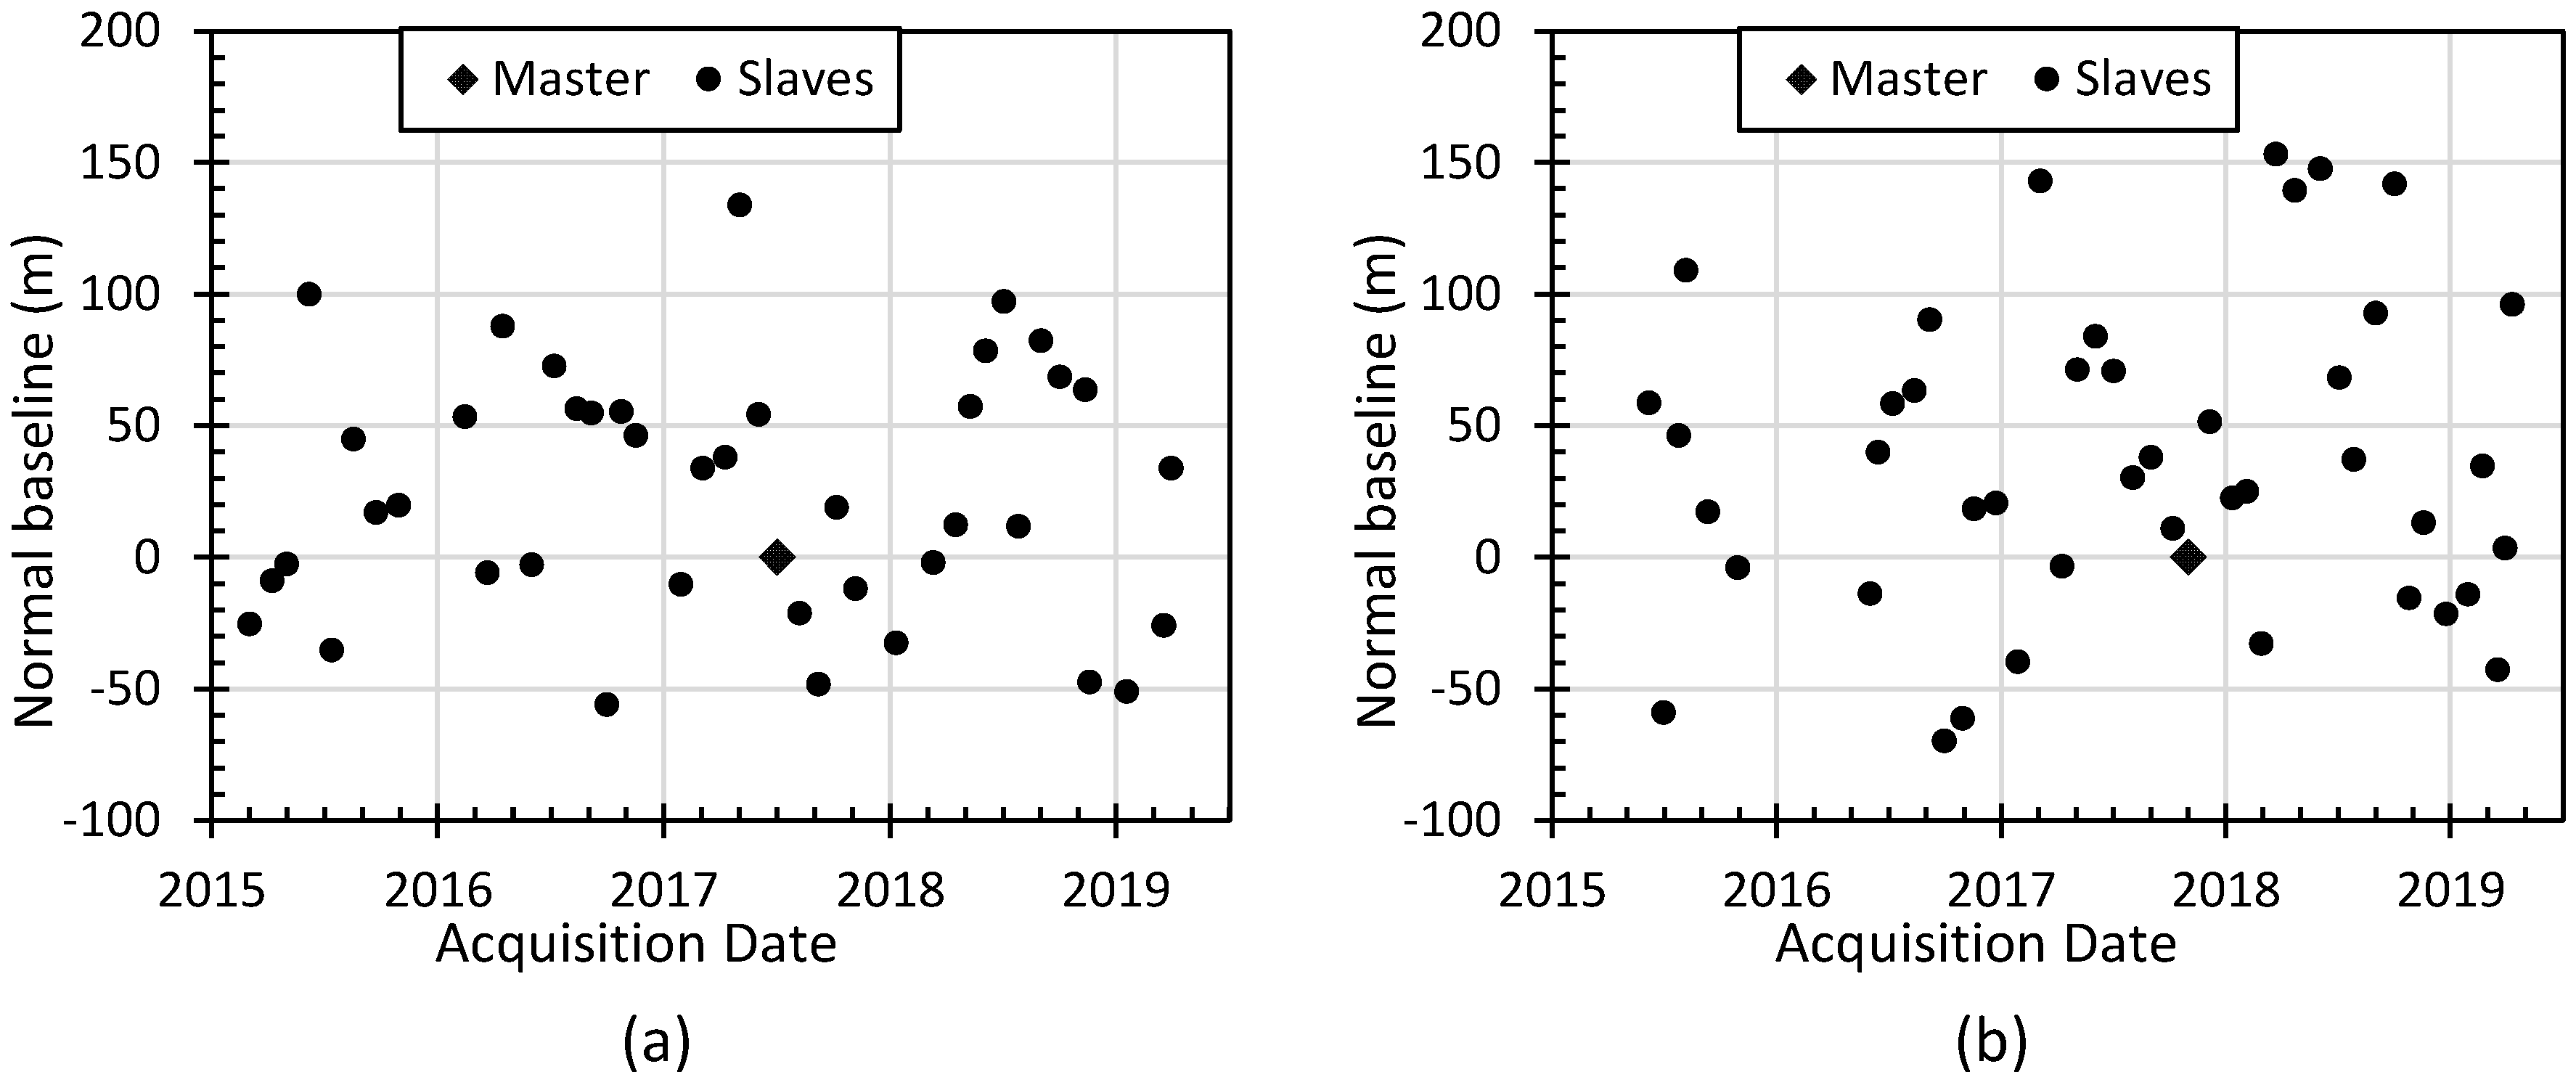
A result of the atmospheric phase estimation in SARPROZ was the image-to-image coherence between the master and each slave. In the two analyses (ascending and descending), nine images had a significantly lower image-to-image coherence. Seven out of these nine images were acquired during the four winter months (December to March). This indicates that winter-conditions, with snow and ice, have a negative impact on the quality of the SAR images, which should be considered when deciding the downloading data.

6. Conclusions

Our study, once again, reveals the usefulness and reliability of Sentinel-1 data together with PSI technique in monitoring of active deformation in cities. The accumulative Sentinel-1 data, with a revisiting time of six days, makes it possible to generate time series and monitor temporal variations of the ground surface level, which can be useful to detect and study risky deforming zones and infrastructures in vulnerable cities.
This study, for the first time, has shown that there are many places in Uppsala (shown in Figure 6) that are undergoing significant subsidence (sinking), with a maximal annual rate of about 6 mm/year in the LOS direction. The areas of relatively higher rate of subsidence were found where the near-surface quaternary deposit was postglacial clay.
Our results also showed that there are a few PS points on a segment of railway that are subsiding with about 3-6 mm/year. If this subsidence continues, the accumulation could become a threat to safe operation of the rail system. This is important to consider, and it suggests performing periodic deformation monitoring for railway safety.
The high accuracy of the results was tested against the historical precise leveling data and it showed a satisfying agreement. Between the two techniques, the vertical subsidence rate differed between −0.9 mm/year and 0.9 mm/year, for all ten validation pairs (PS point and representative metal peg). The mean of the differences was 0.00 mm/year, while the RMS of the differences was 0.58 mm/year.

Author Contributions

J.F. performed all analyses and initiated the manuscript. F.N. supervised the analyses, commented on the manuscript and helped with the interpretation of the results.

Funding

This research received no external funding.

Acknowledgments

The authors are grateful for the free using of SARPROZ software. The Sentinel-1 data were provided by ESA and the geological maps by SGU. We are also thankful to Bjerking AB in Uppsala and the contact person there, Mathias Andersson, who provided the valuable data and contributed in discussions.

Conflicts of Interest

The authors declare no conflict of interest.

References

  1. Lundqvist, J.; Lundqvist, T.; Lindström, M.; Calner, M.; Sivhed, U. Sveriges Geologi Från Urtid till Nutid, 3rd ed.; Studentlitteratur AB: Lund, Sweden, 2011. [Google Scholar]
  2. Fredén, C. Berg och Jord, 3rd ed.; Sveriges Nationalatlas redaktion: Bromma, Sweden, 2009. [Google Scholar]
  3. Chang, Y.C.E. Long Term Consolidation Beneath the Test Fills at Väsby, Sweden; Report 13; Swedish Geotechnical Institute (SGI): Linköping, Sweden, 1981.
  4. Messing, I.; Jarvis, N.J. Seasonal variation in field-saturated hydraulic conductivity in two swelling clay soils in Sweden. J. Soil Sci. 1990, 41, 229–237. [Google Scholar] [CrossRef]
  5. Axelsson, K.; Mattson, H. Geoteknik, 1st ed.; Studentlitteratur AB: Lund, Sweden, 2016. [Google Scholar]
  6. Bonì, R.; Bosino, A.; Meisina, C.; Novellino, A.; Bateson, L.; McCormack, H. A Methodology to Detect and Characterize Uplift Phenomena in Urban Areas Using Sentinel-1 Data. Remote Sens. 2018, 10, 607. [Google Scholar] [CrossRef]
  7. Amelung, F.; Galloway, D.L.; Bell, J.W.; Zebker, H.A.; Laczniak, R.J. Sensing the ups and downs of Las Vegas: InSAR reveals structural control of land subsidence and aquifer-system deformation. Geology 1999, 27, 483–486. [Google Scholar] [CrossRef]
  8. Andersson, M.; Andersson, J.V.; Hallingberg, A.; Lind, B.; Löfroth, H. Förbättrade kontrollsystem för uppföljning av sättningar; Publikation 23; Swedish Geotechnical Institute (SGI): Linköping, Sweden, 2015.
  9. Hanssen, R.F. Radar Interferometry: Data Interpretation and Error Analysis; Springer Netherlands: Dordrecht, The Netherlands, 2001. [Google Scholar]
  10. Rosen, P.A.; Hensley, S.; Joughin, I.R.; Li, F.K.; Madsen, S.N.; Rodriguez, E.; Goldstein, R.M. Synthetic aperture radar interferometry. Proc. IEEE 2000, 88, 333–382. [Google Scholar] [CrossRef]
  11. Ferretti, A.; Prati, C.; Rocca, F. Nonlinear subsidence rate estimation using permanent scatterers in differential SAR interferometry. IEEE Trans. Geosci. Remote Sens. 2000, 38, 2202–2212. [Google Scholar] [CrossRef]
  12. Kampes, B.M. Radar Interferometry: Persistent Scatterer Technique; Springer Netherlands: Dordrecht, The Netherlands, 2006. [Google Scholar]
  13. Crosetto, M.; Monserrat, O.; Devanthéry, N.; Cuevas González, M.; Barra, A.; Crippa, B. Persistent scatterer interferometry using Sentinel-1 data. In Proceedings of the International Archives of the Photogrammetry, Remote Sensing and Spatial Information Sciences Congress (ISPRS), Prague, Czech Republic, 12–19 July 2016; Volume 41, pp. 835–839. [Google Scholar]
  14. Del Soldato, M.; Farolfi, G.; Rosi, A.; Raspini, F.; Casagli, N. Subsidence Evolution of the Firenze–Prato–Pistoia Plain (Central Italy) Combining PSI and GNSS Data. Remote Sens. 2018, 10, 1146. [Google Scholar] [CrossRef]
  15. Roccheggiani, M.; Piacentini, D.; Tirincanti, E.; Perissin, D.; Menichetti, M. Detection and Monitoring of Tunneling Induced Ground Movements Using Sentinel-1 SAR Interferometry. Remote Sens. 2019, 11, 639. [Google Scholar] [CrossRef]
  16. Ruiz-Armenteros, A.M.; Lazecky, M.; Hlaváčová, I.; Bakoň, M.; Delgado, J.M.; Sousa, J.J.; Lamas-Fernández, F.; Marchamalo, M.; Caro-Cuenca, M.; Papco, J.; et al. Deformation monitoring of dam infrastructures via spaceborne MT-InSAR. The case of La Viñuela (Málaga, southern Spain). Procedia Comput. Sci. 2018, 138, 346–353. [Google Scholar] [CrossRef]
  17. Huang, Q.; Crosetto, M.; Monserrat, O.; Crippa, B. Displacement monitoring and modelling of a high-speed railway bridge using C-band Sentinel-1 data. ISPRS J. Photogramm. Remote Sens. 2017, 128, 204–211. [Google Scholar] [CrossRef]
  18. Borghero, C. Feasibility Study of Dam Deformation Monitoring in Northern Sweden Using Sentinel 1 SAR Interferometry. Master’s Thesis, University of Gävle: Gävle, Sweden, 2017. [Google Scholar]
  19. Hung, W.-C.; Hwang, C.; Chen, Y.-A.; Chang, C.-P.; Yen, J.-Y.; Hooper, A.; Yang, C.-Y. Surface deformation from persistent scatterers SAR interferometry and fusion with leveling data: A case study over the Choushui River Alluvial Fan, Taiwan. Remote Sens. Environ. 2011, 115, 957–967. [Google Scholar] [CrossRef]
  20. Karila, K.; Karjalainen, M.; Hyyppä, J.; Koskinen, J.; Saaranen, V.; Rouhiainen, P. A Comparison of Precise Leveling and Persistent Scatterer SAR Interferometry for Building Subsidence Rate Measurement. ISPRS Int. J. Geo-Inf. 2013, 2, 797–816. [Google Scholar] [CrossRef]
  21. Maps. Available online: https://www.sgu.se/en/products/maps/ (accessed on 2 May 2019).
  22. Lundin, S.-E. Ingenjörsgeologisk karta över Uppsala; Bjerking AB: Uppsala, Sweden, 1988. [Google Scholar]
  23. Eldh, T. Sättningsstudier i Kungsängen, Uppsala. Bachelor’s Thesis, Uppsala University, Uppsala, Sweden, 1990. [Google Scholar]
  24. Perissin, D.; Wang, Z.; Wang, T. Sarproz InSAR tool for urban subsidence/manmade structure stability monitoring in China. In Proceedings of the 34th International Symposium for Remote Sensing of the Environment (ISRSE), Sydney, Australia, 10–15 April 2011. [Google Scholar]
  25. Razi, P.; Sumantyo, J.T.S.; Perissin, D.; Kuze, H.; Chua, M.Y.; Panggabean, G.F. 3D Land Mapping and Land Deformation Monitoring Using Persistent Scatterer Interferometry (PSI) ALOS PALSAR: Validated by Geodetic GPS and UAV. IEEE Access 2018, 6, 12395–12404. [Google Scholar] [CrossRef]
  26. Foroughnia, F.; Nemati, S.; Maghsoudi, Y.; Perissin, D. An iterative PS-InSAR method for the analysis of large spatio-temporal baseline data stacks for land subsidence estimation. Int. J. Appl. Earth Obs. Geoinf. 2019, 74, 248–258. [Google Scholar] [CrossRef]
  27. Qin, Y.; Perissin, D.; Milillo, P. A new era of InSAR applications with Sentinel-1: A case study of severe ground subsidence in California Central Valley. In Proceedings of the 2017 IEEE International Geoscience and Remote Sensing Symposium (IGARSS), Fort Worth, TX, USA, 23–28 July 2017; pp. 953–956. [Google Scholar]
  28. Declercq, P.-Y.; Walstra, J.; Gérard, P.; Pirard, E.; Perissin, D.; Meyvis, B.; Devleeschouwer, X. A Study of Ground Movements in Brussels (Belgium) Monitored by Persistent Scatterer Interferometry over a 25-Year Period. Geosciences 2017, 7, 115. [Google Scholar] [CrossRef]
  29. NASA Shuttle Radar Topography Mission Global 3 arc Second. Available online: https://lpdaac.usgs.gov/products/srtmgl3v003/ (accessed on 2 May 2019).
  30. CELSIUS. Available online: http://celsius.met.uu.se/ (accessed on 10 June 2019).
  31. Colesanti, C.; Ferretti, A.; Locatelli, R.; Savio, G. Multi-platform permanent scatterers analysis: First results. In Proceedings of the 2003 2nd GRSS/ISPRS Joint Workshop on Remote Sensing and Data Fusion over Urban Areas, Berlin, Germany, 22–23 May 2003; pp. 52–56. [Google Scholar]
  32. Ferretti, A.; Prati, C.; Rocca, F. Permanent scatterers in SAR interferometry. IEEE Trans. Geosci. Remote Sens. 2001, 39, 8–20. [Google Scholar] [CrossRef]
  33. Havel, F. Creep in soft Soils. Doctoral Thesis, Norwegian University of Science and Technology, Trondheim, Norway, 2004. [Google Scholar]
  34. Larsson, R. Consolidation of Soft Soils; Report 29; Swedish Geotechnical Institute (SGI): Linköping, Sweden, 1986.
  35. Larsson, R.; Bengtsson, P.-E.; Eriksson, L. Prediction of Settlements of Embankments on Soft, Fine-Grained Soils. Calculation of Settlements and Their Course with Time; Information 13E, Swedish Geotechnical Institute (SGI): Linköping, Sweden, 1997.
  36. Gambolati, G.; Teatini, P.; Ferronato, M. Anthropogenic Land Subsidence. In Encyclopedia of Hydrological Sciences; Andersson, M.G., Ed.; Wiley: Hoboken, NJ, USA, 2005; Volume IV, pp. 2444–2459. [Google Scholar]
Figure 1. (a) The quaternary deposits map of the study area (shown in (b)), overlaid by ascending and descending image boundaries. The building used as reference in PSI analyses is shown with a circle. Base map © National Land Survey, Quaternary deposits © Geological Survey of Sweden (SGU). Coordinate system: SWEREF 99 TM; (b) The location of Uppsala, about 70 km north of Stockholm.
Remotesensing 11 02764 g001
Figure 2. Some obvious damages to buildings, due to subsidence problems in Uppsala: (a) a diagonal crack in a building, which is a typical problem with uneven subsidence (photo: Faramarz Nilfouroushan, 1 October 2019); (b) a ground surface that is subsiding, while the building has a pile foundation and is therefore not moving, causing a “gap” (photo: Jonas Fryksten, 17 October 2019).
Remotesensing 11 02764 g002
Figure 3. A metal peg, that has been measured with precise leveling, mounted in a building’s foundation (photo: Jonas Fryksten).
Remotesensing 11 02764 g003
Figure 4. Interferogram formation for the Sentinel-1 data sets, with one interferometric pair between the masters and each slave. (a) Time-position plot of the ascending data set, where image acquired in 4 July 2017 (shown by diamond) is the master; (b) time-position plot of the descending data set, where image acquired in 1 November 2017 is the master.
Remotesensing 11 02764 g004
Figure 5. Validation object 1 and its selected validation pairs. The blue arrows show the pairs that were examined and were expected to have similar rates of movements. Base map: Orthophoto 0.25m © National Land Survey.
Remotesensing 11 02764 g005
Figure 6. The LOS displacement rates for PS points from: (a) the ascending and; (b) the descending analysis. The color of the points represents the displacement rate with respect to the reference point on a building on the esker (black circle). Negative values are a movement away from the sensor and positive values towards.
Remotesensing 11 02764 g006
Figure 7. The LOS displacement rate for the 6900 PS points from the ascending analysis, overlaid on the quaternary deposits map. Negative values are a movement away from the satellite (subsidence). Base map: Quaternary deposits © Geological Survey of Sweden (SGU).
Remotesensing 11 02764 g007
Figure 8. Box plot of the annual displacement rate for all 6900 PS points from the ascending analysis grouped in near-surface geology in the location of the PS points. The boxes contain the values between the first and third quartile. The second quartile (the median) is the line within the box and the mean is the cross. The vertical lines are the whiskers. Under and above the whiskers some outlying points are found.
Remotesensing 11 02764 g008
Figure 9. A large scale map of the city center only with the LOS displacement rate for the PS points from the ascending analysis, together with the quaternary deposits map. Negative values are a movement away from the satellite (subsidence). The three validation objects are shown as black circles. Base map: Quaternary deposits © Geological Survey of Sweden (SGU).
Remotesensing 11 02764 g009
Figure 10. The time series of all validated PS points and their corresponding metal pegs: (a) ascending PS points at validation object 1; (b) descending PS points at validation object 1; (c) ascending PS points at validation object 2; (d) descending PS point at validation object 2; (e) ascending PS point at validation object 3; (f) descending PS point at validation object 3. The direction of movement is vertical, and the movement is in respect to the leveling benchmark, at each object, for both the metal pegs and the PS point time series.
Remotesensing 11 02764 g010
Table 1. Properties of the Sentinel-1 ascending and descending data sets.
Data infoAscendingDescending
Number of scenes4244
Acquisition period5 March 2015 to 1 April 2019 9 June 2015 to 13 April 2019
Relative orbit number10295
Incidence angle38.76°33.32°
Acquisition modeInterferometric Wide swath (IW)
Product level1
Product typeSingle Look Complex (SLC)
PolarizationVertical Vertical (VV)
Table 2. The displacement rate and the standard deviation for all PS points. Under each PS point, the annual displacement rate of the corresponding metal peg in the validation pair is written. For each validation pair, the difference in displacement rate between the two techniques is seen in the last column. The direction of movement is vertical and is in respect to the benchmark at each object, for both the metal pegs and the PS point time series.
Validation ObjectTechniqueTrackPointTime Series σ (mm)Displacement Rate (mm/year)Difference Prec. lev. – PSI (mm/year)
Object 1PSIAscending37632.7−6.1−0.3
Prec. lev. Peg 4 −6.4
PSIAscending37622.8−5.6+0.5
Prec. lev. Peg 3 −5.1
PSIAscending37362.6−3.3+0.5
Prec. lev. Peg 1 −2.8
PSIDescending37252.0−5.1+0.4
Prec. lev. Peg 16 −4.7
PSIDescending37871.2−3.3−0.1
Prec. lev. Peg 10 −3.4
Object 2PSIAscending23881.8−6.9−0.6
Prec. lev. Peg 29 −7.5
PSIAscending23871.6−8.2+0.9
Prec. lev. Peg 39 −7.3
PSIDescending47412.8−6.6−0.9
Prec. lev. Peg 29 −7.5
Object 3PSIAscending29253.3−5.6+0.3
Prec. lev. Peg 14 −5.3
PSIDescending38921.6−4.6−0.7
Prec. lev. Peg 14 −5.3

