Improving the RST-OIL Algorithm for Oil Spill Detection under Severe Sun Glint Conditions


 ,
,  ,
,  and
and 
Abstract
:
1. Introduction
2. Materials and Methods
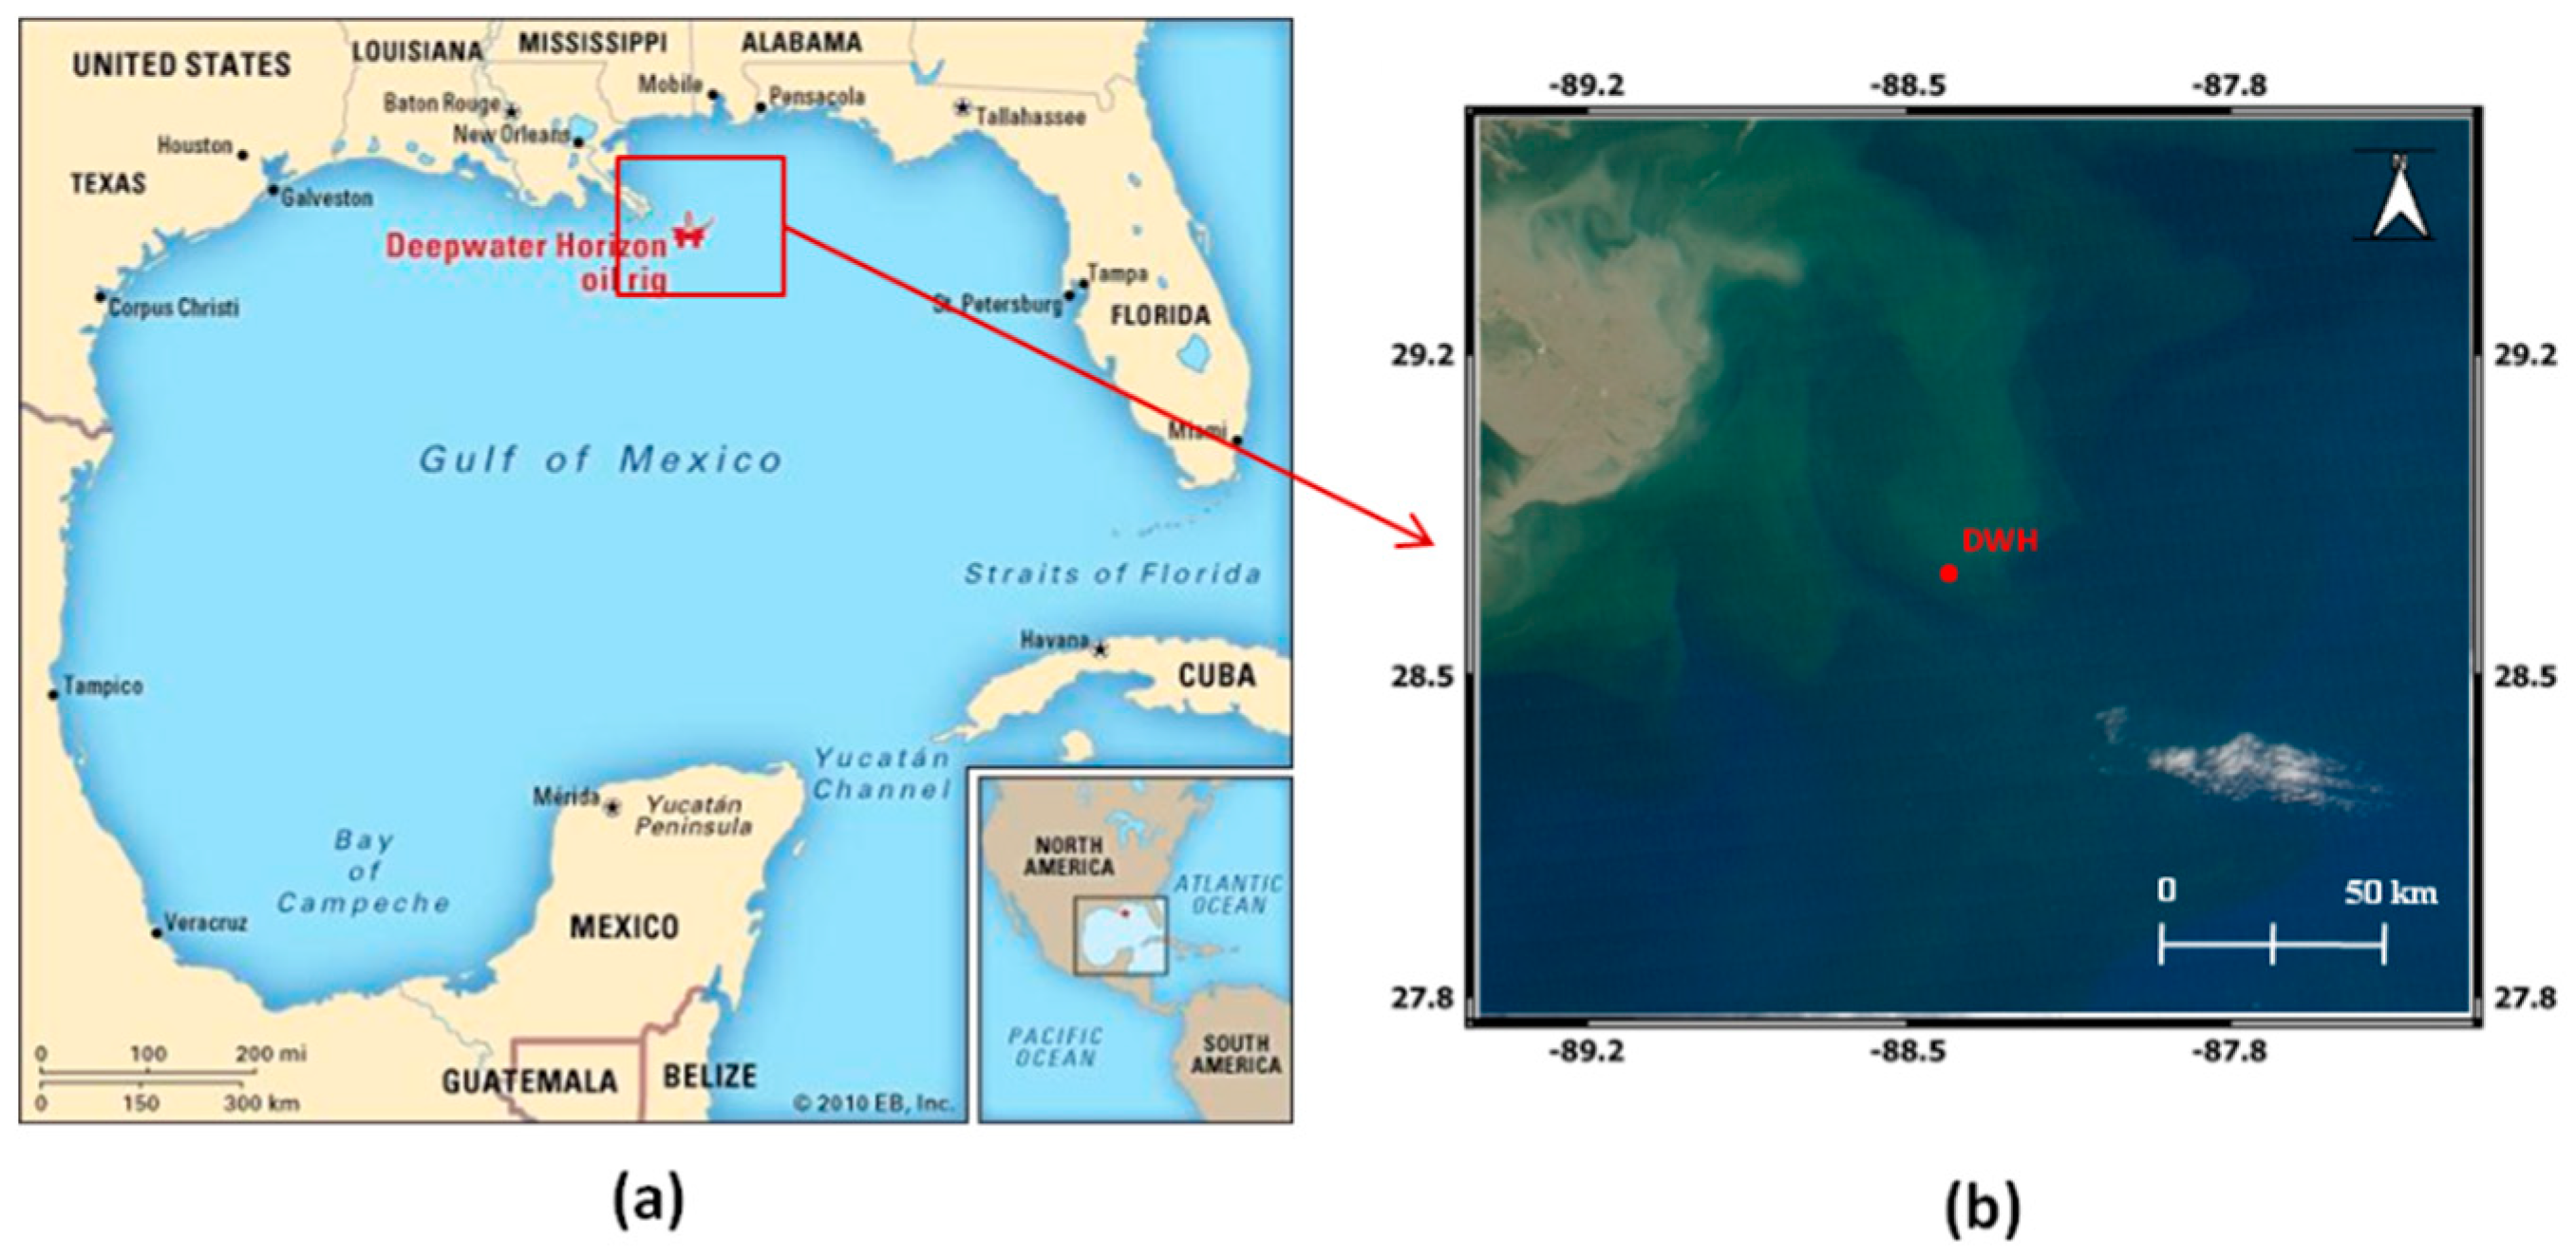
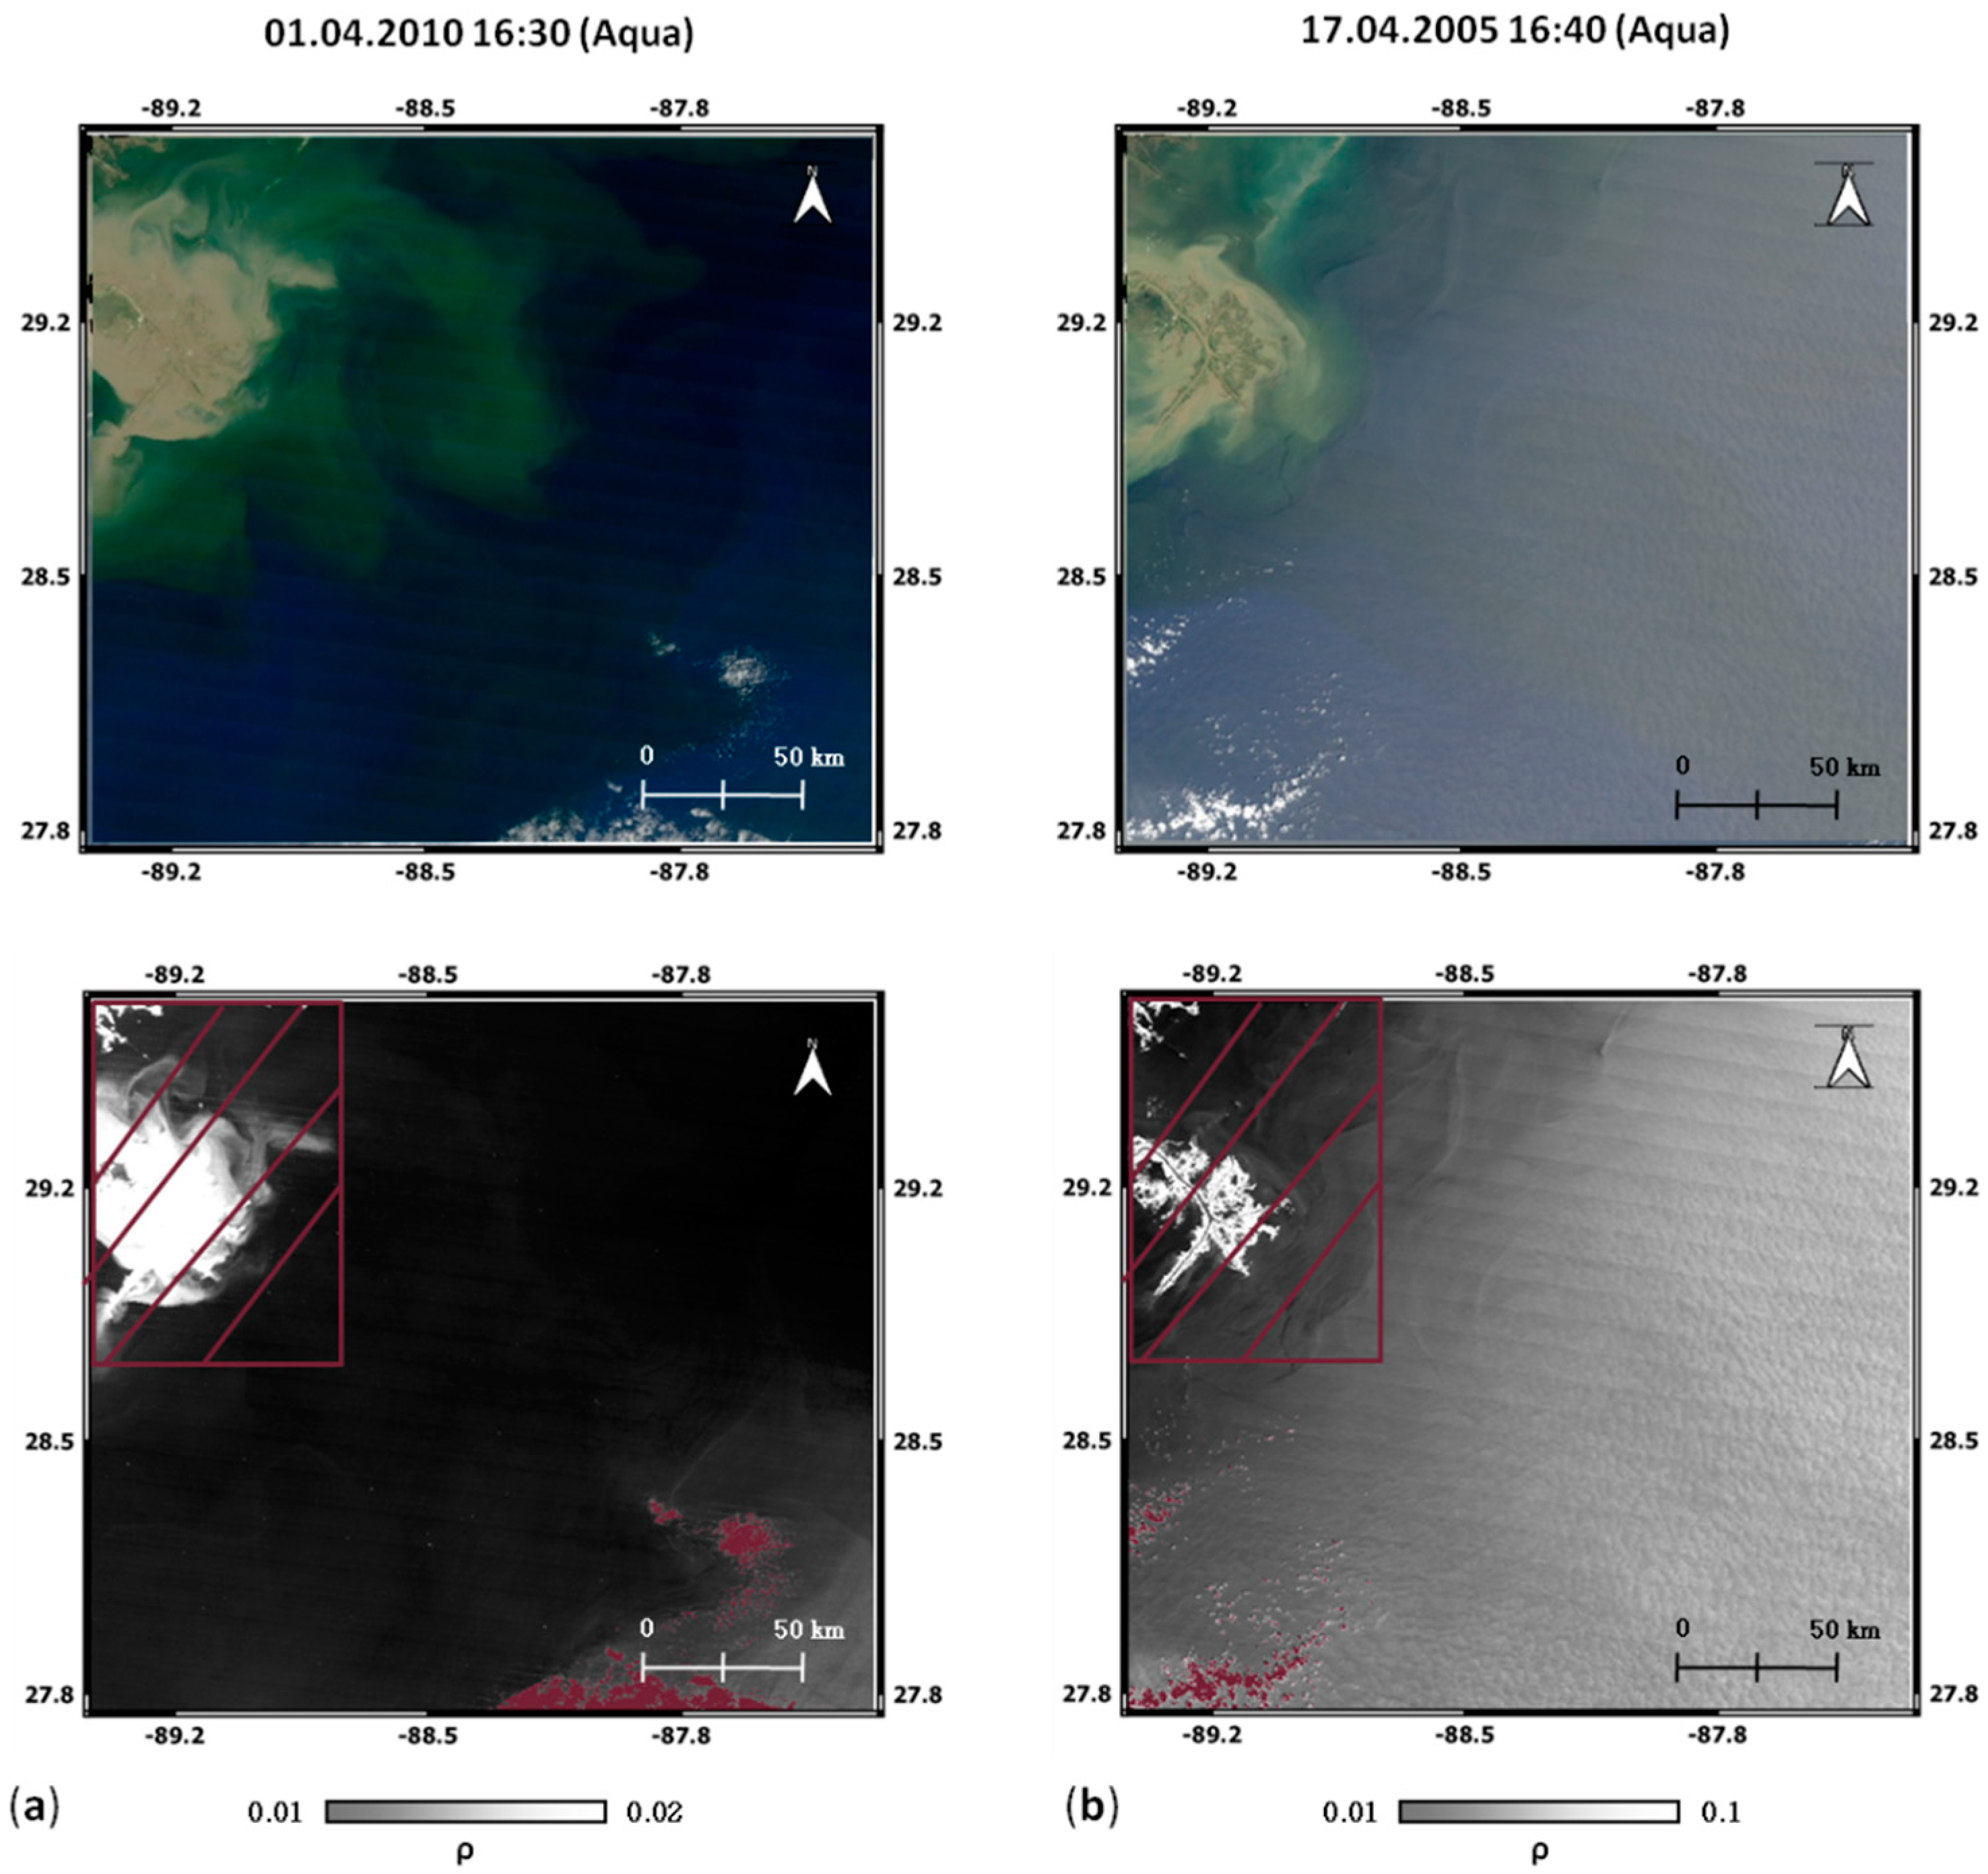
2.1. Data
2.2. RST-OIL
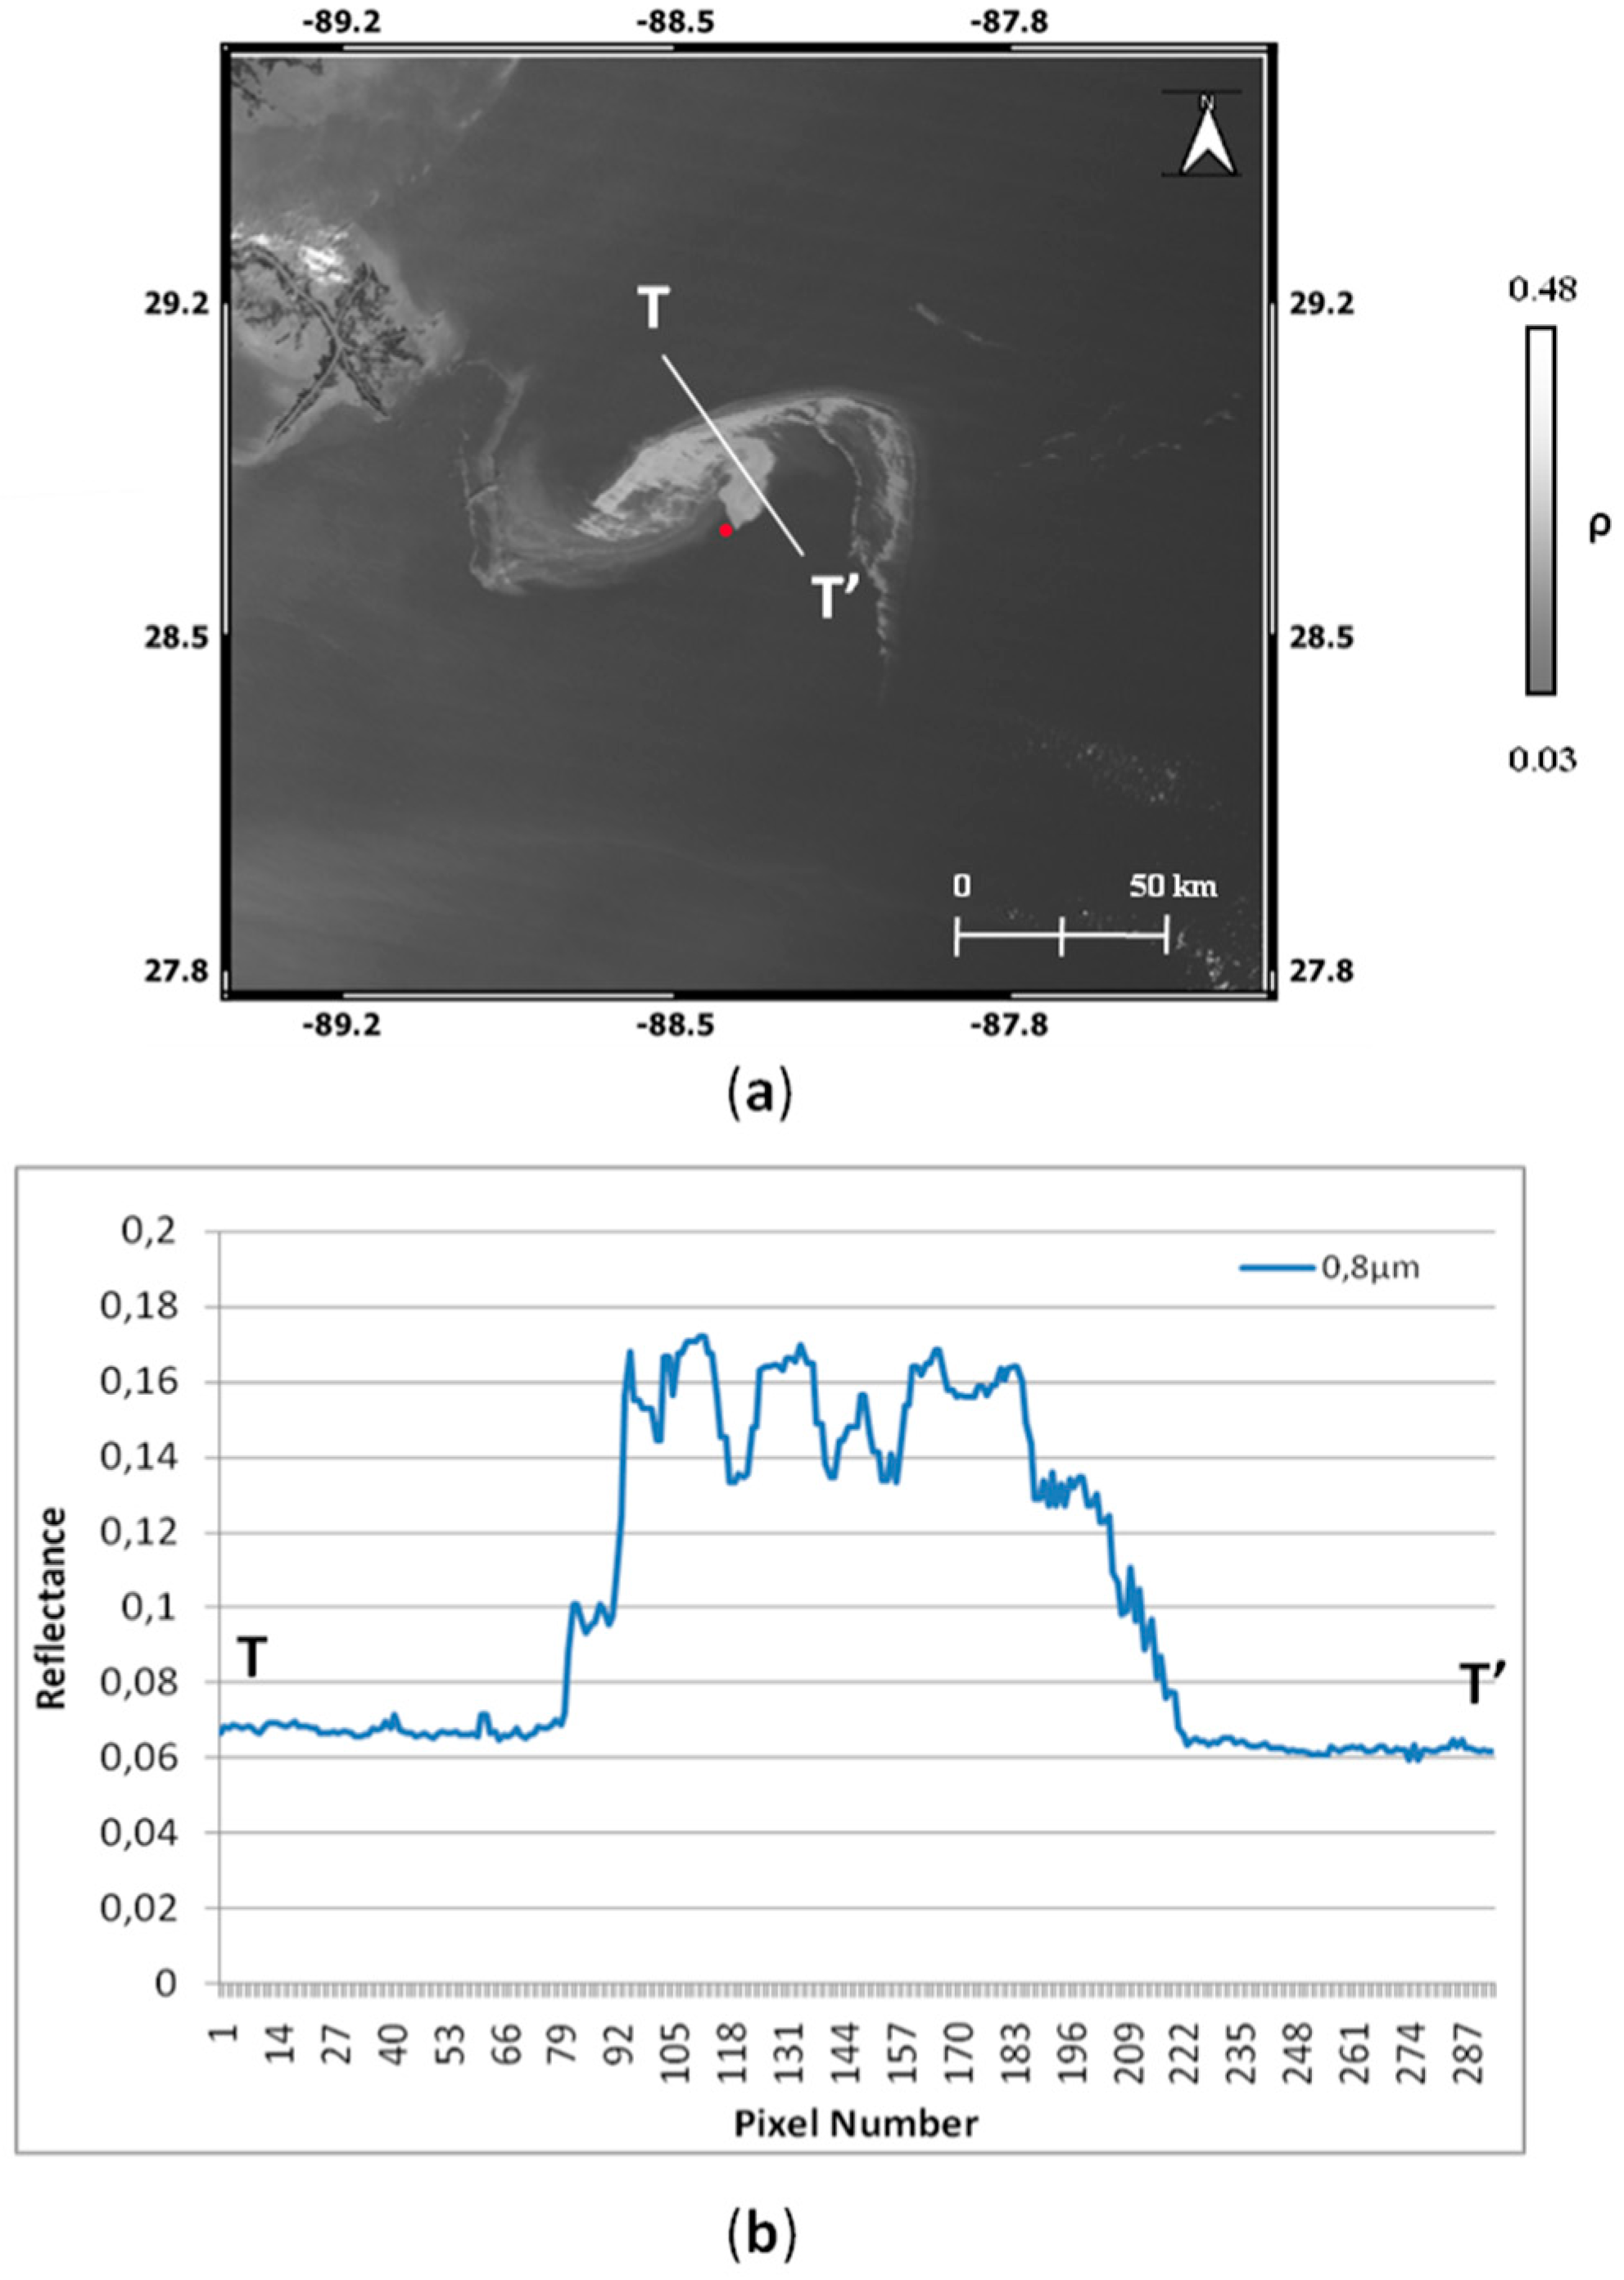
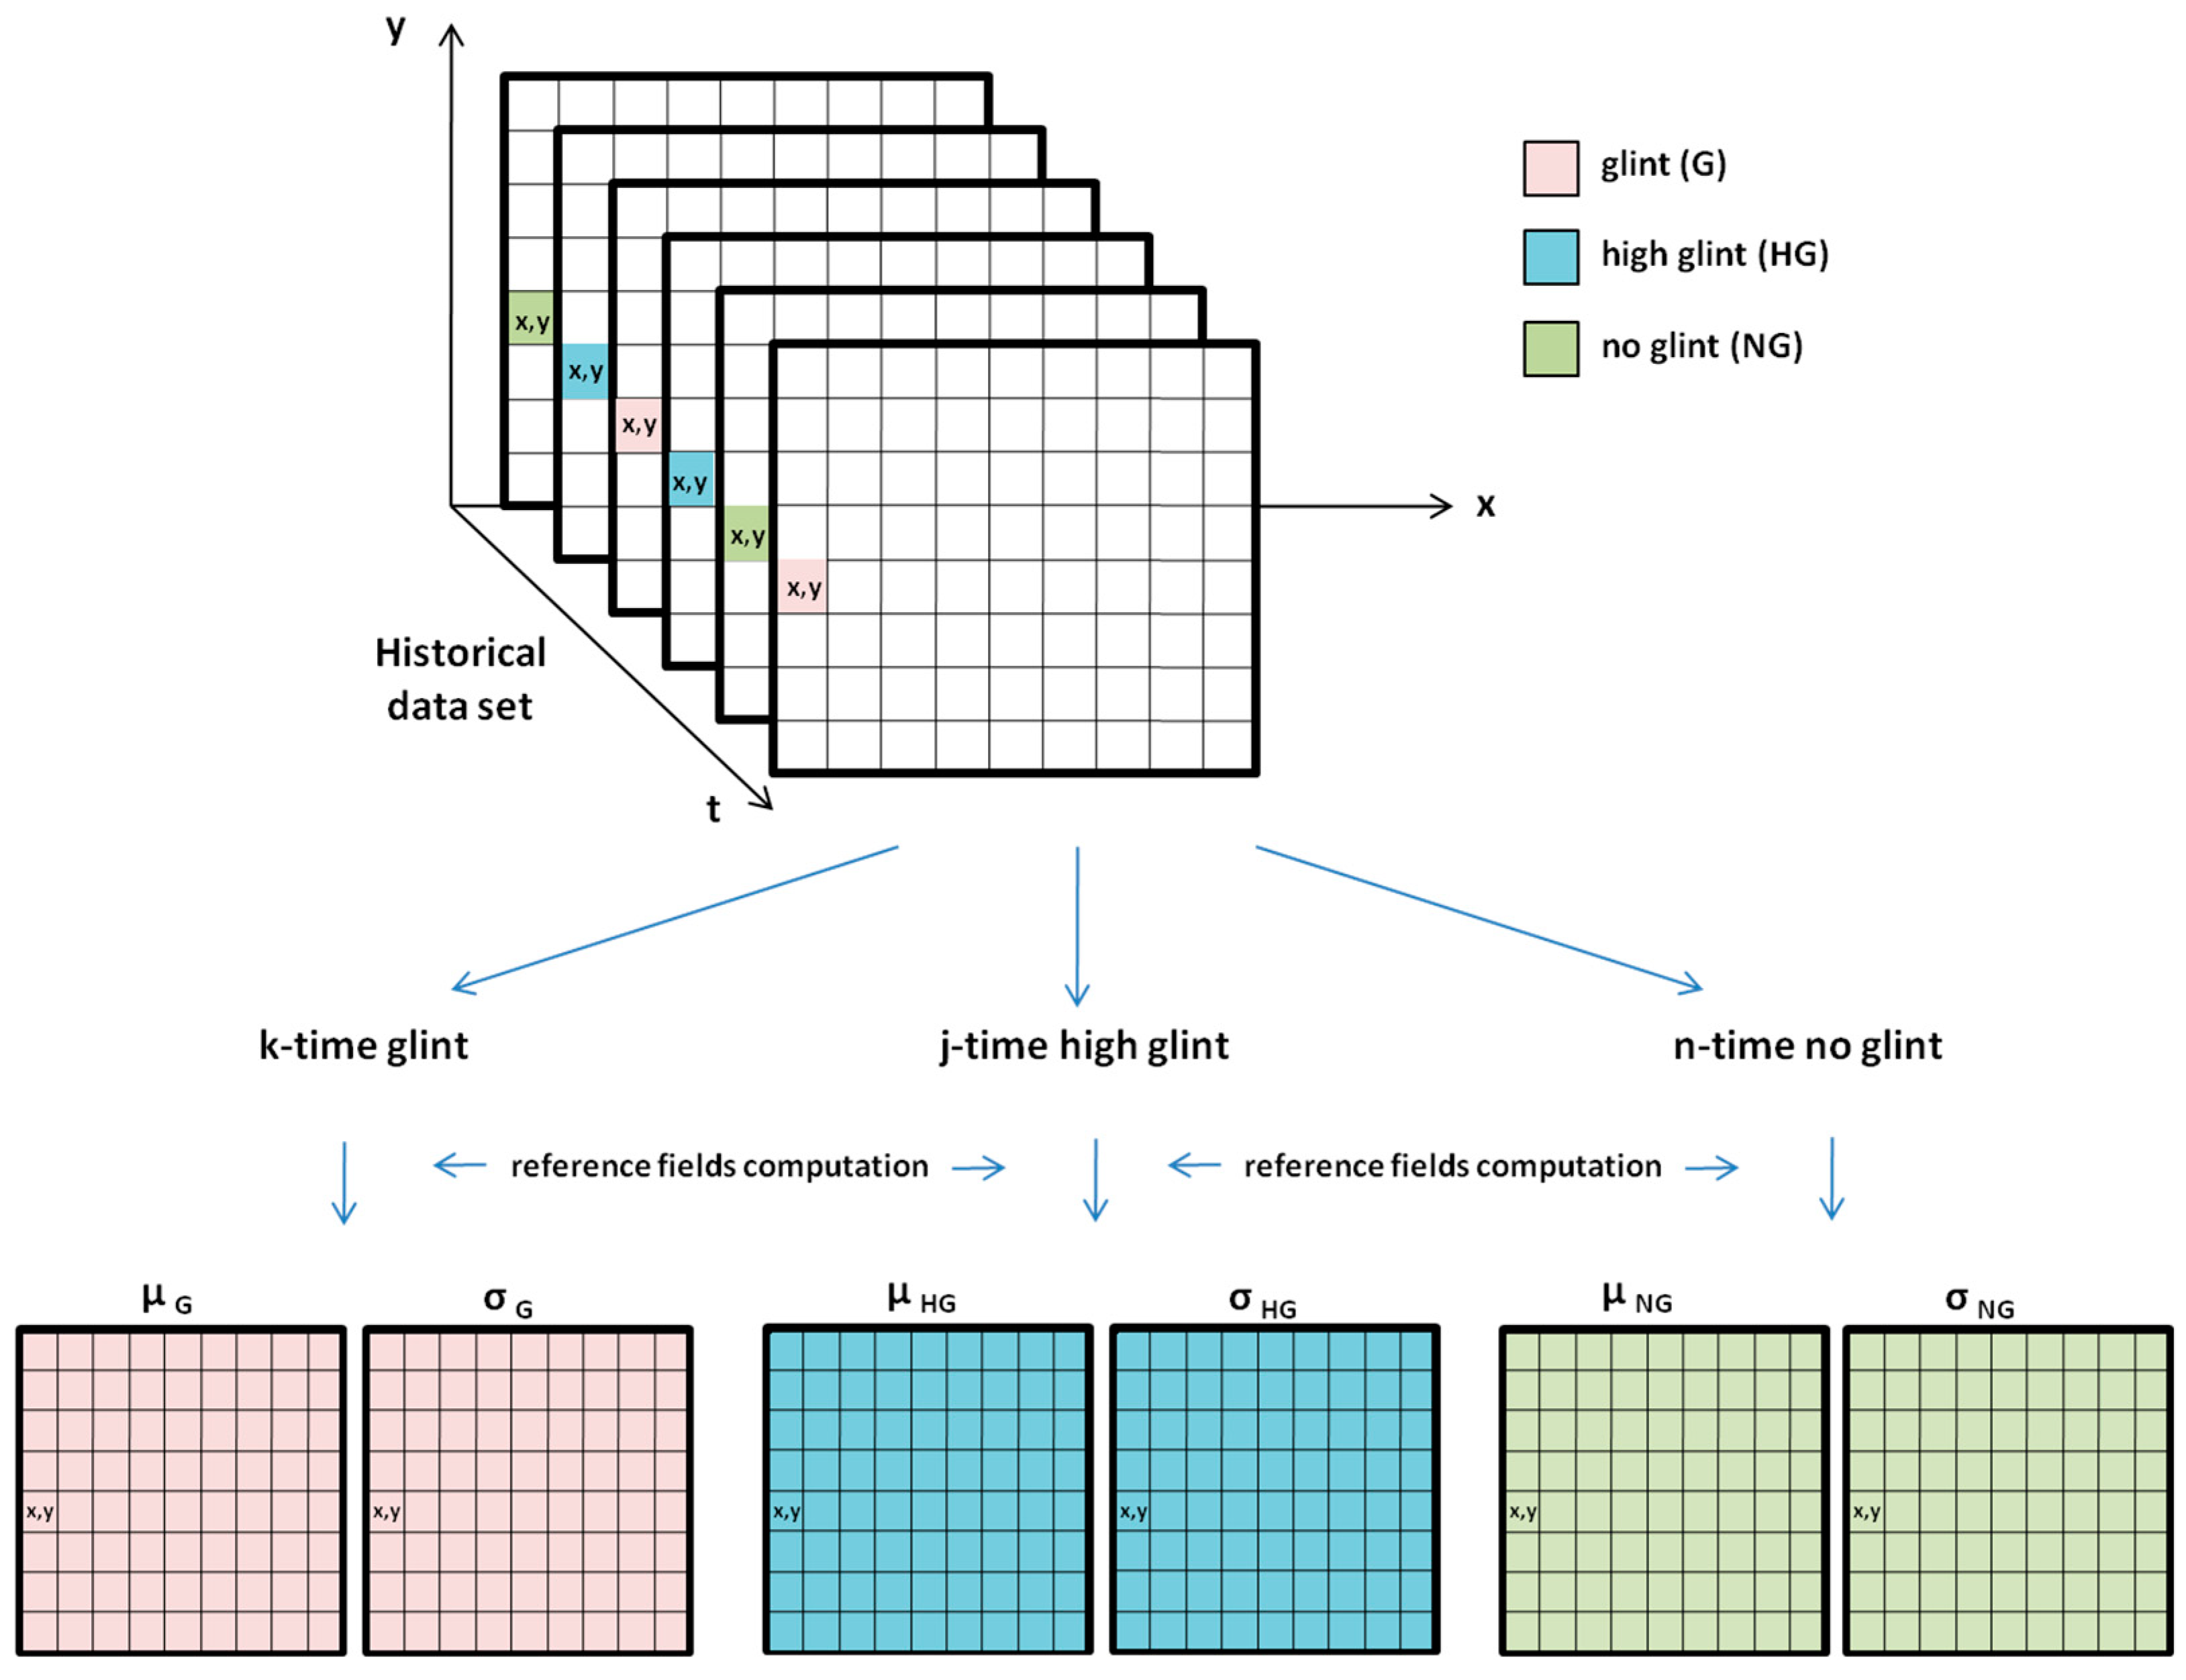
2.3. Extending the Applicability of RST-OIL to Different Observational Conditions
3. Results
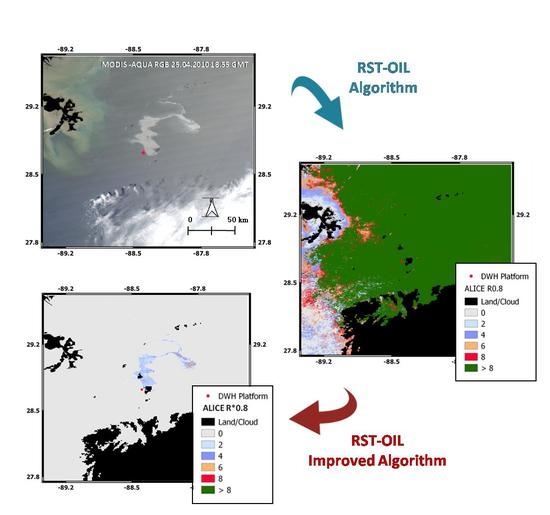
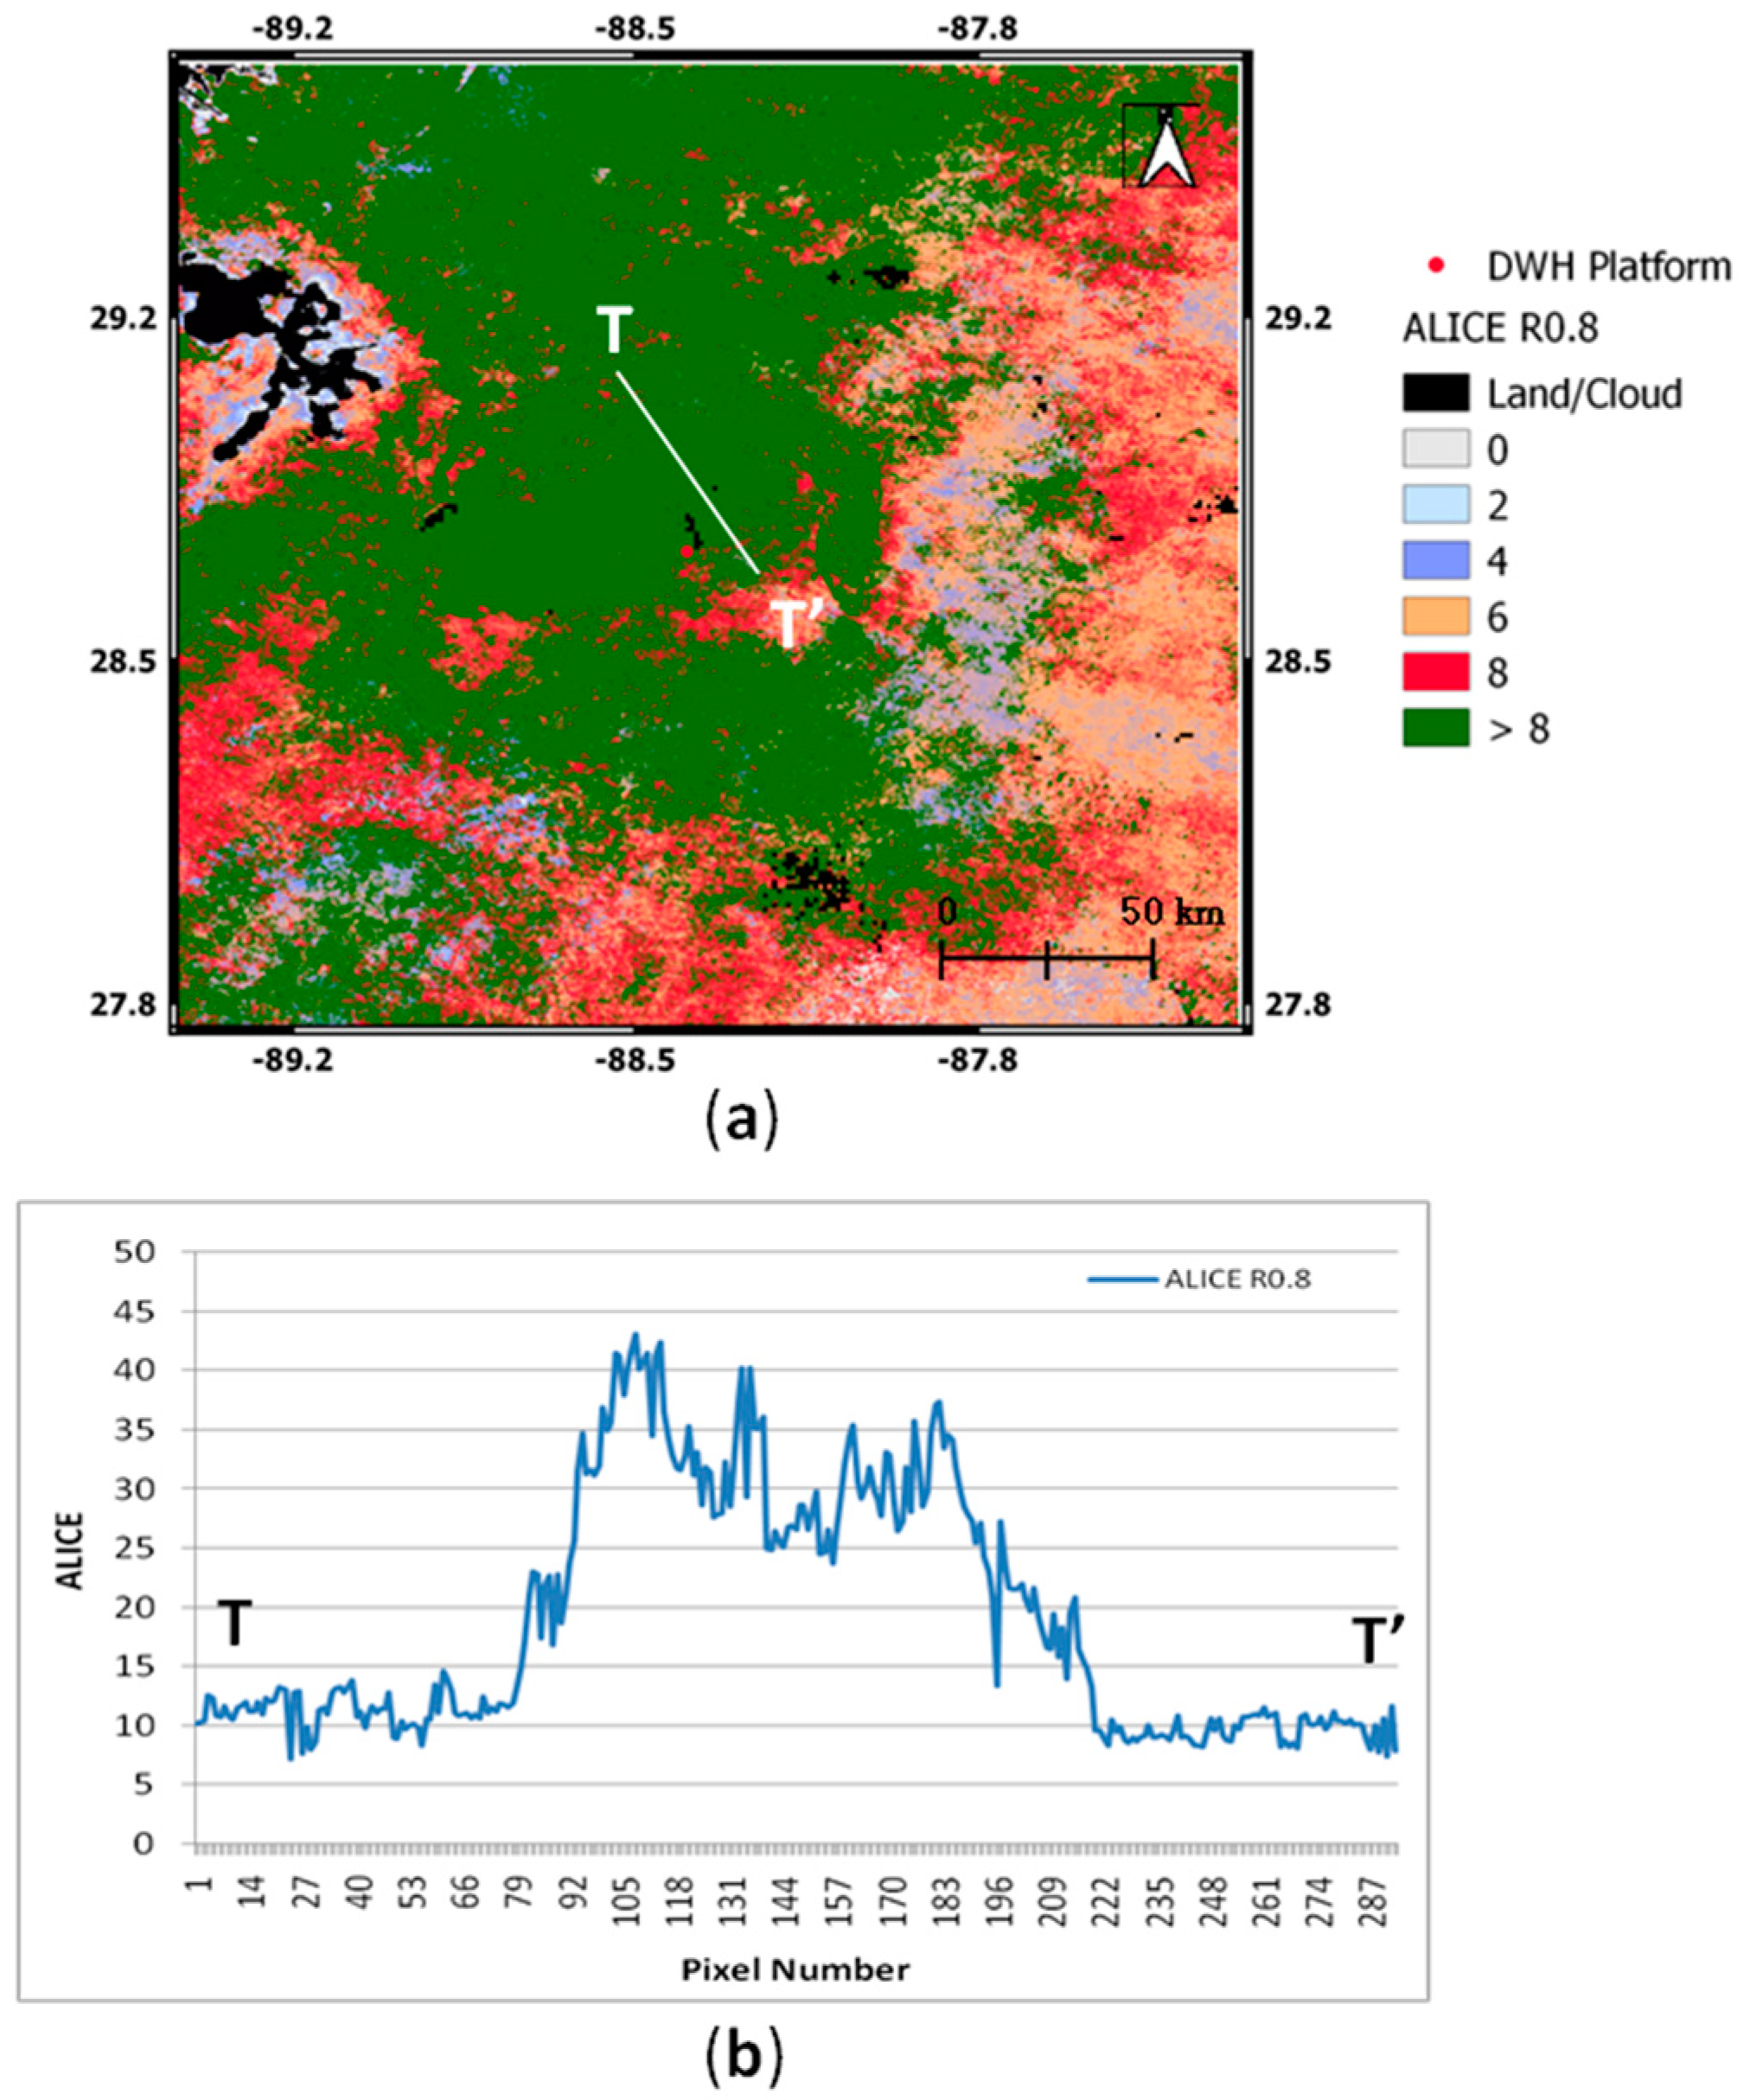
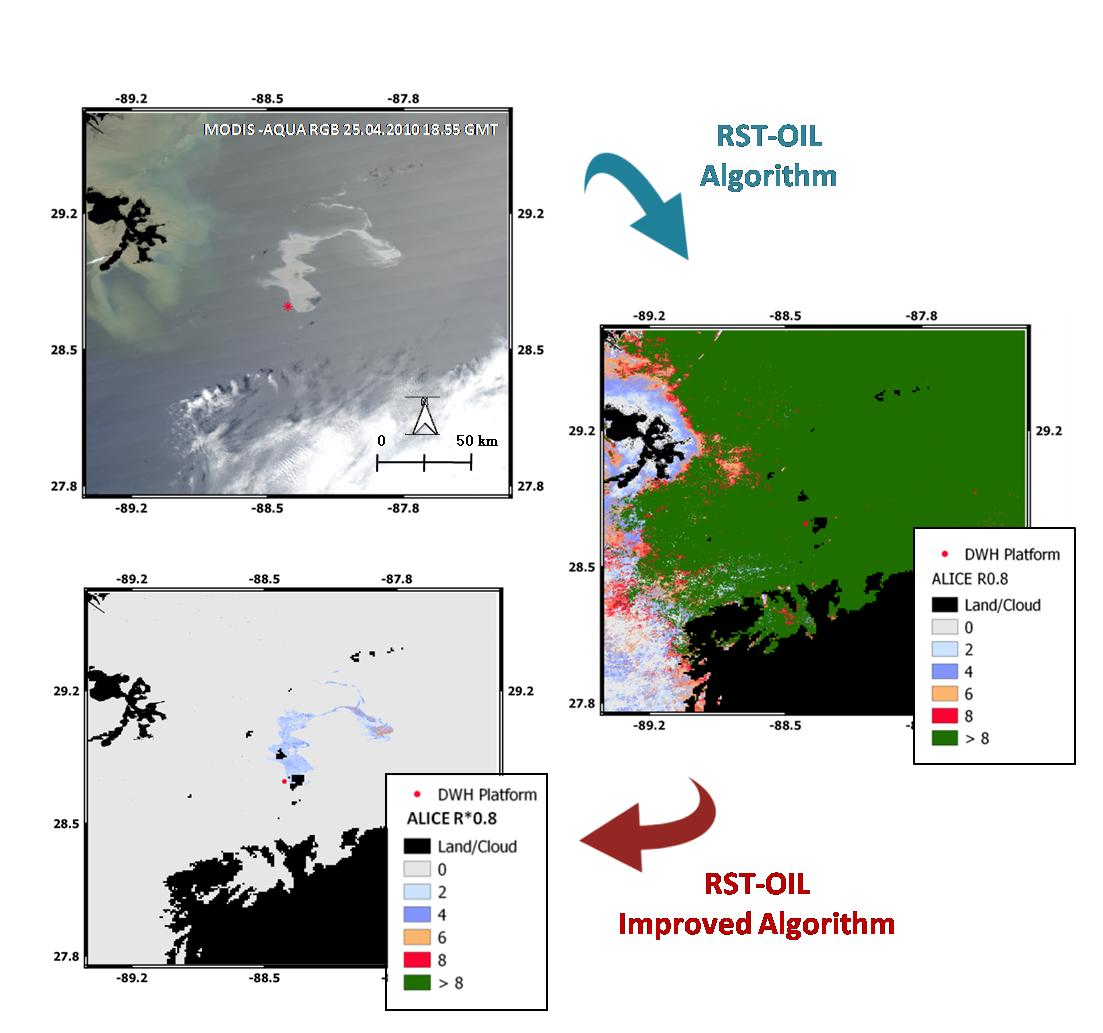
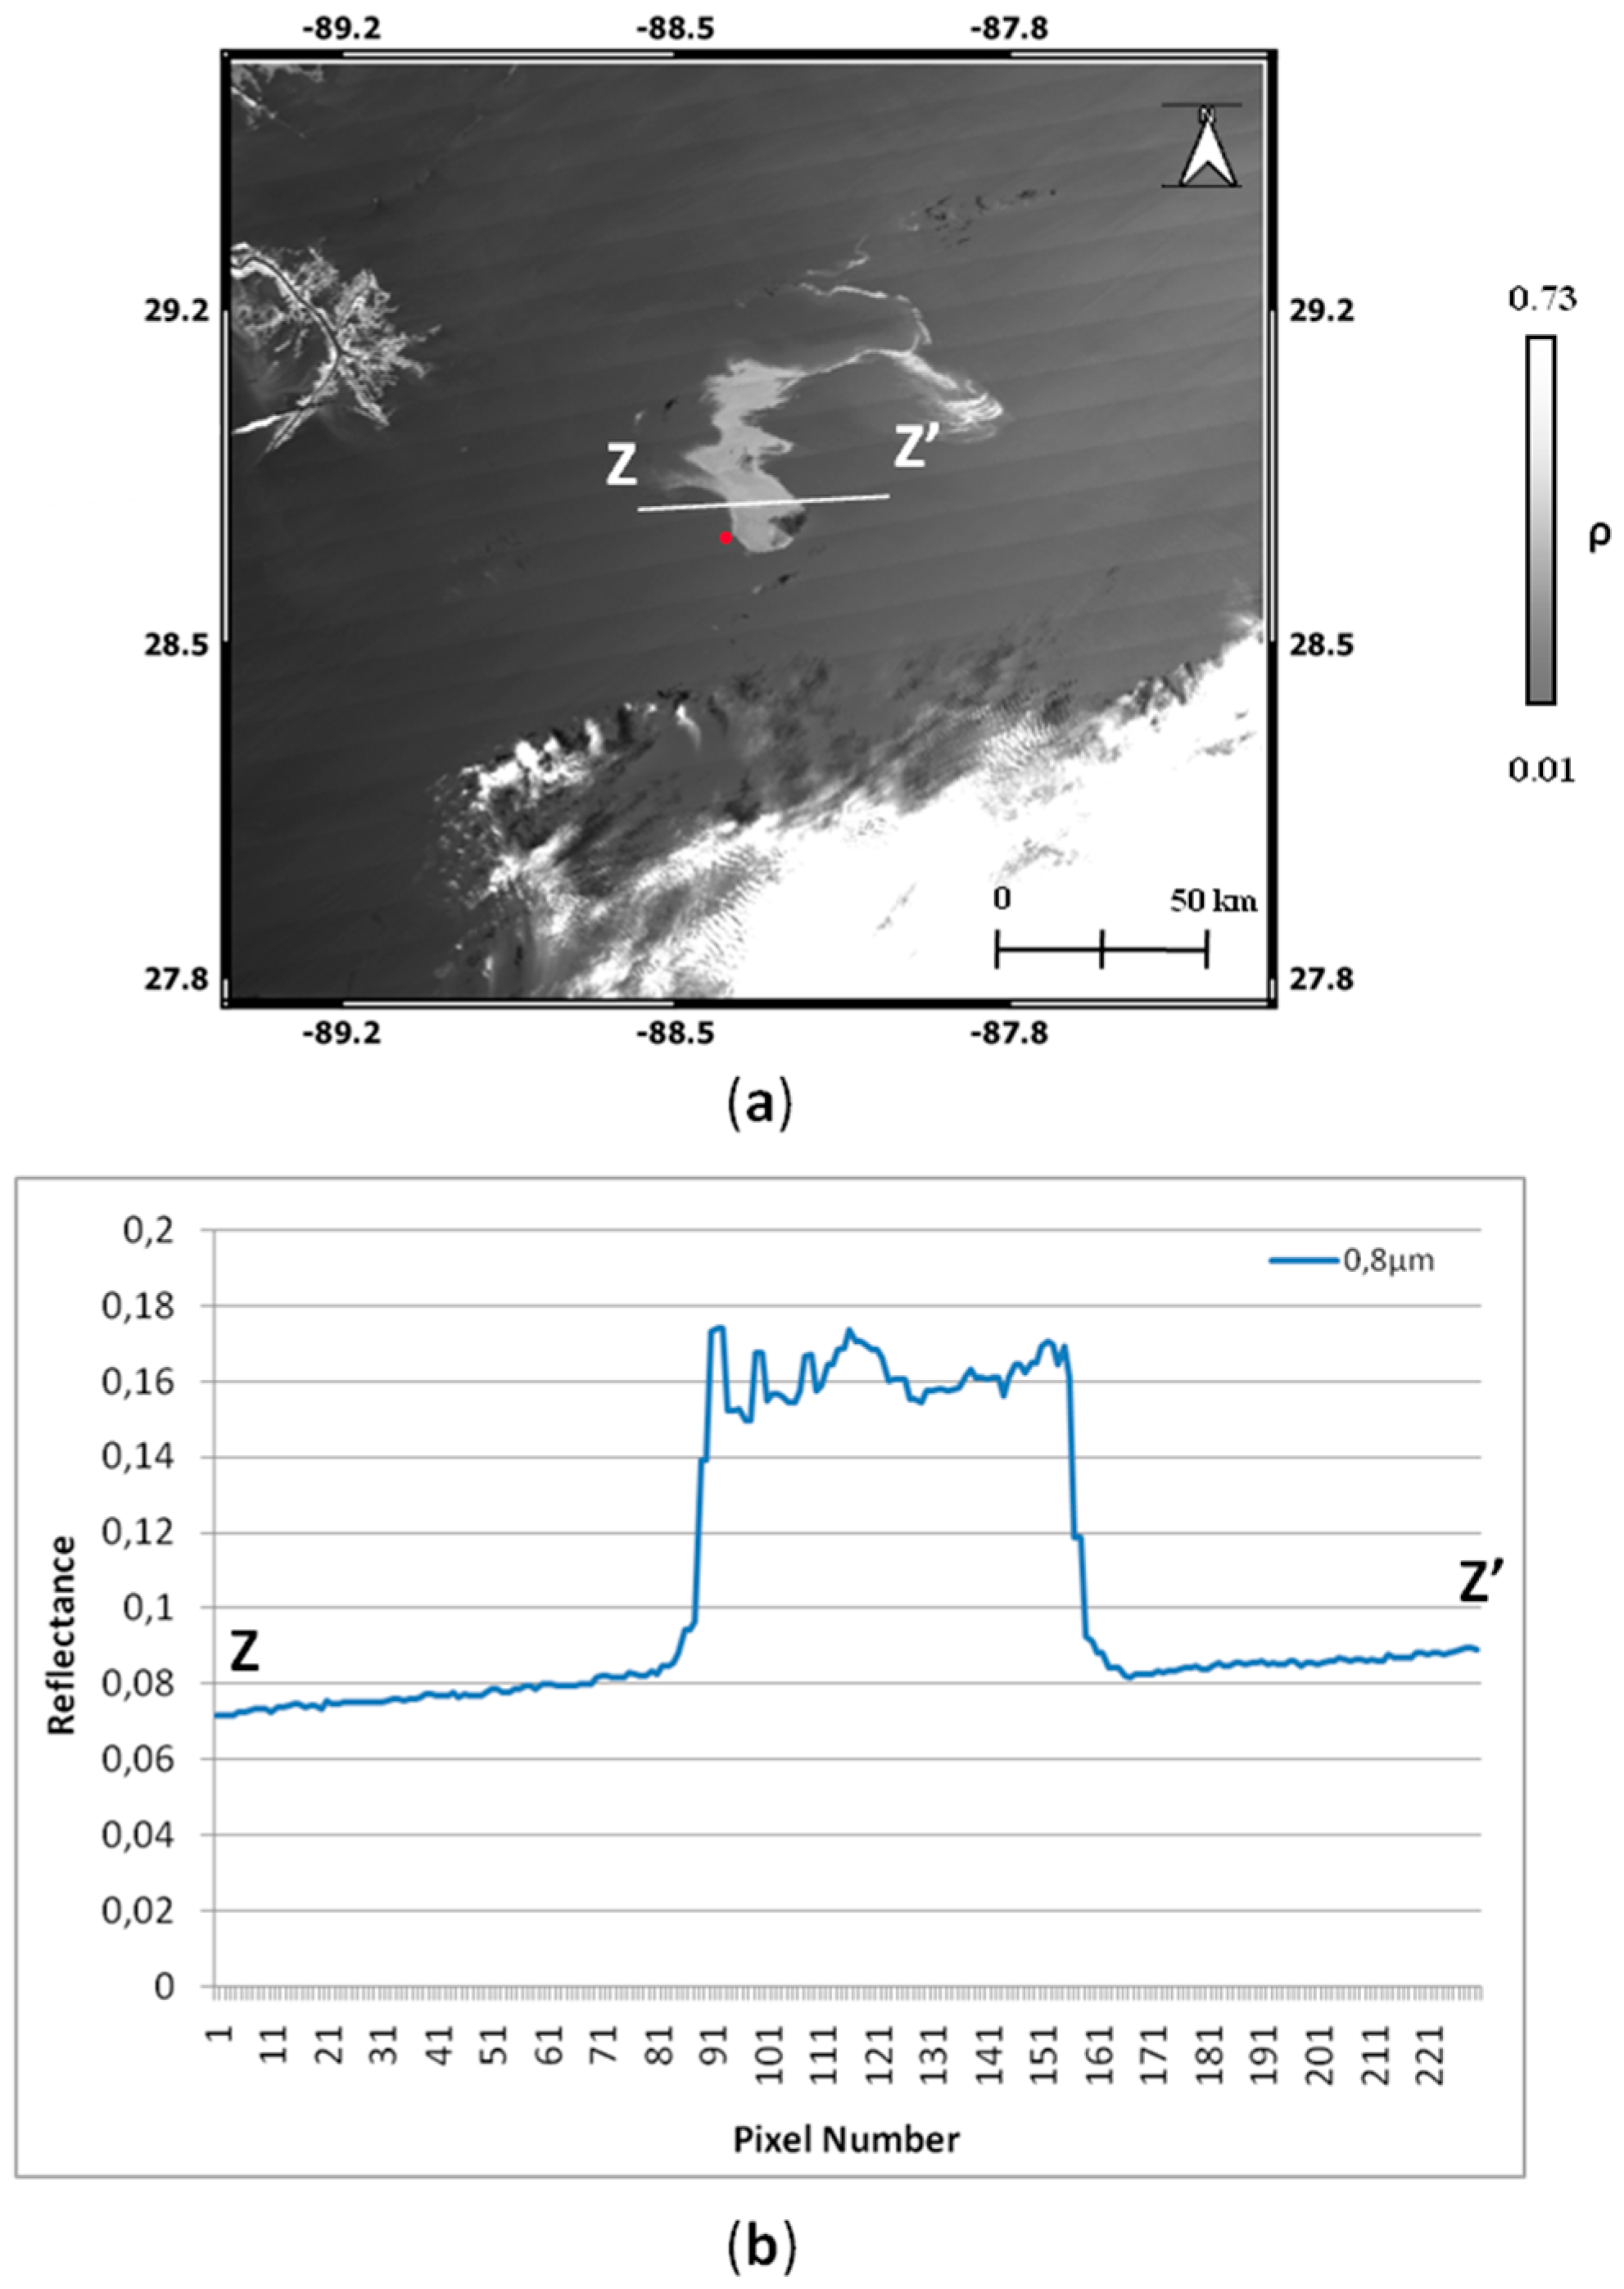
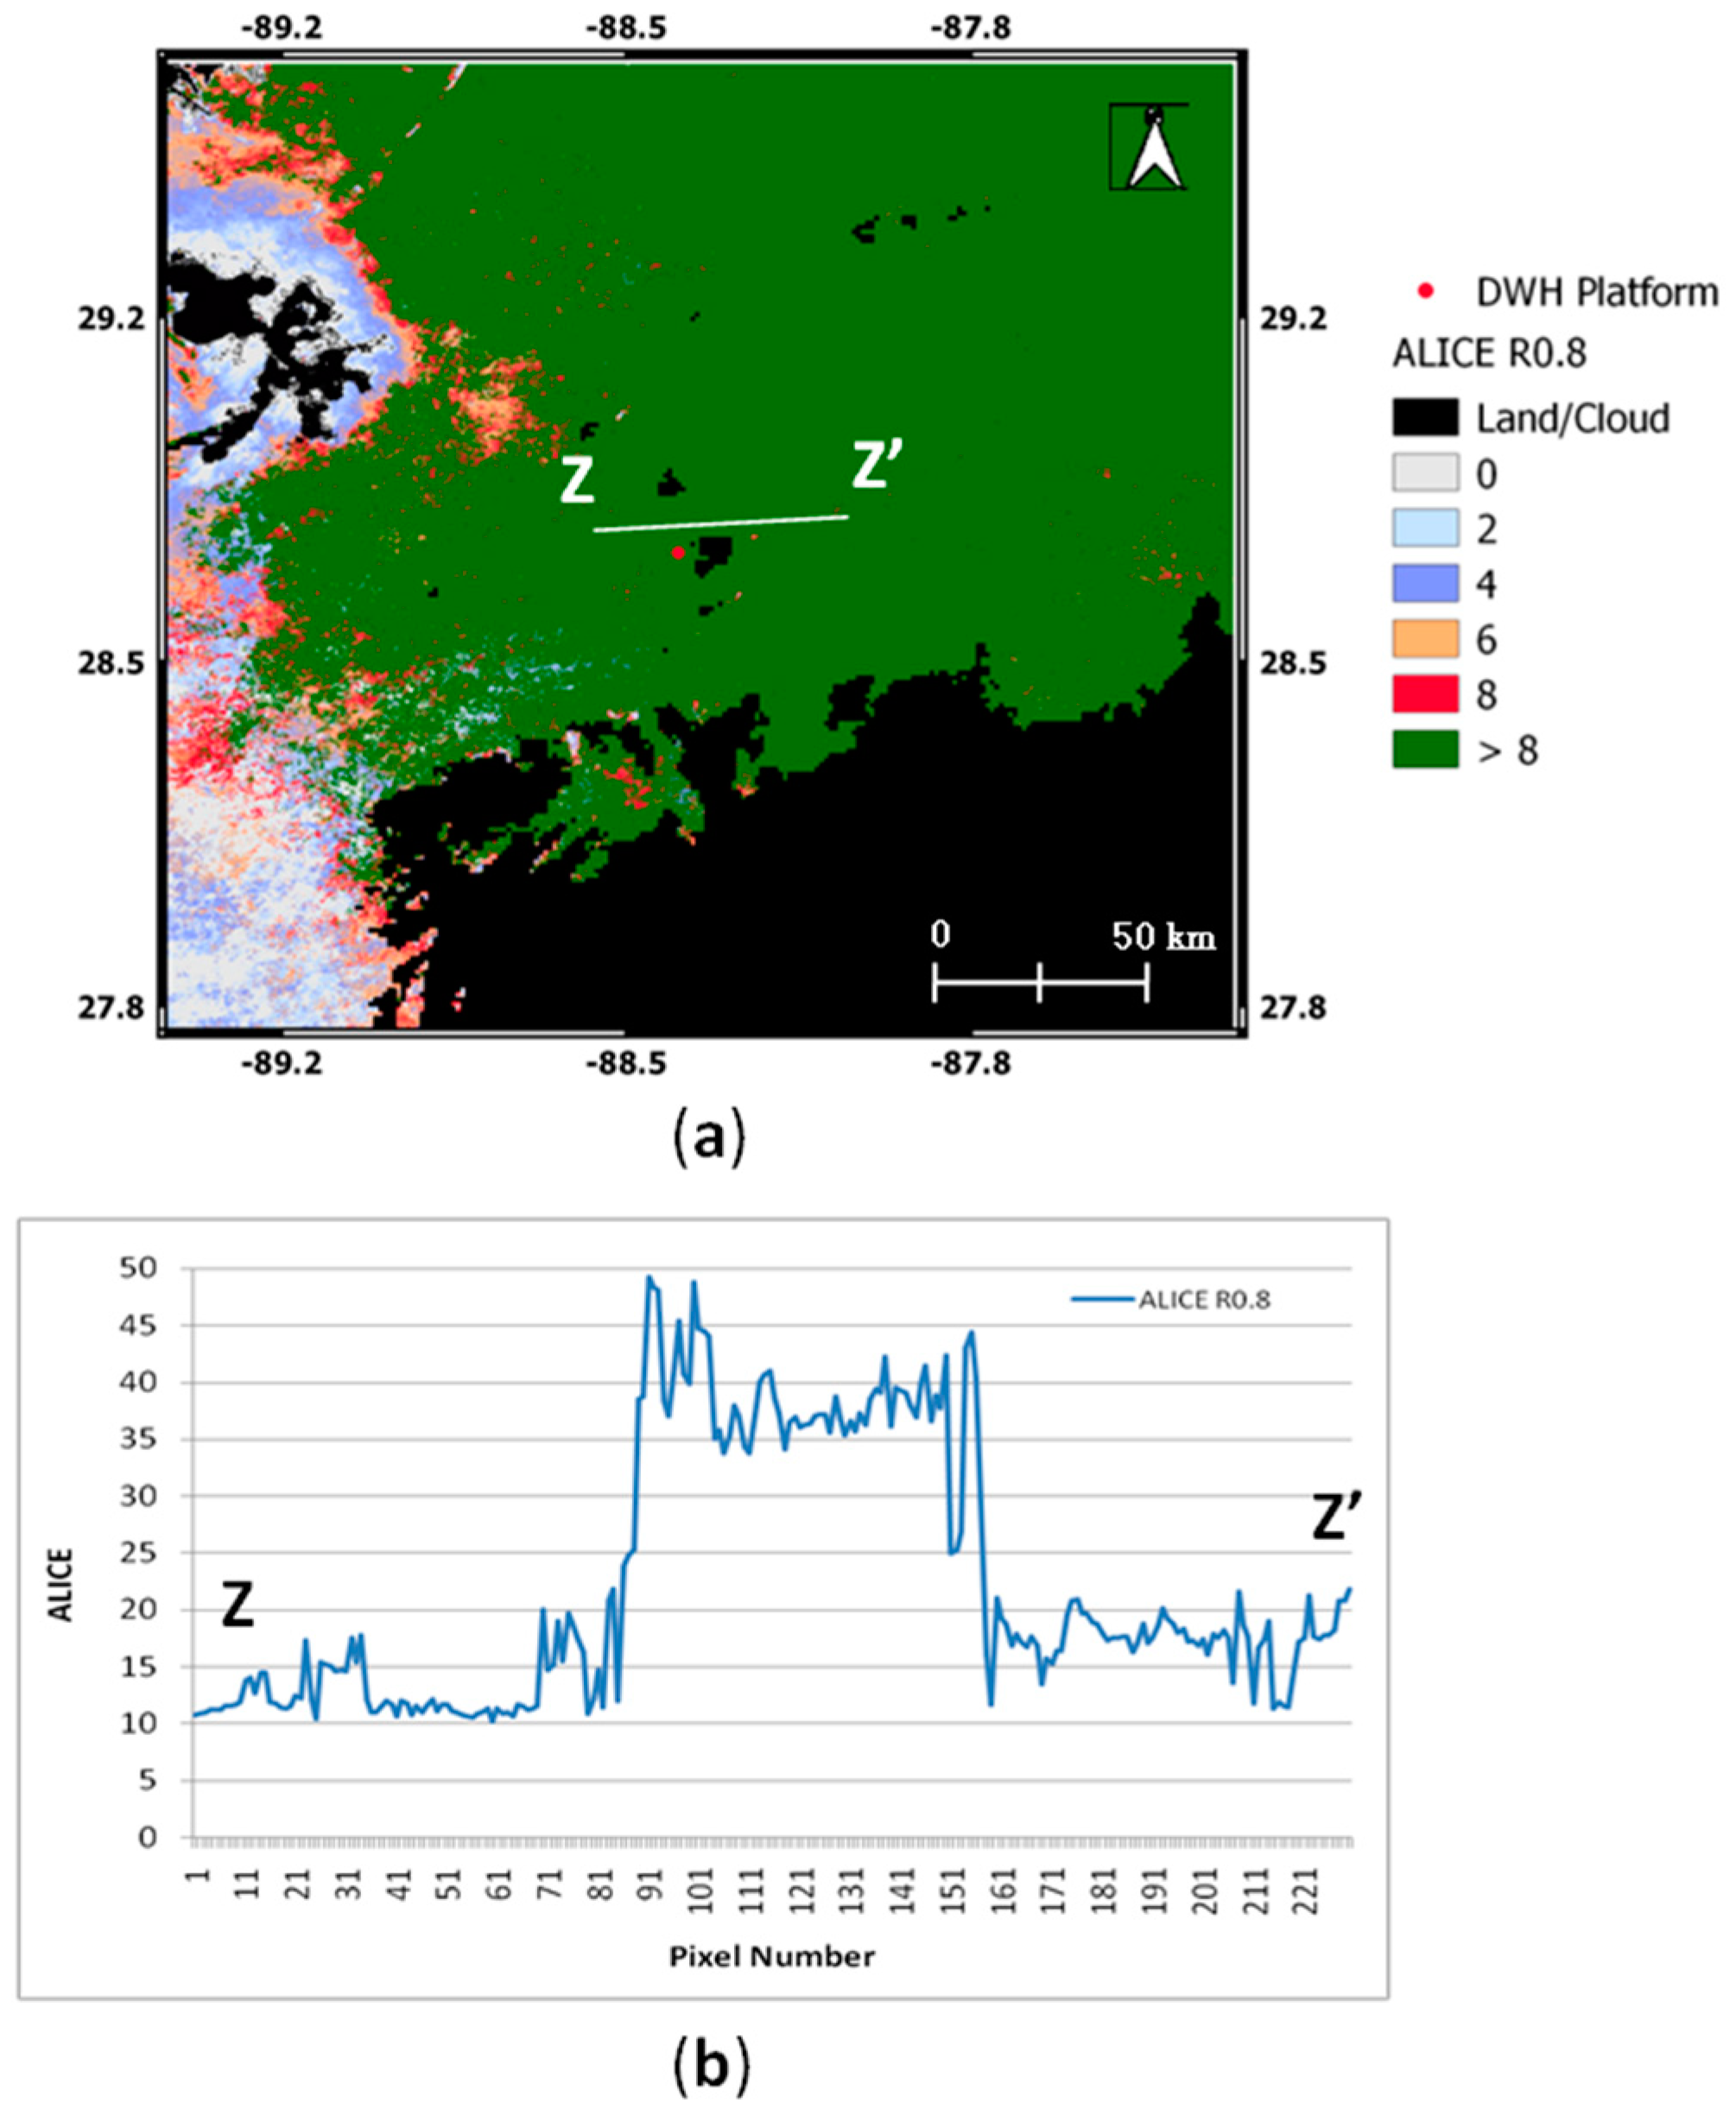
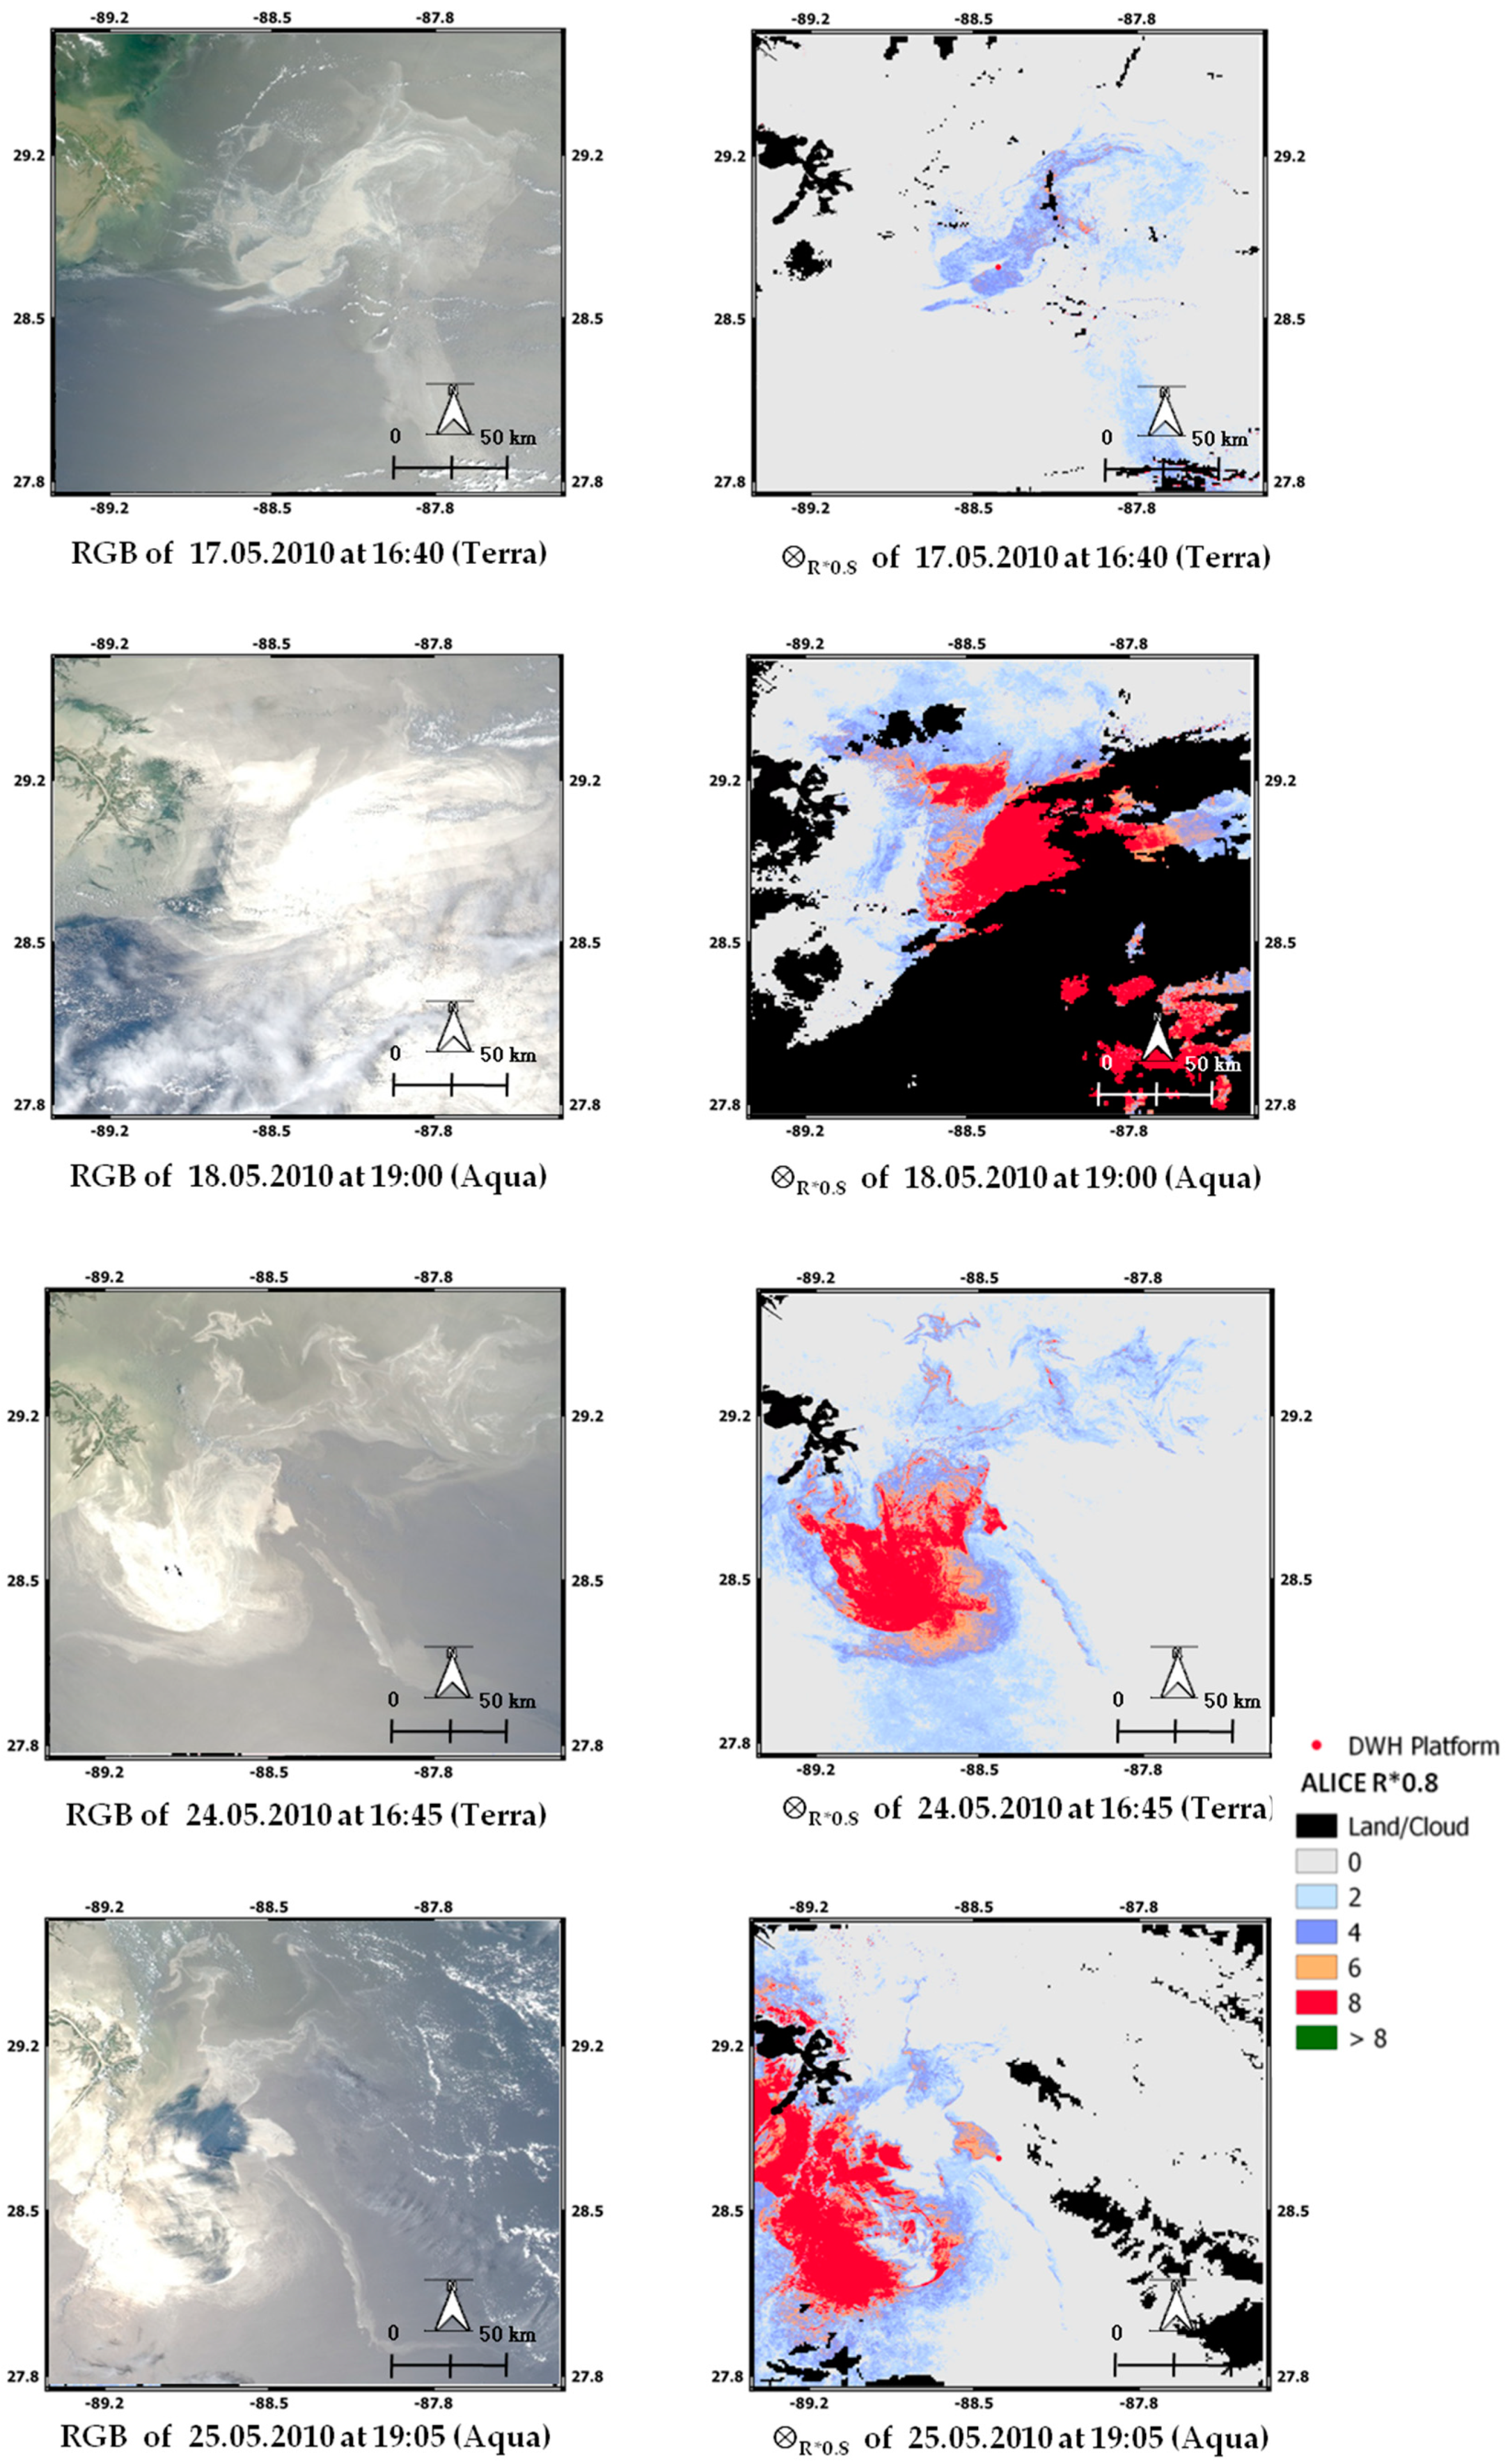
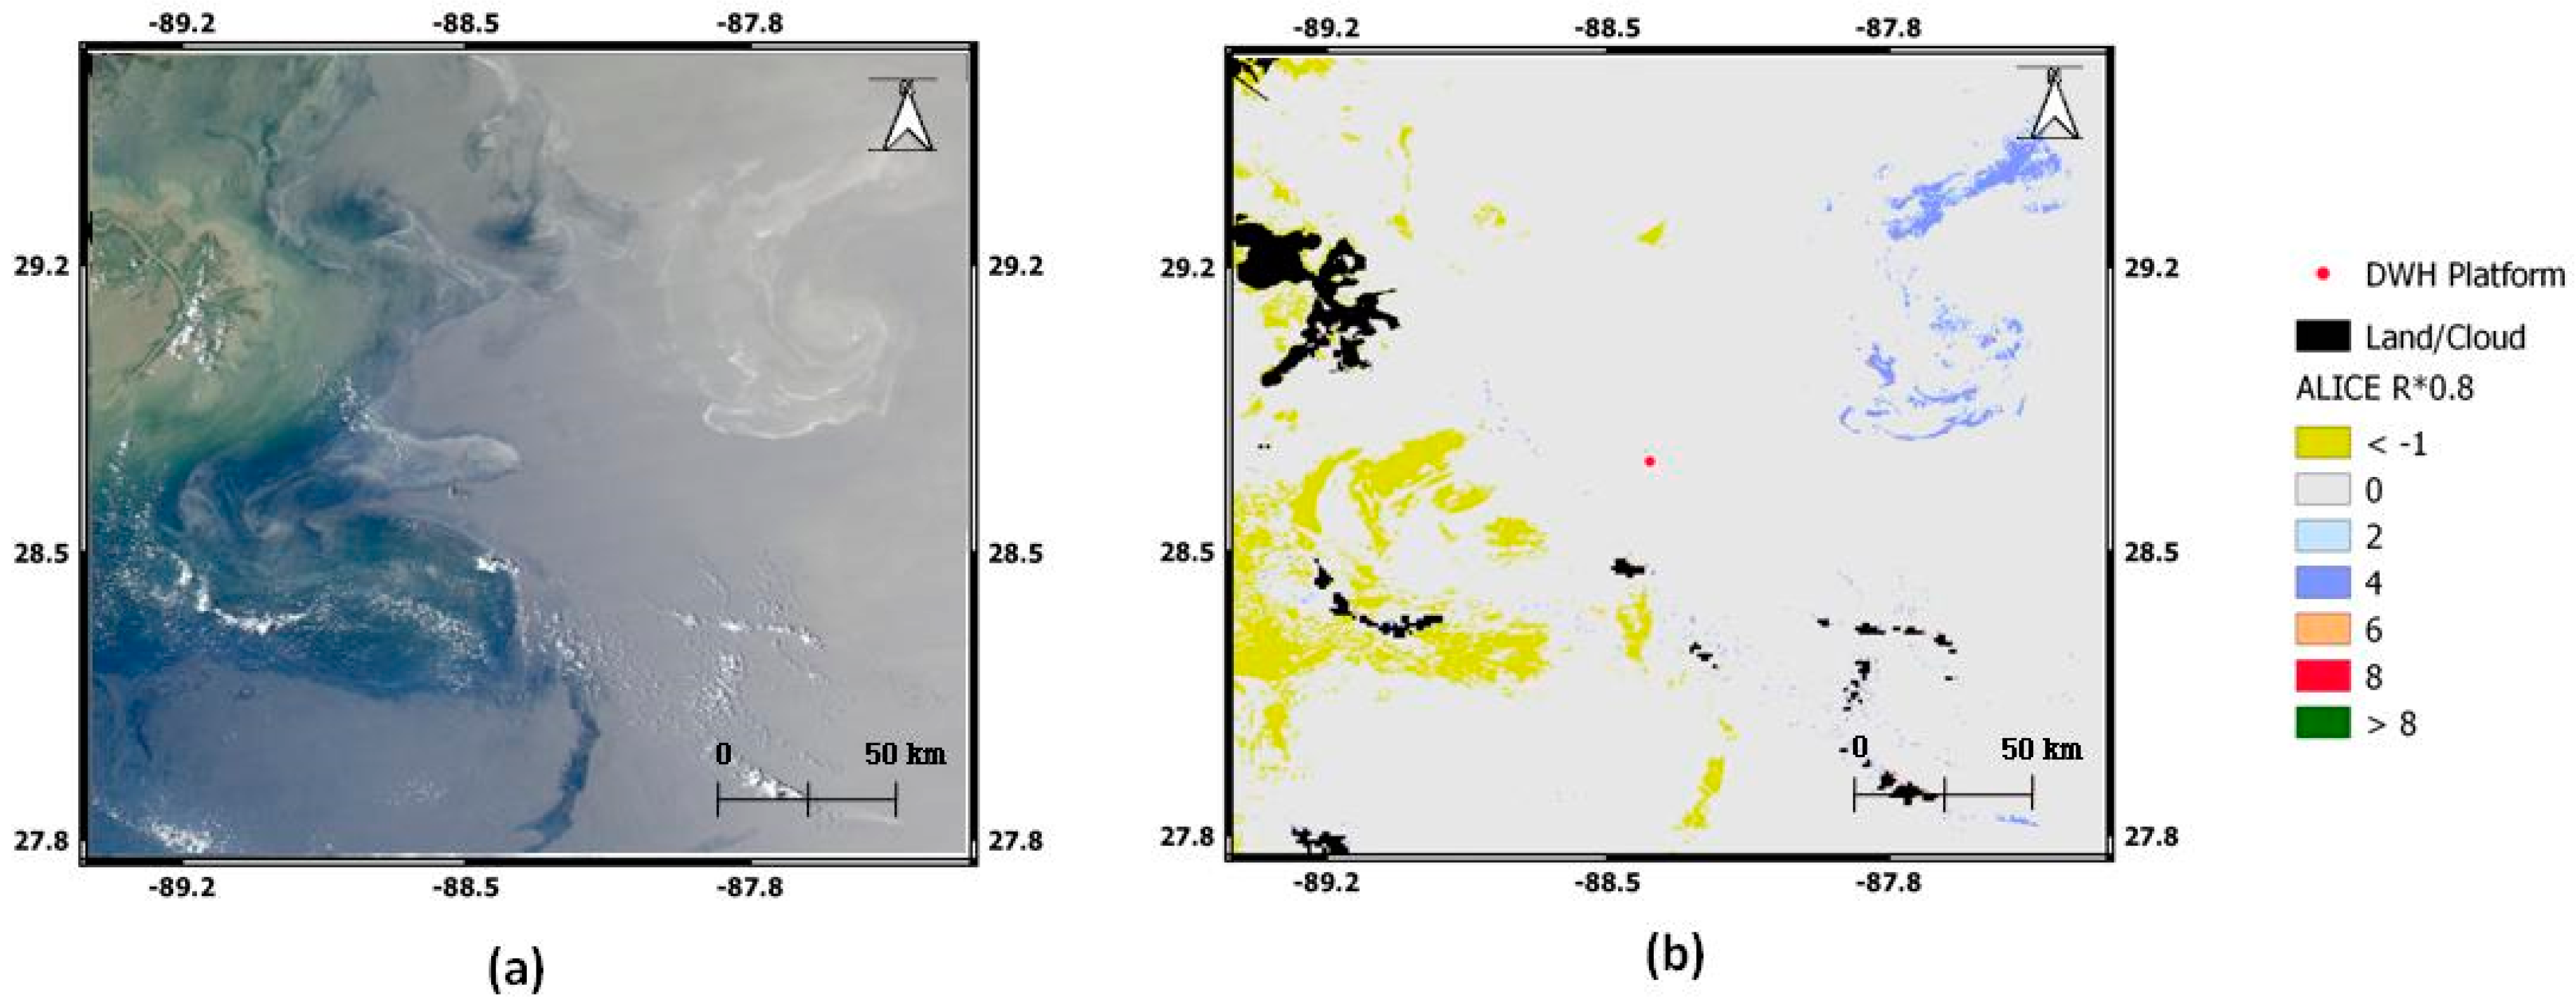
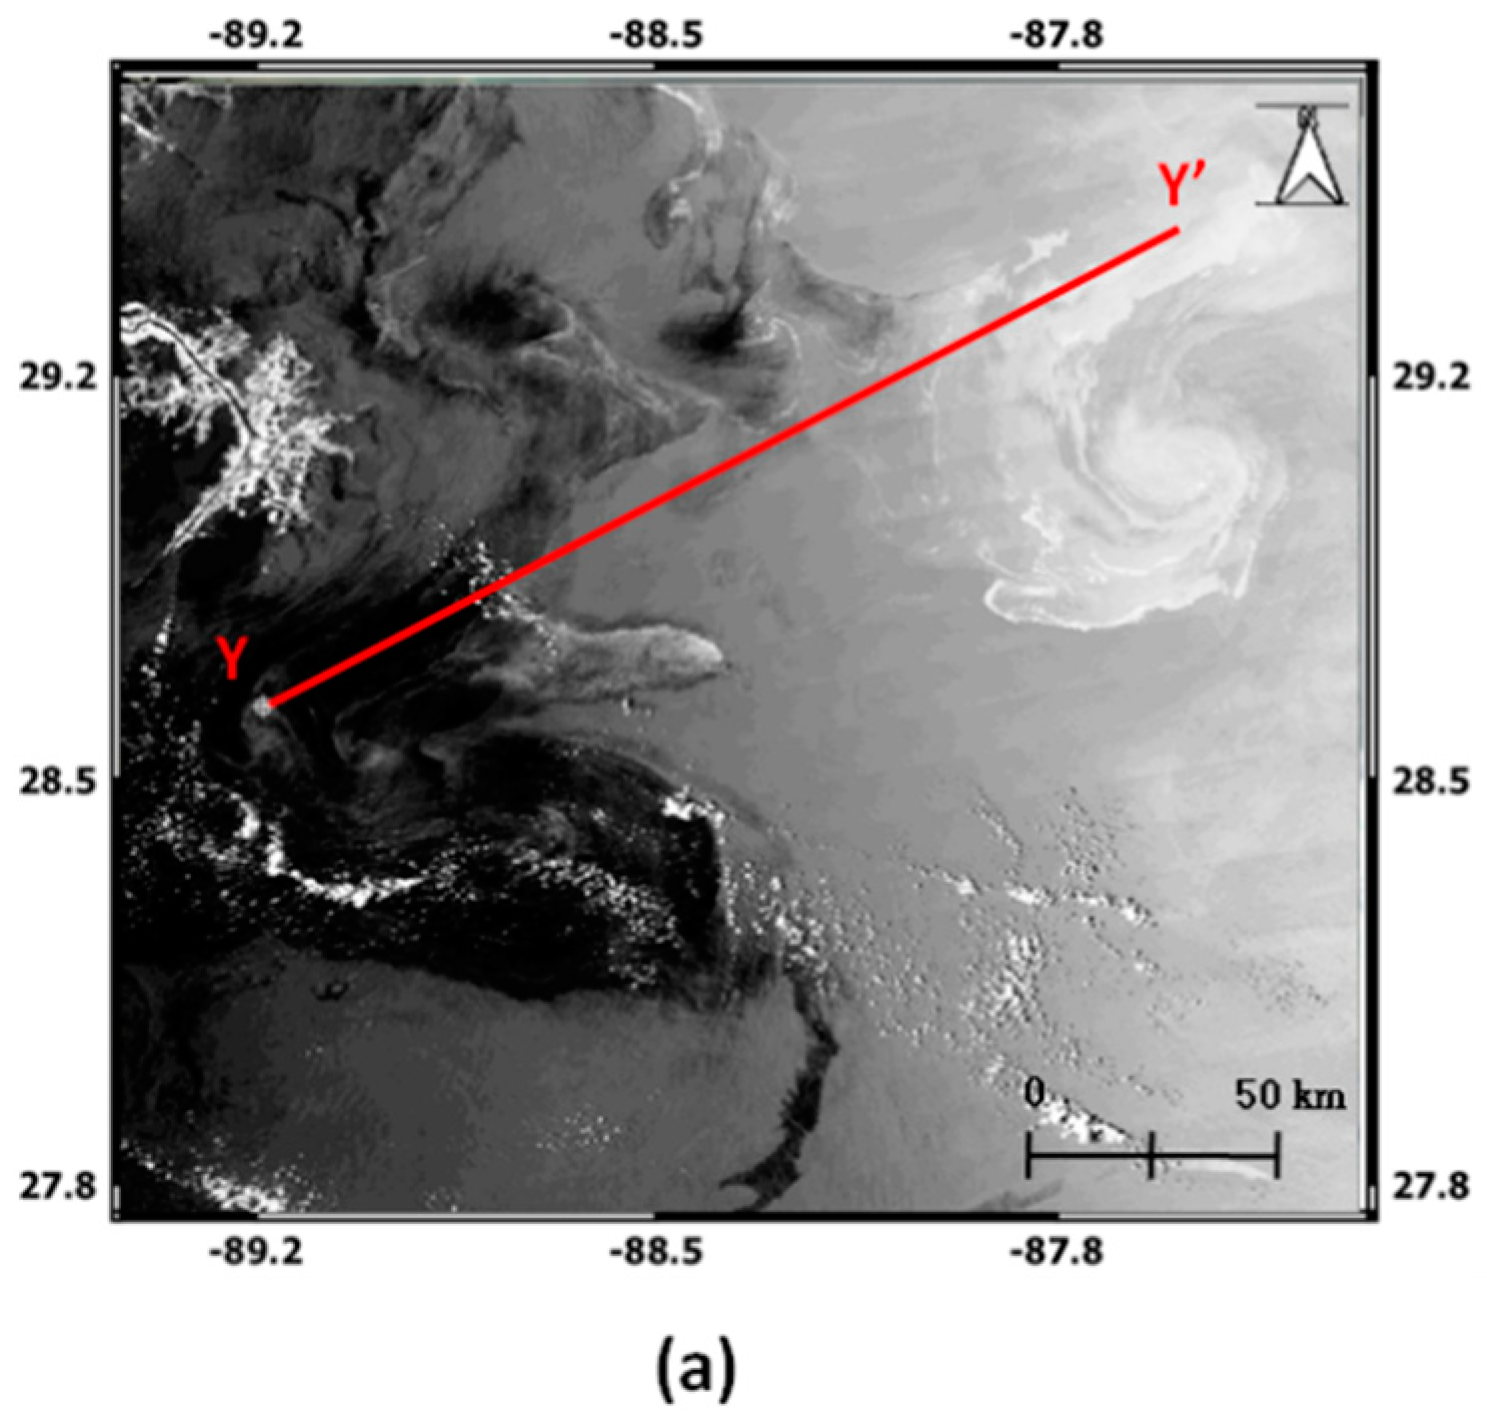
3.1. Standard RST-OIL Results
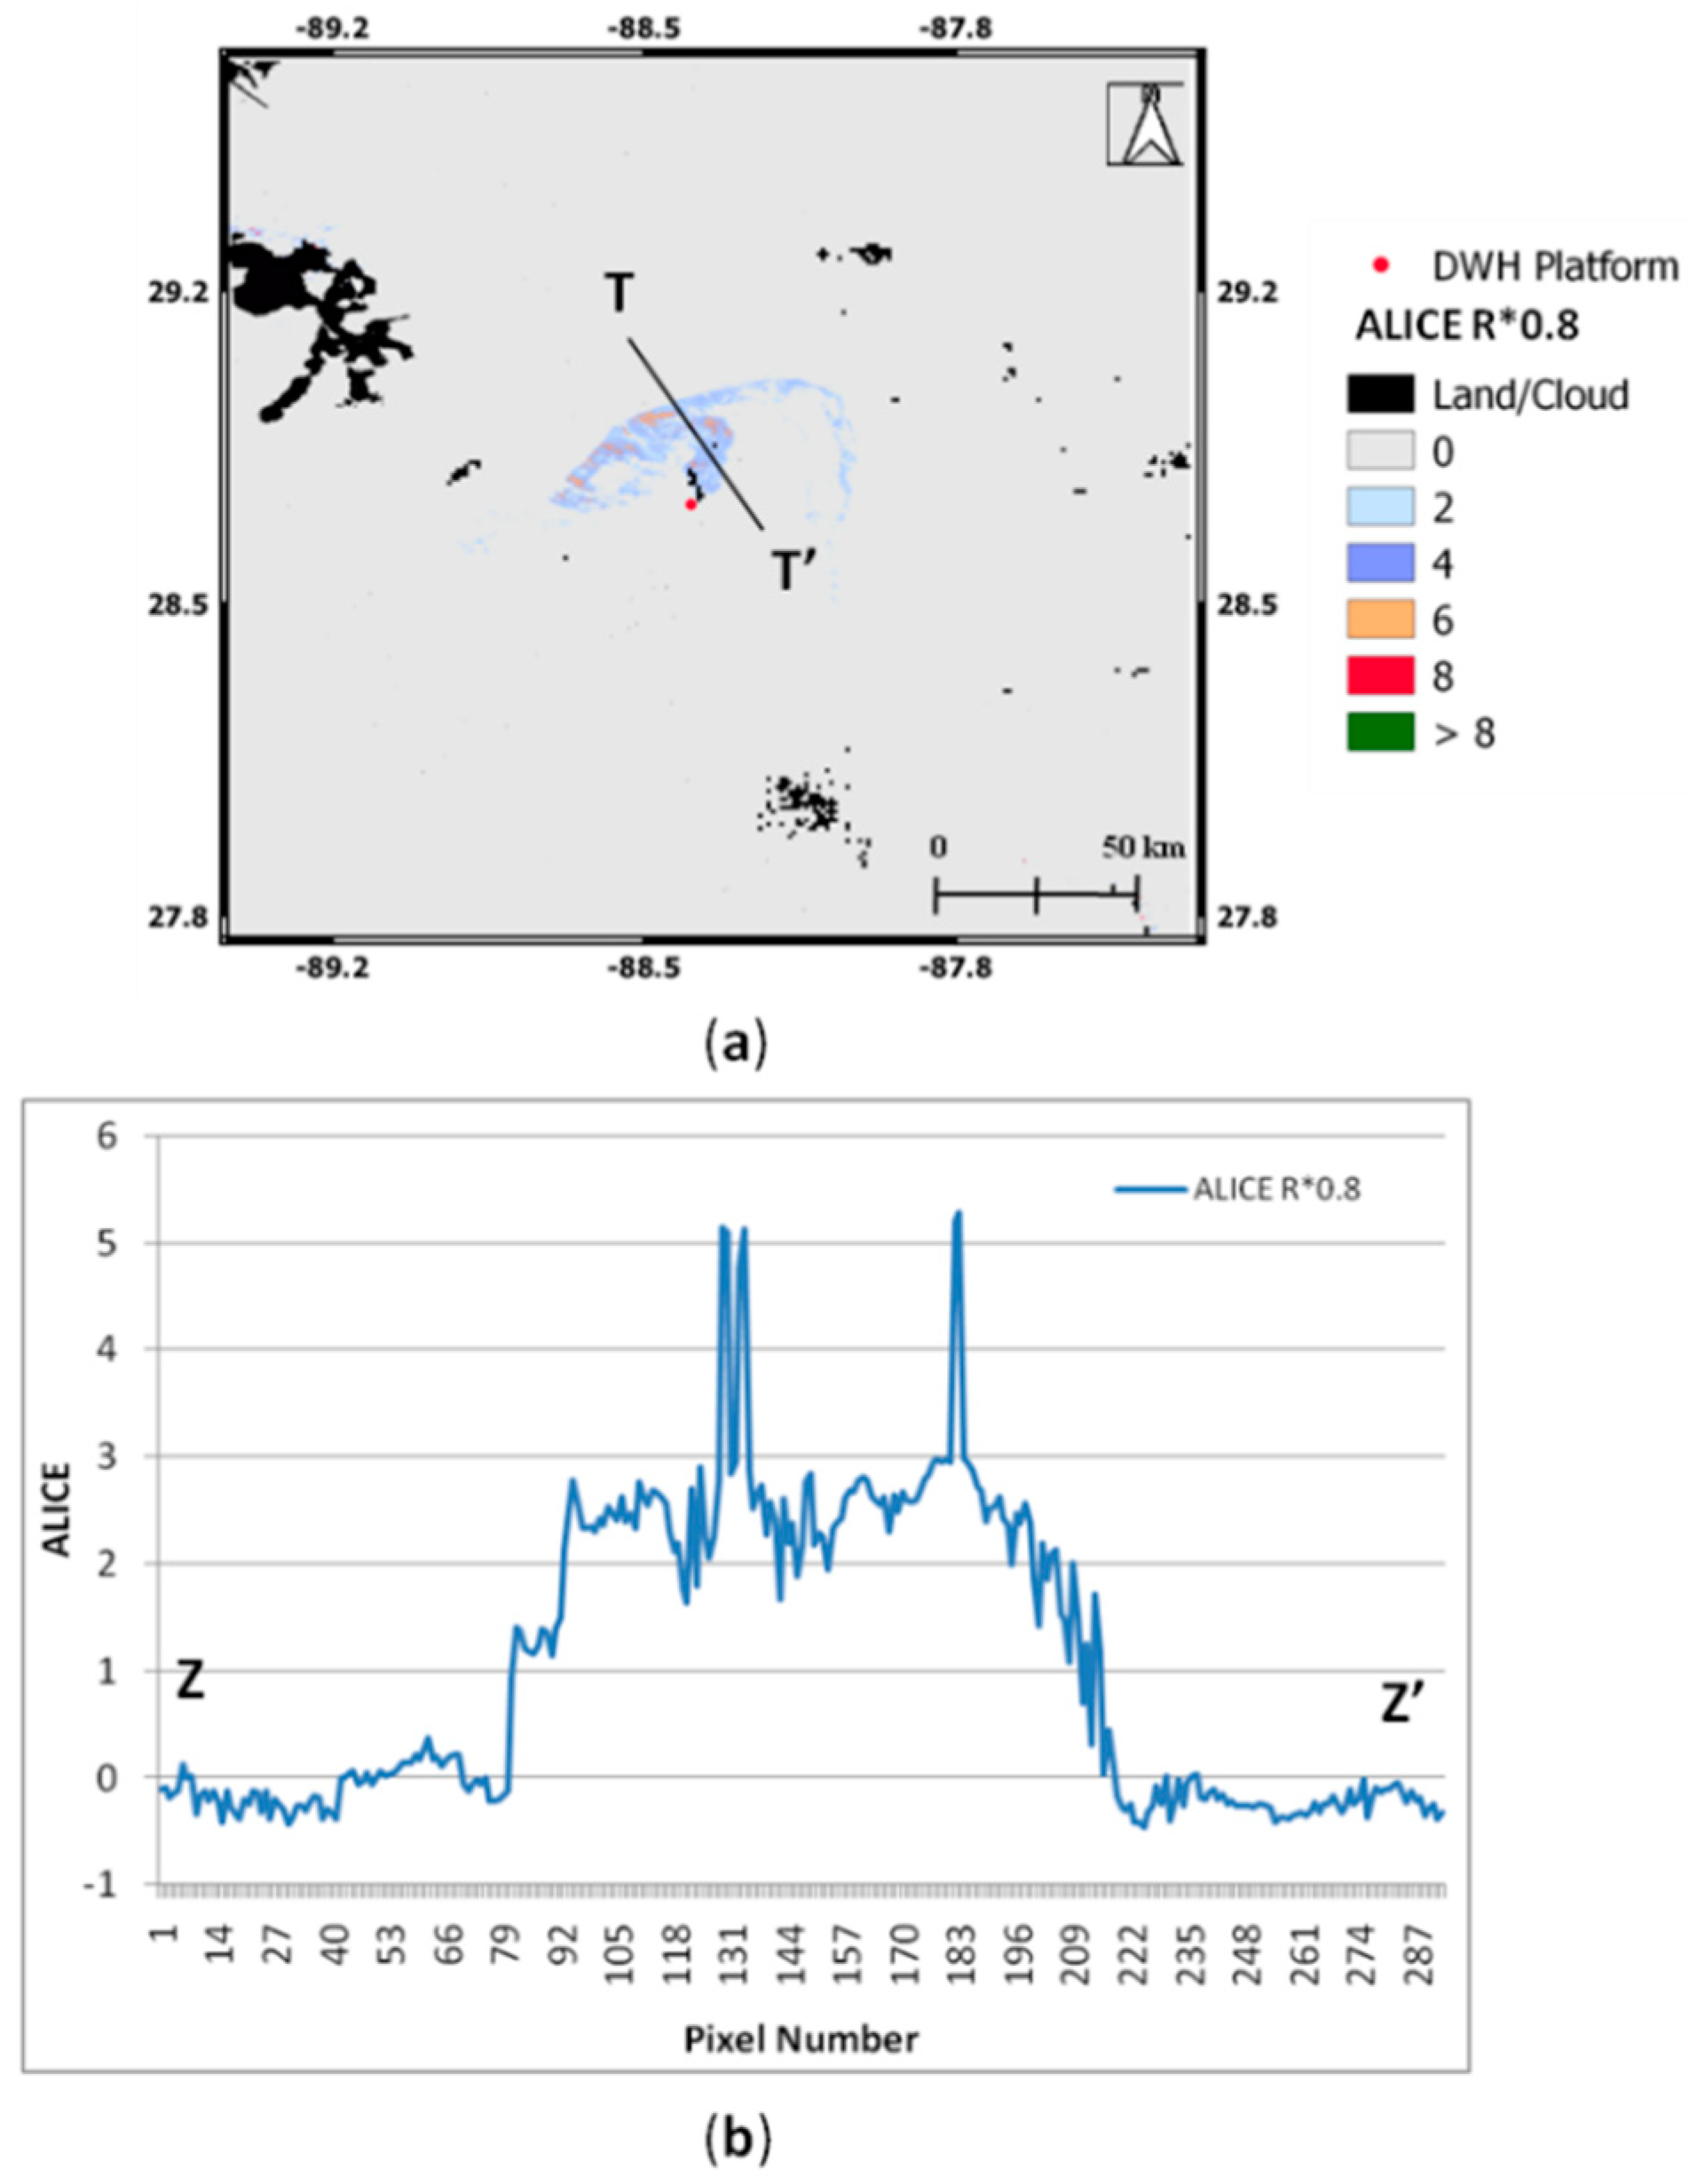
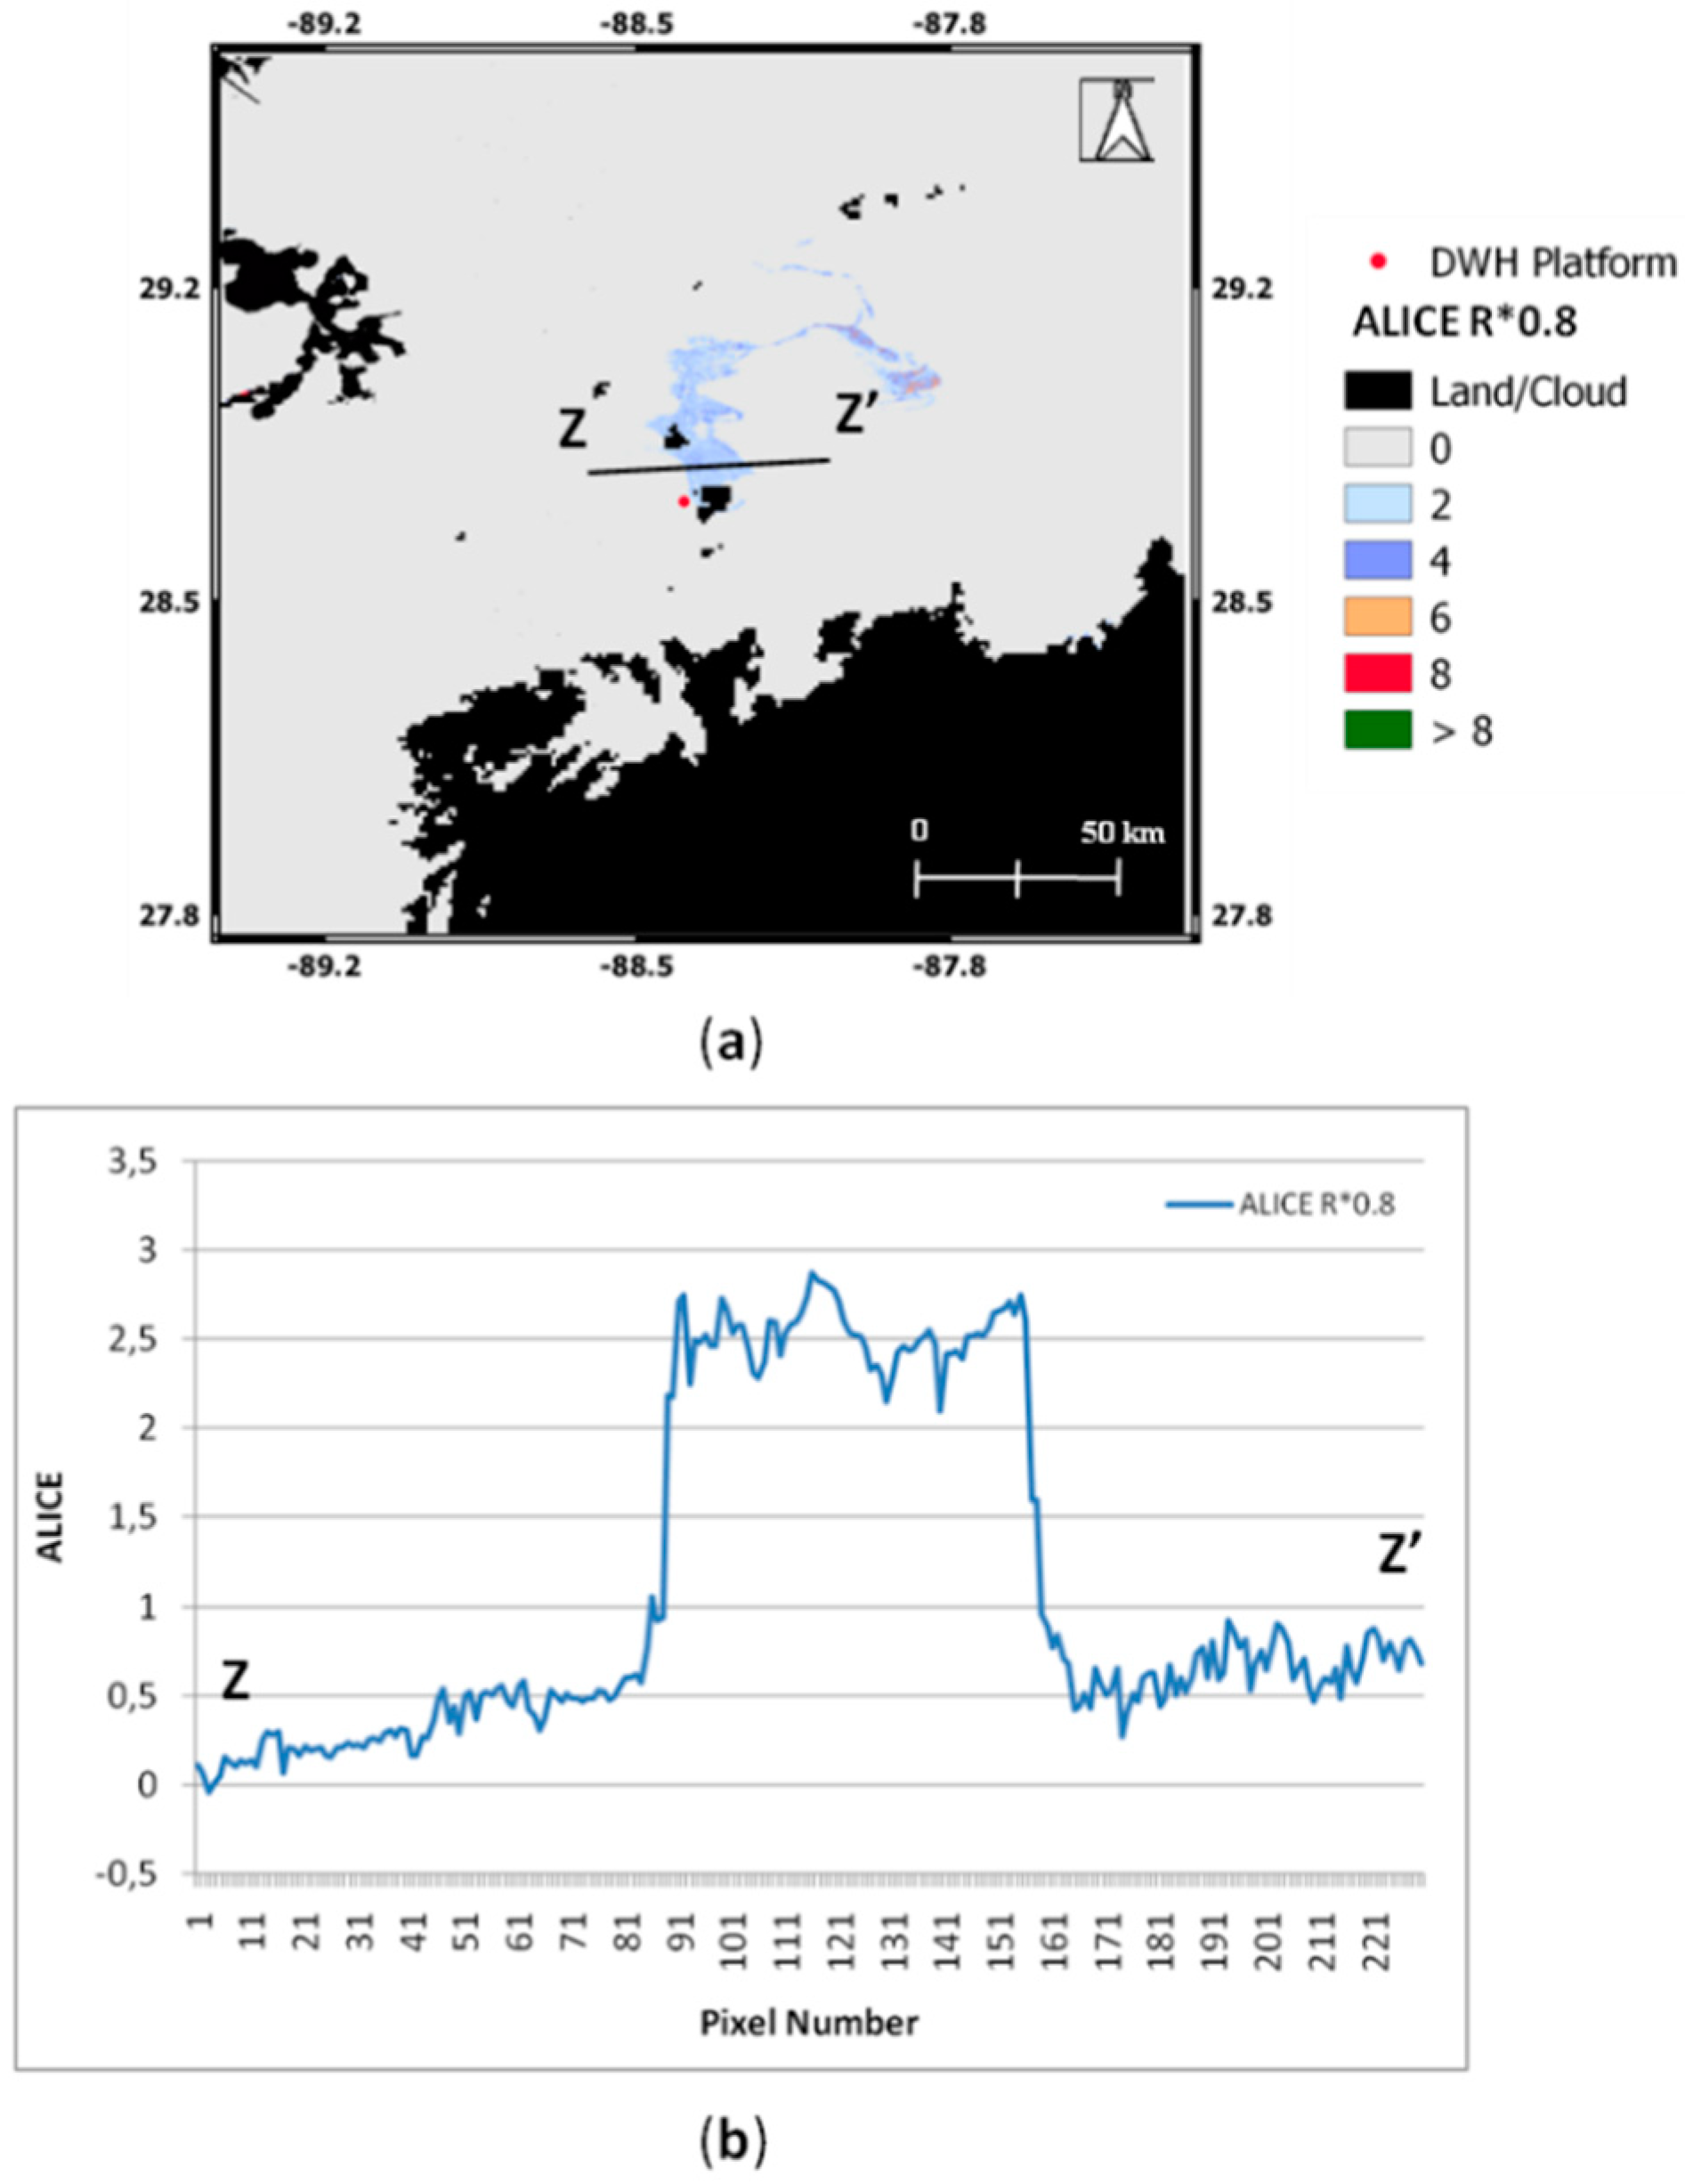
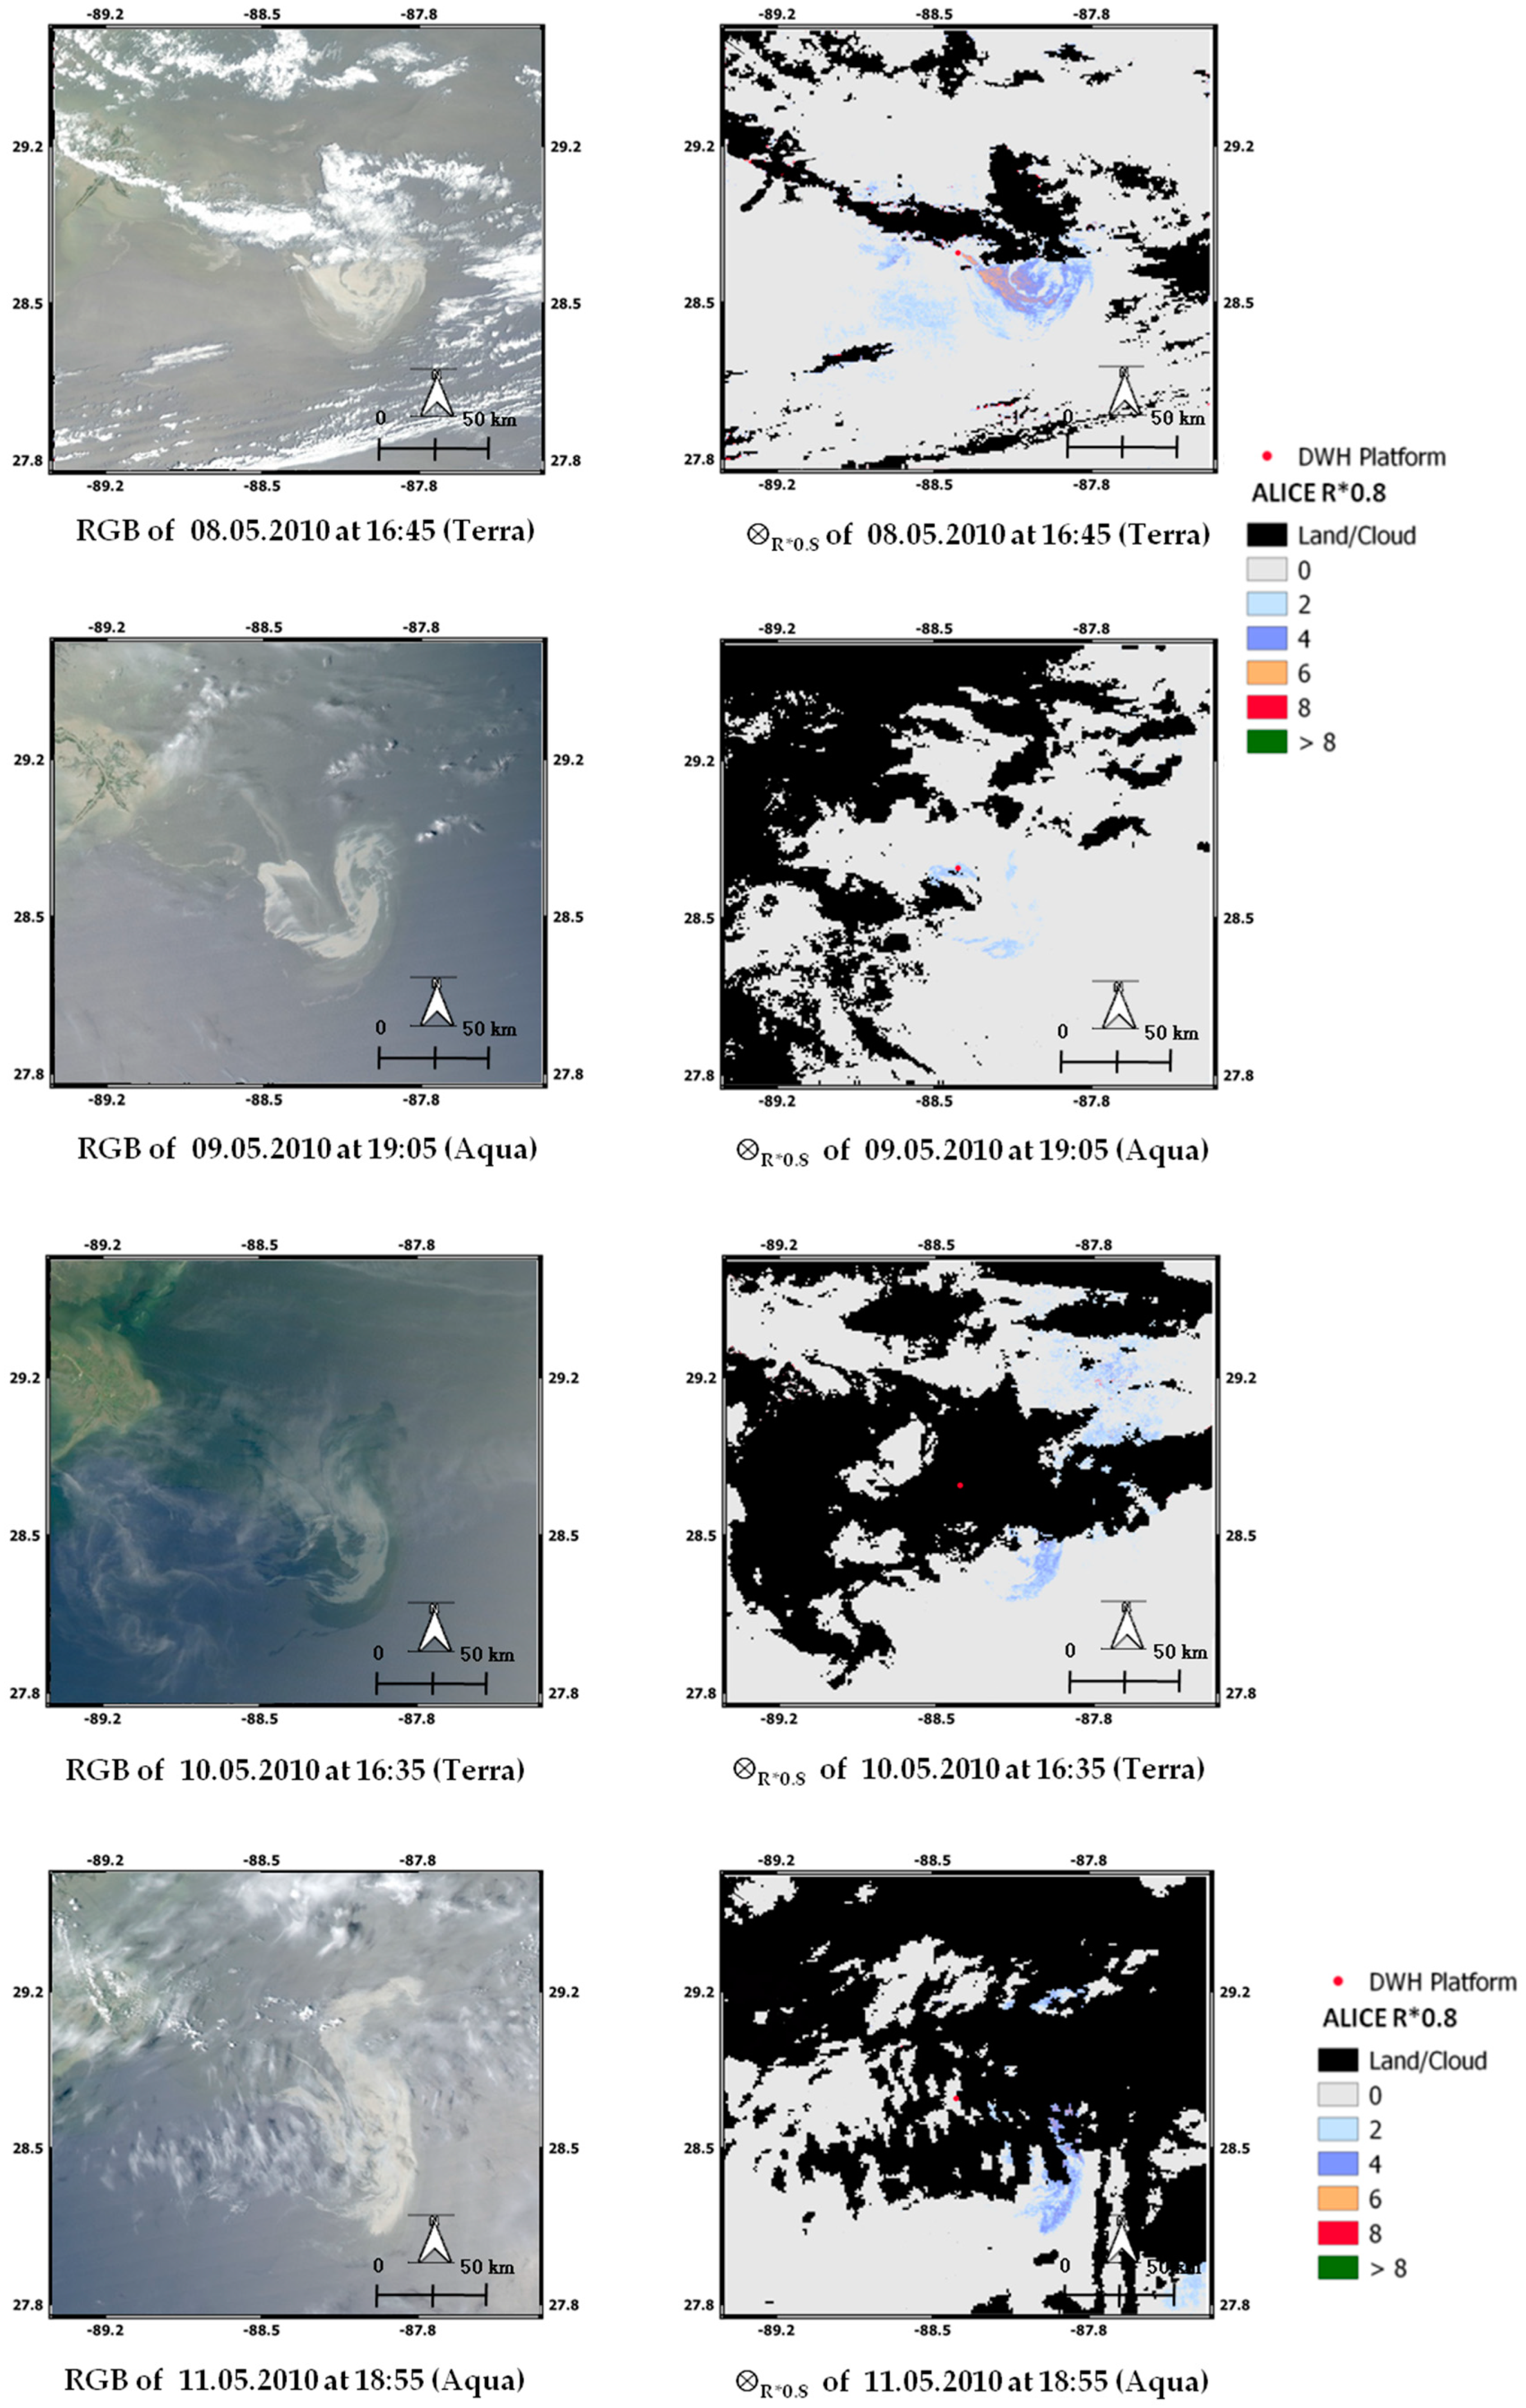
3.2. Results of the Advanced RST-OIL Configuration
4. Discussion
5. Conclusions
Author Contributions
Funding
Conflicts of Interest
References
- Global Marine Oil Pollution Information Gateway Web Site. Available online: http://oils.gpa.unep.org/facts/sources.htm (accessed on 9 September 2019).
- National Research Council. Oil in the Sea III: Inputs, Fates, and Effects; The National Academies Press: Washington, DC, USA, 2003. [Google Scholar]
- ITOPF Web Site. Available online: http://www.itopf.com/knowledge-resources/data-statistics/statistics/ (accessed on 9 September 2019).
- Ribotti, A.; Antognarelli, F.; Cucco, A.; Falcieri, M.; Fazioli, L.; Ferrarin, C.; Satta, A. An Operational Marine Oil Spill Forecasting Tool for the Management of Emergencies in the Italian Seas. J. Mar. Sci. Eng. 2019, 7, 1. [Google Scholar] [CrossRef]
- Fingas, M.; Brown, C.E. A Review of Oil Spill Remote Sensing. Sensors 2017, 18, 91. [Google Scholar] [CrossRef] [PubMed]
- Pavlakis, P.; Sieber, A.; Alexandry, S. Monitoring oil-spill pollution in the Mediterranean with ERS SAR. Oceanogr. Lit. Rev. 1997, 9, 1067. [Google Scholar]
- Fiscella, B.; Giancaspro, A.; Nirchio, F.; Pavese, P.; Trivero, P. Oil spill detection using marine SAR images. Int. J. Remote Sens. 2000, 21, 3561–3566. [Google Scholar] [CrossRef]
- De Miranda, F.P.; Marmol, A.M.Q.; Pedroso, E.C.; Beisl, C.H.; Welgan, P.; Morales, L.M. Analysis of RADARSAT-1 data for offshore monitoring activities in the Cantarell Complex, Gulf of Mexico, using the unsupervised semivariogram textural classifier (USTC). Can. J. Remote Sens. 2004, 30, 424–436. [Google Scholar] [CrossRef]
- Brekke, C.; Solberg, A.H.S. Review on Oil spill detection by satellite remote sensing. Remote Sens. Environ. 2005, 95, 1–13. [Google Scholar] [CrossRef]
- Ferraro, G.; Bernardini, A.; David, M.; Meyer-Roux, S.; Muellenhoff, O.; Perkovic, M.; Tarchi, D.; Topouzelis, K.; Topouzelis, K. Towards an operational use of space imagery for oil pollution monitoring in the Mediterranean basin: A demonstration in the Adriatic Sea. Mar. Pollut. Bull. 2007, 54, 403–422. [Google Scholar] [CrossRef]
- Akkartal, A.; Sunar, F. The usage of RADAR images in oil spill detection. Int. Arch. Photogramm. Remote Sens. Spat. Inf. Sci. 2008, 37, 8. [Google Scholar]
- Marghany, M. Utilization of a genetic algorithm for the automatic detection of oil spill from RADARSAT-2 SAR satellite data. Mar. Pollut. Bull. 2014, 89, 20–29. [Google Scholar] [CrossRef]
- Agenzia Spaziale Italiana. System Description & User Guide. COSMO-SkyMed. Available online: http://www.cosmo-skymed.it/docs/ASI-CSM-ENG-RS-093-A-CSKSysDescriptionAndUserGuide.pdf (accessed on 9 September 2019).
- Cross, A. Monitoring marine oil pollution using AVHRR data: Observations off the coast of Kuwait and Saudi Arabia during January 1991. Int. J. Remote Sens. 1992, 13, 781–788. [Google Scholar] [CrossRef]
- Hu, C.; Müller-Karger, F.E.; Taylor, C.; Myhre, D.; Murch, B.; Odriozola, A.L.; Godoy, G.; Muller-Karger, F.E. MODIS detects oil spills in Lake Maracaibo, Venezuela. Eos Trans. Am. Geophys. Union 2003, 84, 313. [Google Scholar] [CrossRef]
- Howari, F.M. Investigation of Hydrocarbon Pollution in the Vicinity of United Arab Emirates Coasts Using Visible and Near Infrared Remote Sensing Data. J. Coast. Res. 2004, 204, 1089–1095. [Google Scholar] [CrossRef]
- Shi, L.; Zhang, X.; Seielstad, G.; Zhao, C.; He, M.-X.; Shi, L. Oil Spill Detection by MODIS Images using Fuzzy Cluster and Texture Feature Extraction. In Proceedings of the OCEANS 2007—Europe, Aberdeen, UK, 18–21 June 2007; pp. 1–5. [Google Scholar]
- Dessì, F.; Melis, M.T.; Naitza, L.; Marini, A. MODIS data processing for coastal and marine environment monitoring: A study on anomaly detection and evolution in gulf of Cagliari (Sardinia-Italy). Int. Arch. Photogramm. Remote Sens. Spat. Inf. Sci. 2008, 37-B8, 695–698. [Google Scholar]
- Etellisi, E.A.; Deng, Y. Oil spill detection: Imaging system modeling and advanced image processing using optimized SDC algorithm. Signal Image Video Process. 2014, 8, 1405–1419. [Google Scholar] [CrossRef]
- Maianti, P.; Rusmini, M.; Tortini, R.; Via, G.D.; Frassy, F.; Marchesi, A.; Nodari, F.R.; Gianinetto, M. Monitoring large oil slick dynamics with moderate resolution multispectral satellite data. Nat. Hazards 2014, 73, 473–492. [Google Scholar] [CrossRef]
- Zhao, J.; Temimi, M.; Ghedira, H.; Hu, C. Exploring the potential of optical remote sensing for oil spill detection in shallow coastal waters—A case study in the Arabian Gulf. Opt. Express 2014, 22, 13755–13772. [Google Scholar] [CrossRef]
- Laneve, G.; Luciani, R. Developing a satellite optical sensor based automatic system for detecting and monitoring oil spills. In Proceedings of the 2015 IEEE 15th International Conference on Environment and Electrical Engineering (EEEIC), Rome, Italy, 10–13 June 2015; pp. 1653–1658. [Google Scholar]
- Pisano, A.; Bignami, F.; Santoleri, R. Oil Spill Detection in Glint-Contaminated Near-Infrared MODIS Imagery. Remote Sens. 2015, 7, 1112–1134. [Google Scholar] [CrossRef]
- Zhao, J.; Temimi, M.; Al Azhar, M.; Ghedira, H. Satellite-Based Tracking of Oil Pollution in the Arabian Gulf and the Sea of Oman. Can. J. Remote Sens. 2015, 41, 113–125. [Google Scholar] [CrossRef]
- Asanuma, I.; Muneyama, K.; Sasaki, Y.; Iisaka, J.; Yasuda, Y.; Emori, Y. Satellite thermal observation of oil slicks on the persian gulf. Remote Sens. Environ. 1986, 19, 171–186. [Google Scholar] [CrossRef]
- Borzelli, G.; Ciappa, A.; Ulivieri, C.; Antonelli, G.; Laneve, G. A new perspective on oil slick detection from space by NOAA satellites. Int. J. Remote Sens. 1996, 17, 1279–1292. [Google Scholar] [CrossRef]
- Casciello, D.; Lacava, T.; Pergola, N.; Tramutoli, V. Robust Satellite Techniques (RST)for oil spill detection and monitoring using AVHRR Thermal Infrared bands. Int. J. Remote Sens. 2011, 32, 4107–4129. [Google Scholar] [CrossRef]
- Grimaldi, C.S.L.; Coviello, I.; Lacava, T.; Pergola, N.; Tramutoli, V.; Liu, Y.; MacFadyen, A.; Ji, Z.-G.; Weisberg, R.H. A New RST-Based Approach for Continuous Oil Spill Detection in TIR Range: The Case of the Deepwater Horizon Platform in the Gulf of Mexico. In Monitoring and Modeling the Deepwater Horizon Oil Spill: A Record-Breaking Enterprise; American Geophysical Union (AGU): Washington, DC, USA, 2011; Volume 195, pp. 19–31. [Google Scholar]
- Salisbury, J.W.; D’Aria, D.M.; Sabins, F.F. Thermal infrared remote sensing of crude oil slicks. Remote Sens. Environ. 1993, 45, 225–231. [Google Scholar] [CrossRef]
- Jha, M.N.; Levy, J.; Gao, Y. Advances in Remote Sensing for Oil Spill Disaster Management: State-of-the-Art Sensors Technology for Oil Spill Surveillance. Sensors 2008, 8, 236–255. [Google Scholar] [CrossRef] [PubMed]
- Otremba, Z.; Piskozub, J. Modelling of the optical contrast of an oil film on a sea surface. Opt. Express 2001, 9, 411–416. [Google Scholar] [CrossRef]
- Otremba, Z.; Piskozub, J. Modeling the remotely sensed optical contrast caused by oil suspended in the sea water column. Opt. Express 2003, 11, 2–6. [Google Scholar] [CrossRef]
- Haule, K.; Freda, W.; Darecki, M.; Toczek, H. Possibilities of optical remote sensing of dispersed oil in coastal waters. Estuar. Coast. Shelf Sci. 2017, 195, 76–87. [Google Scholar] [CrossRef]
- Otremba, Z. Oil Droplet Clouds Suspended in the Sea: Can They Be Remotely Detected? Remote Sens. 2016, 8, 857. [Google Scholar] [CrossRef]
- Tramutoli, V. Robust AVHRR techniques (RAT) for environmental monitoring: Theory and applications. Remote Sens. 1998, 3496, 101–113. [Google Scholar]
- Casciello, D.; Grimaldi, C.S.L.; Coviello, I.; Lacava, T.; Pergola, N.; Tramutoli, V. A Robust Satellite Techniques for oil spill detection and monitoring in the optical range. In Global Monitoring for Security and Stability (GMOSS), JRC Scientific and Technical Reports; EUR 23033 EN; Zeug, G., Pesaresi, M., Eds.; OPOCE: Luxembourg, 2007; pp. 294–305. [Google Scholar] [CrossRef]
- Grimaldi, C.S.L.; Casciello, D.; Coviello, I.; Lacava, T.; Pergola, N.; Tramutoli, V. An improved RST approach for timely alert and Near Real Time monitoring of oil spill disasters by using AVHRR data. Nat. Hazards Earth Syst. Sci. 2011, 11, 1281–1291. [Google Scholar] [CrossRef]
- Lacava, T.; Ciancia, E.; Coviello, I.; Di Polito, C.; Grimaldi, C.S.L.; Pergola, N.; Satriano, V.; Temimi, M.; Zhao, J.; Tramutoli, V. A MODIS-Based Robust Satellite Technique (RST) for Timely Detection of Oil Spilled Areas. Remote Sens. 2017, 9, 128. [Google Scholar] [CrossRef]
- Liu, Y.; MacFadyen, A.; Ji, Z.-G.; Weisberg, R.H. (Eds.) Monitoring and Modeling the Deepwater Horizon Oil Spill: A Record Breaking Enterprise; Geophysical Monograph Series; AGU: Washington, DC, USA, 2011; Volume 195, p. 271. [Google Scholar]
- NASA-LAADS DAAC Web. Available online: https://ladsweb.modaps.eosdis.nasa.gov/search/ (accessed on 9 September 2019).
- Di Polito, C.; Ciancia, E.; Coviello, I.; Doxaran, D.; Lacava, T.; Pergola, N.; Satriano, V.; Tramutoli, V. On the Potential of Robust Satellite Techniques Approach for SPM Monitoring in Coastal Waters: Implementation and Application over the Basilicata Ionian Coastal Waters Using MODIS-Aqua. Remote Sens. 2016, 8, 922. [Google Scholar] [CrossRef]
- Cuomo, V.; Filizzola, C.; Pergola, N.; Pietrapertosa, C.; Tramutoli, V. A self-sufficient approach for GERB cloudy radiance detection. Atmos. Res. 2004, 72, 39–56. [Google Scholar] [CrossRef]
- Jackson, C.R.; Alpers, W. The role of the critical angle in brightness reversals on sun glint images of the sea surface. J. Geophys. Res. Ocean. 2010, 115. [Google Scholar] [CrossRef]
- Garcia-Pineda, O.; Macdonald, I.R.; Li, X.; Jackson, C.R.; Pichel, W.G. Oil Spill Mapping and Measurement in the Gulf of Mexico with Textural Classifier Neural Network Algorithm (TCNNA). IEEE J. Sel. Top. Appl. Earth Obs. Remote Sens. 2013, 6, 2517–2525. [Google Scholar] [CrossRef]
- Hu, C.; Feng, L.; Holmes, J.; Swayze, G.A.; Leifer, I.; Melton, C.; García, O.; Macdonald, I.; Hess, M.; Muller-Karger, F.; et al. Remote sensing estimation of surface oil volume during the 2010 Deepwater Horizon oil blowout in the Gulf of Mexico: Scaling up AVIRIS observations with MODIS measurements. J. Appl. Remote Sens. 2018, 12, 026008. [Google Scholar] [CrossRef] [Green Version]
- Leifer, I.; Lehr, W.J.; Simecek-Beatty, D.; Bradley, E.; Clark, R.; Dennison, P.; Hu, Y.; Matheson, S.; Jones, C.E.; Holt, B.; et al. State of the art satellite and airborne marine oil spill remote sensing: Application to the BP Deepwater Horizon oil spill. Remote Sens. Environ. 2012, 124, 185–209. [Google Scholar] [CrossRef] [Green Version]
- Adamo, M.; De Carolis, G.; De Pasquale, V.; Pasquariello, G. Oil Spill Surveillance and Tracking with Combined use of SAR and Modis Imagery: A Case Study. In Proceedings of the 2006 IEEE International Symposium on Geoscience and Remote Sensing, Denver, CO, USA, 31 July–4 August 2006; pp. 1327–1330. [Google Scholar]
- Adamo, M.; De Carolis, G.; De Pasquale, V.; Pasquariello, G. Detection and tracking of oil slicks on sun-glittered visible and near infrared satellite imagery. Int. J. Remote Sens. 2009, 30, 6403–6427. [Google Scholar] [CrossRef]
- Hersbach, H.; Stoffelen, A.; De Haan, S. An improved C-band scatterometer ocean geophysical model function: Cmodj. Geophys. Res. Space Phys. 2007, 112. [Google Scholar] [CrossRef]
- ERMA Web Site. Available online: https://erma.noaa.gov/gulfofmexico/erma.html#/layers=3+17945+491+36355+36354+5328+482+18223+32680+32093+32957+32679+32211&x=-89.50988&y=29.80677&z=8&panel=layer (accessed on 9 September 2019).
- Gulf Spill Restoration Incident Overview. 2016. Available online: https://www.gulfspillrestoration.noaa.gov/sites/default/files/wp-content/uploads/Chapter-2_Incident-Overview_508.pdf (accessed on 9 September 2019).
- Liu, Y.; Weisberg, R.H.; Hu, C.; Zheng, L.; MacFadyen, A.; Ji, Z.-G. Trajectory Forecast as a Rapid Response to the Deepwater Horizon Oil Spill. In Monitoring and Modeling the Deepwater Horizon Oil Spill: A Record-Breaking Enterprise; American Geophysical Union (AGU): Washington, DC, USA, 2011; Volume 195, pp. 153–165. [Google Scholar]


© 2019 by the authors. Licensee MDPI, Basel, Switzerland. This article is an open access article distributed under the terms and conditions of the Creative Commons Attribution (CC BY) license (http://creativecommons.org/licenses/by/4.0/).
Share and Cite
Satriano, V.; Ciancia, E.; Lacava, T.; Pergola, N.; Tramutoli, V. Improving the RST-OIL Algorithm for Oil Spill Detection under Severe Sun Glint Conditions. Remote Sens. 2019, 11, 2762. https://doi.org/10.3390/rs11232762
Satriano V, Ciancia E, Lacava T, Pergola N, Tramutoli V. Improving the RST-OIL Algorithm for Oil Spill Detection under Severe Sun Glint Conditions. Remote Sensing. 2019; 11(23):2762. https://doi.org/10.3390/rs11232762
Chicago/Turabian StyleSatriano, Valeria, Emanuele Ciancia, Teodosio Lacava, Nicola Pergola, and Valerio Tramutoli. 2019. "Improving the RST-OIL Algorithm for Oil Spill Detection under Severe Sun Glint Conditions" Remote Sensing 11, no. 23: 2762. https://doi.org/10.3390/rs11232762
APA StyleSatriano, V., Ciancia, E., Lacava, T., Pergola, N., & Tramutoli, V. (2019). Improving the RST-OIL Algorithm for Oil Spill Detection under Severe Sun Glint Conditions. Remote Sensing, 11(23), 2762. https://doi.org/10.3390/rs11232762