Assessment of Spatio-Temporal Patterns of Black Spruce Bud Phenology across Quebec Based on MODIS-NDVI Time Series and Field Observations

 ,
,  , , and
Abstract
1. Introduction
2. Materials and Methods
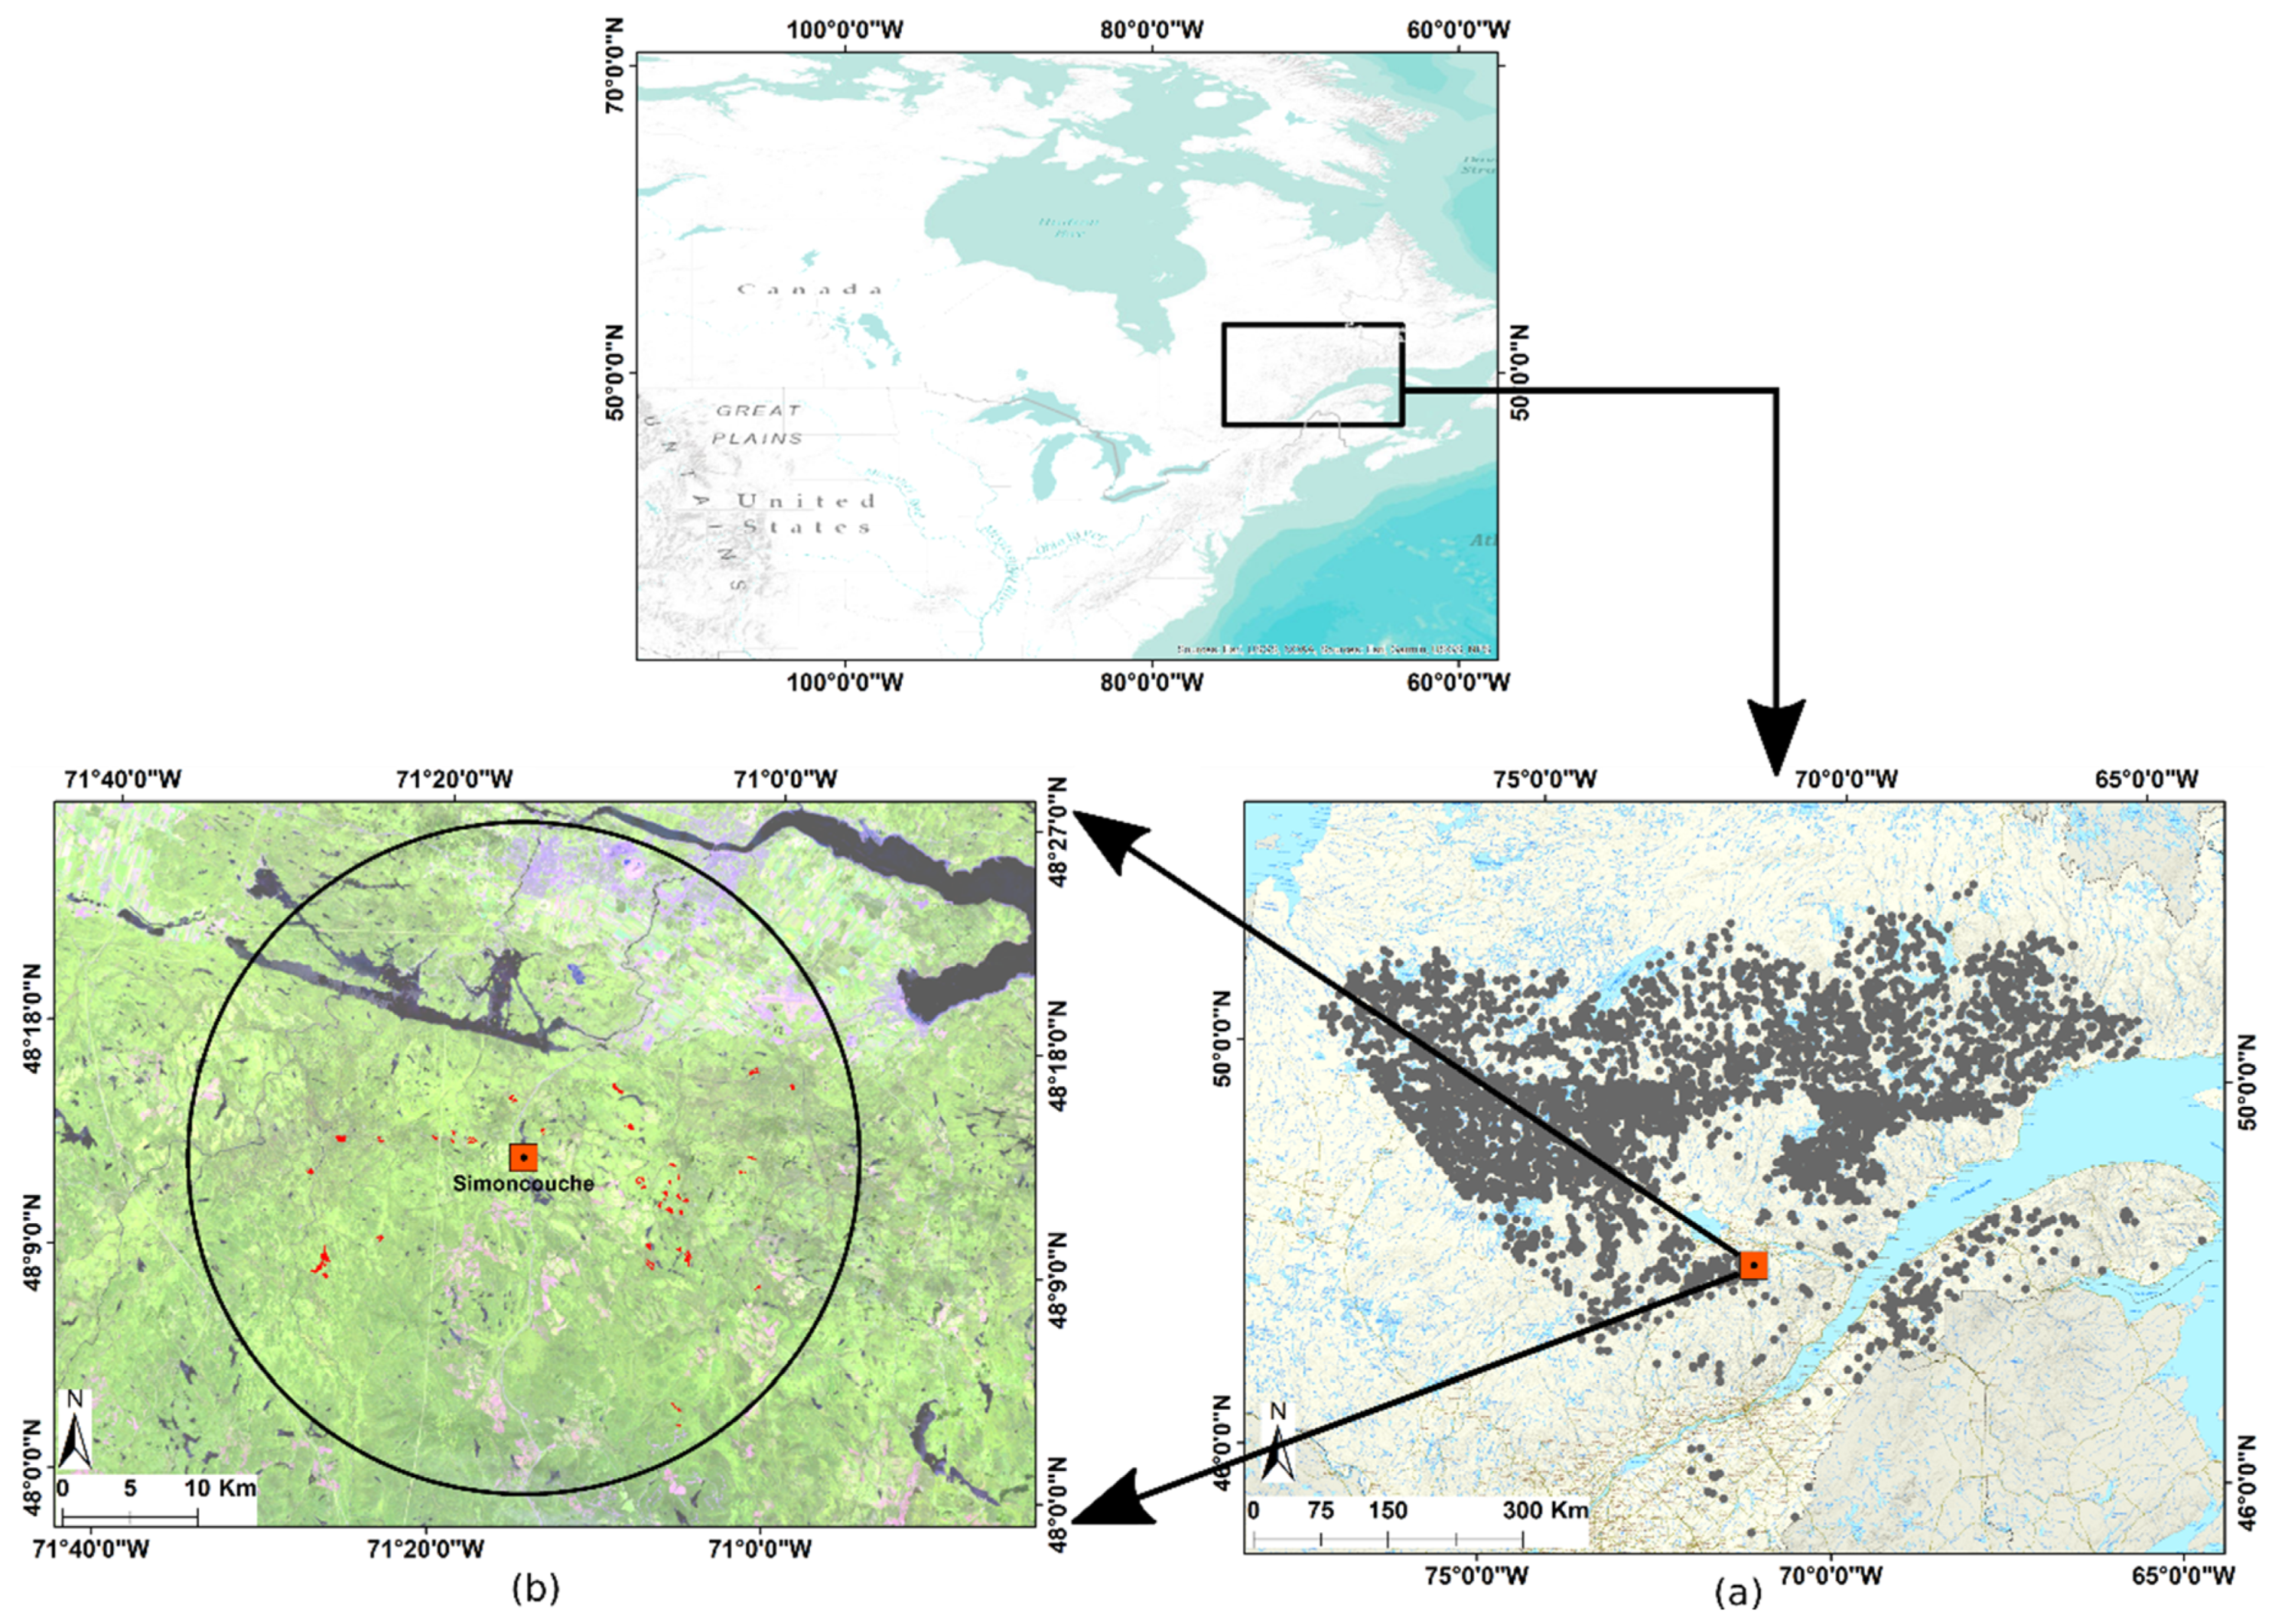
2.1. Study Area and Field Observations Site
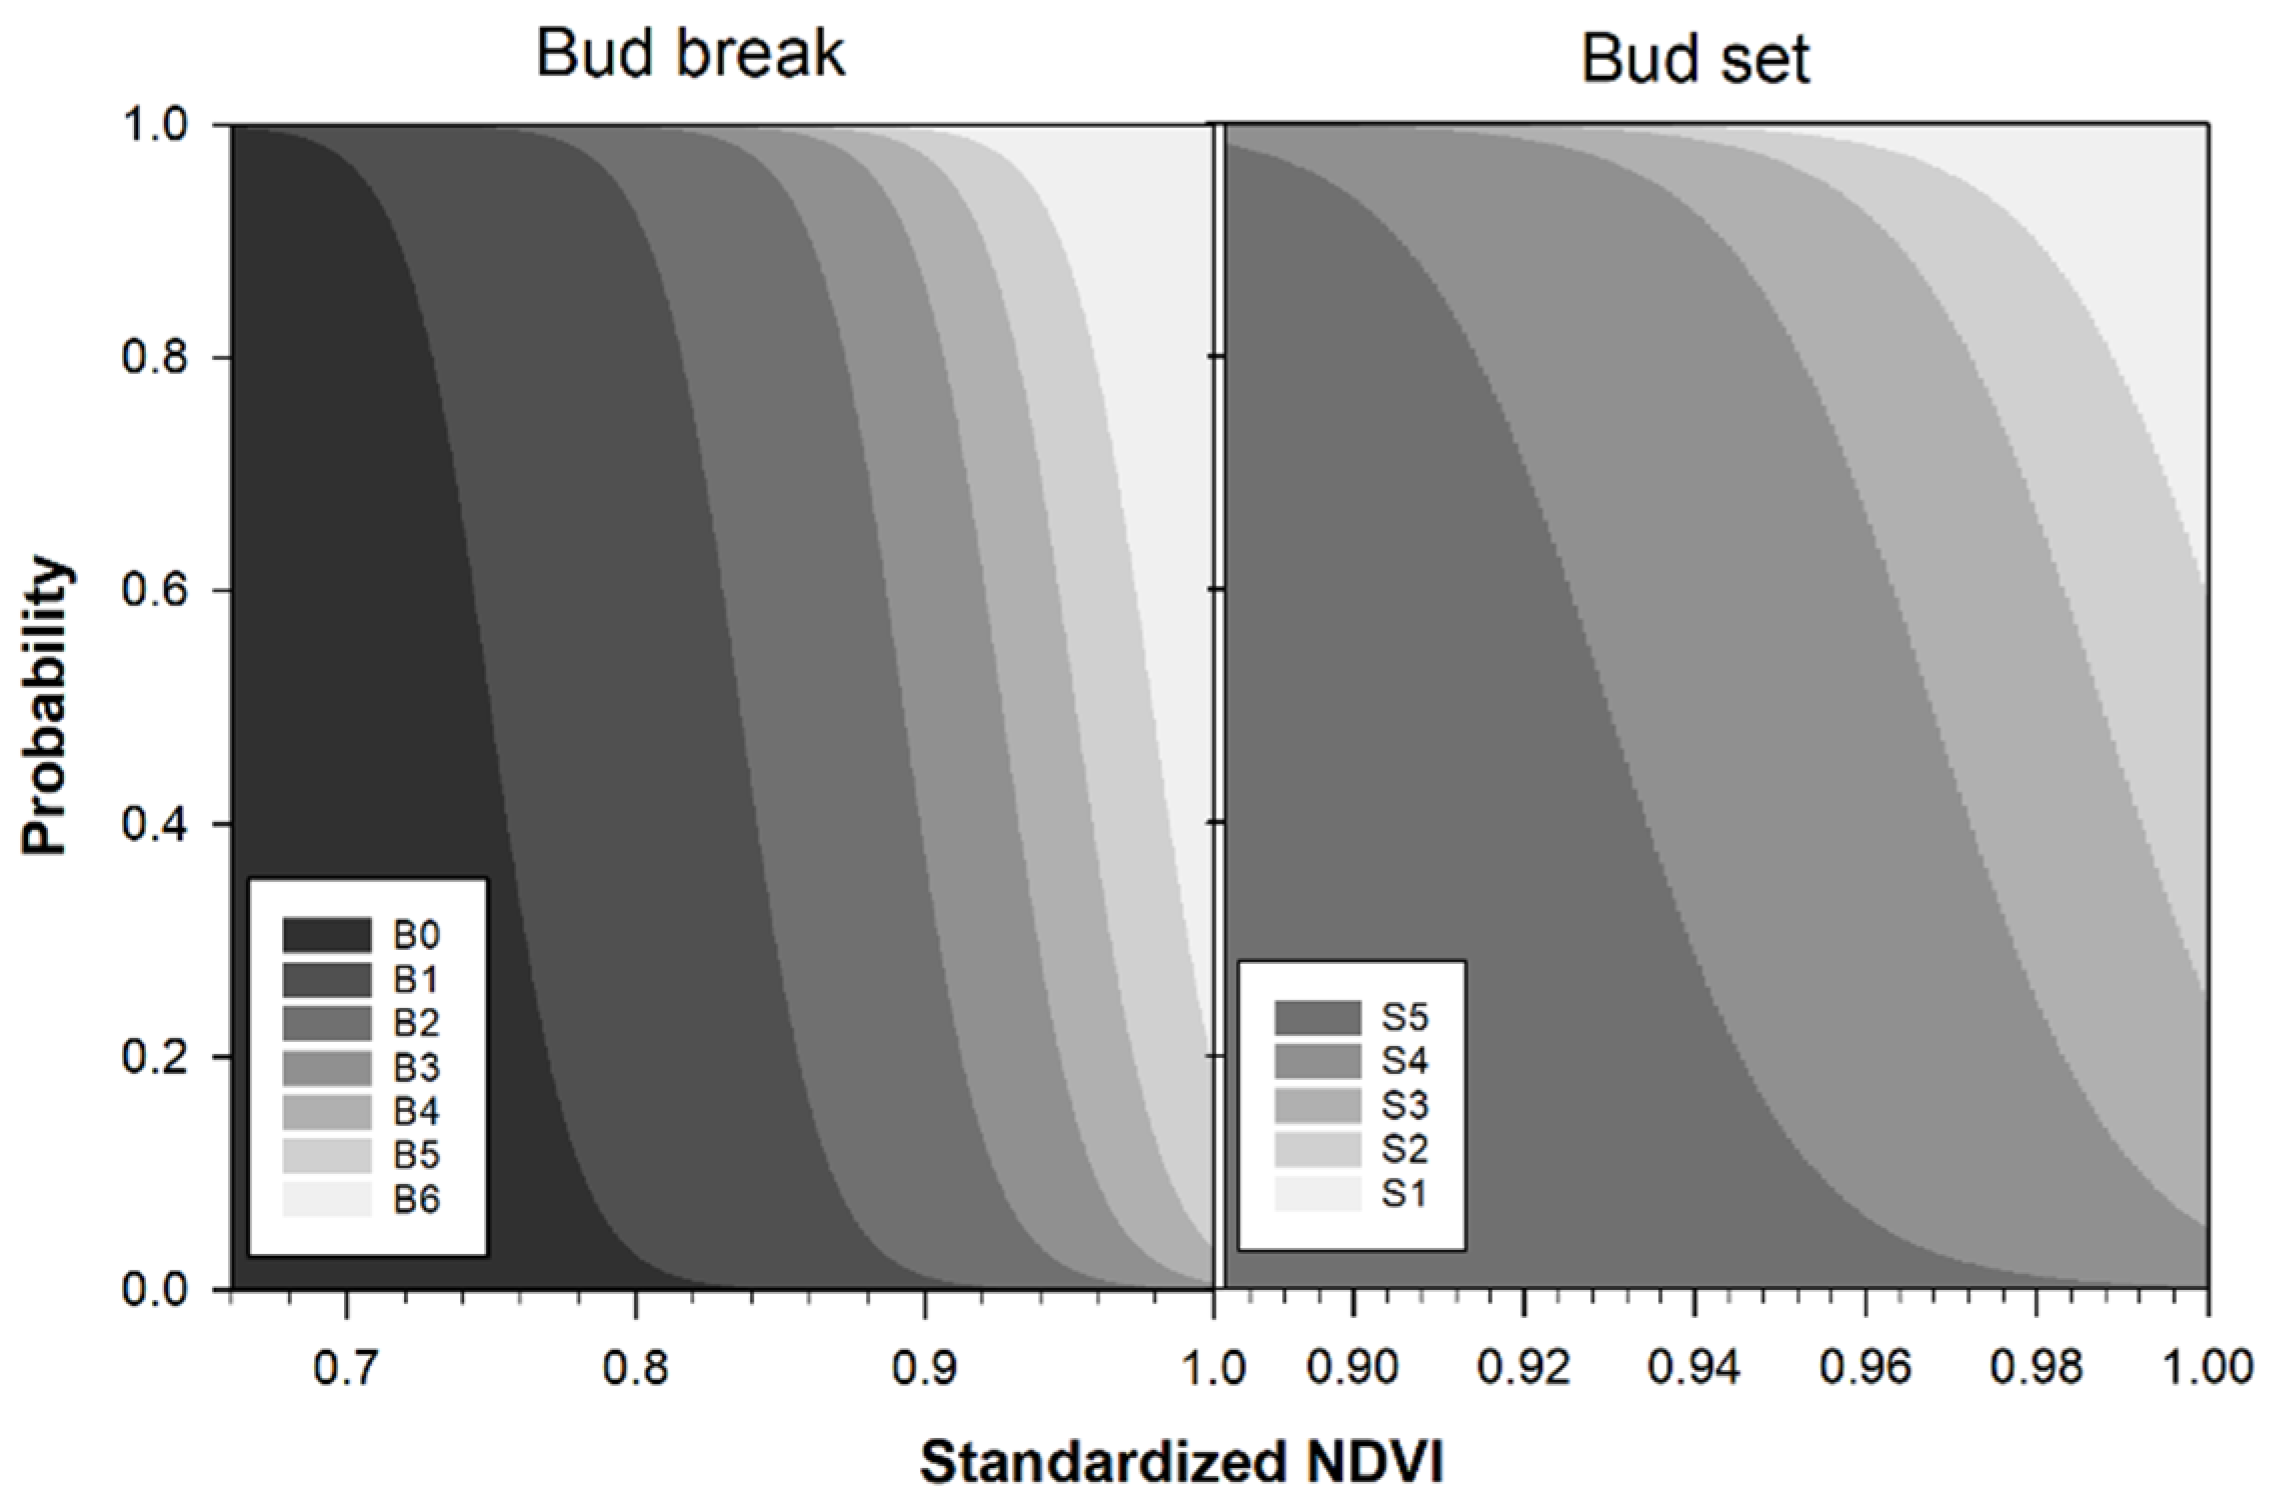
2.2. Identification of the Phenological Phases
2.3. MODIS Data
2.4. Assessing and Calibrating NDVI
2.5. Spatializing Black Spruce Phenology
3. Results
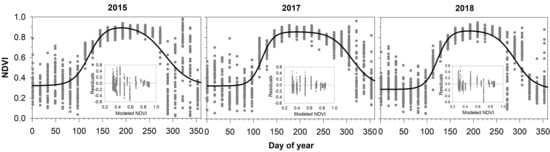
3.1. MODIS NDVI Data
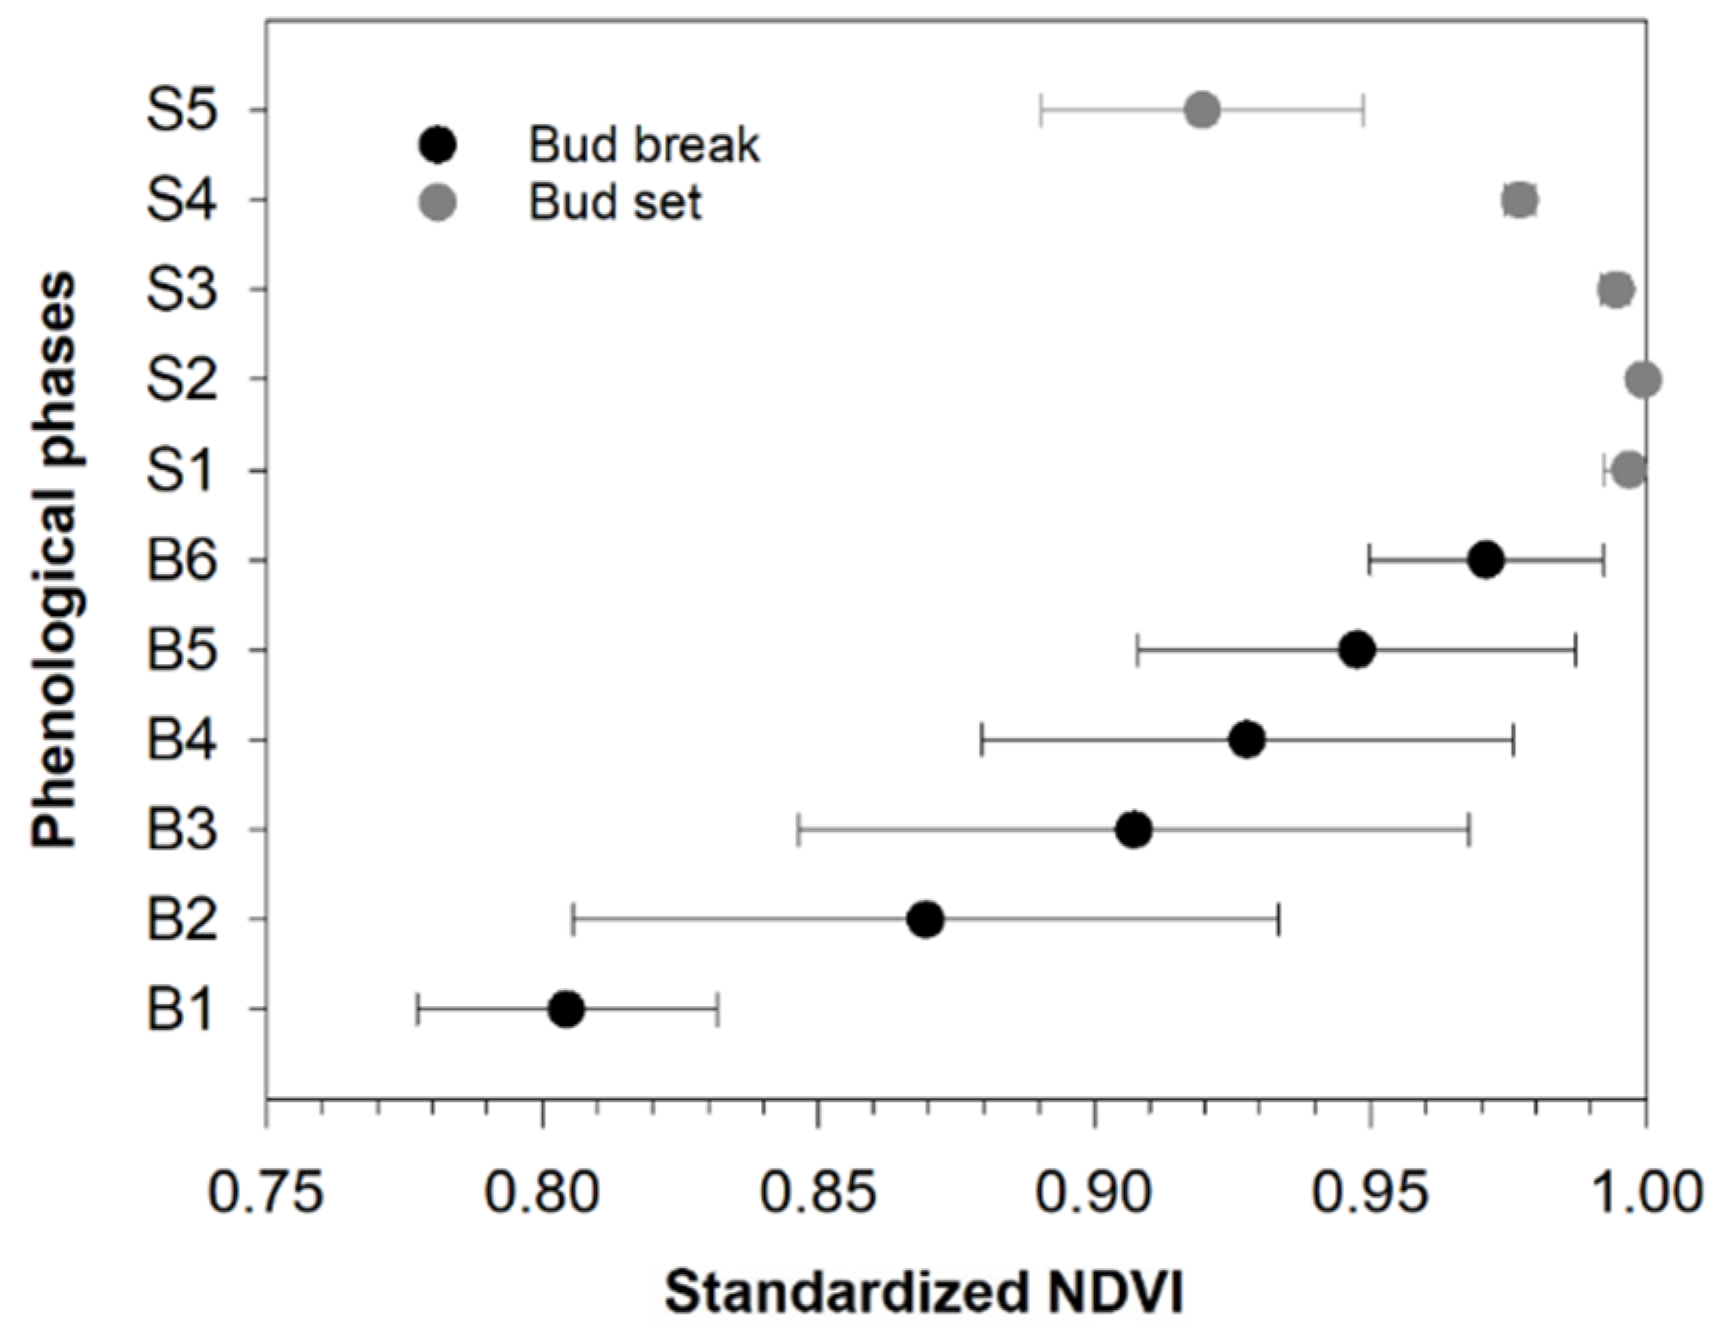
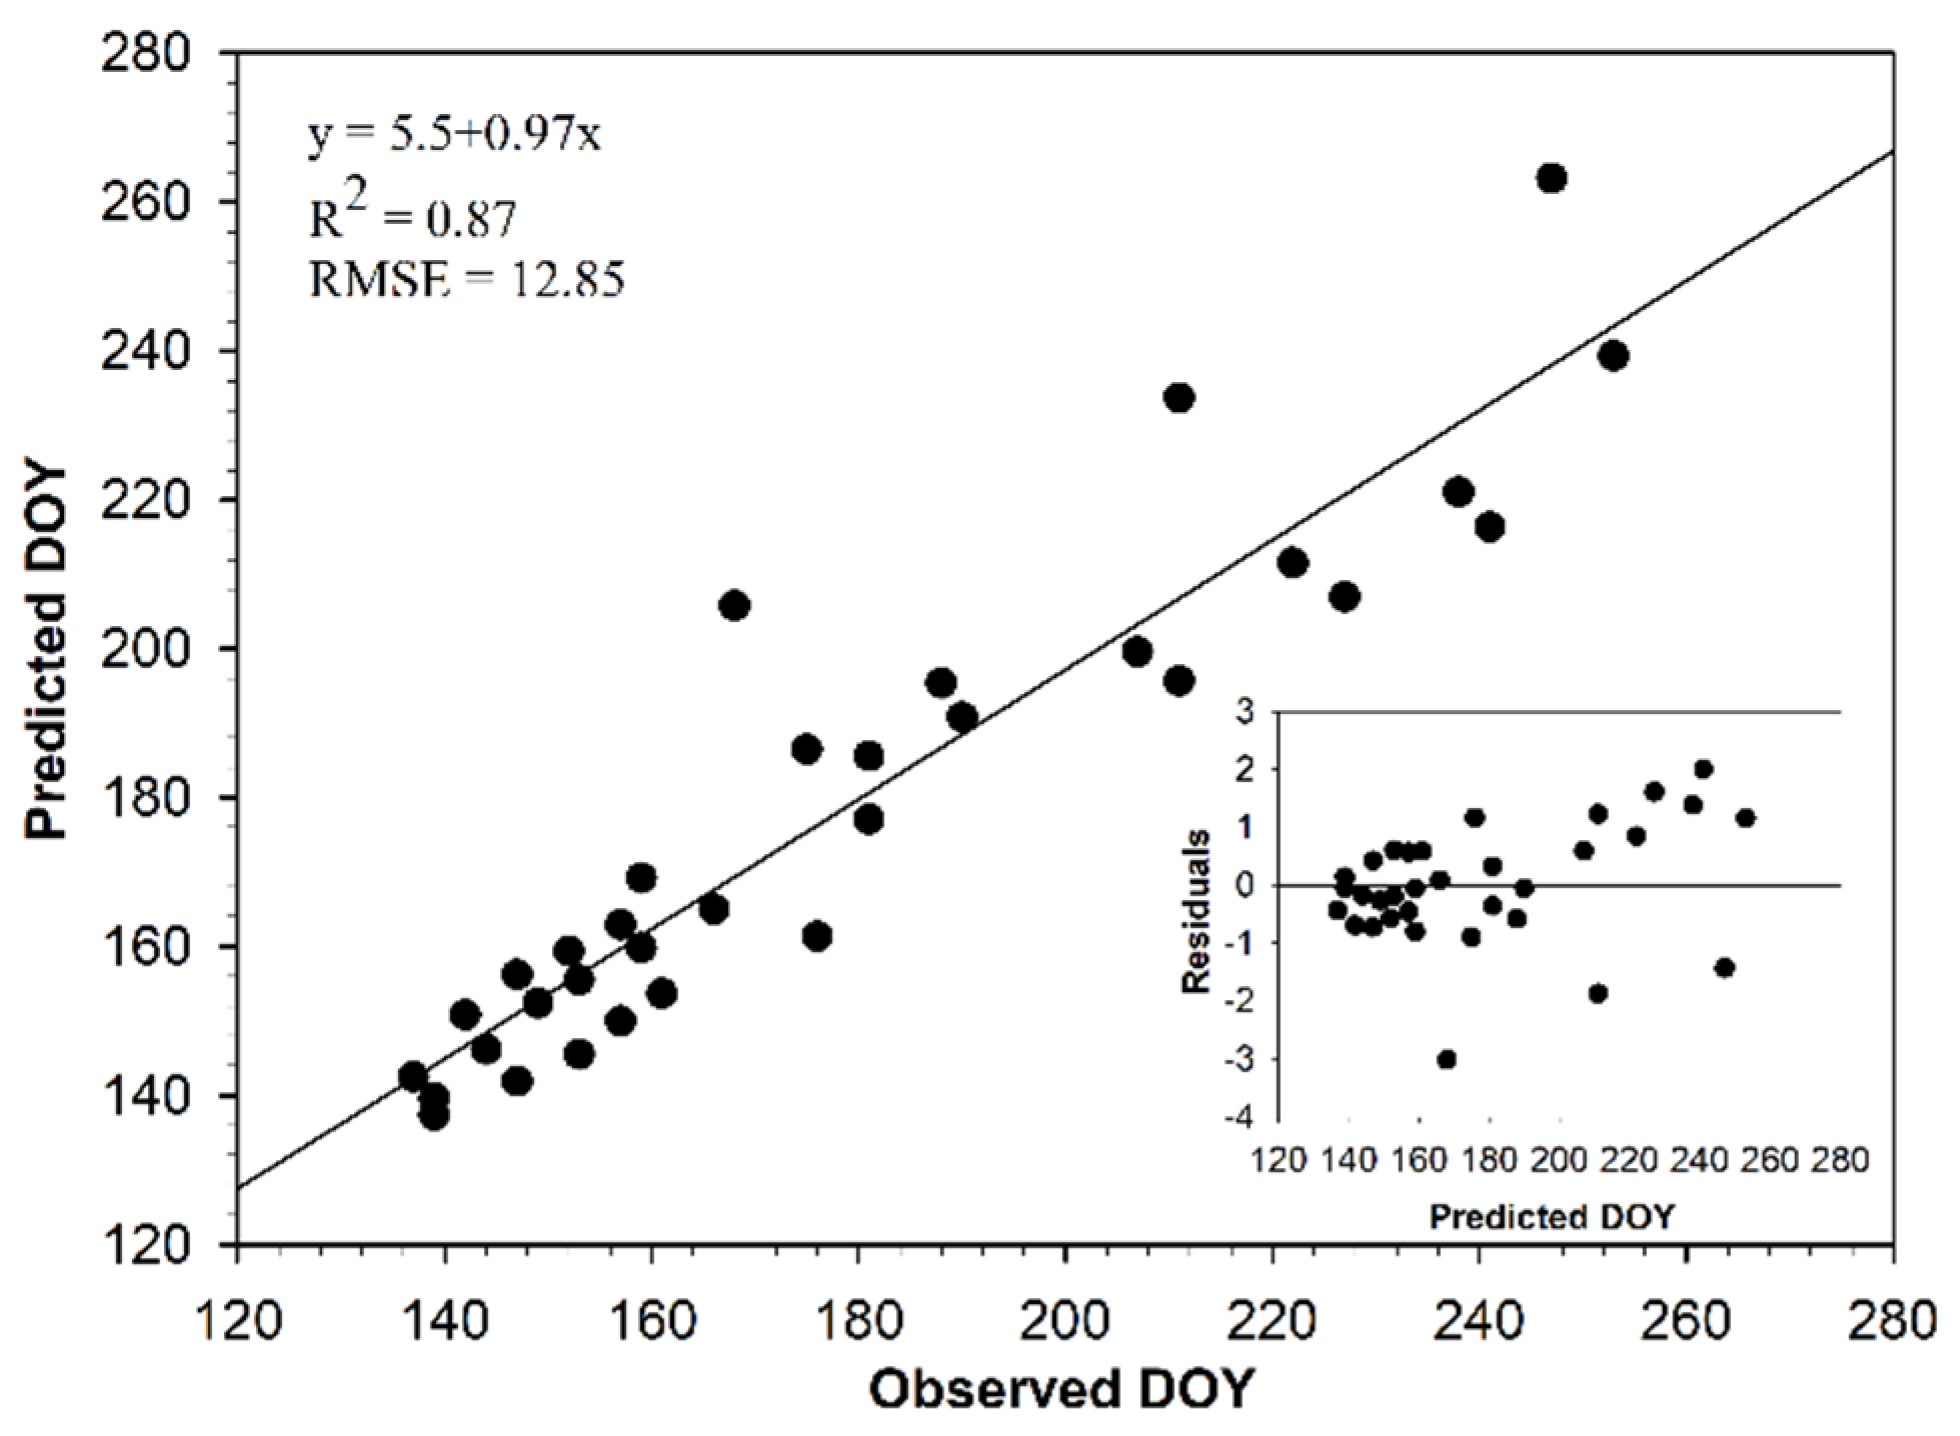
3.2. Comparing NDVI with Bud Phenology
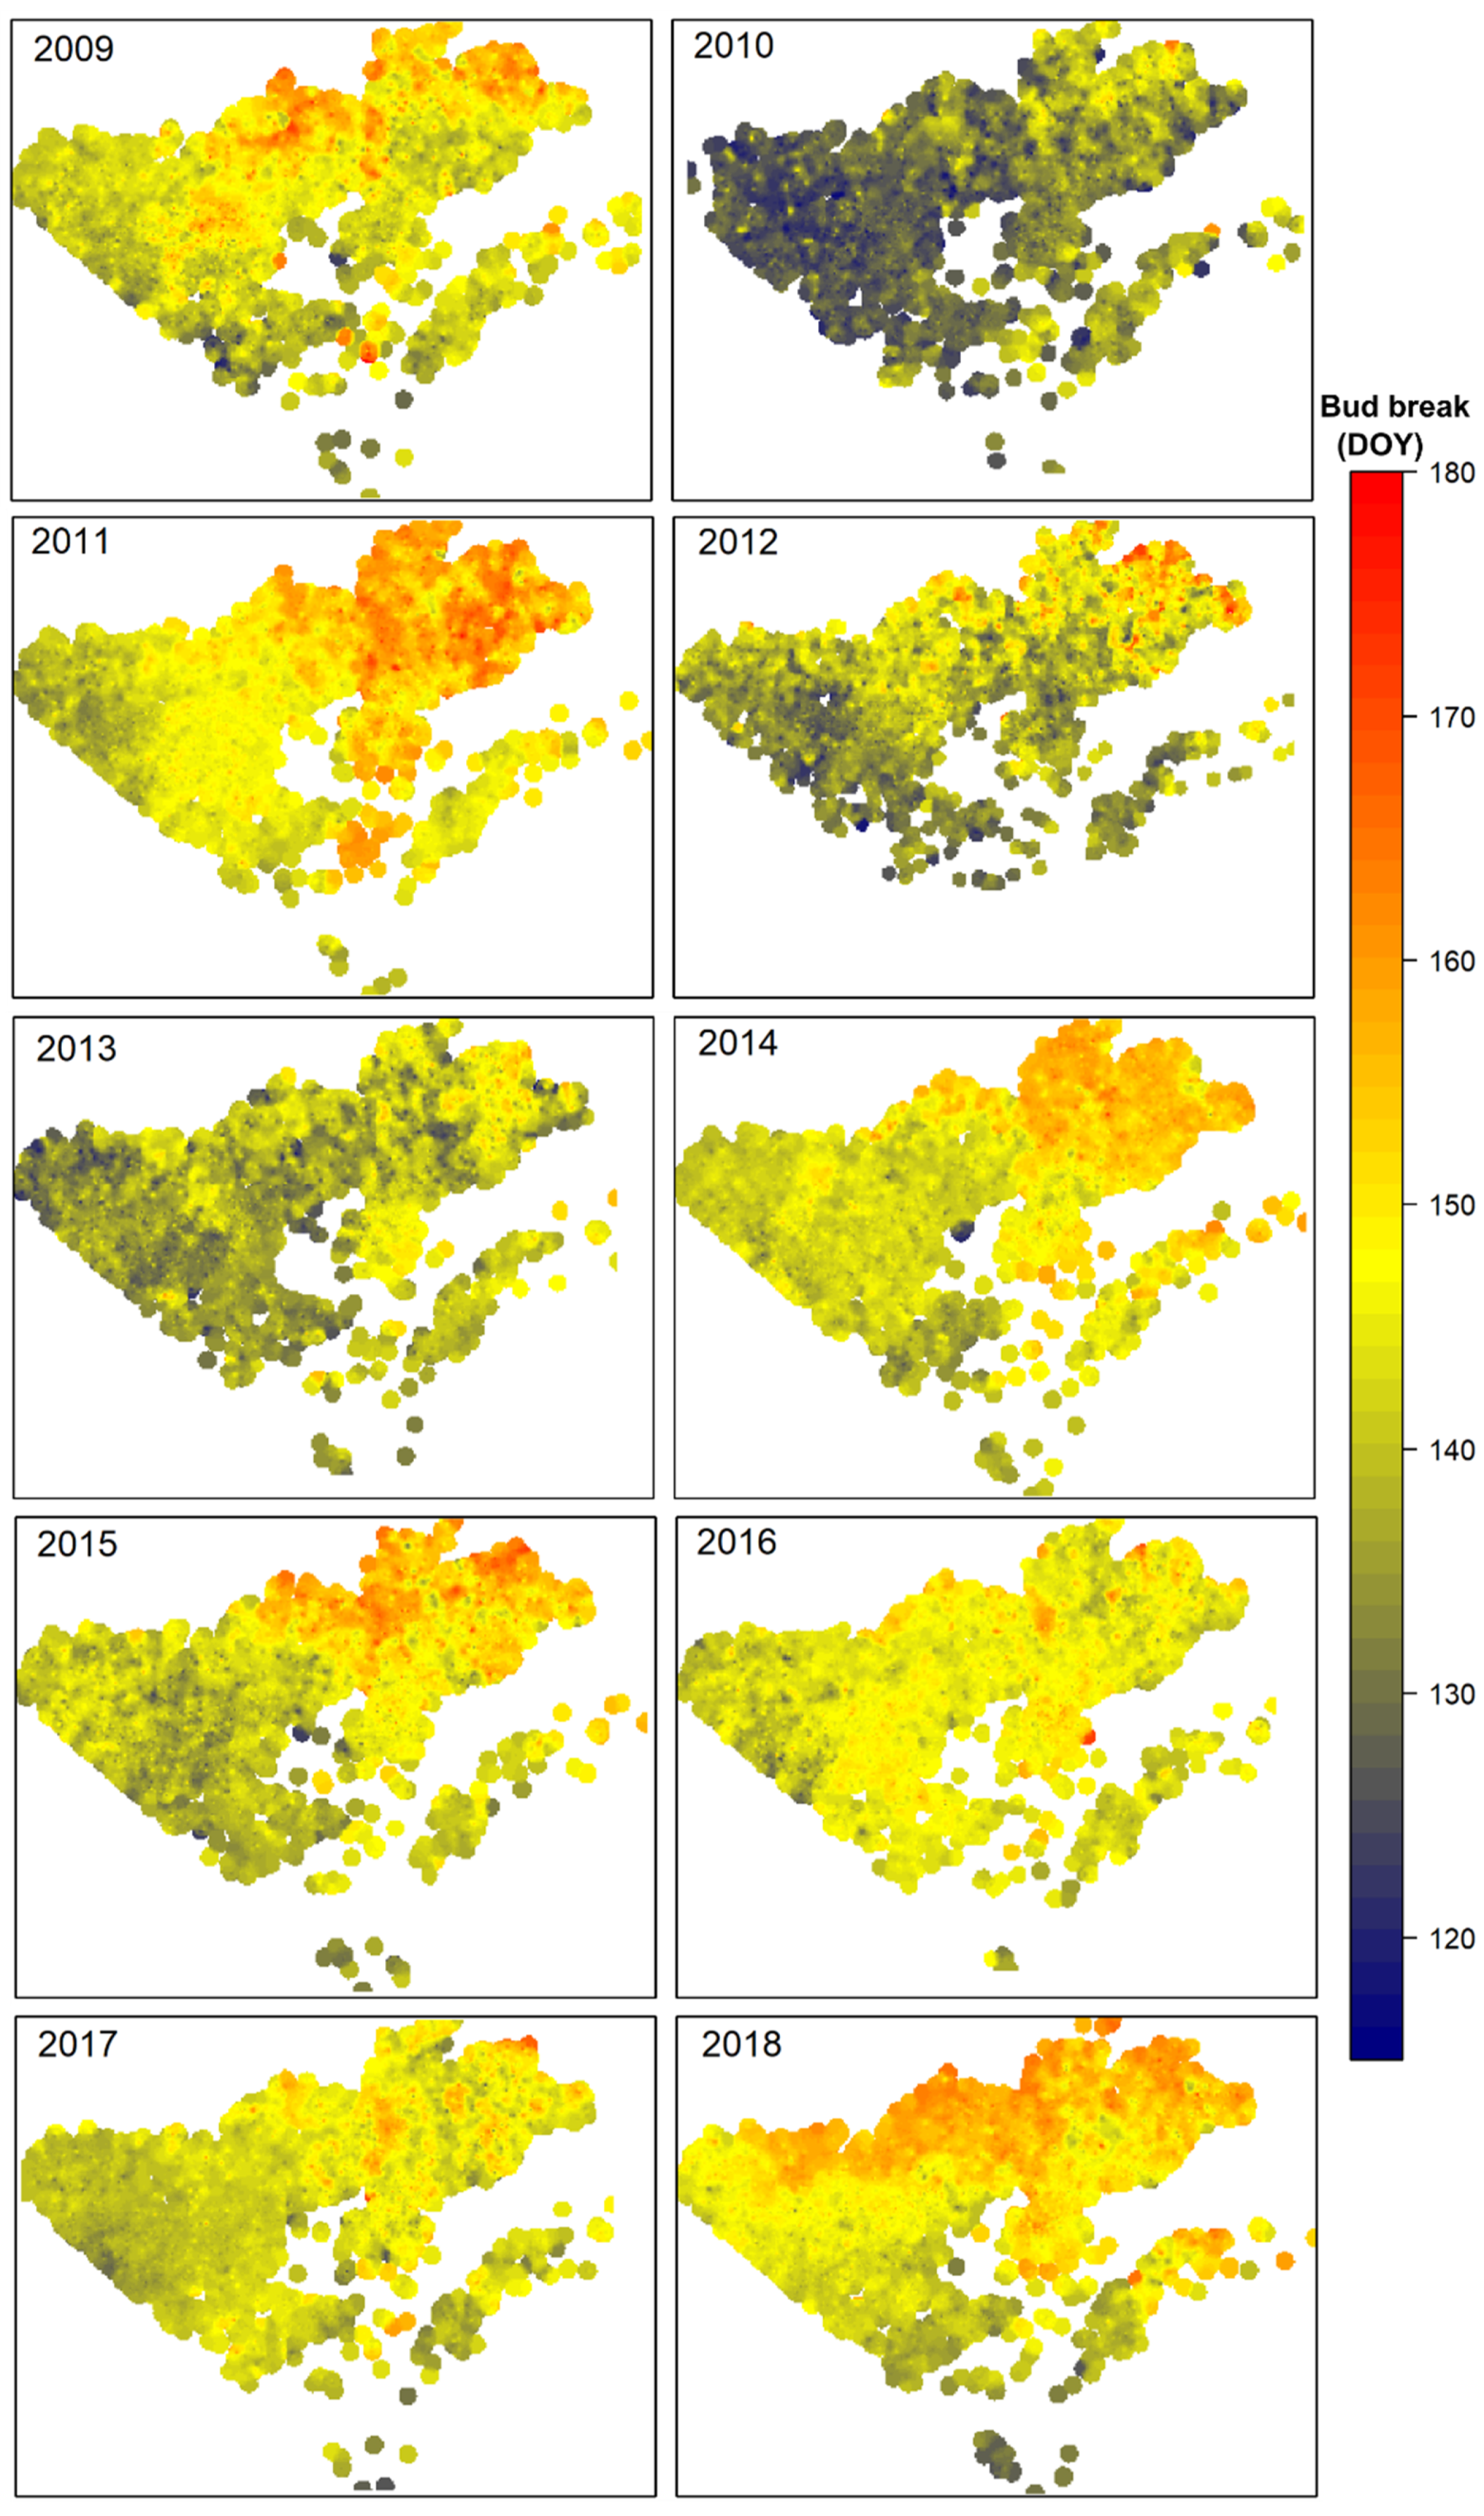
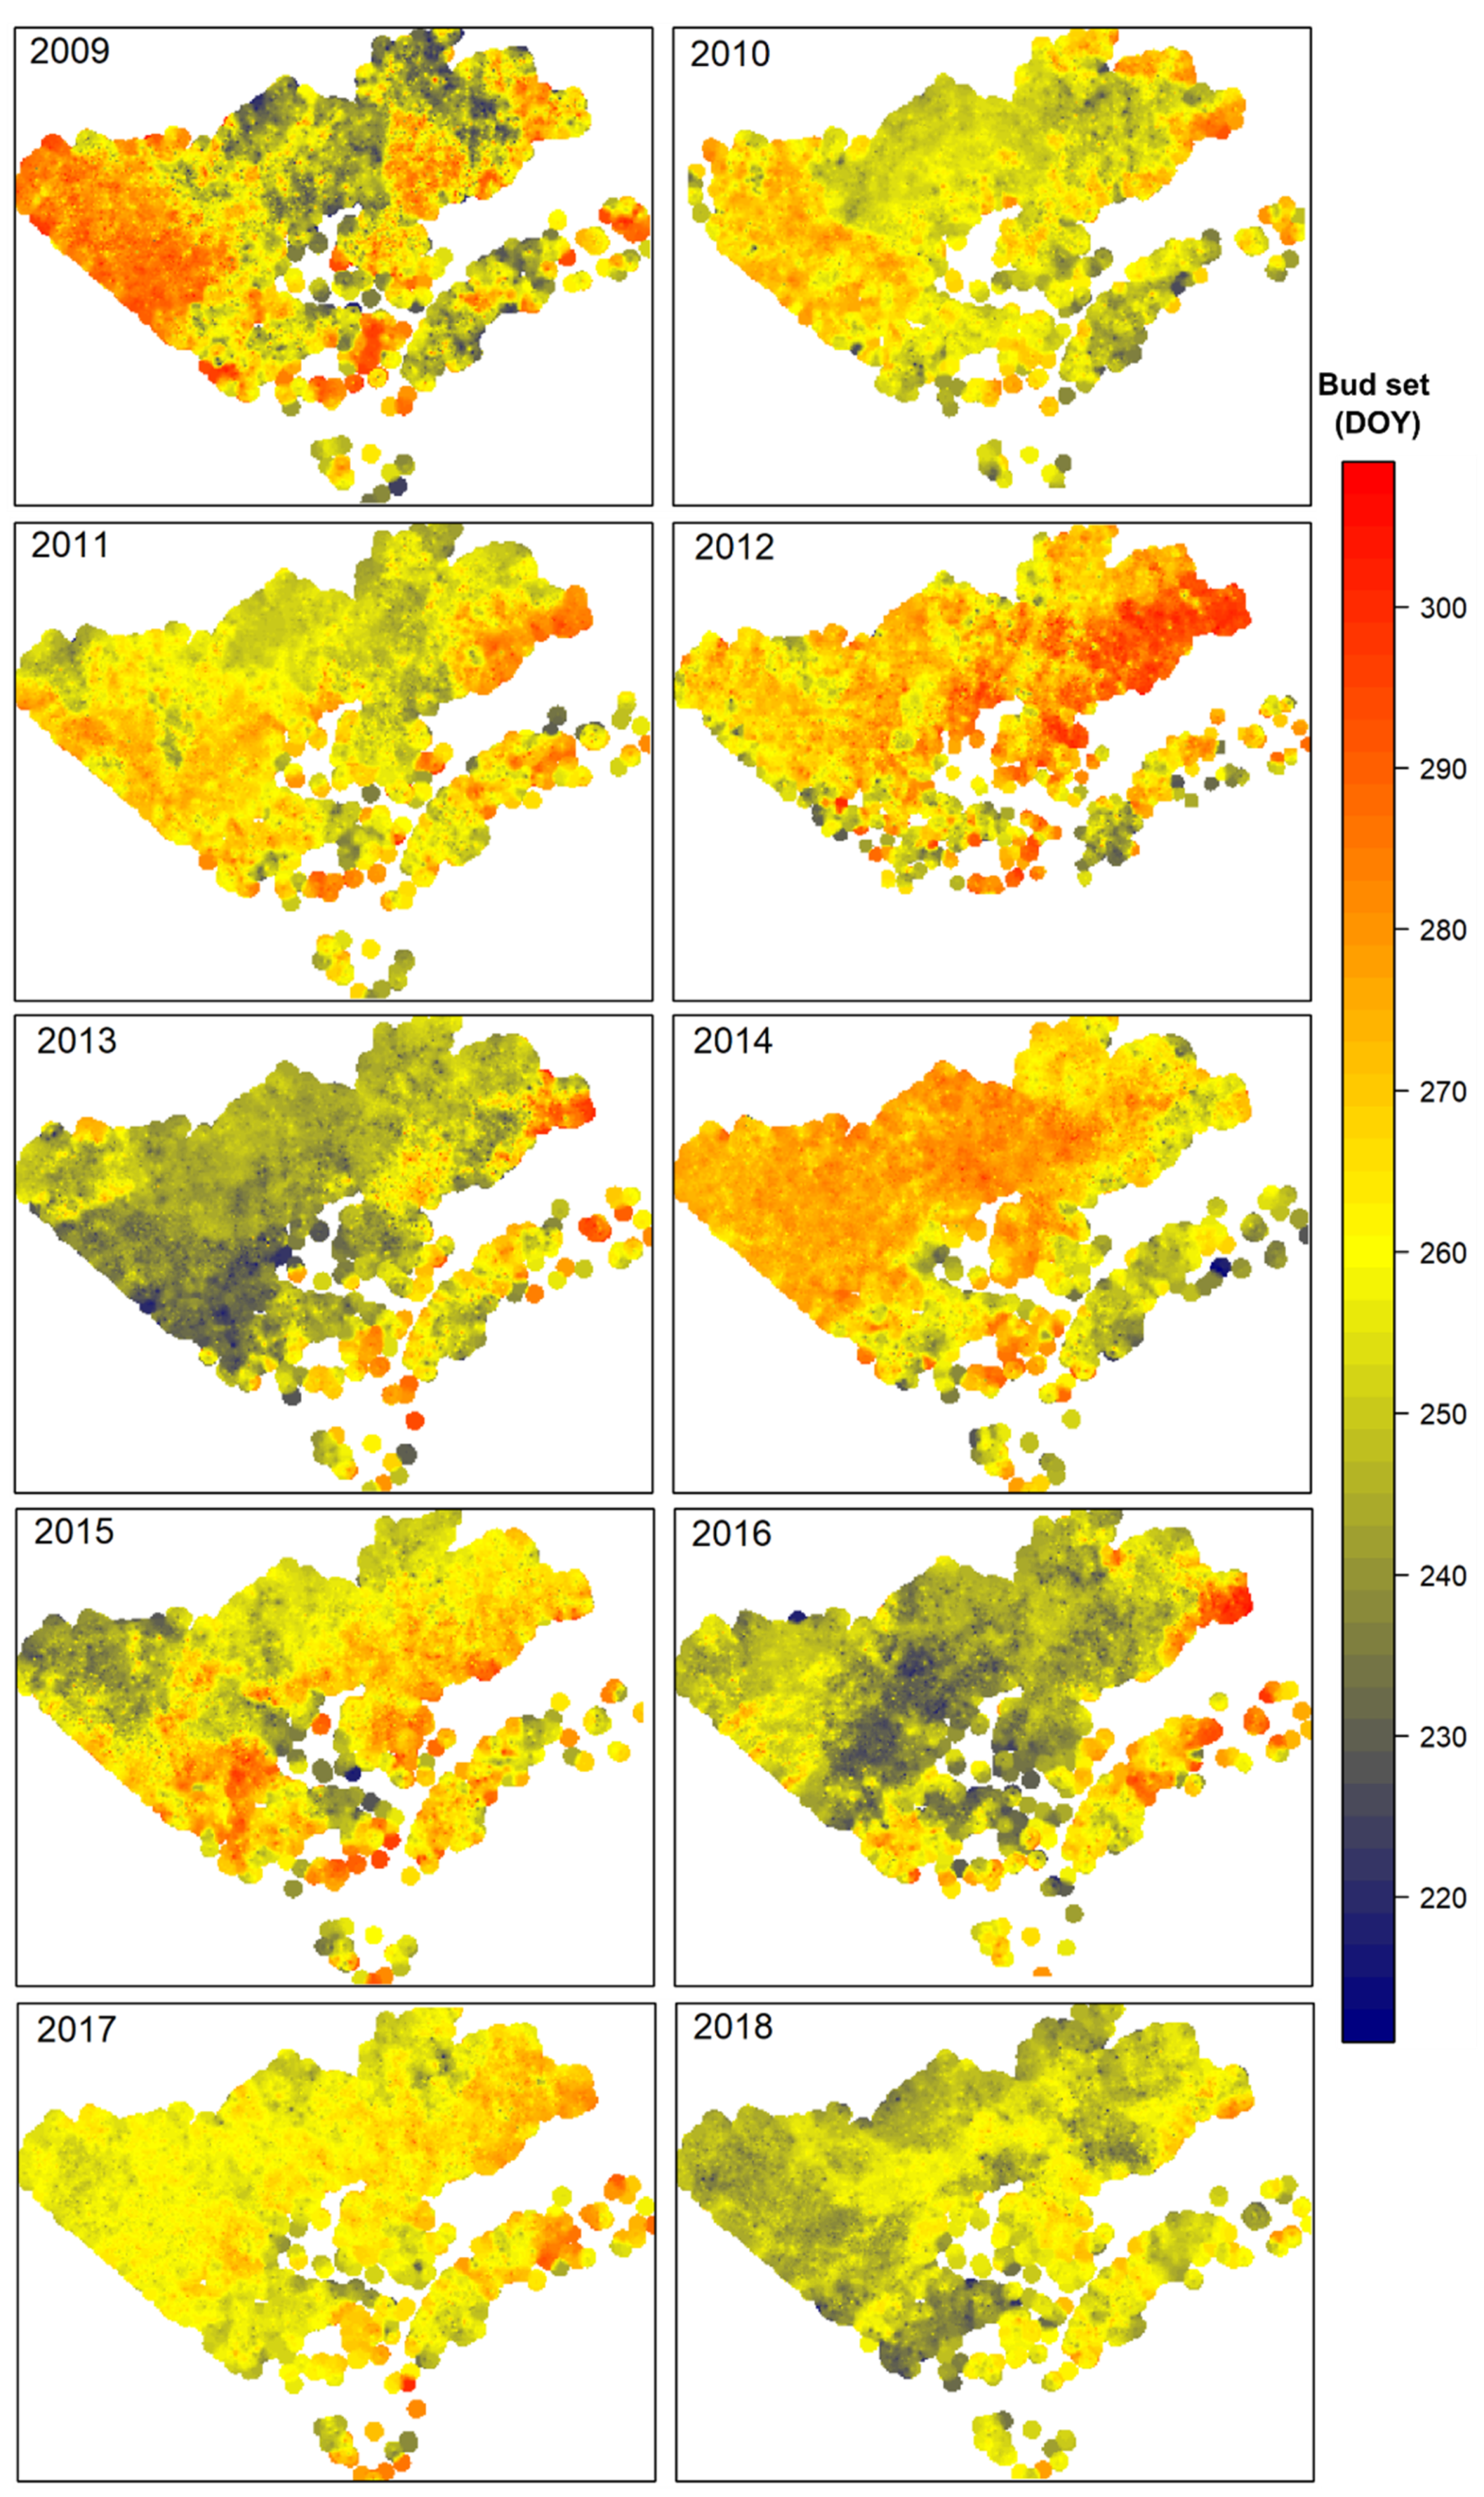
3.3. Spatial Pattern of Black Spruce Phenology
4. Discussion
4.1. Relationship between NDVI and Field-Based Phenology
4.2. Spatial and Temporal Changes of Bud Phenological Phases
5. Conclusions
Author Contributions
Funding
Acknowledgments
Conflicts of Interest
References
- Liu, L.; Liu, L.; Liang, L.; Donnelly, A.; Park, I.; Schwartz, M.D. Effects of elevation on spring phenological sensitivity to temperature in Tibetan Plateau grasslands. Chinese Sci. Bull. 2014, 59, 4856–4863. [Google Scholar] [CrossRef]
- Richardson, A.D.; Bailey, A.S.; Denny, E.G.; Martin, C.W.; O’Keefe, J. Phenology of a northern hardwood forest canopy. Glob. Chang. Biol. 2006, 12, 1174–1188. [Google Scholar] [CrossRef]
- Hughes, L. Biological consequences of global warming: is the signal already. Trends Ecol. Evol. 2000, 15, 56–61. [Google Scholar] [CrossRef]
- Hmimina, G.; Dufrêne, E.; Pontailler, J.Y.; Delpierre, N.; Aubinet, M.; Caquet, B.; de Grandcourt, A.; Burban, B.; Flechard, C.; Granier, A.; et al. Evaluation of the potential of MODIS satellite data to predict vegetation phenology in different biomes: An investigation using ground-based NDVI measurements. Remote Sens. Environ. 2013, 132, 145–158. [Google Scholar] [CrossRef]
- Kang, S.; Running, S.W.; Lim, J.H.; Zhao, M.; Park, C.R.; Loehman, R. A regional phenology model for detecting onset of greenness in temperate mixed forests, Korea: An application of MODIS leaf area index. Remote Sens. Environ. 2003, 86, 232–242. [Google Scholar] [CrossRef]
- White, M.A.; Thornton, P.E.; Running, S.W. A continental phenology model for monitoring vegetation responses to interannual climatic variability. Global Biogeochem. Cycles 1997, 11, 217–234. [Google Scholar] [CrossRef]
- Richardson, A.D.; Jenkins, J.P.; Braswell, B.H.; Hollinger, D.Y.; Ollinger, S.V.; Smith, M.L. Use of digital webcam images to track spring green-up in a deciduous broadleaf forest. Oecologia 2007, 152, 323–334. [Google Scholar] [CrossRef]
- Julien, Y.; Sobrino, J.A. Global land surface phenology trends from GIMMS database. Int. J. Remote Sens. 2009, 30, 3495–3513. [Google Scholar] [CrossRef]
- Zhang, X.; Goldberg, M.D. Monitoring fall foliage coloration dynamics using time-series satellite data. Remote Sens. Environ. 2011, 115, 382–391. [Google Scholar] [CrossRef]
- Liu, L.; Liang, L.; Schwartz, M.D.; Donnelly, A.; Wang, Z.; Schaaf, C.B.; Liu, L. Evaluating the potential of MODIS satellite data to track temporal dynamics of autumn phenology in a temperate mixed forest. Remote Sens. Environ. 2015, 160, 156–165. [Google Scholar] [CrossRef]
- Friedl, M.A.; Sulla-Menashe, D.; Tan, B.; Schneider, A.; Ramankutty, N.; Sibley, A.; Huang, X. MODIS Collection 5 global land cover: Algorithm refinements and characterization of new datasets. Remote Sens. Environ. 2010, 114, 168–182. [Google Scholar] [CrossRef]
- Garrity, S.R.; Bohrer, G.; Maurer, K.D.; Mueller, K.L.; Vogel, C.S.; Curtis, P.S. A comparison of multiple phenology data sources for estimating seasonal transitions in deciduous forest carbon exchange. Agric. For. Meteorol. 2011, 151, 1741–1752. [Google Scholar] [CrossRef]
- Zhang, X.; Friedl, M.A.; Schaaf, C.B.; Strahler, A.H.; Hodges, J.C.F.; Gao, F.; Reed, B.C.; Huete, A. Monitoring vegetation phenology using MODIS. Remote Sens. Environ. 2003, 84, 471–475. [Google Scholar] [CrossRef]
- Rouse, W.; Haas, H.; Deering, W. 20 Monitoring Vegetation Systems in the Great Plains With Erts. In Proceedings of the Third ERTS Symposium on Significant Results Obtained from the first Earth, College Station, TX, USA, 1 January 1974; Volume 1, pp. 309–317. [Google Scholar]
- Tucker, C.J.; Sellers, P.J. Satellite remote sensing of primary production. Int. J. Remote Sens. 1986, 7, 1395–1416. [Google Scholar] [CrossRef]
- Jeganathan, C.; Dash, J.; Atkinson, P.M. Remotely sensed trends in the phenology of northern high latitude terrestrial vegetation, controlling for land cover change and vegetation type. Remote Sens. Environ. 2014, 143, 154–170. [Google Scholar] [CrossRef]
- Lillesand, T.; Kiefer, R.W.; Chipman, J. Remote Sensing and Image Interpretation, 7th ed.; John Wiley & Sons: New York, NY, USA, 2015; ISBN 978-1-118-34328-9. [Google Scholar]
- Piao, S.; Tan, J.; Chen, A.; Fu, Y.H.; Ciais, P.; Liu, Q.; Janssens, I.A.; Vicca, S.; Zeng, Z.; Jeong, S.J.; et al. Leaf onset in the northern hemisphere triggered by daytime temperature. Nat. Commun. 2015, 6, 6911. [Google Scholar] [CrossRef]
- Peng, S.; Piao, S.; Ciais, P.; Myneni, R.B.; Chen, A.; Chevallier, F.; Dolman, A.J.; Janssens, I.A.; Peñuelas, J.; Zhang, G.; et al. Asymmetric effects of daytime and night-time warming on Northern Hemisphere vegetation. Nature 2013, 501, 88–92. [Google Scholar] [CrossRef]
- Beck, P.S.A.; Atzberger, C.; Høgda, K.A.; Johansen, B.; Skidmore, A.K. Improved monitoring of vegetation dynamics at very high latitudes: A new method using MODIS NDVI. Remote Sens. Environ. 2006, 100, 321–334. [Google Scholar] [CrossRef]
- Melaas, E.K.; Friedl, M.A.; Zhu, Z. Detecting interannual variation in deciduous broadleaf forest phenology using Landsat TM/ETM+ data. Remote Sens. Environ. 2013, 132, 176–185. [Google Scholar] [CrossRef]
- Wu, C.; Gonsamo, A.; Gough, C.M.; Chen, J.M.; Xu, S. Modeling growing season phenology in North American forests using seasonal mean vegetation indices from MODIS. Remote Sens. Environ. 2014, 147, 79–88. [Google Scholar] [CrossRef]
- Xu, H.; Twine, T.E.; Yang, X. Evaluating remotely sensed phenological metrics in a dynamic ecosystem model. Remote Sens. 2014, 6, 4660–4686. [Google Scholar] [CrossRef]
- Elmendorf, S.C.; Jones, K.D.; Cook, B.I.; Diez, J.M.; Enquist, C.A.F.; Hufft, R.A.; Jones, M.O.; Mazer, S.J.; Miller-Rushing, A.J.; Moore, D.J.P.; et al. The plant phenology monitoring design for the National Ecological Observatory Network. Ecosphere 2016, 7, 1–16. [Google Scholar] [CrossRef]
- Guyon, D.; Guillot, M.; Vitasse, Y.; Cardot, H.; Hagolle, O.; Delzon, S.; Wigneron, J.P. Monitoring elevation variations in leaf phenology of deciduous broadleaf forests from SPOT/VEGETATION time-series. Remote Sens. Environ. 2011, 115, 615–627. [Google Scholar] [CrossRef]
- Richardson, A.D.; Keenan, T.F.; Migliavacca, M.; Ryu, Y.; Sonnentag, O.; Toomey, M. Climate change, phenology, and phenological control of vegetation feedbacks to the climate system. Agric. For. Meteorol. 2013, 169, 156–173. [Google Scholar] [CrossRef]
- White, M.A.; de Beurs, K.M.; Didan, K.; Inouye, D.W.; Richardson, A.D.; Jensen, O.P.; O’Keefe, J.; Zhang, G.; Nemani, R.R.; van Leeuwen, W.J.D.; et al. Intercomparison, interpretation, and assessment of spring phenology in North America estimated from remote sensing for 1982-2006. Glob. Chang. Biol. 2009, 15, 2335–2359. [Google Scholar] [CrossRef]
- Kross, A.; Fernandes, R.; Seaquist, J.; Beaubien, E. The effect of the temporal resolution of NDVI data on season onset dates and trends across Canadian broadleaf forests. Remote Sens. Environ. 2011, 115, 1564–1575. [Google Scholar] [CrossRef]
- Ministère des Ressources Naturelles et de la Faune Forêt Québec Direction des inventaires forestiers (MRNF). Normes de Cartographie Écoforestière—Troisième Inventaire Écoforestier; Direction des Inventaires Forestiers: Québec, QC, Canada, 2009; ISBN 978-2-550-54985-7.
- Rossi, S.; Morin, H.; Deslauriers, A. Multi-scale influence of snowmelt on xylogenesis of black spruce. Arctic, Antarct. Alp. Res. 2011, 43, 457–464. [Google Scholar] [CrossRef]
- Dhont, C.; Sylvestre, P.; Gros-Louis, M.C.; Isabel, N. Guide-Terrain pour L’identification des Stades de Débourrement et de Formation du Bourgeon Apical chez L’épinette Blanche; RNC et SCF, Centre de foresterie des Laurentides: Québec, QC, Canada, 2010.
- Didan, K. MOD13Q1 MODIS/Terra Vegetation Indices 16-Day L3 Global 250m SIN Grid V006; NASA EOSDIS Land Processes DAAC: Sioux Falls, SD, USA, 2015.
- Fisher, J.I.; Mustard, J.F.; Vadeboncoeur, M.A. Green leaf phenology at Landsat resolution: Scaling from the field to the satellite. Remote Sens. Environ. 2006, 100, 265–279. [Google Scholar] [CrossRef]
- Derr, B. SAS Global Forum 2013 Statistics and Data Analysis Ordinal Response Modeling with the LOGISTIC Procedure SAS Global Forum 2013 Statistics and Data Analysis. SAS Glob. Forum 2013 2013, 1–20. [Google Scholar]
- Prislan, P.; Gričar, J.; Čufar, K.; de Luis, M.; Merela, M.; Rossi, S. Growing season and radial growth predicted for Fagus sylvatica under climate change. Clim. Chang. 2019, 153, 181–197. [Google Scholar] [CrossRef]
- Getis, A.; Ord, J.K. The analysis of spatial association by distance statistics. Geogr. Anal. 1992, 355, 189–206. [Google Scholar] [CrossRef]
- Osei, F.B.; Duker, A.A. Spatial and demographic patterns of Cholera in Ashanti region - Ghana. Int. J. Health Geogr. 2008, 7, 1–10. [Google Scholar] [CrossRef] [PubMed]
- Childs, B.C. Interpolating Surfaces in ArcGIS Spatial Analyst; ESRI Education Services: Redlands, CA, USA, 2004; pp. 32–35. [Google Scholar]
- Ganguly, S.; Friedl, M.A.; Tan, B.; Zhang, X.; Verma, M. Land surface phenology from MODIS: Characterization of the Collection 5 global land cover dynamics product. Remote Sens. Environ. 2010, 114, 1805–1816. [Google Scholar] [CrossRef]
- Fu, Y.; Zhang, H.; Dong, W.; Yuan, W. Comparison of Phenology Models for Predicting the Onset of Growing Season over the Northern Hemisphere. PLoS ONE 2014, 9, e109544. [Google Scholar] [CrossRef]
- Joiner, J.; Yoshida, Y.; Vasilkov, A.P.; Schaefer, K.; Jung, M.; Guanter, L.; Zhang, Y.; Garrity, S.; Middleton, E.M.; Huemmrich, K.F.; et al. The seasonal cycle of satellite chlorophyll fluorescence observations and its relationship to vegetation phenology and ecosystem atmosphere carbon exchange. Remote Sens. Environ. 2014, 152, 375–391. [Google Scholar] [CrossRef]
- Sun, Y.; Frankenberg, C.; Wood, J.D.; Schimel, D.S.; Jung, M.; Guanter, L.; Drewry, D.T.; Verma, M.; Porcar-Castell, A.; Griffis, T.J.; et al. OCO-2 advances photosynthesis observation from space via solar-induced chlorophyll fluorescence. Science 2017, 358, eaam5747. [Google Scholar] [CrossRef]
- Gamon, J.A.; Huemmrich, K.F.; Wong, C.Y.S.; Ensminger, I.; Garrity, S.; Hollinger, D.Y.; Noormets, A.; Peñuelask, J. A remotely sensed pigment index reveals photosynthetic phenology in evergreen conifers. Proc. Natl. Acad. Sci. USA 2016, 113, 13087–13092. [Google Scholar] [CrossRef]
- Ulsig, L.; Nichol, C.J.; Huemmrich, K.F.; Landis, D.R.; Middleton, E.M.; Lyapustin, A.I.; Mammarella, I.; Levula, J.; Porcar-Castell, A. Detecting inter-annual variations in the phenology of evergreen conifers using long-term MODIS vegetation index time series. Remote Sens. 2017, 9, 49. [Google Scholar] [CrossRef]
- Ensminger, I.; Sveshnikov, D.; Campbell, D.A.; Funk, C.; Jansson, S.; Lloyd, J.; Shibistova, O.; Öquist, G. Intermittent low temperatures constrain spring recovery of photosynthesis in boreal Scots pine forests. Glob. Chang. Biol. 2004, 10, 995–1008. [Google Scholar] [CrossRef]
- Hansen, J.; Beck, E. The fate and path of assimilation products in the stem of 8-year-old Scots pine (Pinus sylvestris L.) trees. Trees 1990, 4, 16–21. [Google Scholar] [CrossRef]
- Monson, R.K.; Sparks, J.P.; Rosenstiel, T.N.; Scott-Denton, L.E.; Huxman, T.E.; Harley, P.C.; Turnipseed, A.A.; Burns, S.P.; Backlund, B.; Hu, J. Climatic influences on net ecosystem CO2 exchange during the transition from wintertime carbon source to springtime carbon sink in a high-elevation, subalpine forest. Oecologia 2005, 146, 130–147. [Google Scholar] [CrossRef] [PubMed]
- Jönsson, A.M.; Eklundh, L.; Hellström, M.; Bärring, L.; Jönsson, P. Annual changes in MODIS vegetation indices of Swedish coniferous forests in relation to snow dynamics and tree phenology. Remote Sens. Environ. 2010, 114, 2719–2730. [Google Scholar] [CrossRef]
- Antonucci, S.; Rossi, S.; Deslauriers, A.; Morin, H.; Lombardi, F.; Marchetti, M.; Tognetti, R. Large-scale estimation of xylem phenology in black spruce through remote sensing. Agric. For. Meteorol. 2017, 233, 92–100. [Google Scholar] [CrossRef]
- Wu, C.; Hou, X.; Peng, D.; Gonsamo, A.; Xu, S. Land surface phenology of China’s temperate ecosystems over 1999-2013: Spatial-temporal patterns, interaction effects, covariation with climate and implications for productivity. Agric. For. Meteorol. 2016, 216, 177–187. [Google Scholar] [CrossRef]
- Wielgolaski, F.-E.; Inouye, D.W. Phenology: An Integrative Environmental Science; Schwartz, M.D., Ed.; Springer: Dordrecht, The Netherlands, 2003; ISBN 978-94-007-0632-3. [Google Scholar]
- Hu, B.; Inannen, K.; Miller, J.R. Retrieval of leaf area index and canopy closure from CASI data over the BOREAS flux tower sites. Remote Sens. Environ. 2000, 74, 255–274. [Google Scholar] [CrossRef]
- Hird, J.N.; McDermid, G.J. Noise reduction of NDVI time series: An empirical comparison of selected techniques. Remote Sens. Environ. 2009, 113, 248–258. [Google Scholar] [CrossRef]
- Gonsamo, A.; Chen, J.M.; Wu, C.; Dragoni, D. Predicting deciduous forest carbon uptake phenology by upscaling FLUXNET measurements using remote sensing data. Agric. For. Meteorol. 2012, 165, 127–135. [Google Scholar] [CrossRef]
- Wu, C.; Peng, D.; Soudani, K.; Siebicke, L.; Gough, C.M.; Arain, M.A.; Bohrer, G.; Lafleur, P.M.; Peichl, M.; Gonsamo, A.; et al. Land surface phenology derived from normalized difference vegetation index (NDVI) at global FLUXNET sites. Agric. For. Meteorol. 2017, 233, 171–182. [Google Scholar] [CrossRef]
- Liu, Y.; Wu, C.; Peng, D.; Xu, S.; Gonsamo, A.; Jassal, R.S.; Altaf Arain, M.; Lu, L.; Fang, B.; Chen, J.M. Improved modeling of land surface phenology using MODIS land surface reflectance and temperature at evergreen needleleaf forests of central North America. Remote Sens. Environ. 2016, 176, 152–162. [Google Scholar] [CrossRef]
- Hufkens, K.; Keenan, T.F.; Flanagan, L.B.; Scott, R.L.; Bernacchi, C.J.; Joo, E.; Brunsell, N.A.; Verfaillie, J.; Richardson, A.D. Productivity of North American grasslands is increased under future climate scenarios despite rising aridity. Nat. Clim. Chang. 2016, 6, 710–714. [Google Scholar] [CrossRef]
- Melaas, E.K.; Friedl, M.A.; Richardson, A.D. Multiscale modeling of spring phenology across Deciduous Forests in the Eastern United States. Glob. Chang. Biol. 2016, 22, 792–805. [Google Scholar] [CrossRef] [PubMed]
- Lu, S.; Lu, X.; Zhao, W.; Liu, Y.; Wang, Z.; Omasa, K. Comparing vegetation indices for remote chlorophyll measurement of white poplar and Chinese elm leaves with different adaxial and abaxial surfaces. J. Exp. Bot. 2015, 66, 5625–5637. [Google Scholar] [CrossRef] [PubMed]
- Soudani, K.; le Maire, G.; Dufrêne, E.; François, C.; Delpierre, N.; Ulrich, E.; Cecchini, S. Evaluation of the onset of green-up in temperate deciduous broadleaf forests derived from Moderate Resolution Imaging Spectroradiometer (MODIS) data. Remote Sens. Environ. 2008, 112, 2643–2655. [Google Scholar] [CrossRef]
- Yang, H.; Yang, X.; Heskel, M.; Sun, S.; Tang, J. Seasonal variations of leaf and canopy properties tracked by ground-based NDVI imagery in a temperate forest. Sci. Rep. 2017, 7, 1–10. [Google Scholar] [CrossRef]
- Melaas, E.K.; Sulla-Menashe, D.; Gray, J.M.; Black, T.A.; Morin, T.H.; Richardson, A.D.; Friedl, M.A. Multisite analysis of land surface phenology in North American temperate and boreal deciduous forests from Landsat. Remote Sens. Environ. 2016, 186, 452–464. [Google Scholar] [CrossRef]
- Yan, D.; Zhang, X.; Nagai, S.; Yu, Y.; Akitsu, T.; Nasahara, K.N.; Ide, R.; Maeda, T. Evaluating land surface phenology from the Advanced Himawari Imager using observations from MODIS and the Phenological Eyes Network. Int. J. Appl. Earth Obs. Geoinf. 2019, 79, 71–83. [Google Scholar] [CrossRef]
- Balzarolo, M.; Vicca, S.; Nguy-Robertson, A.L.; Bonal, D.; Elbers, J.A.; Fu, Y.H.; Grünwald, T.; Horemans, J.A.; Papale, D.; Peñuelas, J.; et al. Matching the phenology of Net Ecosystem Exchange and vegetation indices estimated with MODIS and FLUXNET in-situ observations. Remote Sens. Environ. 2016, 174, 290–300. [Google Scholar] [CrossRef]
- Grace, J.; Nichol, C.; Disney, M.; Lewis, P.; Quaife, T.; Bowyer, P. Can we measure terrestrial photosynthesis from space directly, using spectral reflectance and fluorescence? Glob. Chang. Biol. 2007, 13, 1484–1497. [Google Scholar] [CrossRef]
- Körner, C.; Basler, D. Phenology under global warming. Science 2010, 327, 1461–1462. [Google Scholar] [CrossRef]
- Caffarra, A.; Eccel, E. Increasing the robustness of phenological models for Vitis vinifera cv. Chardonnay. Int. J. Biometeorol. 2010, 54, 255–267. [Google Scholar] [CrossRef]
- Lupi, C.; Morin, H.; Deslauriers, A.; Rossi, S. Xylem phenology and wood production: Resolving the chicken-or-egg dilemma. Plant, Cell Environ. 2010, 33, 1721–1730. [Google Scholar] [CrossRef] [PubMed]
- Rossi, S.; Morin, H.; Deslauriers, A. Causes and correlations in cambium phenology: Towards an integrated framework of xylogenesis. J. Exp. Bot. 2012, 63, 2117–2126. [Google Scholar] [CrossRef] [PubMed]
- D’Aoust, A.L.; Hubac, C. Phytochrome action and frost hardening in black spruce seedlings. Physiol. Plant. 1986, 67, 141–144. [Google Scholar] [CrossRef]
- Beaulieu, J.; Perron, M.; Bousquet, J. Multivariate patterns of adaptive genetic variation and seed source transfer in Picea mariana. Can. J. For. Res. 2004, 34, 531–545. [Google Scholar] [CrossRef]
- Lu, L.; Kuenzer, C.; Wang, C.; Guo, H.; Li, Q. Evaluation of three MODIS-derived vegetation index time series for dryland vegetation dynamics monitoring. Remote Sens. 2015, 7, 7597–7614. [Google Scholar] [CrossRef]
- Schwartz, M.D.; Reed, B.C. Surface phenology and satellite sensor-derived onset of greenness: An initial comparison. Int. J. Remote Sens. 1999, 20, 3451–3457. [Google Scholar] [CrossRef]
- Hufkens, K.; Friedl, M.; Sonnentag, O.; Braswell, B.H.; Milliman, T.; Richardson, A.D. Linking near-surface and satellite remote sensing measurements of deciduous broadleaf forest phenology. Remote Sens. Environ. 2012, 117, 307–321. [Google Scholar] [CrossRef]


| Coefficients | Year | ||
|---|---|---|---|
| 2015 | 2017 | 2018 | |
| min | 0.322 | 0.325 | 0.291 |
| max | 0.917 | 0.858 | 0.875 |
| S | 121.04 | 118.34 | 122.43 |
| A | 283.78 | 310.86 | 289.73 |
| mS | 0.06 | 0.08 | 0.07 |
| mA | −0.04 | −0.05 | −0.05 |
| Year | Bud Break (DOY) | Bud Set (DOY) | ||||
|---|---|---|---|---|---|---|
| Min | Max | Coefficient of Variation | Min | Max | Coefficient of Variation | |
| 2009 | 120 | 179 | 5.01 | 214 | 308 | 6.79 |
| 2010 | 115 | 165 | 4.96 | 216 | 293 | 4.06 |
| 2011 | 126 | 177 | 5.04 | 214 | 302 | 4.29 |
| 2012 | 118 | 180 | 5.80 | 213 | 309 | 5.22 |
| 2013 | 118 | 162 | 4.39 | 215 | 305 | 5.38 |
| 2014 | 121 | 172 | 4.57 | 211 | 303 | 4.73 |
| 2015 | 122 | 174 | 5.40 | 217 | 305 | 5.13 |
| 2016 | 124 | 172 | 3.02 | 217 | 309 | 5.66 |
| 2017 | 126 | 171 | 3.69 | 221 | 301 | 3.18 |
| 2018 | 126 | 173 | 5.15 | 216 | 290 | 3.45 |
© 2019 by the authors. Licensee MDPI, Basel, Switzerland. This article is an open access article distributed under the terms and conditions of the Creative Commons Attribution (CC BY) license (http://creativecommons.org/licenses/by/4.0/).
Share and Cite
Khare, S.; Drolet, G.; Sylvain, J.-D.; Paré, M.C.; Rossi, S. Assessment of Spatio-Temporal Patterns of Black Spruce Bud Phenology across Quebec Based on MODIS-NDVI Time Series and Field Observations. Remote Sens. 2019, 11, 2745. https://doi.org/10.3390/rs11232745
Khare S, Drolet G, Sylvain J-D, Paré MC, Rossi S. Assessment of Spatio-Temporal Patterns of Black Spruce Bud Phenology across Quebec Based on MODIS-NDVI Time Series and Field Observations. Remote Sensing. 2019; 11(23):2745. https://doi.org/10.3390/rs11232745
Chicago/Turabian StyleKhare, Siddhartha, Guillaume Drolet, Jean-Daniel Sylvain, Maxime Charles Paré, and Sergio Rossi. 2019. "Assessment of Spatio-Temporal Patterns of Black Spruce Bud Phenology across Quebec Based on MODIS-NDVI Time Series and Field Observations" Remote Sensing 11, no. 23: 2745. https://doi.org/10.3390/rs11232745
APA StyleKhare, S., Drolet, G., Sylvain, J.-D., Paré, M. C., & Rossi, S. (2019). Assessment of Spatio-Temporal Patterns of Black Spruce Bud Phenology across Quebec Based on MODIS-NDVI Time Series and Field Observations. Remote Sensing, 11(23), 2745. https://doi.org/10.3390/rs11232745