Article

Radiometric Variations of On-Orbit FORMOSAT-5 RSI from Vicarious and Cross-Calibration Measurements

1
Center for Space and Remote Sensing Research, National Central University, Taoyuan City 320, Taiwan
2
National Space Program Organization, National Applied Research Laboratories, Hsinchu City 300, Taiwan
*
Author to whom correspondence should be addressed.
Remote Sens. 2019, 11(22), 2634; https://doi.org/10.3390/rs11222634
Submission received: 8 October 2019 / Revised: 5 November 2019 / Accepted: 8 November 2019 / Published: 11 November 2019

Abstract

:
A new Taiwanese satellite, FORMOSAT-5 (FS-5), with a payload remote sensing instrument (RSI) was launched in August 2017 to continue the mission of its predecessor FORMOSAT-2 (FS-2). Similar to FS-2, the RSI provides 2-m resolution panchromatic and 4-m resolution multi-spectral images as the primary payload on FS-5. However, the radiometric properties of the optical sensor may vary, based on the environment and time after being launched into the space. Thus, maintaining the radiometric quality of FS-5 RSI imagery is essential and significant to scientific research and further applications. Therefore, the objective of this study aimed at the on-orbit absolute radiometric assessment and calibration of on-orbit FS-5 RSI observations. Two renowned approaches, vicarious calibrations and cross-calibrations, were conducted at two calibration sites that employ a stable atmosphere and high surface reflectance, namely, Alkali Lake and Railroad Valley Playa in North America. For cross-calibrations, the Landsat-8 Operational Land Imager (LS-8 OLI) was selected as the reference. A second simulation of the satellite signal in the solar spectrum (6S) radiative transfer model was performed to compute the surface reflectance, atmospheric effects, and path radiance for the radiometric intensity at the top of the atmosphere. Results of vicarious calibrations from 11 field experiments demonstrated high consistency with those of seven case examinations of cross-calibration in terms of physical gain in spectra, implying that the practicality of the proposed approaches is high. Moreover, the multi-temporal results illustrated that RSI decay in optical sensitivity was evident after launch. The variation in the calibration coefficient of each band showed no obvious consistency (6%–24%) in 2017, but it tended to be stable at the order of 3%–5% of variation in most spectral bands during 2018. The results strongly suggest that periodical calibration is required and essential for further scientific applications.

Graphical Abstract

1. Introduction

FORMOSAT-5 (FS-5), launched in August 2017, is the first indigenously developed Earth observation satellite by the National Space Organization of Taiwan. FS-5 is the follow up satellite of FS-2 with a 2-day revisiting orbit. FS-5 carries a Taiwanese, domestic-made remote sensor, remote sensing instrument (FS-5 RSI). FS-5 RSI has a similar spectral bandwidth and radiometric properties to FS-2 RSI, but it has a higher radiometric resolution (8-bit to 12-bit) and spatial resolution in multi-spectral bands (8-m to 4-m). FS-5 RSI is also the first Earth observance satellite equipped with complementary metal-oxide-semiconductor (CMOS) detectors [1]. The sensitivity and accuracy of the on-board sensors are subject to change with time and under various circumstances, for instance, the physical gains of FS-2 RSI vary significantly after launch, which is shown in Figure 1 [2,3,4,5,6]. This optical sensor phenomenon was obvious, especially during the first year after launch. Thus, periodical calibration is fundamental and essential for the optical sensors to maintain radiometric quality of observed imagery in a consistent manner [7,8,9,10,11,12,13]. There are generally three kinds of methods for conducting post-launch absolute radiometric calibrations: lunar and vicarious calibrations, and cross-calibrations. First, the lunar calibration approach uses the Moon as a calibration source for sensors on orbit, and it has been shown to be successful because the Moon is a diffuse solar reflector with exceptional stability. Nevertheless, there are some shortcomings such as the limited dynamic range, non-Lambertian reflectance, and variations in the distance of sensors to the Moon [14].
Second, vicarious calibration uses natural reference targets for instrument calibration coincident with a satellite overpass. This method has been applied to estimate absolute radiance calibrations of FS-2 RSI using an airport runway as the calibration site on Dongsha Island [5]. With the input of in situ atmospheric parameters and surface reflectance, the TOA (top of atmosphere) radiance of each spectral band is computed by the LOWTRAN-7 radiation transfer model. Compared to the coincident digital number recorded by the FS-2 RSI sensor, results indicated there were obvious variations in physical gains (approximately 20%) in the period after launch in September 2004. In addition, Liu et al. [15] conducted radiometric calibrations of the FORMOSAT-2 RSI based on ground data collected by the advanced spaceborne thermal emission and reflection radiometer (ASTER) calibration team at Ivanpah Playa and Railroad Valley in the United States from 2006 to 2008 [6]. The vicarious calibration results showed that the degradations of sensitivity were 8% to 12% (visible), 9.6% (PAN), and 2.2% (near-infrared), respectively. However, several prerequisites needed to be considered such as homogeneous and bright surfaces, atmospheric stability, and cloud cover effects of the calibration site. Therefore, vicarious calibration is rather complex, time consuming, and laborious, although it is practical in that it gives precise results.
Third, the cross-calibration approach compares the radiation delivered by sensors on different satellites, which is generally applied for monitoring and identifying the radiometric performance of satellite optical sensors. Cross-calibration is typically done through comparisons of band-to-band data, which have overlapping spectra and similar spectral response functions of different sensors. For instance, the spectral band difference effect (SBDE) of Landsat-8 OLI (Operational Land Imager) and Landsat-7 ETM+ (Enhanced Thematic Mapper Plus) sensors was investigated by Mishra et al. [16], and the results showed that Earth Observing 1 (EO-1) Hyperion images could be used to compensate the relative spectral response differences. In addition, by using the advanced spaceborne thermal emission and reflection radiometer (ASTER) onboard Terra as a reference, Kamei et al. [17] presented results on the cross-calibration of FS-2 RSI based on the sites at La Crau, Taklimakan Desert, Ivanpah Playa, Alkali Lake, and Railroad Valley Playa. In their study, TOA radiance was derived from the second simulation of a satellite signal in the solar spectrum (6S) model including the effects of water vapor (H2O), ozone (O3), and aerosols. Non-uniform reflection characteristics of the surface were also taken into account using the MODIS bidirectional reflectance distribution function (BRDF). The results of the BRDF corrections at Ivanpah Playa and Railroad Valley Playa sites were within 5% when compared to the preflight values from 2012. However, major error sources from this approach include observation time dissimilarity, spectral response function differences in conjunction with spectral surface reflectance and atmospheric optical depth, and observation area difference [18].
To completely evaluate and calibrate the variations in radiometric parameters of FS-5 RSI post-launch, this study intends to examine the performance of vicarious [8,12,19,20,21,22,23,24] and cross-calibrations [13,24,25,26,27,28,29,30]. Vicarious calibrations will be performed using FS-5 RSI imagery based on simultaneous measurements from ground-based instruments including the effects of the spectral band difference effect (SBDE), viewing angles, and atmosphere parameters. On the other hand, the Landsat-8 calibration and validation team (CVT) has continuously monitored the stability of the instrument with onboard vicarious calibration and pseudo invariant calibration site (PICS) based calibration methods [10,11]. An extensive study of the LS-8 OLI instrument and its preflight calibration has been described in previous literature [17,31,32]. Therefore, the well-calibrated OLI sensor was selected to serve as the cross-calibration reference in this study. The original designs of FS-2 and FS-5 did not include on-board calibration systems such as an internal calibrator (IC), full aperture solar calibrator (FASC), partial aperture solar calibrator (PASC), and solar diffuser [21,33,34]. Consequently, the objective of this study aimed to construct a viable scheme of operational radiometric calibration on-orbit for FS-5 RSI by integrating the advantages of vicarious and cross approaches. The results of radiometric calibration could assist the National Space Organization in maintaining the radiometric quality of FS-5 RSI imagery.

2. Study Area and Materials

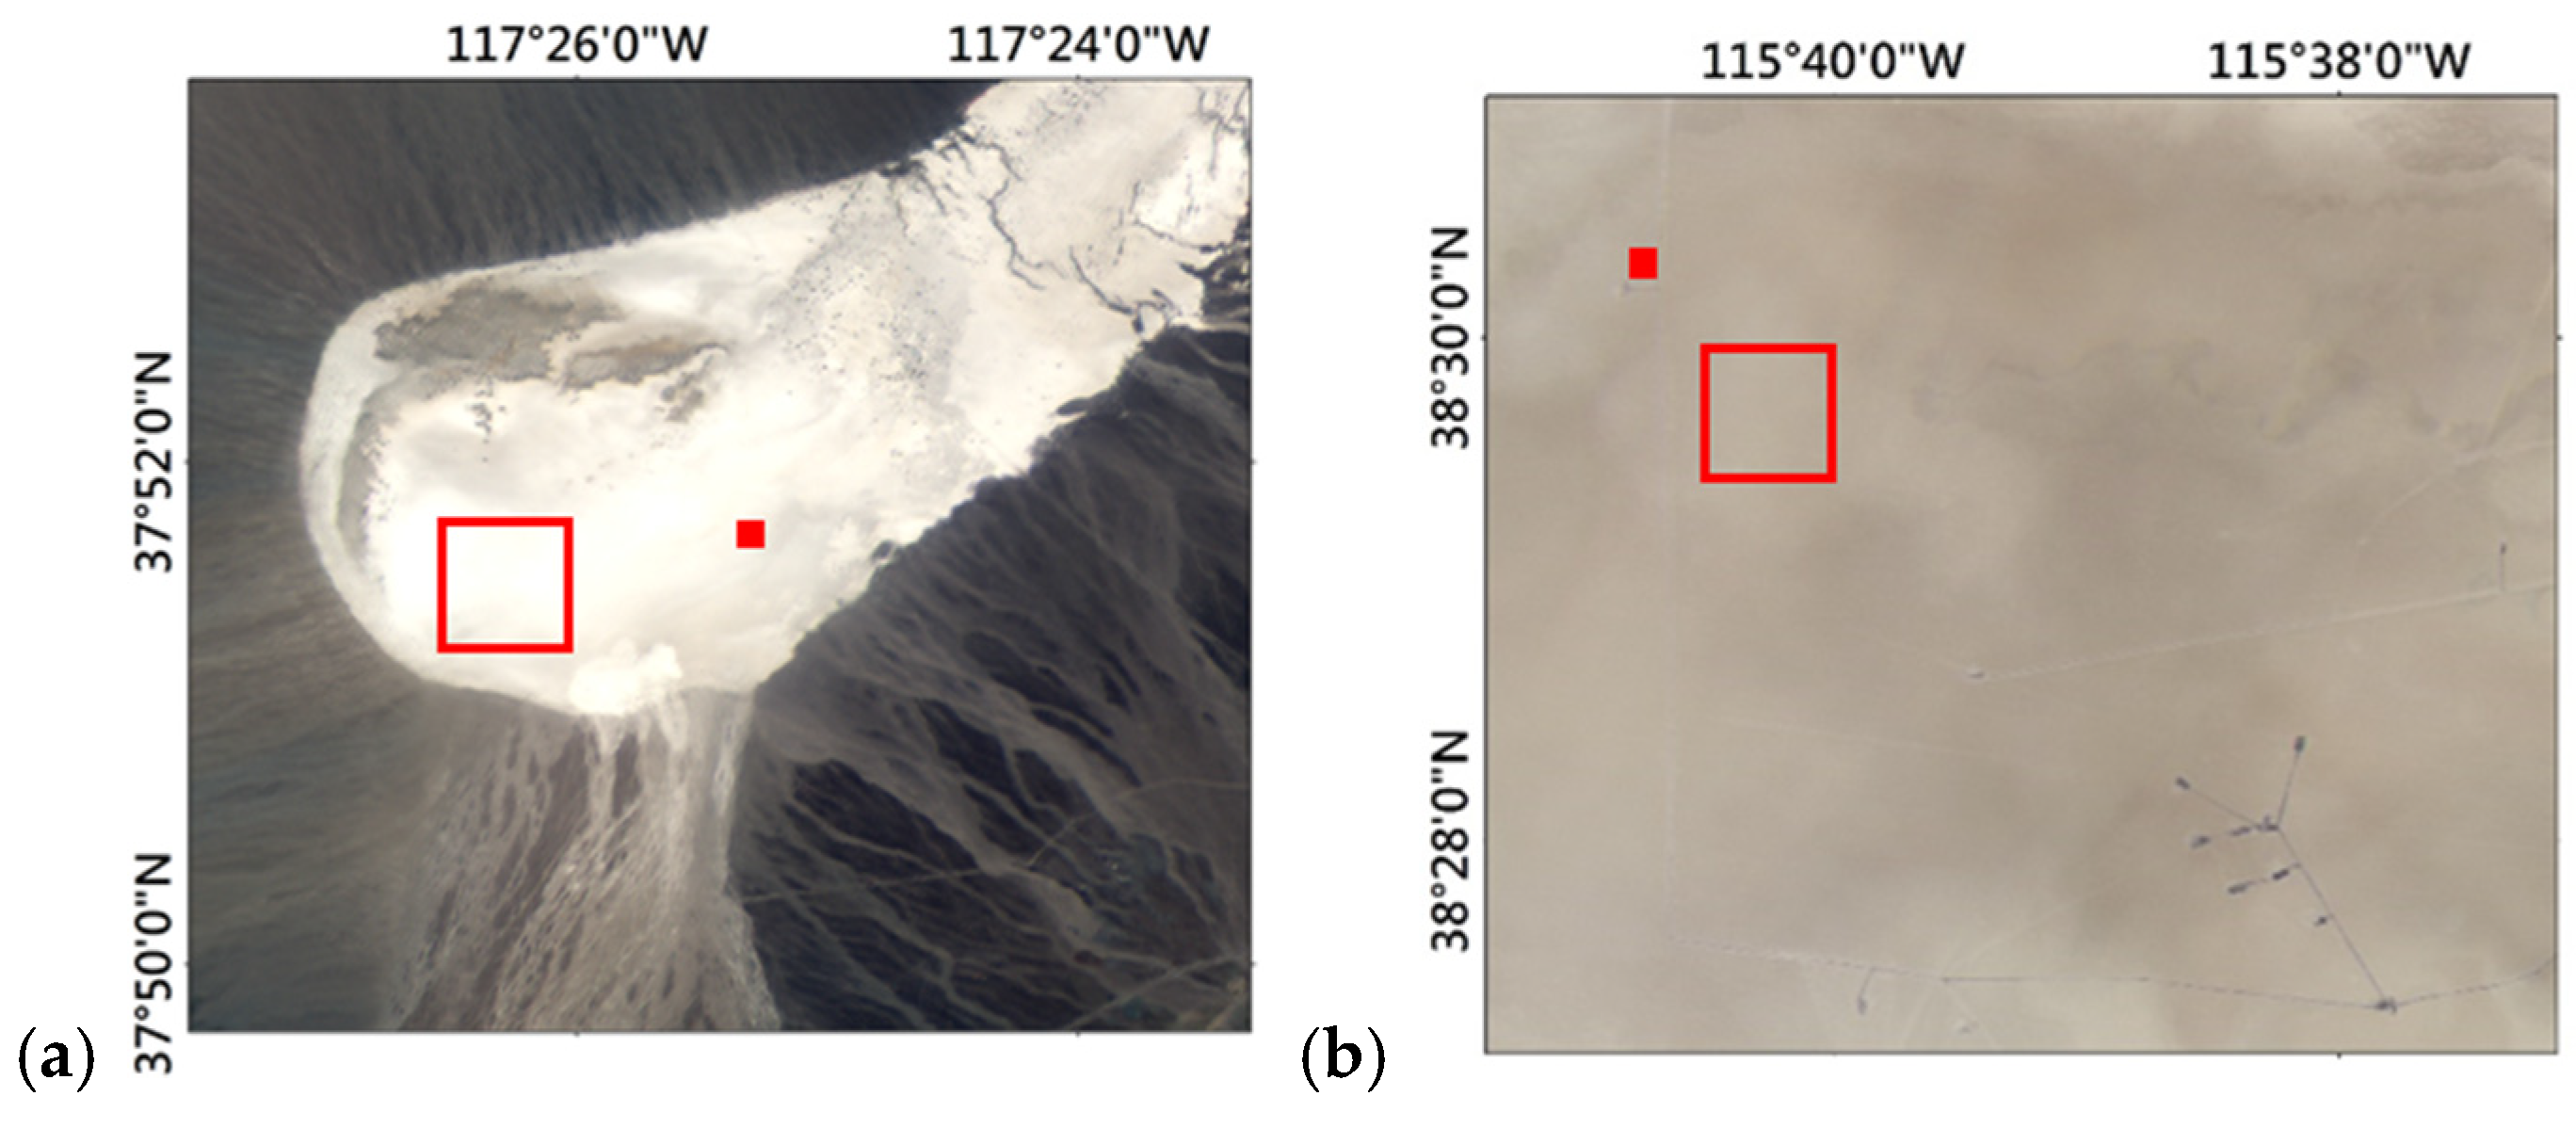
2.1. Calibration Sites

Proper calibration sites are required for on-orbit absolute radiometric calibration. To minimize the environmental and BRDF effects, desert areas are usually preferable due to the clear weather with low aerosol loading and the near-Lambertian surfaces [18,26,35]. In addition, the high surface reflectivity of these areas enhances the signal-to-noise ratio (SNR) more effectively. Thus, the calibration sites at Alkali Lake and Railroad Valley Playa, located in the Great Basin Desert of the USA, which are regularly used for radiometric calibrations of various satellite sensors due to their higher spatial uniformity and temporal stability [9,10,11,18,23,24,25,26,30,36,37,38], were selected in this study. Figure 2 and Figure 3 illustrate subsets of the FS-5 RSI Level 1A images covering the corresponding sites.
The surface reflectance of the calibration sites for vicarious calibrations measured not only the reflectance at the sensor viewing angle, but also the reflectance at different zenith and azimuth angles to obtain the complete reflectivity information of the calibration sites, as shown in Figure 3 and Figure 4, where most surface reflectivity of the calibration sites were near-Lambertian at the same zenith angle along with azimuth angles. In this study, this measurement provided BRDF and SBDE corrections for cross-calibration in the difference of observing geometry and spectral bandwidth between FS-5 and L-8.

2.2. Satellite Datasets

Eighteen cloudless scenes acquired by FS-5 RSI during the period from November 9, 2017 to September 25, 2018 were collected. Eleven of them were examined with vicarious calibration, as shown in Table 1, and seven sets of FS-5 RSI images associated with concurrent LS-8 OLI images were used for cross-calibrations, as presented in Table 2. Level 1A products of FS-5 RSI were prepared for both radiometric calibrations, and LS-8 OLI level 1T products were taken as the reference imagery for cross-calibration. The Level 1T imagery of OLI has been radiometrically calibrated, geometrically corrected, and coordinately projected [18]. The solar zenith angle (SZA), solar azimuth angle (SAA), view zenith angle (VZA), and view azimuth angle (VAA) for both sensors are also included in Table 1 and Table 2.

2.3. Atmospheric Parameters

For visible and NIR regions of the EM wave spectrum, the effects of atmospheric scattering and absorption on radiation transfer were significant, particularly the aerosol optical properties. Most atmosphere parameters are built-up in the radiative transfer code (RTC), except for aerosol optical properties. The aerosol profile and aerosol optical depth at 550 nm (AOD550) are required for TOA radiance calculations in the RTC. In this study, the aerosol profile was set in desert areas at the CNES (National Centre for Space Studies) as a reference list of calibration sites [36]. The AOD550 was retrieved from the AERONET (AErosol RObotic NETwork) station at the Alkali Lake and Railroad Valley Playa sites. For calibration sites without the AERONET station, AOD550 could be derived from the satellite products such as Terra MODIS (Moderate Resolution Imaging Spectroradiometer) (MOD04_L2) [39] and CALIPSO (Cloud-Aerosol Lidar and Infrared Pathfinder Satellite Observation) (CAL_LID_L2_05kmAPro) products [40].
In addition to aerosols, other atmospheric materials were also included in radiative transfer such as the absorption of ozone and water vapor. In the study, the data of ozone and water vapor were collected from on-site measurements of a sun photometer and are listed in Table 3.

3. Methodology

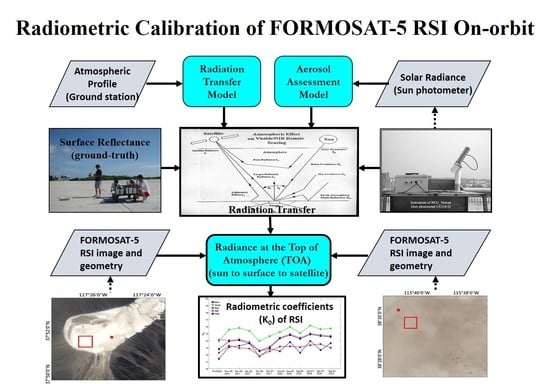
3.1. Radiation Transfer of Satellite Observations

Under the assumption of the Lambertian ground surface in the 6S model simulation, TOA reflectance is determined by the TOA radiance and solar constant, as shown in Equation (1) [15,20]:
ρ ( μ s , μ v , φ ) = ρ a ( μ s , μ v , φ ) + T ( μ s ) [ ρ exp ( τ μ v ) + ρ t d ( μ v ) ] 1 ρ s
where ρ is the TOA reflectance observed by the satellite’s sensor; μ s is the cosine of the solar zenith angle; μ v is the cosine of the sensor viewing zenith angle; ρ a is the path radiance of atmosphere; φ is the relative azimuth angle between the sun and the sensor; τ is the atmosphere optical depth; ρ is the ground surface reflectance; T is the total transmittance from the sun to the ground surface; s is the atmosphere albedo; ρ is the mean surface reflectance; and t d is the diffuse transmittance on the surface-to-sensor path. In this study, the input parameters for the RTC simulation were surface reflectance, atmospheric properties (water vapor, ozone, aerosol vertical profile, and optical depth and type), sensor geometry (SZA, SAA, VZA, and VAA), and spectral response function [41,42,43].

3.2. Assessment of Potential Effects on Radiometric Calibration

3.2.1. Atmospheric Effects

Desert regions are usually selected as calibration sites because of their atmospheric stability and clear sky conditions, which can reduce the uncertainties and complexity in calculating the radiation transfer. However, there are still some atmospheric parameters that affect radiative transfer in visible and NIR regions including aerosol, ozone, and water vapor content. Thus, radiometric calibrations are usually implemented with measurements of atmospheric components. When there is a lack of in situ measurements of atmospheric parameters, the atmospheric model (US Standard 1962) built-in 6S code and satellite aerosol products are employed to provide synchronous observed atmospheric data. The US Standard 1962 atmospheric profile is a model that defines values and profiles of atmospheric temperature, pressure, and content (Table 4). However, the atmospheric model may significantly affect the simulation output of transported radiance (Figure 5) when the actual atmospheric state differs greatly from the empirical atmospheric model, which results in errors for subsequent radiometric calibration procedures. In order to assess the uncertainty of simulated at-sensor radiance in vicarious calibration (reflectance based on FS-2 RSI bandwidth) and cross-calibration (reflectance based on LS-8 OLI bandwidth), which are affected by atmospheric components, the coefficient of variation (CV) is quantified as
CV i , a = σ ( R i , a ) R i , a ¯ 100 %
where σ ( R i , a ) and R i , a are the standard deviation and average of at-sensor radiance simulated under a atmospheric conditions in the i band, respectively.

3.2.2. Spectral Band Difference Effect (SBDE)

SBDE is a prerequisite for cross-calibration. Previous studies have shown that for the same target area, the difference of observed TOA radiance can reach as high as 25% by different sensors with similar spectral bands. By computing the relative difference of at-sensor radiance of vicarious calibration (reflectance based on FS-5 RSI bandwidth) and cross-calibration (reflectance based on LS-8 OLI bandwidth), the SBDE for the same atmosphere condition is defined as follows:
S B D E i , a = ( R c r o s s , i , a R v i c a . , i , a ) R c r o s s , i , a 100 %
where R c r o s s , i , a is the at-sensor radiance for band i under atmosphere condition a based on the cross calibration, and R v i c a . , i , a is the at-sensor radiance for band i under atmosphere condition a based on the vicarious calibration.

3.2.3. Environmental Effect

Experiments were also set up to determine the environmental effect in AERONET of visible band AOD (aerosol optical depth) products at 550 nm in various target sizes centered at calibration sites. The reflectance of the calibration site (ROC) and the reflectance of the environment (ROE) are fixed and different values. We altered the radius centered at the calibration site under the same atmosphere parameters and geometry conditions.

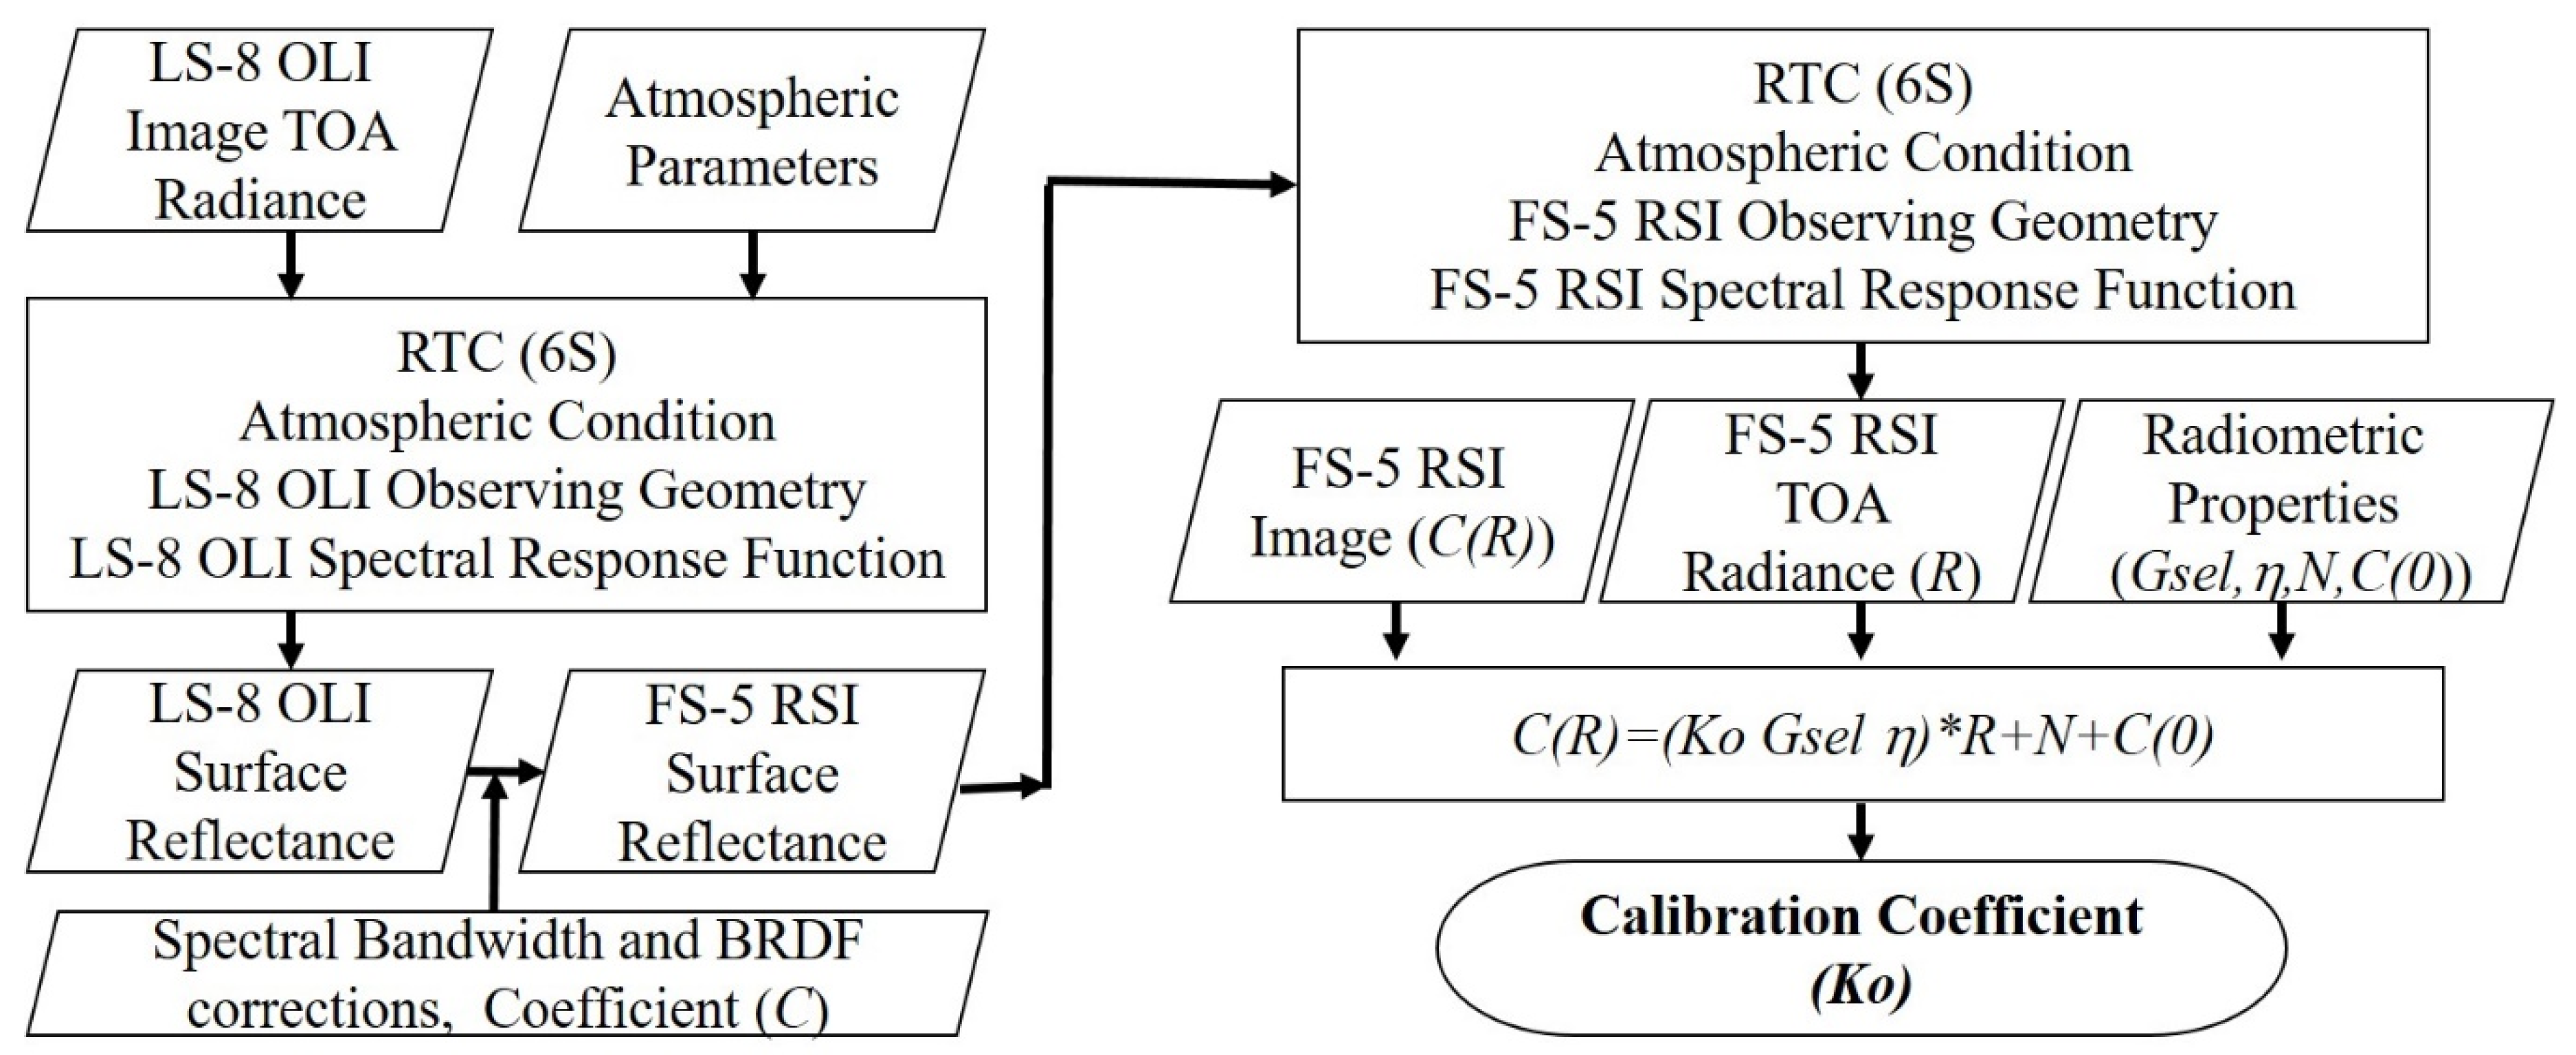
3.3. Relationship between Radiation and Digital Number of FS-5 RSI

Regarding the digital number (DN) output of the FS-5 RSI, conversion between the detected signals to the spectral at-sensor radiance in each band can be described from the following equation [15],
C ( R ) = ( K 0 G s e l η ) R + N + C ( 0 )
where C ( R ) is the output signal (DN); K 0 is the mean calibration coefficient, depending on the band; G sel is the dynamic range gain equaling to 2 j 1 2 where j is a gain number (for FS-5 RSI, j = 1,2,4); η is the relative response of each detector in the CMOS array; R is the mean spectral radiance ( W / m 2 / sr / μ m ) observed by FS-5 RSI; N is the noise; and C ( 0 ) is the offset. Considering the high SNR requirement (92 in the PAN band and over 140 in the MS bands) [6], the noise was ignorable. For the FS-5 product level 1A or above, C ( 0 ) was equal to 0, and η was equal to 1.

3.4. On-Orbit Absolute Radiometric Calibration

3.4.1. Vicarious Calibration

In this study, vicarious calibration is a reflectance-based method, which relies on ground surface reflectance measurements. The in situ ground surface reflectance at Alkali Lake and Railroad Valley were measured with a FieldSpec 3 portable spectroradiometer (made by Analytical Spectral Devices, Inc.) in the spectral range from 350 nm to 2500 nm. A SPECTRALON (made by Spectra Vista Corporation) standard reflection panel was used as the estimated ideal diffuse standard surface. Then, the in situ ground surface reflectance was measured simultaneously with the overpass of FS-5 RSI. Based on the ground surface reflectance measurements and atmospheric parameters, at-sensor radiance of FS-5 RSI was simulated by the RTC model (6S). Then, the mean calibration coefficient K0 was calculated from the grey level of the pixel, at-sensor radiance, and corresponding gain number based on Equation (4). The workflow of this procedure is shown in Figure 6. In order to facilitate the comparison of calibration results of this study with the latest instrument calibration values (i.e., dim files provided by NSPO), the relative difference between calibration values is represented as the following:
R e l a t i v e   D i f f e r e n c e i = ( K 0 . i , v i c a K 0 . i , d i m ) K 0 . , d i m 100 %
where K 0 . i , v i c a is the radiometric conversion coefficient computed from vicarious calibration in band i , and K 0 . i , d i m is the radiometric conversion coefficient provided under dim files in band i .

3.4.2. Cross-Calibration

Cross-calibration is generally employed for post-launch satellite sensors [44]. Nevertheless, coincidences are rare when comparing the two satellite sensors with different cycles, orbits, swaths, spatial, and local overpass times, and so on [1,45]. Thus, certain corrections have to be exerted on these aspects. First, the selected pairs of images for FS-5 RSI and LS-8 OLI were geometrically corrected to match with each other. This step is to maintain the consistency across all images and to avoid any discrepancies during the subsequent process. Second, FS-5 RSI images were cropped to the desired size within the areas of LS-8 OLI images. Then, the images were resampled to 25 by 25 grids [16]. Finally, the brightness grids were selected for cross-calibration. The selected grids of LS-8 OLI images (at-sensor radiance) were used as input in RTC (6S model) with the corresponding geometric conditions, atmosphere parameters, and spectral response function (SRF) to remove the atmosphere effect and obtain the spectral surface reflectance of LS-8 OLI. The corresponding spectral surface reflectance ( R e f l ¯ i ) of each sensor can be described as the following equation:
R e f l ¯ i = λ m i n ( i ) λ M a x ( i ) R e f l ( λ ) S R F ( λ ) d λ λ m i n ( i ) λ M a x ( i ) S R F ( λ ) d λ
where λ Max ( i ) is the maximum wavelength of the Full Width at Half Maximum (FWHM) of band i ; λ min ( i ) is the minimum wavelength of the FWHM of band i ; and Refl ( λ ) and SRF ( λ ) are the surface reflectance and spectral response at wavelength λ , respectively.
To properly correct the viewing geometry on cross calibration, the difference in the spectral bandwidth and BRDF effect were also considered. Despite the fact that the calibration site surface was near-Lambertian, the BRDF effect remained significant. The ground based in situ measurements of surface reflectance were used to quantify the influence for the correction of these two effects. The difference ( δ b a n d ) of spectral radiance between FS-5 RSI and LS-8 OLI in the same observing geometry can be estimated by Equation (7) below,
δ b a n d = R e f l O L I ¯ R e f l R S I ¯ R e f l O L I ¯ 100
where Refl OLI ¯ and Refl RSI ¯ are the mean surface reflectance within the spectral bandwidth of LS-8 OLI and FS-5 RSI, respectively. The BRDF effect on surface reflectance between nadir and off-nadir ( 50 0 ), δ v i e w i n g , is estimated by the following equation,
δ v i e w i n g = R e f l ¯ o f f n a d i r R e f l ¯ n a d i r R e f l ¯ n a d i r 100
where Refl ¯ off nadir and Refl ¯ nadir are the mean surface reflectance in off-nadir and in nadir, respectively. The coefficient (C) for the BRDF and spectral corrections is then derived from the combination of Equation (7) and Equation (8) and rearranged as,
C = R e f l ¯ R S I , o f f n a d i r R e f l ¯ O L I , n a d i r = ( 1 δ b a n d ) ( 1 + δ v i e w i n g )
where Refl ¯ RSI ,   off nadir and Refl ¯ OLI ,   nadir are the mean surface reflectance of FS-2 RSI and LS-8 OLI, respectively.
The flow chart of the cross-calibration is shown in Figure 7. The angular effect of surface reflectance was corrected with the BRDF according to Equation (9). Consequently, based on geometric conditions, the SRF of FS-5 RSI, and the same atmospheric parameters at the LS-8 OLI and FS-5 RSI scene acquisition times, the corresponding at-sensor radiance of FS-5 RSI was simulated using the RTC model. K 0 is derived by linear regression of FS-5 RSI at-sensor radiance grids based on LS-8 OLI images and the grey level grids of FS-5 RSI images.

4. Results and Discussion

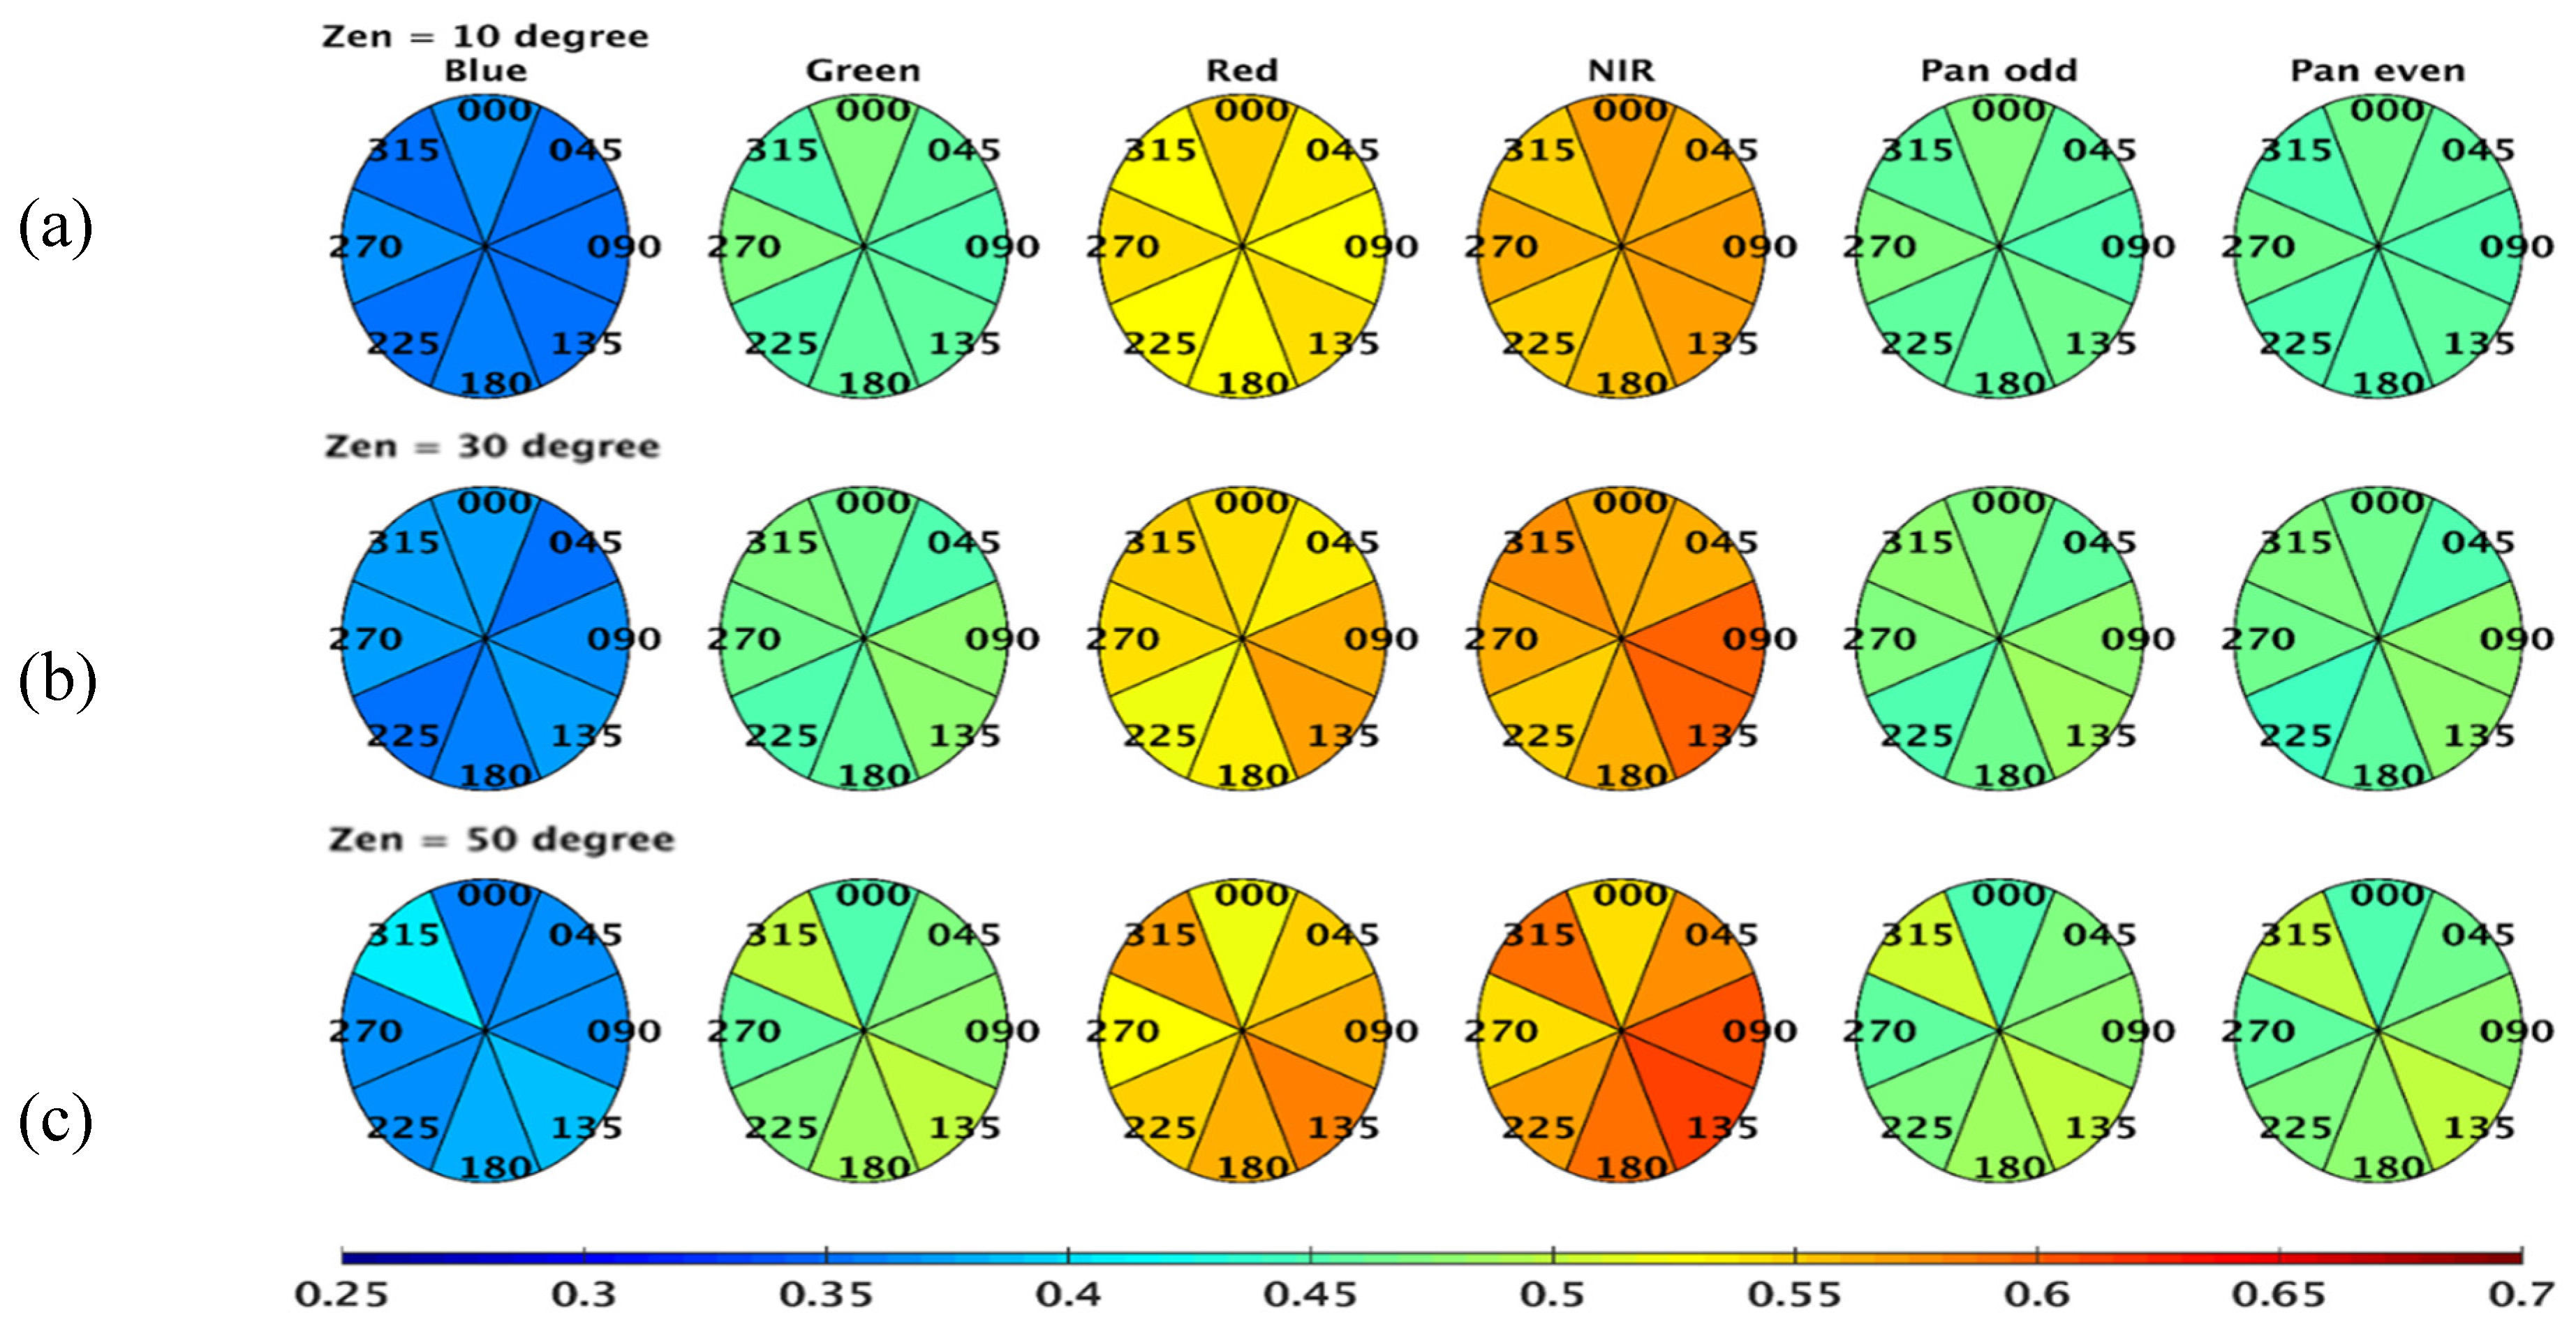
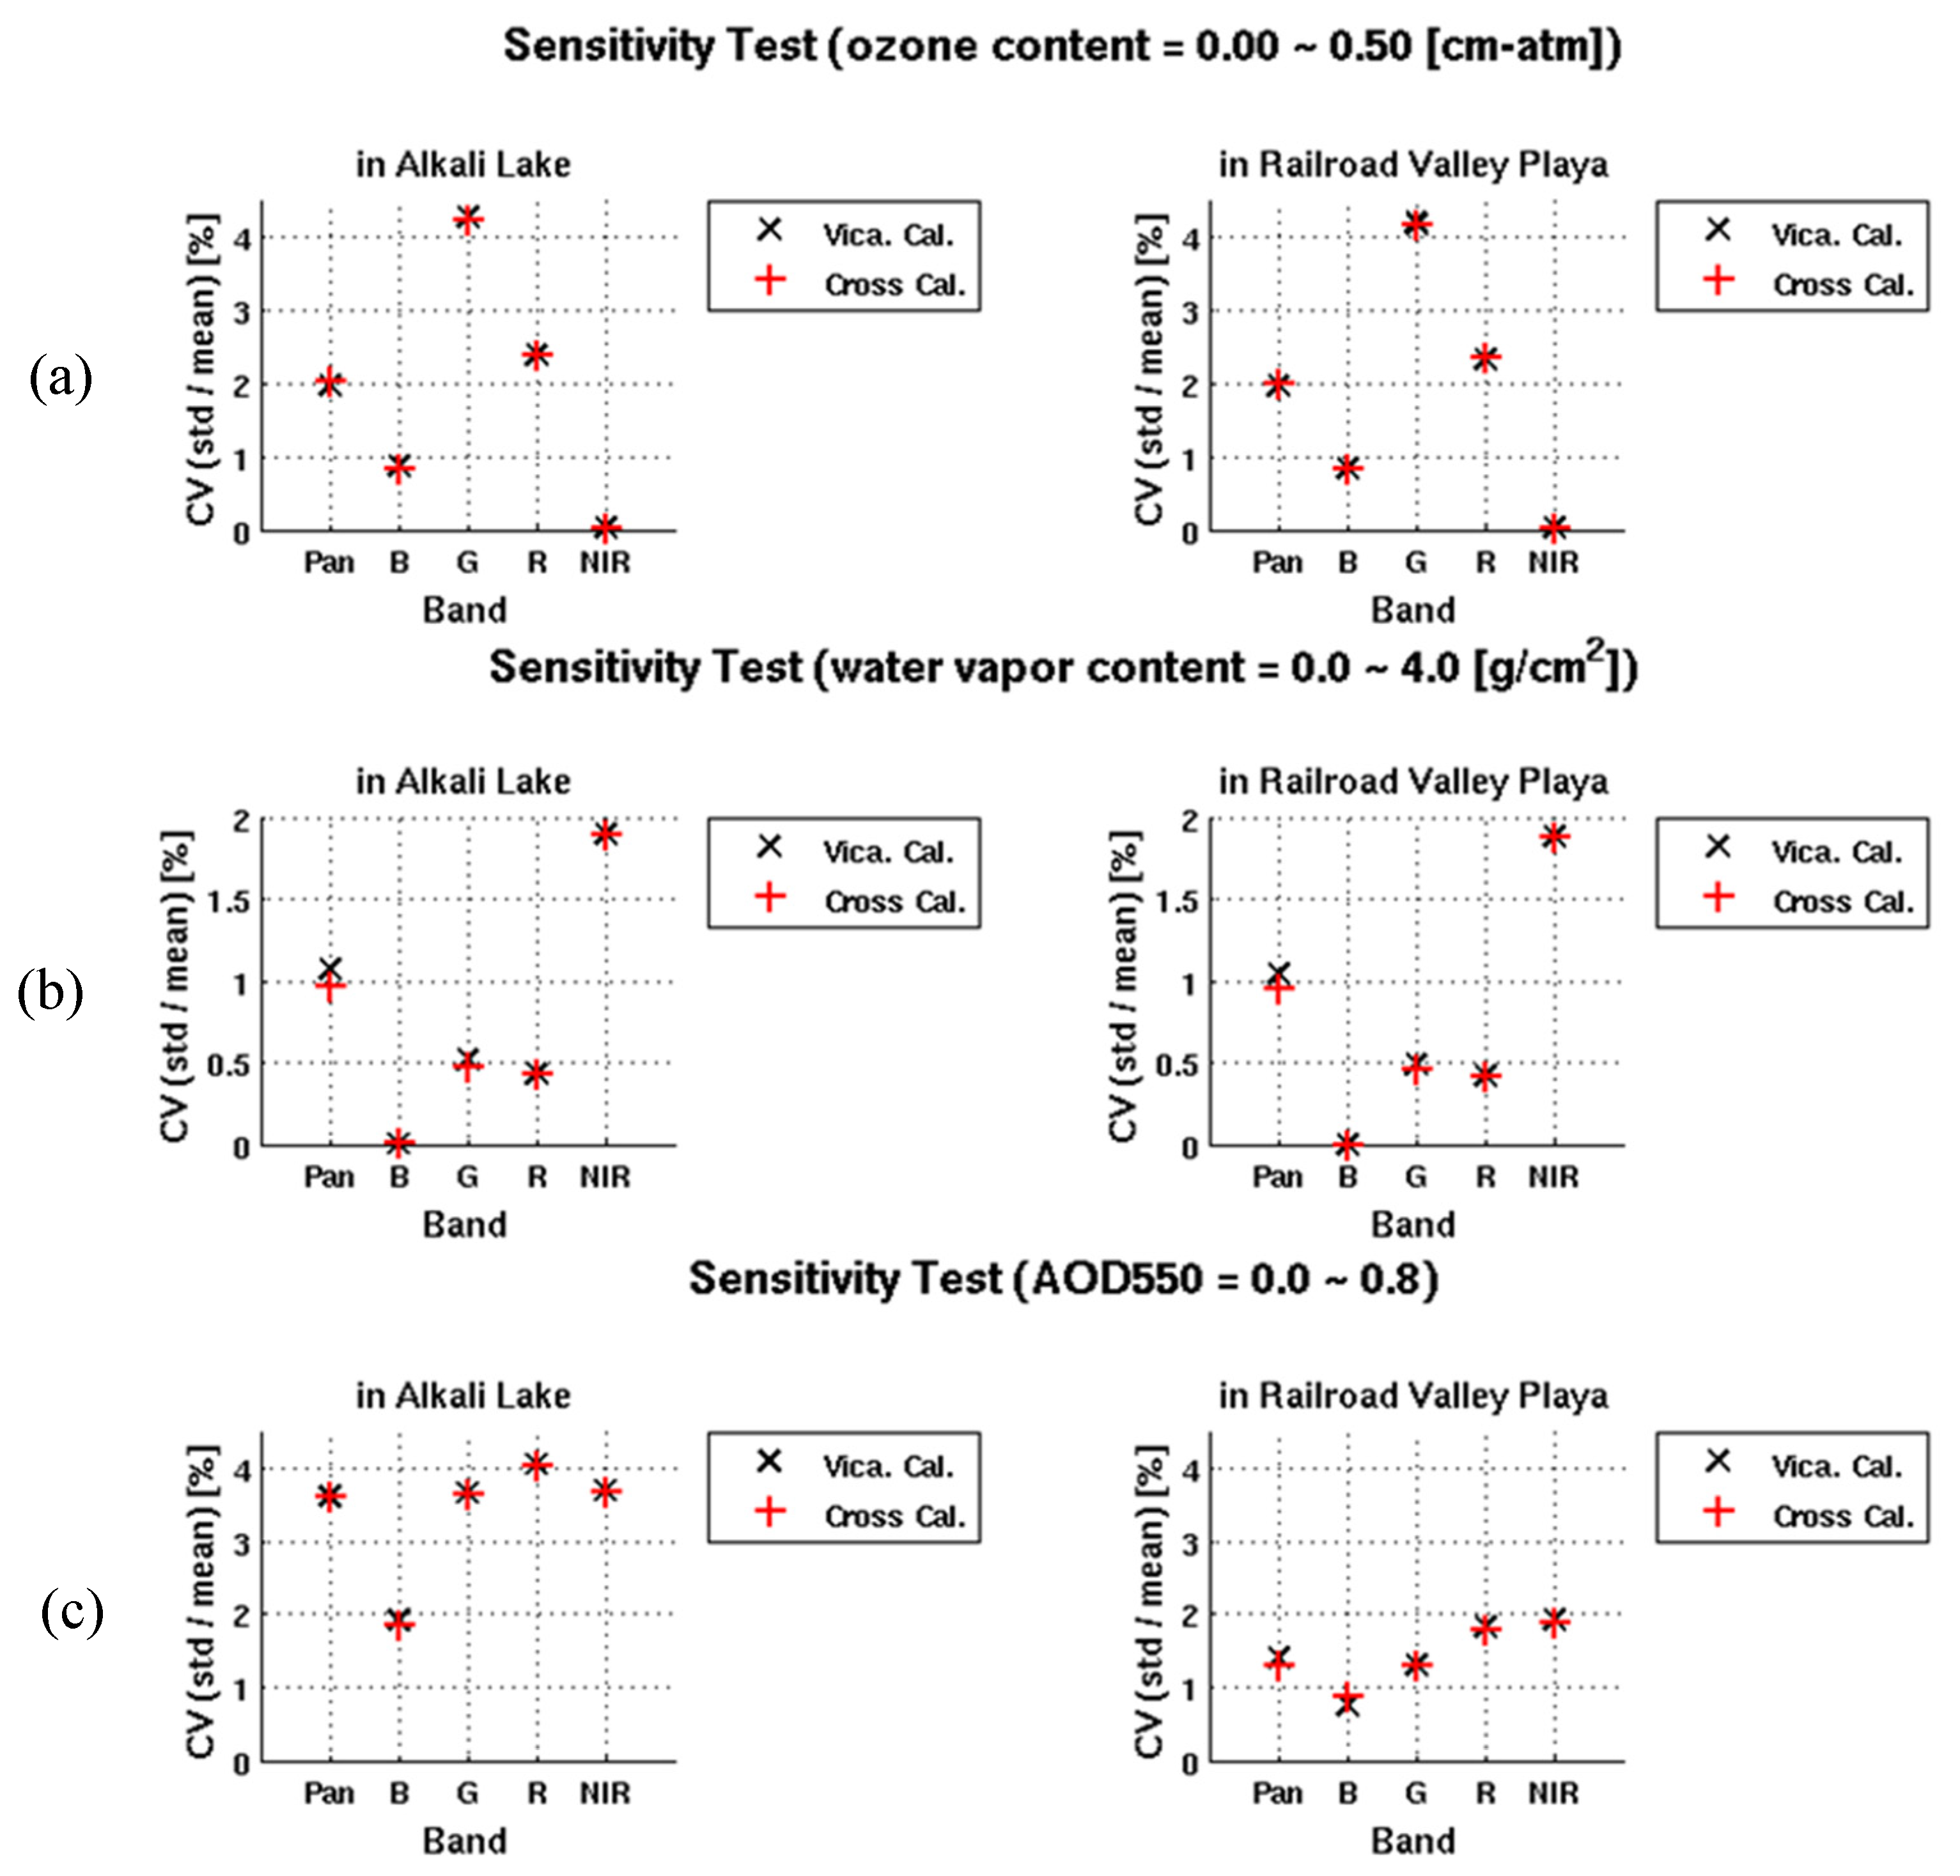
4.1. Sensitivity Study: At-Sensor Radiance/Reflectance Simulation

The FS-5 RSI at-sensor radiance for all bands was calculated by 6S simulation. Errors in atmospheric parameters (water vapor, ozone content, and AOD) may create potential uncertainties in RTC simulation. Therefore, the sensitivity of simulated FS-5 RSI at-sensor radiance was tested by changing the content of the control variables (ozone, water vapor, and AOD). The test results (Figure 8) showed that the maximum differences of CV values in at-sensor radiance calculations were approximately 4%, 2%, and 4% for the different control variables, separately. Most CV values had similar tendencies in Alkali Lake and Railroad Valley Playa, except for the AOD sensitivity test. This phenomenon may have been caused by the lower reflectance in Railroad Valley Playa. Therefore, the scattering effect caused by aerosol particles was reduced.
The SBDE test in Alkali Lake and Railroad Valley Playa between FS-5 RSI and LS-8 OLI is shown in Figure 9. The relative errors caused from SBDE were approximately 1% in the MS bands and 4% in the PAN bands. The variations of SBDE in MS bands due to different atmospheric parameter contents were lower than 0.5%. Therefore, different atmospheric conditions had limited impacts on SBDE. On the other hand, the relative errors in PAN bands were significant because of the huge difference between the RSF of FS-5 RSI and L-8 OLI. This resulted in the underestimation of the at-sensor radiance based on cross-calibration.
The environmental effect on at-sensor reflectance in different AOD550 and sizes of the calibration site are shown in Figure 10. It includes two cases: ROC > ROE and ROC < ROE. For both cases, the sizes of the calibration sites are important. The larger calibration site tended to have a lower environmental effect. As Figure 10 shows, the calibration site with a radius larger than 10 km can be considered a homogeneous surface. In addition, AOD550 played a vital role in environmental effects. The consistency of at-sensor reflectance between the different sizes of the calibration sites was determined by AOD550 loading. The higher AOD550 loading indicated a higher atmospheric effect.

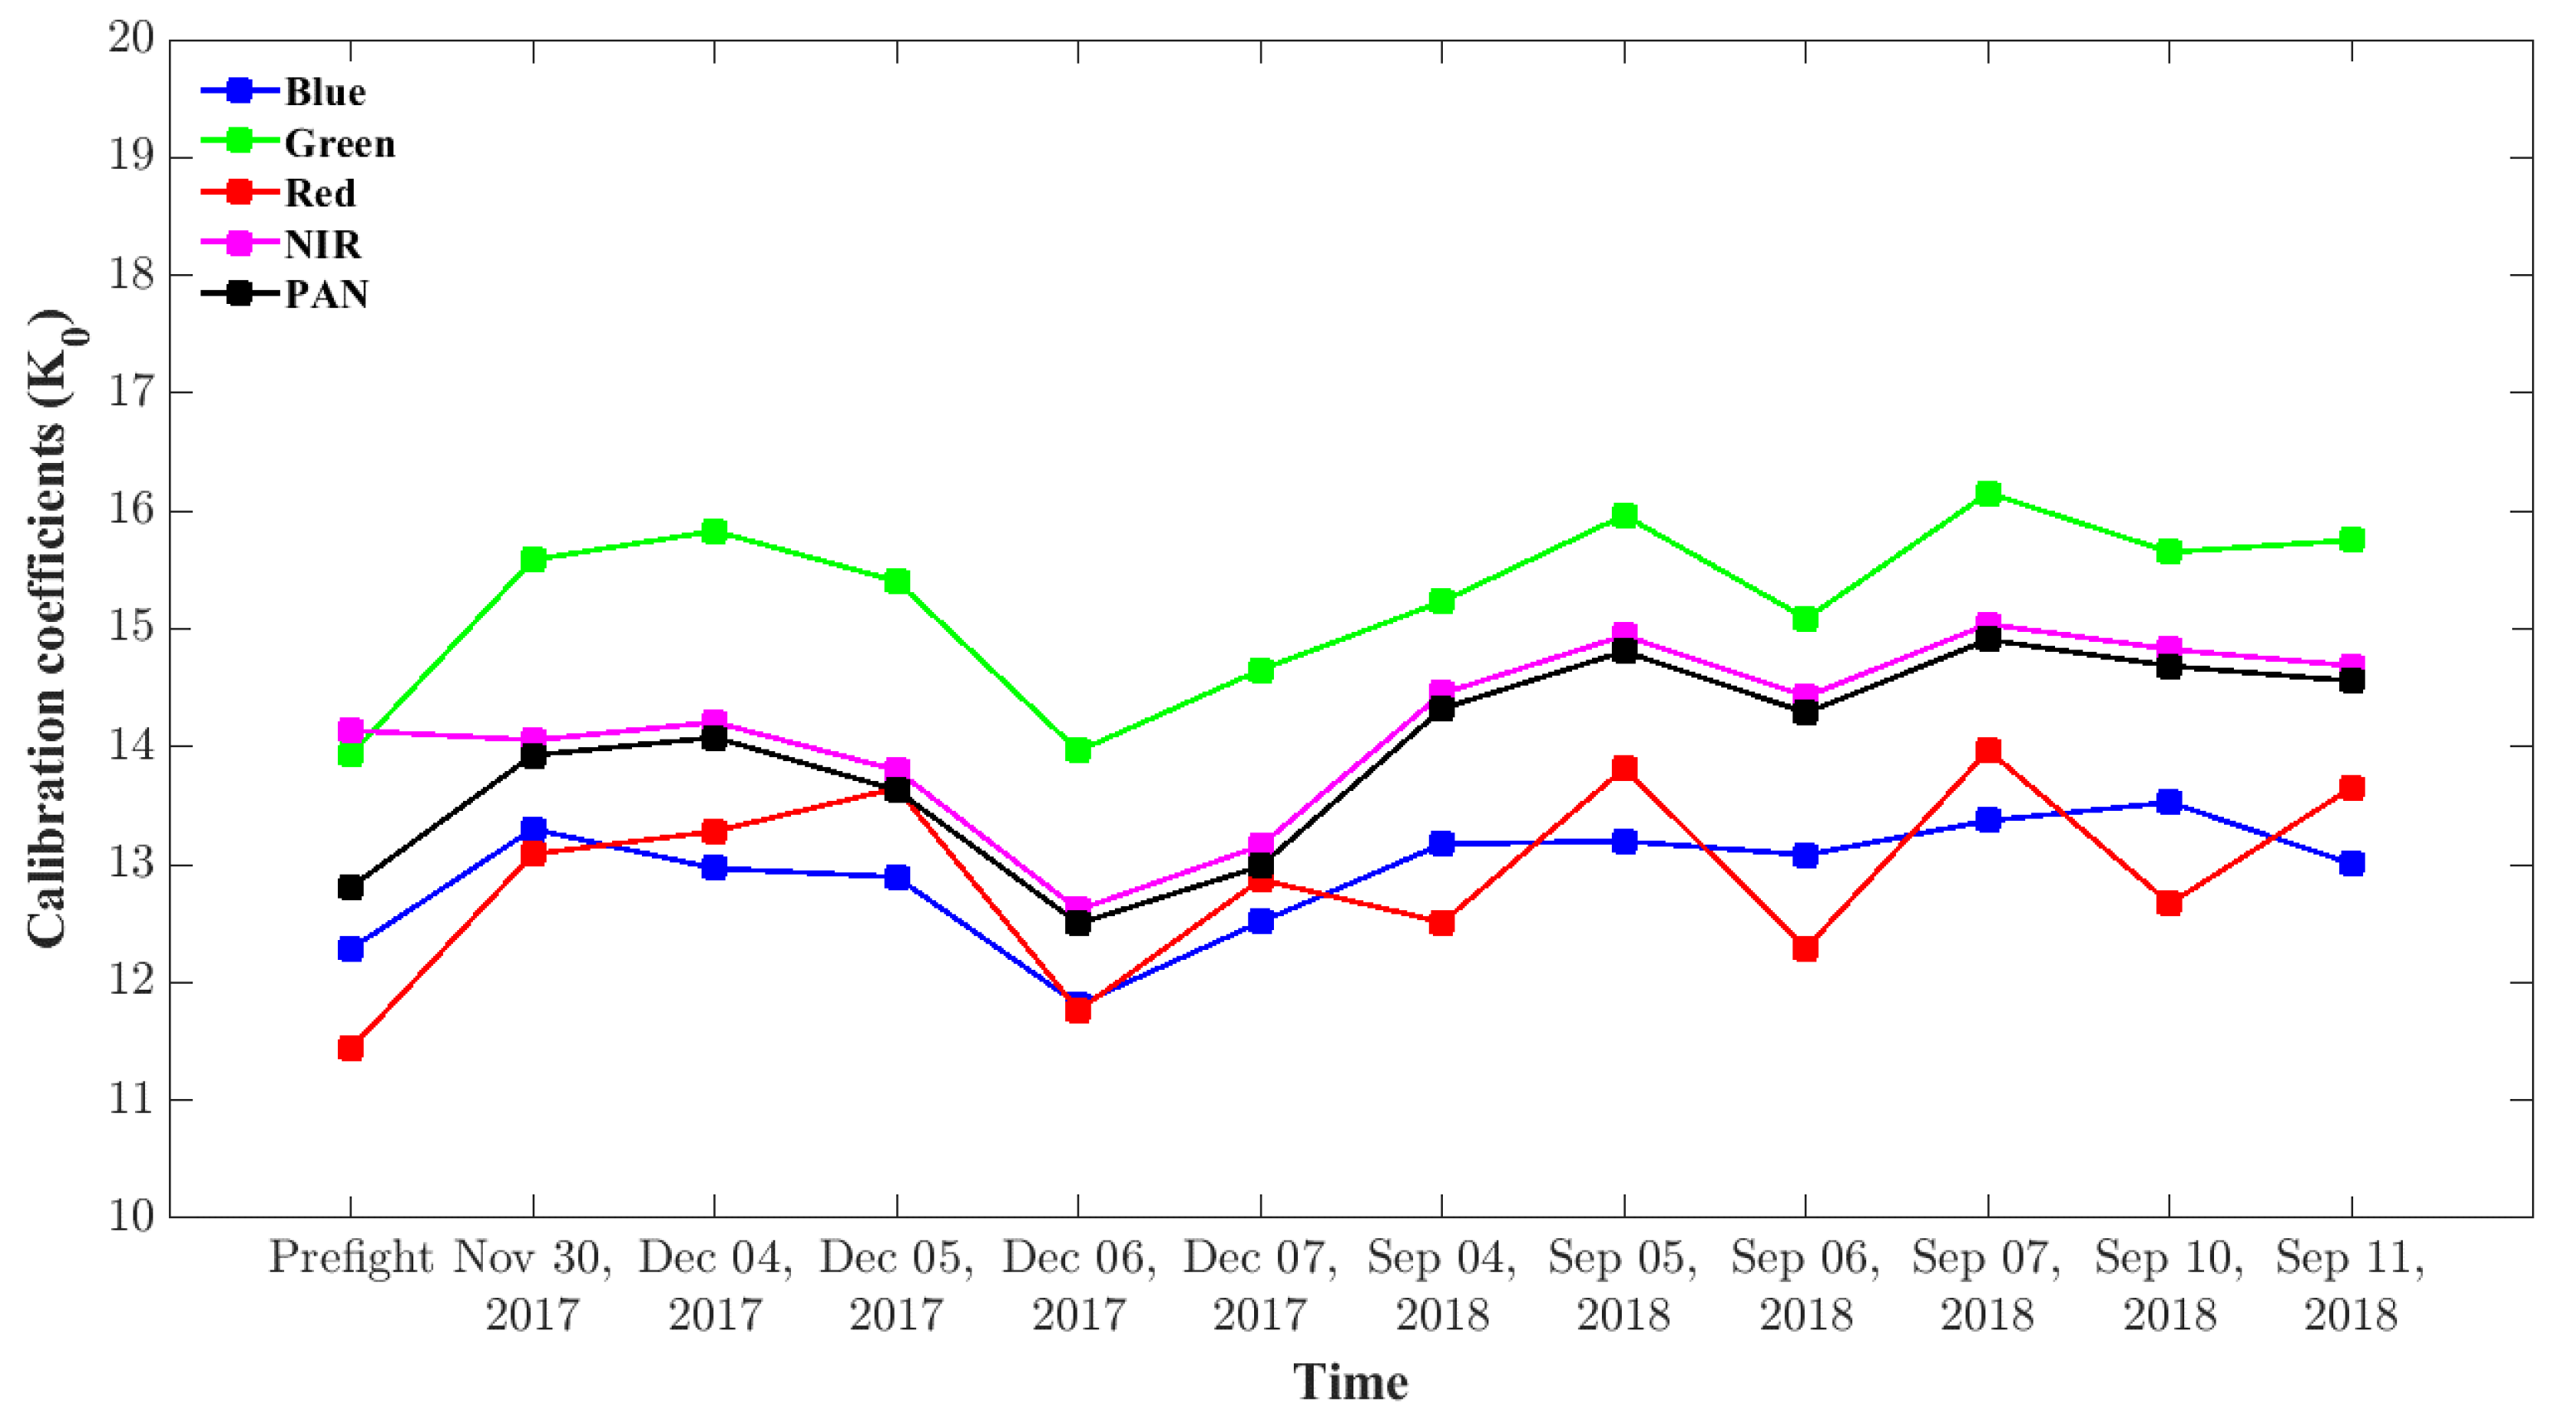
4.2. Calibration Results

4.2.1. Vicarious Calibration

Figure 11 displays the results of the vicarious calibration at two calibration sites, Alkali Lake and Railroad Valley Playa, in 2017 and 2018. The variation in calibration coefficient (K0) of each spectral band is evident, which could be mainly caused by the unstable optical system in different environments between the surface and space after launch. Most of the spectral K0s increased in 2017 (except Dec. 06), indicating the decreasing sensitivity to the optical property, which was similar to the behavior of FS-2 RSI in 2006 [19]. In 2018, the K0s tended toward stable and a slight increase excluding the red band. Table 5 summarizes the relative differences of K0 in 2018 for the calibration sites at Alkali Lake and Railroad Valley Playa. According to the previous study, the uncertainty of the absolute radiometric calibration was around ±5%, which was particularly somewhat worse right after launch [33]. Hence, there seemed to be great results for both sites. However, for panchromatic channels, the relative difference was up to 6%.
It is worth noting that some of the K0 values from Alkali Lake were relatively smaller than those of Railroad Valley Playa such as the results on Dec. 06, 2017 and Sep. 06, 2018, as shown in Figure 11. The main factor could be the obvious environmental effect caused by the very small bright playa with a dark surrounding in the region of Alkali Lake (see also Figure 2a). The radiance observed at the top of the atmosphere may be reduced because the distinct radiances between the bright playa scattered out and the dark surrounding scattered into, which could result in the smaller value and variation of K0s. Therefore, sincerely considering the environmental effect on the Alkali Lake calibration site is suggested.

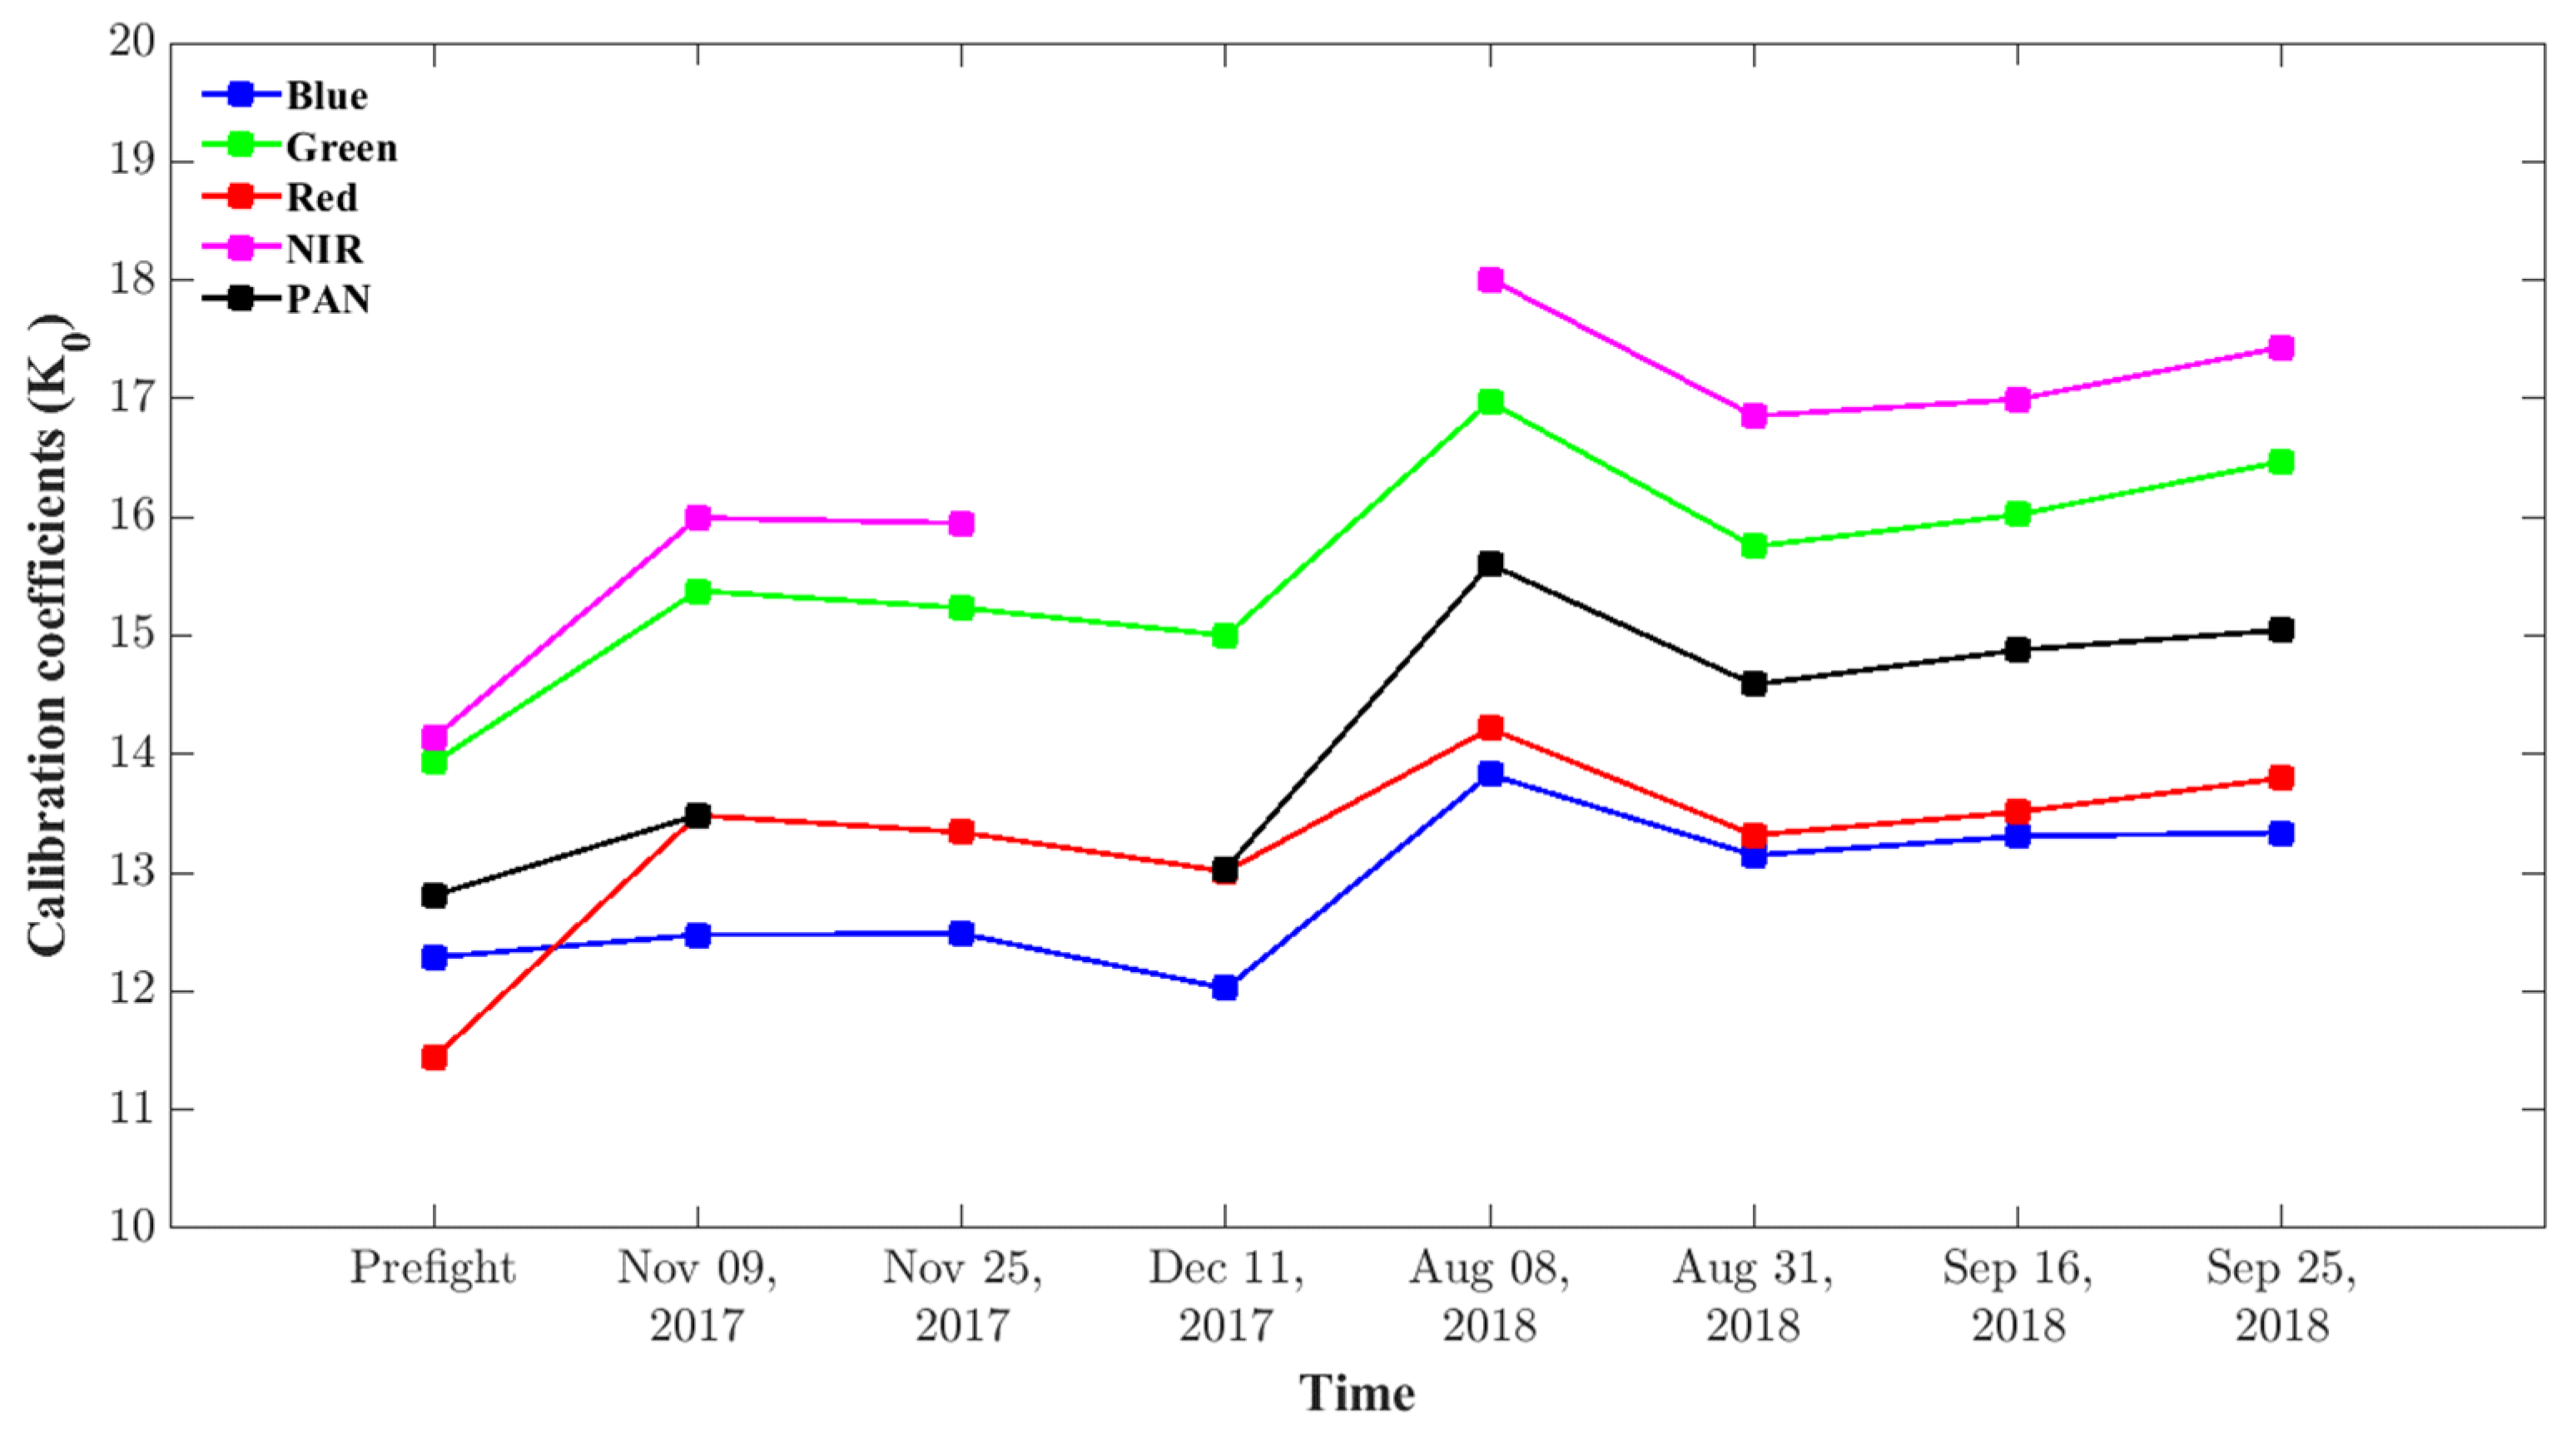
4.2.2. Cross Calibration

In Figure 12, most of the K 0 . values retrieved from cross-calibration had the same tendencies. The relative differences of K 0 values from cross-calibration results are listed in Table 6. The variation of K0 may be due to different viewing angles, surface reflectance characteristics, and observation durations between the FS-5 RSI and LS-8 OLI satellites. In addition, both sensors had a large difference in bandwidth between the near-infrared and panchromatic bands; this difference in bandwidth may also have affected the calibration results.
The standard deviations of the calibration coefficients (K0) are summarized in Table 7. The spectral K0 retrieved from the vicarious calibration and cross calibration had the same tendency, although the magnitudes between the two methods were different. The higher standard deviation of vicarious calibration could have been affected from the error source of the ground reflectance measurement and non-Lambertian ground characteristic, which is suggested as 3.3% [46]. The results of radiometric calibration demonstrated the proposed procedures were acceptable and practical. In comparison to FS-2 RSI, the K0 changed suddenly in the early years, but remained stable for the later years. The phenomenon was the same as the other satellite sensor. The calibration coefficients will affect the radiometric quality of the image, thus periodical calibration is necessary and very important for further scientific research and applications.

5. Conclusions

In this study, two kinds of on-orbit absolute radiometric approaches—vicarious calibration and cross-calibration—were examined for a new optical sensor RSI onboard FORMOSAT-5. The consistent results indicate that the proposed approaches in on-orbit radiometric calibration are highly practical. According to the results, the findings of this study can be concluded below.
  • Atmospheric variables are essential for the accurate radiometric calibration of on-orbit sensors including aerosol property, ozone, and water vapor, especially for the large viewing angle of the observations. For example, the effect of improper ozone content on radiometric calibration could reach 6%–10% uncertainty in the Red, Green, and Pan spectral bands (Figure 5a). Thus, on-orbit cross calibration is recommended rather than vicarious calibration when atmospheric measurements are lacking.
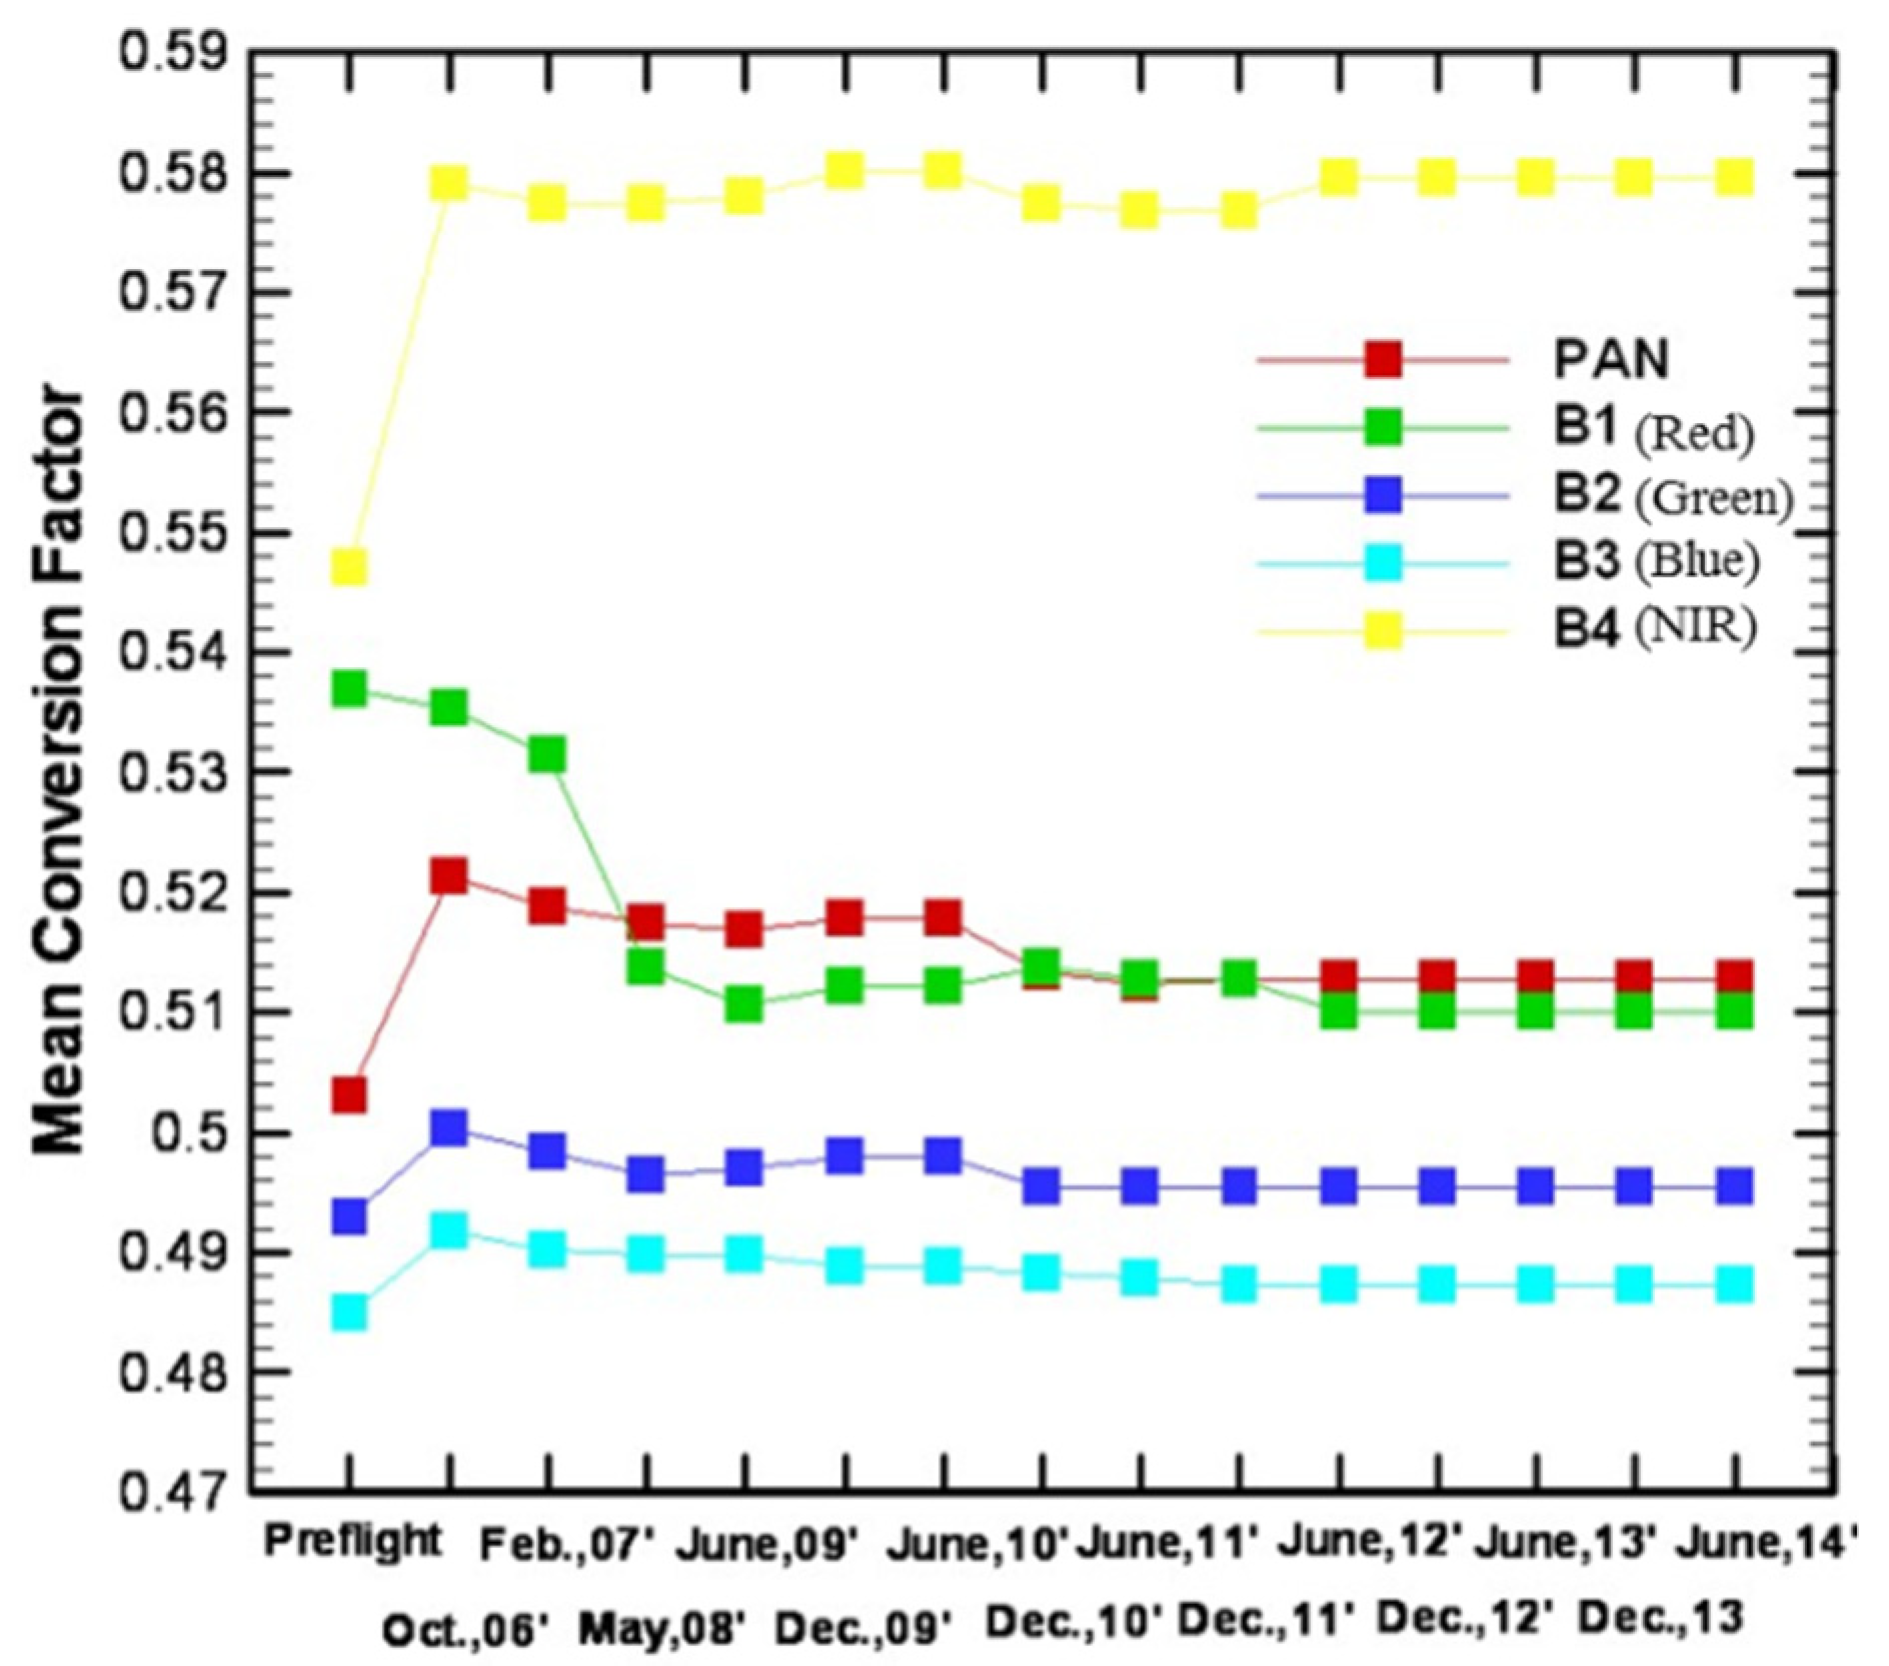
  • Both vicarious and cross-calibration methods show a decaying optical sensitivity, which resulted in rapid changes (6%–24% in radiometric coefficient) during the first year after launch. Most calibration results remained stable, around 3%–5% relative difference, in the second year. To maintain image quality, further research is suggested to keep track of FORMOSAT-5 RSI radiometric variation.

Author Contributions

T.-H.L., G.-R.L. and F.-A.T. conceived and designed the experiments; J.-C.C. and S.-K.Z. performed the experiments and analyzed the data; K.-H.H. and Y.-S.L. contributed satellite and ground based instrumental tools; and T.-H.L., G.-R.L., F.-A.T., and H.-P.C. wrote the paper.

Acknowledgments

The authors gratefully acknowledge the National Space Organization (NSPO) for the provision of FS-5 RSI images and the Science and Technology Division, Taipei Economic and Cultural Office in Los Angeles for supporting ground measurements in the USA. The authors are thankful for all of the helpful colleagues at the Center for Space and Remote Sensing Research (CSRSR) and the Graduate Institute of Space Science (GISS) at the National Central University (NCU). This research was funded by the NSPO-S-106080 and NSPO-S-107067 projects. We would like to extend our thanks to the editor and reviewers for their careful and constructive comments, which have improved the quality of the manuscript substantially.

Conflicts of Interest

The authors declare no conflicts of interest.

References

  1. Ling, J. Applications of CMOS Sensors on FORMOSAT-5 Remote Sensing Instrument. In Proceedings of the Workshop on CMOS Applications in Astronomy and Space Sciences, National Tsing Hua University, Hsinchu, Taiwan, 5–6 January 2011. [Google Scholar]
  2. Chern, J.S.; Wu, A.M.; Lin, S.F. On-orbit performance verification of FORMOSAT-2—A look back. J. Aeronaut. Astronaut. Aviat. Ser. A 2009, 41, 205–211. [Google Scholar]
  3. Hsu, K.-H.; Lee, S.; Chen, N.-Y.; Wu, A.-M. Evolution of On-Orbit Radiometric Calibration of Formosat-2 Remote Sensing Instrument; Technical Report; National Space Organization (NSPO): Hsinchu, Taiwan, 2016. [Google Scholar]
  4. Kamei, A.; Nakamura, K.; Yamamoto, H.; Nakamura, R.; Tsuchida, S.; Yamamoto, N.; Sekiguchi, S.; Kato, S.; Liu, C.C.; Hsu, K.H.; et al. Cross Calibration of Formosat-2 Remote Sensing Instrument (RSI) Using Terra Advanced Spaceborne Thermal Emission and Reflection Radiometer (ASTER). IEEE Trans. Geosci. Remote Sens. 2012, 50, 4821–4831. [Google Scholar] [CrossRef]
  5. Lin, T.H.; Liu, G.R. On-orbit Radiometric Calibration of the FORMOSAT-2 Remote Sensing Instrument. Terr. Atmos. Ocean Sci. 2009, 20, 833–838. [Google Scholar] [CrossRef]
  6. Liu, C.C.; Kamei, A.; Hsu, K.H.; Tsuchida, S.; Huang, H.M.; Kato, S.; Nakamura, R.; Wu, A.M. Vicarious calibration of the Formosat-2 remote sensing instrument. IEEE Trans. Geosci. Remote Sens. 2010, 48, 2162–2169. [Google Scholar]
  7. Mendenhall, J.A.; Lencioni, D.E.; Evans, J.B. Spectral and radiometric calibration of the Advanced Land Imager. Linc. Lab. J. 2005, 15, 207. [Google Scholar]
  8. Flood, N. Continuity of Reflectance Data between Landsat-7 ETM+ and Landsat-8 OLI, for both top-of-atmosphere and surface reflectance: A Study in the Australian landscape. Remote Sens. 2014, 6, 7952–7970. [Google Scholar] [CrossRef]
  9. Hagolle, O.; Goloub, P.; Deschamps, P.Y.; Cosnefroy, H.; Briottet, X.; Bailleul, T.; Nicolas, J.M.; Parol, F.; Lafrance, B.; Herman, M. Results of POLDER in-flight calibration. IEEE Trans. Geosci. Remote Sens. 1999, 37, 1550–1566. [Google Scholar] [CrossRef]
  10. Markham, B.; Barsi, J.; Kvaran, G.; Ong, L.; Kaita, E.; Biggar, S.; Czapla-Myers, J.; Mishra, N.; Helder, D. Landsat-8 operational land imager radiometric calibration and stability. Remote Sens. 2014, 6, 12275–12308. [Google Scholar] [CrossRef]
  11. Morfitt, R.; Barsi, J.; Levy, R.; Markham, B.; Micijevic, E.; Ong, L.; Scaramuzza, P.; Vanderwerff, K. Landsat-8 Operational Land Imager (OLI) Radiometric Performance On-Orbit. Remote Sens. 2015, 7, 2208–2237. [Google Scholar] [CrossRef]
  12. Sakuma, F.; Kikuchi, M.; Inada, H.; Akagi, S.; Ono, H. Onboard calibration of the ASTER instrument over twelve years. In Sensors, Systems, and Next-Generation Satellites XVI; International Society for Optics and Photonics: Bellingham, WA, USA, 2012; Volume 8533, p. 853305. [Google Scholar]
  13. Thome, K.J.; Biggar, S.F.; Wisniewski, W. Cross comparison of EO-1 sensors and other Earth resources sensors to Landsat-7 ETM+ using Railroad Valley Playa. IEEE Trans. Geosci. Remote Sens. 2003, 41, 1180–1188. [Google Scholar] [CrossRef]
  14. Barnes, R.A.; Eplee, R.E.; Patt, F.S.; McClain, C.R. Changes in the radiometric sensitivity of SeaWiFS determined from lunar and solar-based measurements. Appl. Opt. 1999, 38, 4649–4664. [Google Scholar] [CrossRef] [PubMed]
  15. Liu, G.R.; Lin, T.H.; Kuo, T.H. Estimation of aerosol optical depth by applying the optimal distance number to NOAA AVHRR data. Remote Sens. Environ. 2002, 81, 247–252. [Google Scholar] [CrossRef]
  16. Mishra, N.; Haque, M.O.; Leigh, L.; Aaron, D.; Helder, D.; Markham, B. Radiometric Cross Calibration of Landsat 8 Operational Land Imager (OLI) and Landsat 7 Enhanced Thematic Mapper Plus (ETM+). Remote Sens. 2014, 6, 12619–12638. [Google Scholar] [CrossRef]
  17. Chander, G.; Helder, D.L.; Markham, B.L.; Dewald, J.D.; Kaita, E.; Thome, K.J.; Micijevic, E.; Ruggles, T.A. Landsat-5 TM reflective-band absolute radiometric calibration. IEEE Trans. Geosci. Remote Sens. 2004, 42, 2747–2760. [Google Scholar] [CrossRef]
  18. Arai, K. Vicarious calibration of the solar reflection channels of radiometers onboard satellites through the field campaigns with measurements of refractive index and size distribution of aerosols. Adv. Space Res. 2007, 39, 13–19. [Google Scholar] [CrossRef]
  19. Biggar, S.F.; Slater, P.N.; Gellman, D.I. Uncertainties in the in-flight calibration of sensors with reference to measured ground sites in the 0.4–1.1 μm range. Remote Sens. Environ. 1994, 48, 245–252. [Google Scholar] [CrossRef]
  20. Lacherade, S.; Fougnie, B.; Henry, P.; Gamet, P. Cross calibration over desert sites: Description, methodology, and operational implementation. IEEE Trans. Geosci. Remote Sens. 2013, 51, 1098–1113. [Google Scholar] [CrossRef]
  21. Nieke, J.; Aoki, T.; Tanikawa, T.; Motoyoshi, H.; Hori, M.A. satellite cross-calibration experiment. IEEE Geosci. Remote Sens. Lett. 2004, 1, 215–219. [Google Scholar] [CrossRef]
  22. Teillet, P.M.; Slater, P.N.; Ding, Y.; Santer, R.P.; Jackson, R.D.; Moran, M.S. Three methods for the absolute calibration of the NOAA AVHRR sensors in-flight. Remote Sens. Environ. 1990, 31, 105–120. [Google Scholar] [CrossRef]
  23. Villa-Aleman, E.; Kurzeja, R.J.; Pendergast, M.M. Temporal, spatial, and spectral variability at the Ivanpah Playa vicarious calibration site. In Laser Radar Techniques for Atmospheric Sensing; International Society for Optics and Photonics: Bellingham, WA, USA, 2003; Volume 5093, pp. 320–330. [Google Scholar]
  24. Naughton, D.; Brunn, A.; Czapla-Myers, J.; Douglass, S.; Thiele, M.; Weichelt, H.; Oxfort, M. Absolute radiometric calibration of the RapidEye multispectral imager using the reflectance-based vicarious calibration method. J. Appl. Remote Sens. 2011, 5, 053544. [Google Scholar] [CrossRef]
  25. Sakuma, F.; Ono, A.; Tsuchida, S.; Ohgi, N.; Inada, H.; Akagi, S.; Ono, H. Onboard calibration of the ASTER instrument. IEEE Trans. Geosci. Remote Sens. 2005, 43, 2715–2724. [Google Scholar] [CrossRef]
  26. Teillet, P.M.; Barker, J.L.; Markham, B.L.; Irish, R.R.; Fedosejevs, G.; Storey, J.C. Radiometric cross calibration of the Landsat-7 ETM+ and Landsat-5 TM sensors based on tandem data sets. Remote Sens. Environ. 2001, 78, 39–54. [Google Scholar] [CrossRef]
  27. Teillet, P.M.; Fedosejevs, G.; Thome, K.J. Spectral band difference effects on radiometric cross-calibration between multiple satellite sensors in the Landsat solar-reflective spectral domain. In Sensors, Systems, and Next-Generation Satellites VIII; International Society for Optics and Photonics: Bellingham, WA, USA, 2004; Volume 5570, p. 307. [Google Scholar]
  28. Teillet, P.M.; Barsi, J.A.; Chander, G.; Thome, K.J. Prime candidate earth targets for the post-launch radiometric calibration of space-based optical imaging instruments. In Earth Observing Systems XII; International Society for Optics and Photonics: Bellingham, WA, USA, 2007; Volume 6677, p. 66770S. [Google Scholar]
  29. Teillet, P.M.; Fedosejevs, G.; Thome, K.J.; Barker, J.L. Impacts of spectral band difference effects on radiometric cross-calibration between satellite sensors in the solar-reflective spectral domain. Remote Sens. Environ. 2007, 110, 393–409. [Google Scholar] [CrossRef]
  30. Thome, K.J. Ground-look radiometric calibration approaches for remote sensing images in the solar reflective. Int. Arch. Photogram. Rem. Sens. Spat. Inform. Sci. 2002, 34, 255–260. [Google Scholar]
  31. Czapla-Myers, J.; McCorkel, J.; Anderson, N.; Thome, K.; Biggar, S.; Helder, D.; Aaron, D.; Leigh, L.; Mishra, N. The Ground Based Absolute Radiometric Calibration of Landsat 8 OLI. Remote Sens. 2015, 7, 600–626. [Google Scholar] [CrossRef]
  32. Knight, E.; Kvaran, G. Landsat-8 operation land imager design, characterization and performance. Remote Sens. 2014, 6, 10286–10305. [Google Scholar] [CrossRef]
  33. Chander, G.; Markham, B.L.; Helder, D.L. Summary of current radiometric calibration coefficients for Landsat MSS, TM, ETM+, and EO-1 ALI sensors. Remote Sens. Environ. 2009, 113, 893–903. [Google Scholar] [CrossRef]
  34. Mendenhall, J.A.; Lencioni, D.E. Earth Observing-1 Advanced Land Imager Flight Performance Assessment: Absolute Radiometry and Stability During the First Year (No. PR-EO-1-10); Massachusetts Inst of Tech Lexington Lincoln Lab: Lexington, MA, USA, 2002. [Google Scholar]
  35. Vermote, E.F.; Tanré, D.; Deuzé, J.L.; Herman, M.; Morcette, J.J. Second simulation of the satellite signal in the solar spectrum, 6S: An overview. IEEE Trans. Geosci. Remote Sens. 1997, 35, 675–686. [Google Scholar] [CrossRef]
  36. Levy, R.C.; Remer, L.A.; Tanré, D.; Mattoo, S.; Kaufman, Y.J. Algorithm for Remote Sensing of Tropospheric Aerosol over Dark Targets from MODIS: Collections 005 and 051: Revision 2. 2009. Available online: http://modisatmos.gsfc.nasa.gov/_docs/ATBD_MOD04_C005_rev2.Pdf (accessed on 3 February 2016).
  37. Slater, P.N.; Biggar, S.F.; Holm, R.G.; Jackson, R.D.; Mao, Y.; Moran, M.S.; Palmer, J.M.; Yuan, B. Reflectance-and radiance-based methods for the in-flight absolute calibration of multispectral sensors. Remote Sens. Environ. 1987, 22, 11–37. [Google Scholar] [CrossRef]
  38. Yang, A.; Zhong, B.; Lv, W.; Wu, S.; Liu, Q. Cross-Calibration of GF-1/WFV over a Desert Site Using Landsat-8/OLI Imagery and ZY-3/TLC Data. Remote Sens. 2015, 7, 10763–10787. [Google Scholar] [CrossRef]
  39. Lin, T.H.; Chen, A.J.; Liu, G.R.; Kuo, T.H. Monitoring the atmospheric aerosol optical depth with SPOT data in complex terrain. Int. J. Remote Sens. 2007, 23, 647–659. [Google Scholar] [CrossRef]
  40. Kotchenova, S.Y.; Vermote, E.F. Validation of a vector version of the 6S radiative transfer code for atmospheric correction of satellite data. Part II. Homogeneous Lambertian and anisotropic surfaces. Appl. Opt. 2007, 46, 4455–4464. [Google Scholar] [CrossRef] [PubMed]
  41. Gao, C.; Zhao, Y.; Li, C.; Ma, L.; Wang, N.; Qian, Y.; Ren, L. An investigation of a Novel Cross-Calibration Method of FY-3C/VIRR against NPP/VIIRS in the Dunhuang Test Site. Remote Sens. 2016, 8, 77. [Google Scholar] [CrossRef]
  42. Kotchenova, S.Y.; Vermote, E.F.; Matarrese, R.; Klemm Jr, F.J. Validation of a vector version of the 6S radiative transfer code for atmospheric correction of satellite data. Part I: Path radiance. Appl. Opt. 2006, 45, 6762–6774. [Google Scholar] [CrossRef] [PubMed]
  43. Vaughan, M.A.; Young, S.A.; Winker, D.M.; Powell, K.A.; Omar, A.H.; Liu, Z.; Hu, Y.; Hostetler, C.A. Fully automated analysis of space-based lidar data: An overview of the CALIPSO retrieval algorithms and data products. In Laser Radar Techniques for Atmospheric Sensing; International Society for Optics and Photonics: Bellingham, WA, USA, 2004; Volume 5575, pp. 16–30. [Google Scholar]
  44. Teillet, P.M.; Markham, B.L.; Irish, R.R. Landsat cross-calibration based on near simultaneous imaging of common ground targets. Remote Sens. Environ. 2006, 102, 264–270. [Google Scholar] [CrossRef] [Green Version]
  45. Chen, Z.; Zhang, B.; Zhang, H.; Zhang, W. Vicarious Calibration of Beijing-1 Multispectral Imagers. Remote Sens. 2014, 6, 1432–1450. [Google Scholar] [CrossRef] [Green Version]
  46. Dinguirard, M.; Slater, P.N. Calibration of space-multispectral imaging sensors: A review. Remote Sens. Environ. 1999, 68, 194–205. [Google Scholar] [CrossRef]
Figure 1. The tendency of FS-2 RSI (remote sensing instrument) mean conversion factor (calibration coefficients) since preflight (before May 2004) [3].
Remotesensing 11 02634 g001
Figure 2. The FS-5 RSI true images over the calibration sites: (a) Alkali Lake on September 10, 2018, and (b) Railroad Valley Playa on September 11, 2018. The red spots indicate the ground in situ measurement locations, and the cross-calibration area was selected within red squares.
Remotesensing 11 02634 g002
Figure 3. The surface reflectance of FS-5 RSI spectral bands at the Alkali Lake site at zenith angles of (a) 10 degrees, (b) 30 degrees, and (c) 50 degrees including the azimuth angles when the solar zenith and azimuth angles were 60.84 and 171.09 degrees, respectively.
Remotesensing 11 02634 g003
Figure 4. Same as Figure 3, but over the Railroad Valley Playa site when the solar zenith and azimuth angles were 63.70 and 160.32 degrees, respectively.
Remotesensing 11 02634 g004
Figure 5. The spectral radiations of FS-5 RSI varied with the atmospheric parameters. (a) Ozone content from 0 to 0.5 (cm-atm). (b) Water vapor content from 0 to 4 (g/ cm2) through the 6S model based on the vicarious calibration approach in Alkali Lake. The black, blue, green, red, and magenta lines stand for Pan, Blue, Green, Red, and NIR spectral bands, respectively.
Remotesensing 11 02634 g005
Figure 6. Flow chart of the vicarious calibration.
Remotesensing 11 02634 g006
Figure 7. The flow chart of cross-calibration.
Remotesensing 11 02634 g007
Figure 8. Coefficient of variation of FS-5 RSI simulated at-sensor radiance under different atmospheric conditions in Alkali Lake and Railroad Valley Playa based on surface reflectance obtained from vicarious and cross-calibration methods. (a) Ozone content from 0 to 0.5 (cm-atm). (b) Water vapor from 0 to 4 (g/ cm2). (c) AOD (aerosol optical depth) content from 0 to 0.8.
Remotesensing 11 02634 g008
Figure 9. Relative errors of FS-5 RSI simulated at-sensor radiance under the same atmospheric conditions in Alkali Lake and Railroad Valley Playa based on vicarious and cross-calibration methods. (a) Ozone content varied from 0 to 0.5 (cm-atm). (b) Water vapor varied from 0 to 4 (g/ cm2). (c) AOD content varied from 0 to 0.8.
Remotesensing 11 02634 g009
Figure 10. The variation of at-sensor reflectance in different AOD550 values and different sizes of the calibration site. (a) The situation of ROC (reflectance of the calibration site) larger than ROE (reflectance of the environment). (b) The situation of ROC lower than ROE.
Remotesensing 11 02634 g010
Figure 11. The FS-5 RSI calibration coefficient (K0) of vicarious calibration starting at preflight. The black, blue, green, red, and magenta lines stand for the Pan, Blue, Green, Red, and NIR (Near-infrared) spectral bands, respectively.
Remotesensing 11 02634 g011
Figure 12. Same as Figure 11, but for the cross-calibration.
Remotesensing 11 02634 g012
Table 1. Geometric information of image sets used in the vicarious calibration.
DateCalibration SiteFS-5 RSI
Pass Time (UTC)SZASAAVZAVAA
Nov. 30, 2017Alkali Lake19:07:3559.96171.4435.29286.77
Dec. 04, 2017Alkali Lake19:07:5860.58171.2235.87286.66
Dec. 05, 2017Railroad Valley Playa18:18:4663.45160.4135.79100.39
Dec. 06, 2017Alkali Lake19:08:1060.84171.0936.20286.45
Dec. 07, 2017Railroad Valley Playa18:18:5863.70160.3235.51100.56
Sep. 04, 2018Alkali Lake19:23:3831.51167.6645.50287.87
Sep. 05, 2018Railroad Valley Playa18:34:2635.49150.0024.87101.79
Sep. 06, 2018Alkali Lake19:23:4332.23168.2745.54287.92
Sep. 07, 2018Railroad Valley Playa18:34:3136.10150.8124.80101.69
Sep. 10, 2018Alkali Lake19:23:5333.67169.4045.61288.03
Sep. 11, 2018Railroad Valley Playa18:34:4137.36152.3524.78101.60
SZA = solar zenith angle, SAA = solar azimuth angle, VZA = view zenith angle, and VAA = view azimuth angle.
Table 2. Geometric information of image sets used in the cross calibration.
DateCalibration SiteFS-5 RSIL-8 OLI
Pass Time (UTC)SZASAAVZAVAAPass Time (UTC)SZASAA
Nov. 09, 2017Railroad Valley Playa18:16:1058.03159.8534.58100.3618:23:3557.38173.98
Nov. 25, 2017Railroad Valley Playa18:17:4761.78160.6132.73100.7718:21:0861.87161.96
Dec. 11, 2017Railroad Valley Playa18:19:2264.17160.1030.93101.2618:21:0664.35161.02
Aug. 08, 2018Railroad Valley Playa18:33:1428.05138.1922.20102.1518:20:1929.82134.13
Aug. 31, 2018Alkali Lake19:23:2830.14166.4739.83287.7718:27:0534.56141.85
Sep. 16, 2018Alkali Lake19:24:0835.86170.9740.06288.0318:27:0939.28148.47
Sep. 25, 2018Railroad Valley Playa18:35:1642.00157.2421.70101.2818:20:3841.80152.90
Table 3. Sun photometer atmospheric products of calibration sites.
DateCalibration SiteAerosol Optical DepthOzone (cm-atm)Water Vapor (g/cm2)
Sep. 04, 2018Alkali Lake0.0921.3990.287
Sep. 05, 2018Railroad Valley Playa0.1330.2861.684
Sep. 06, 2018Alkali Lake0.0531.5180.286
Sep. 07, 2018Railroad Valley Playa0.0520.2861.452
Sep. 10, 2018Alkali Lake0.0340.5880.285
Sep. 11, 2018Railroad Valley Playa0.0510.2850.553
Table 4. Water vapor and ozone content based on the 6S built-in atmospheric profile and MODIS (Moderate Resolution Imaging Spectroradiometer) products in Alkali Lake and Railroad Valley Playa.
Atmospheric ProfileWater Vapor (g/cm2)Ozone (cm-atm.)
Tropical4.4200.247
Mid-latitude summer2.9300.319
Mid-latitude winter0.8530.395
Sub-arctic summer2.1000.480
Sub-arctic winter0.4190.480
US standard 19621.4200.344
Table 5. Relative difference of K 0 . values between vicarious calibration results in 2018 and mean calibration coefficients in 2017.
DateCalibration SiteRSI BandBlueGreenRedNIRPan
Sep. 04, 2018Alkali LakeFS-5 L1A
Retrieved (DEV%)
–4.220.674.902.357.14
Sep. 05, 2018Railroad Valley5.775.505.091.4210.78
Sep. 06, 2018Alkali Lake–5.89–0.294.17–0.406.92
Sep. 07, 2018Railroad Valley6.936.756.472.6811.51
Sep. 10, 2018Alkali Lake–3.003.437.715.779.88
Sep. 11, 2018Railroad Valley4.544.103.542.968.88
Table 6. Same as Table 5, but for the results of the cross calibration.
DateCalibration SiteRSI BandBlueGreenRedNIRPan
Aug. 08, 2018Railroad ValleyFS-5 L1A
Retrieved (DEV%)
8.8412.1710.109.8216.19
Aug. 31, 2018Alkali Lake1.964.104.682.778.63
Sep. 16, 2018Alkali Lake3.455.885.963.6210.80
Sep. 25, 2018Railroad Valley5.658.856.206.3012.06
Table 7. Standard deviations in spectral K 0 values from vicarious and cross-calibration approaches in 2017 and 2018, respectively.
YearCalibrationRSI BandBlueGreenRedNIRPan
2017Vicarious CalibrationFS-5 L1A
Retrieved (STD%)
0.640.690.510.650.60
Cross-Calibration0.200.150.220.020.24
2018Vicarious Calibration0.680.380.180.300.24
Cross-Calibration0.340.460.250.450.37

