Abstract
On-going monitoring of deformation of dams is critical to assure their safe and efficient operation. Traditional monitoring methods, based on in-situ sensors measurements on the dam, have some limitations in spatial coverage, observation frequency, and cost. This paper describes the potential use of Synthetic Aperture Radar (SAR) scenes from Sentinel-1A for characterizing deformations at the Mosul Dam (MD) in NW Iraq. Seventy-eight Single Look Complex (SLC) scenes in ascending geometry from the Sentinel-1A scenes, acquired from 03 October 2014 to 27 June 2019, and 96 points within the MD structure, were selected to determine the deformation rate using persistent scatterer interferometry (PSI). Maximum deformation velocity was found to be about 7.4 mm·yr−1 at a longitudinal subsidence area extending over a length of 222 m along the dam axis. The mean subsidence velocity in this area is about 6.27 mm·yr−1 and lies in the center of MD. Subsidence rate shows an inverse relationship with the reservoir water level. It also shows a strong correlation with grouting episodes. Variations in the deformation rate within the same year are most probably due to increased hydrostatic stress which was caused by water storage in the dam that resulted in an increase in solubility of gypsum beds, creating voids and localized collapses underneath the dam. PSI information derived from Sentinel-1A proved to be a good tool for monitoring dam deformation with good accuracy, yielding results that can be used in engineering applications and also risk management.
1. Introduction
Earth fill dams, because of their low construction cost and relatively simple design, are the most common hydraulic structures built around the world. The safety of a dam throughout its operating life is of paramount importance and requires constant surveillance and monitoring of deformation to assure its safety and structural integrity.
Dams are susceptible to two kinds of deformations [1]. First, horizontal deformation caused by water impounded in the reservoir. Second, vertical deformation resulting from the weight of the dam. Several factors can contribute to dam deformation, such as hydrostatic loading from water storage, construction parameters, and site geology. The latter is associated with planes and zones of weakness in the foundation and abutment rocks.
Evaporite rocks, such as gypsum and halite, are chemically more soluble than other rock types and pose much more difficult problems in dam engineering [2]. It causes two of the most common problems at the dam site—piping and karstification, which could lead to failure. These two phenomena require significant pre- and post-construction treatments under and around the dam foundation to: (a) prevent excessive water seepage through subsurface solutioned openings, and (b) collapse of large solution-induced voids that may cause subsidence and possible dam failure leading to catastrophic flooding downstream [3].
Differential Synthetic Aperture Radar (SAR) Interferometry (DInSAR) calculates the interference pattern created by phase difference between two radar signals across a common point over the earth surface. Multi-temporal analysis of SAR images provides very accurate monitoring of individual deformation down to mm-level accuracy [4,5,6]. One of the robust multi-temporal DInSAR analysis techniques is the Persistent Scatterer Interferometry (PSI), which allows precise estimation of the deformation displacement-time series [7] and has been applied to monitor dams successfully [8,9,10,11]. The PSI is a suitable technique to monitor dam deformation that allows to gather data on its subsidence [8,12,13,14,15,16,17]. A detailed description of the DInSAR and PSI and their applications can be found in [7,18,19,20].
Although some studies have been published on deformation monitoring of Mosul Dam (MD) in NW Iraq [21,22,23] using DInSAR techniques such as small baselines (SBAS) [1] and PSI [21,22], they lack validation of their results with in-situ data. It is important that remote sensing-derived analyses and interpretation are validated by comparing the results with proper differential GNSS and/or GNSS stations results.
In this paper, we briefly describe the history and geological setting of MD. Next, we explain the methodology used in the study; and finally, we present and discuss results of the geodetic and DInSAR surveys by including a thorough consideration of the dam site geology and validating the DInSAR results by in-situ GNSS measurements. We have also been able to establish the cause and effect relationship of MD deformation with site geology.
2. Study Area
2.1. The Mosul Dam
The study area is located about 43 km northwest of the center of Mosul city, in the northwestern part of Iraq, between the latitudes 36°38′12″ to 36°36′58″N, and longitudes 42°48′40″ to 42°51′E. The MD is an important and strategic water resource management project and is built on the Tigris River (Figure 1). Construction of the MD begun on 25 January 1981 and it became fully operational on 24 July 1986. The multi-purpose dam was designed for flood control and to provide irrigation water and generate electric power. The length and height of the MD are 3650 m and 113 m, respectively, with a side slope of 29.5°. The zoned earth fill embankment (Figure 2A,B) with a clay core is 10 m wide at the top, increasing to 400 m towards the base. The dead, normal, and maximum storage levels of its reservoir are 300, 330, and 335 m a.s.l., respectively (Figure 2A). The dam impounds 11.11 km3 of water at normal operation level. The dead storage of the dam is about 2.95 km3 [24].
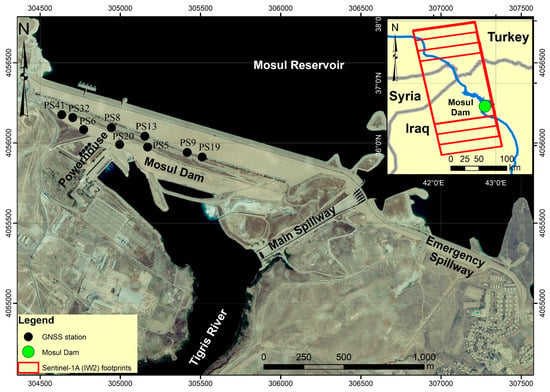
Figure 1.
Aerial view of the Mosul Dam in QuickBird imagery (R3:G2:B1) acquired on 29 August 2006. Inset: regional map with IW swath bands and the location of the GNSS stations.

Figure 2.
Mosul Dam, (A) schematic cross-sectional diagram [24], view looking from the west to east; (B) photo taken on 20 September 2012. Coordinates of camera location are: Y= 309,651 and X= 4,053,546 Zone 38N UTM.
Besides the main spillway, there is an emergency spillway (Figure 1). The main spillway is a concrete structure, 773 m long and 60 m wide with five radial gates, located on the left abutment. The power generation facilities are located in the right abutment and the four turbines at the toe of the dam (Figure 1).
Although the planned useful life of the Mosul reservoir is estimated at 125 years [25], it will occur sooner at 50% of its storage capacity, when sediments fill the reservoir up to its dead storage level [26,27].
2.2. Climate and Discharge
Mosul Dam, which impounds the eighth-order Tigris River, stores all runoff following precipitation events in its basin. The study area shows significant seasonal variations in precipitation, temperature, and evaporation, and is characterized by wet winters and dry summers (Figure 3). The bulk of the annual precipitation (363 mm) occurs from October to May. For the past 33 years, the highest average monthly precipitation with an average value of 64.6 mm has occurred in January. July is marked by the highest average monthly evaporation rate with an average value of 365.5 mm. Monthly mean temperature varies between 6.56 °C (January) and 34.4 °C (July). The hottest average monthly temperature of 42.77 °C was recorded in July and the coldest average monthly temperature of 2.32 °C in January.
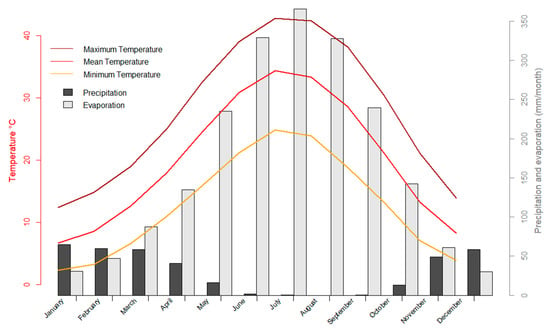
Figure 3.
Monthly precipitation; evaporation; and maximum, minimum, and mean temperature at the Mosul Dam and surrounding area recorded between 1980 and 2013 (Mosul meteorological station) [28].
The Tigris River upstream of MD is fed by both rainfall and snowmelt that results in peak discharge in spring and low discharges in summer and early fall. For the 92-year period between 1931 and 2013, the average monthly discharge of the Tigris River was 631 m3·sec−1. The maximum discharge was 3514 m3·sec−1 in April 1954, whilst the minimum was 81 m3·sec−1 in October 2013 [24].
2.3. Geological Setting
The study area is located in the Low Folded Zone [29,30], which is part of the Zagros Fold-Thrust Belt (ZFTB). The ZFTB resulted from collision of the Arabian Plate with the Eurasian Plate and closure of the Neo-Tethys [31,32]. It is part of the Alpine–Himalayan Mountain System that extends from southeastern Turkey through Iraq to southern Iran (~2000 km long) [33,34,35,36,37,38,39]. The Sinjar-Dohuk-Amadiya-Fault, trending in NE-SW direction, crosses the MD foundation [40] (Figure 4).
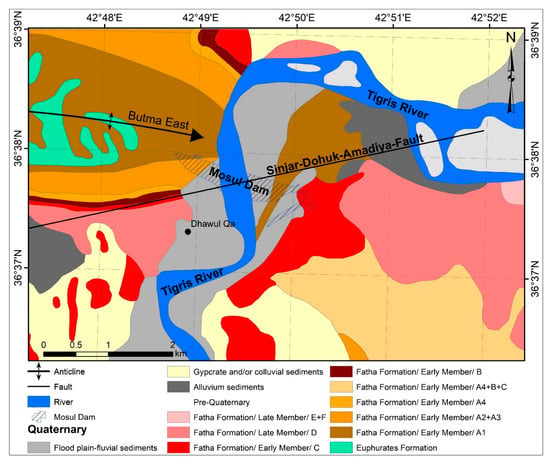
Figure 4.
Lithological map of the Mosul Dam area [41].
Stratigraphically, the study area includes various lithostratigraphic units (Figure 4) of Early Miocene to Pliocene age, along with different types of Quaternary sediments. The Euphrates Formation (Early Miocene) consists of limestone, dolostone, dolomitic limestone, and marl. The rocks are well bedded, fossiliferous; chalky and hard, white, gray, and light gray in color [41].
Fatha Formation (Middle Miocene) is exposed below and around the MD. It consists mainly of gypsum, limestone, dolostone, and occasional green claystone [41]. The soluble gypsum beds in Fatha Formation are prone to piping and karstification. Quaternary sediments comprising flood plain and alluvial deposits occur in the study area along both banks of the river [41]. Earthquake records from US Geological Survey (USGS) Earthquake Catalog Search were used for seismic history of the area. Since the beginning of construction of the MD in 1981, the region has experienced 10 earthquakes (Figure 5), with their epicenters <200 km away, and having a magnitude >5.0 on the Richter scale [42]. The last major shock, of M 7.3, >300 km away, occurred on 12 November 2017. However, the MD was not affected apparently by any of these earthquakes.
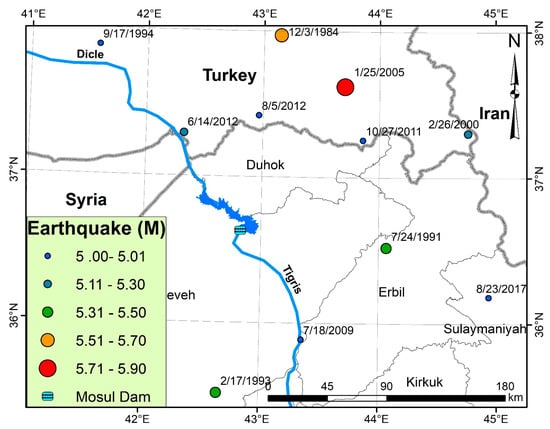
Figure 5.
Earthquake distribution at and within 200 km of the Mosul Dam [42].
2.4. Mosul Dam and Karstification
Karst regions are problematic for civil engineering projects. Regional geological mapping have identified large surface dolines, but no detailed mapping of karst features was carried out by early investigators [43]. Detailed mapping of subsurface cavities and solutioned areas is complex and time consuming, which explains why detailed karst maps of the area are almost non-existent. This limitation also prevails in other regions of the world.
MD is a good example of a civil engineering project that is impacted by the subsurface karstification process. The dissolution process that started long before dam construction is continuing to this day. This was confirmed by the Iraqi General Authority for Groundwater during the 1960s while drilling three water wells. These boreholes, Ni01060, Ni00990, and Ni00652, are located far away—1.88, 7.35 and 9.4 km—from MD. The borehole logs show core loss, which confirms the presence of solution cavities formed by dissolution of gypsum beds in the Fatha Formation.
Hijab and Al-Jabbar [44] reported that sinkholes were found within the streets of the tourist’s city near MD on the eastern bank of Tigris River. These sinkholes are a good indicator of active and continuous solutioning process in and around MD. The weak zones and solution cavities extend beyond the dam foundation (Figure 6). The depth of the weak areas and cavity zones, formed by karstification, range from 12 to 30 m. The karst zones trend in two directions: NW-SE and NE-SW that mimic the regional structural stress [44].
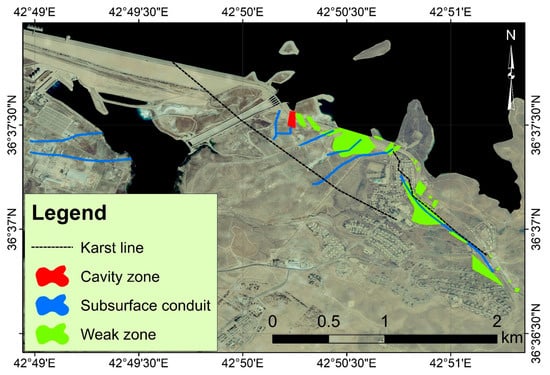
Figure 6.
Solution cavity and weak zones near the Mosul Dam superimposed over the QuickBird imagery R3:G2:B1 acquired on 29 August 2006.
Geological cross-sections, drawn along the dam axis, show the karst line, which traverses varying depths. The karst line is irregular and cuts across various lithological units (Figure 7). Based on this information and the observed core loss, it is concluded that the MD is located in an area of active karstification.

Figure 7.
Lithological cross-sections of the dam axis, black line marks the karst zone [45].
3. Materials and Methods
3.1. Data
The Sentinel-1 mission, developed under the Copernicus Programme of the European Space Agency (ESA), is a constellation of two twin satellites (A and B units). The Sentinel-1A mission was launched on 03 April 2014, with its payload of C-SAR (C-band Synthetic Aperture Radar) [46]. Whereas the Sentinel-1B mission was launched on 25 April 2016. Each satellite carries an imaging C-band SAR sensor that acquires dual-polarization data systematically. The SAR sensor transmits one signal at either horizontal (H) or vertical (V) polarization and simultaneously receives both the transmitted polarization and its orthogonal counterpart [46]. Therefore, two linear polarization cases can be considered: vertical transmission with vertical and horizontal reception (VV-VH) and horizontal transmission with horizontal and vertical reception (HH-HV). In this investigation, since the interested features are mainly vertical, we considered only the VV polarization.
Sentinel-1 constellation provides data that are useful in a wide variety of applications including monitoring of: (a) the terrestrial environment, such as forest cover and fires, soil moisture, agricultural crops, and mapping support during natural disasters; and (b) the marine environment: sea ice, iceberg conditions—data and information that are useful in high resolution ice-chart preparation, prediction of ice conditions at sea; oil spills monitoring, sea level fluctuations, and climate change effects [46]. This freely available data has been successfully used in dams monitoring [21,47,48].
A total of 78 Single Look Complex (SLC) processing level scenes acquired in the Interferometric Wide (IW) mode and in ascending geometry were considered. The swath width is 250 km and the spatial resolution 5 by 20 m. The study area is located at the IW2 (Figure 1).
In addition, we used as a digital elevation model (DEM) one scene of 1 arc second global Shuttle Radar Topography Mission (SRTM) [49]. The SRTM was used to allow multiple dataset comparisons through geocoding (orthorectification). Additionally, it was also used to extract stream order and delineate the catchment area upstream of the MD.
Besides the 53 in-situ measurements [28], the water level of the Mosul lake was determined using 22 Landsat-8/OLI scenes [50] and 16 topographic maps obtained from the General Authority of Survey (Iraq). Maps were scanned at 600 dpi, georeferenced, and contour lines were digitized. We used Modified Normalized Difference Water Index (MNDWI) [51] to delineate the Mosul lake surface for the 22 scenes (Equation (1)). Both datasetss were used together to accomplish this task by intersecting the contour lines with the Mosul lake boundary.
Absolute elevation data were collected from several GNSS stations (see sparse point locations; Figure 1). These stations were installed on the MD over concrete bases (dimensions 1 by 1 m). The elevation data were recorded using pair of GNSS receivers, TOPCON© model GR3 with differential correction and L1/L2 signals, every 6 months, during 2 h for each single point. Topcon link and Topcon tools software have been used for the postprocessing steps. The vertical post-processed static accuracy is ± 0.05 m [52]. Unfortunately, there are only a few stations available close to PSIs of the area (A). Moreover, fieldwork in the MD is not easy due to security reasons. As a result, we used 10 stations for validation of PSI measurement points for the period, March 2016 to August 2017. These stations are comparable because they are close to PSI measurement points (Table A1, Appendix A), which were used in this study (the distance ranges from 15.81 m to 54.10 m).
3.2. Software
All the DinSAR preprocessing and processing have been done using the SARPROZ software. This software is developed by Perissin (2017) [53] and is written in MATLAB [54]. SARPROZ is based on graphical interfaces and does not require knowledge of coding. Therefore, several precise and complex techniques of DINSAR, such as PSI [7], can be easily implemented. The output result from SARPROZ can be organized as MS Excel or GoogleEarth KMZ files.
All GIS operations (stream and catchment area extraction, base map preparation, shapefile creation, and area calculation) were carried out using ArcGIS [55]. Basic statistical analyses such us correlation and regressions were accomplished using R–based scripts [56].
3.3. Pre-Processing Work and Persistent Scatterer Interferometry (PSI)
In this study, an advanced DInSAR technique called PSI was applied to process Sentinel-1A images for measuring the deformation pattern of MD embankments. PSI is a reliable method because it allows detection of Earth’s surface displacements over time by using multiple SAR images acquired over the same area [7]. It has gained great popularity for deformation measurement of man-made structures such as dams [1,8,57,58] and open pit mine [59]. It extracts information from the pixels of SAR scenes that are consistent over long time intervals [4,60,61,62].
A multi-temporal interferometric processing technique was used to compute SLC scenes at VV polarization for monitoring the subsidence pattern of MD for the period October 2014 to June 2019 (Figure 8). More than one master scene has been tested, the scene acquired on 20 January 2017 was chosen as a reference (Master image). The master image is located near the middle of the temporal and perpendicular baseline domain to minimize the effects of normal and temporal baselines [48,63].
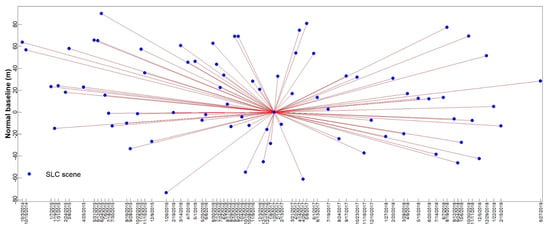
Figure 8.
The “star” graph showing Sentinel 1 dataset analyzed in the normal baseline-temporal space, where each point and line represent an image and an interferogram, respectively.
To eliminate additional noise due to spatial decorrelation which may corrupt the signal [63], we removed scenes with far baseline distance of >100 m from the master scene. Figure 8 shows the interferometric configuration between the master and slave scenes. For all 78 scenes, the normal baselines are found within a range of 0 to 50 m (Figure 8).
Additionally, we used the Precise Orbit Determination (POD) service for Sentinel-1A that provides restituted orbit files and Precise Orbit Ephemerides (POE) files. Precise co-registration of SAR images is a strict requirement and an essential step for accurate analysis of interferometric deformation [14], which was performed by adding GCPs over coherent zones of the images. Additionally, we also used incremental numbers of windows (range window number and azimuth windows number) in fine shift co-registration setting parameters of the SARPROZ software until reasonable results were achieved. The co-registration was based on a fine co-registration algorithm that combines both orbital information and amplitude cross-correlation. In this procedure, the deramping is also performed automatically. As a result, all images were co-registered to the master map with subpixel accuracy.
The signal of interferometric phase ( resulting from multiple contributions is shown in Equation (2) [60]:
where is the residual topographic height (H) without the DEM, is the searched displacement (D) information, is the disturbance caused by the atmospheric phase screen, and is the non-removable phase disturbance. D and H values can be estimated by choosing a set of Persistent Scatterers Candidates (PSCs) using an Amplitude Stability Index (ASI, i.e., the coefficient of variation of the amplitude) threshold, which is 0.8 to select the more stable pixels in terms of amplitude signal over the analyzed period [62]. The adopted value of 0.8 is in agreement with the literature [48].
Additionally, we tested the accuracy of PSI using a coherence-based method described by Ferretti [4]. A threshold value was used to select PS candidates. PS points that showed coherence greater than >0.8 were selected as a PS candidate. These points are typically parts of manmade features, in our case here MD [4,56]. Ninety-six PSIs are located on the dam body under the correlation criteria (Figure 9). Figure 10 shows the PS candidate with minimum coherence of 0.8 and ASI > 0.8.
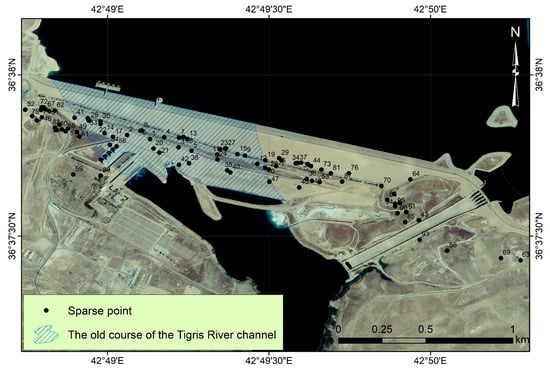
Figure 9.
Location of the sparse points superimposed over QuickBird imagery R3:G2:B1 of the Mosul Dam, acquired on 29 August 2006. Old course of the Tigris River channel is also shown.
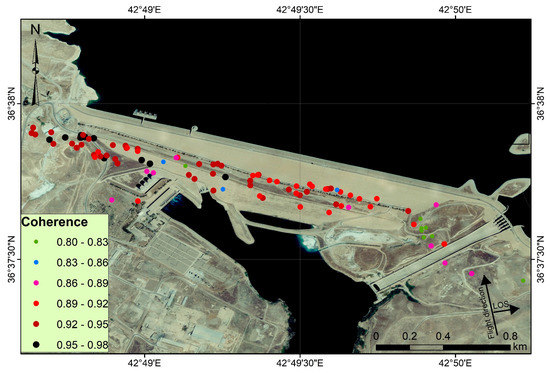
Figure 10.
Coherence value of the processed sparse points, at the Mosul Dam, superimposed over QuickBird imagery R3:G2:B1 acquired on 29 August 2006.
We also selected the sparse points using a coherence-based method described by Ferretti [4]. Coherence maps have been utilized to identify precise sparse points. A threshold was used to select PS candidates. A sparse point that shows a coherence greater than a given value was selected as a PS candidate. For the selected PS candidates, all sparse points have a coherence value of >0.8, all have coherence >0.8. These points are typically parts of manmade features, in our case here MD [4,57]. Ninety-six PSCs (ASI > 0.8) are located on the dam body under the correlation criteria (Figure 9). Figure 10 shows the points with a minimum coherence of 0.8.
Next, all PSCs were connected to generate a redundant spatial network, and H and D were estimated along the connections starting from a linear model to infer unknown displacement. Once H and D values for every connection were determined, they were integrated over the PSCs to estimate the APSs (one for every image of the dataset) starting from the residual phase components. After this, a second estimation was performed on a much larger set of points that represents the last step of PSs after temporal coherence threshold to select the final results.
Based on the catchment results obtained from the SRTM, a small area (~107 km2) covering the MD and consisting of 800 samples and 2500 lines was then selected (Figure 6). All the 78 SAR scenes were subsetted for this area of interest, having minimum and maximum incidence angles of 45.57° and 46.05°, respectively.
To accomplish the validation process, we present a scatterplot of displacement velocities measured by both differential GNSS and Sentinel SAR data. Pearson correlation analysis were also performed. Due to the major military campaign (Battle of Mosul), launched by the Iraqi Government forces to recapture the city of Mosul from the Islamic State in Iraq and Syria (ISIS), we could not crosscheck the results in the field. More than one reference point has been tested. The final results depend on the reference point (Ra) with coordinates (36.632141°N and 42.810343°E), located on the shoulder of the road from MD towards the Dayr Mali Lake (small pond on the west side of MD). It was selected as the approved reference point for PS processing. This point is close to the in-situ MD monitoring station, named #P71. This station is stable, where the displacement is +0.067 mm for the period between February 2012 and August 2017 (the velocity of the displacement is +0.012182 mm·yr−1). Besides, sigma of the velocity of the PSIs has also been tested. This test enables accuracy assessment for the PS sparse points.
4. Results
4.1. PSI Characterization and Monitoring of the Mosul Dam
Figure 11 shows the computed deformation estimates for the ascending main track over the MD area. Negative values reflect surface deformation motion away from the SAR perspective (subsidence), while the positive values indicate movements towards the SAR sensor (uplift). Color scale gradations from black to blue represent decreasing subsidence rates, while the color scale gradation of light blue represents an increasing uplift rate. The velocity of displacement ranging between 1 mm·yr−1 and −7.4 mm·yr−1, was observed at 96 PSI points, scattered across the MD body (Figure 11). The PSI Sentinel ascending dataset shows a mean subsidence velocity of −4.06 mm·yr−1 with a maximum and minimum displacement value of −7.4 mm·yr−1 and −1.3 mm·yr−1, respectively. The PSI points on the old course of the Tigris River channel (in the center of the MD) (Figure 8) showed subsidence rates greater than the PSI points located on both sides of the MD. The maximum displacement velocity occurred in a small zone (Area A; Figure 11) with minimum, mean, and maximum displacement velocity of −5 mm·yr−1, −6.27 mm·yr−1, and 7.4 mm·yr−1, respectively. This zone is located near the powerhouse, has a surface area of 13,130 m2 and is 222 m long (Figure 11).
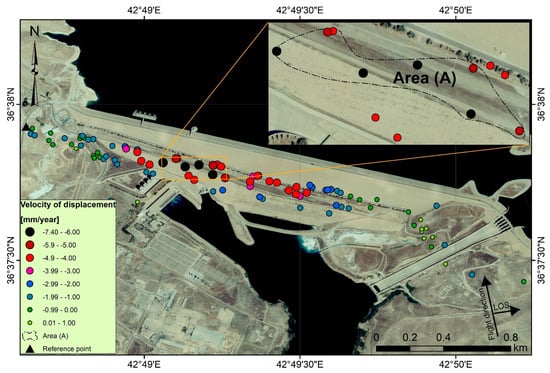
Figure 11.
Location of the processed sparse points, at the Mosul Dam, superimposed over QuickBird imagery R3:G2:B1 acquired on 29 August 2006.
The velocity of PSIs’ deformation obtained from different reference points resulted in high correlations of the rates. These reference points show similarity in results. The sigma of the velocity from Ra of the PSIs ranges between 0.53 and 0.696 mm·yr−1 (Figure 12). The maximum, mean, and minimum sigma for the velocity of the PSIs within the zone A are 0.562 mm·yr−1, 0.591 mm·yr−1, and 0.641 mm·yr−1, respectively (Figure 13). Figure 14 shows that there is a linear trend between the sigma of the velocity for the PSIs and the velocity of the displacements—sigma of the velocity increasing as their velocity increases.
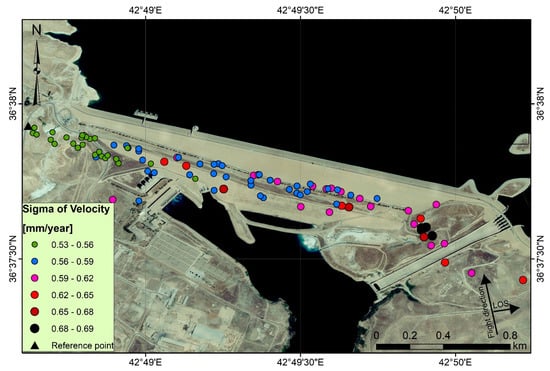
Figure 12.
Sigma of the velocity of the processed sparse points, in the Mosul Dam, superimposed over QuickBird imagery R3:G2:B1 acquired on 29 August 2006.
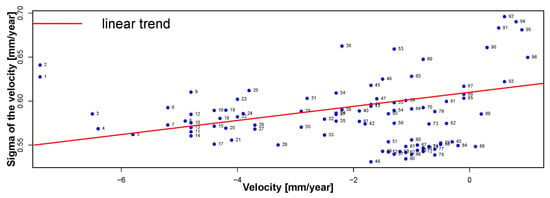
Figure 13.
Relationship between PSI velocity and sigma of the velocity of the PSI points.
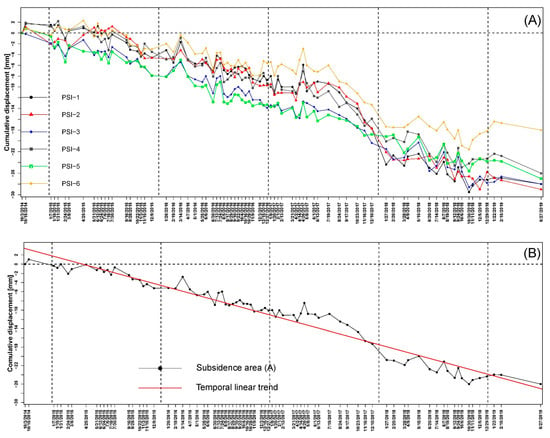
Figure 14.
(A) Velocity of 6 PSI points (PSI-1- PSI-6); (B) Mean cumulative displacement at area (A), representing the mean of cumulative displacements of PSI-1:PSI-6 (maximum subsidence at the Mosul Dam).
4.2. PSI Time Series Monitoring
The relationship, as time-cumulative displacement diagrams for the six PSIs (Figure 11, area A), showed the highest velocity of displacement values out of 96 PSI points (> −5 mm·yr−1) (Figure 14). The resulting 96 PSI points were located far from abrupt changes in slope with clear layover effect.
In these diagrams, the X-axis represents dates of acquisition, ranging from 03 October 2014 to 27 June 2019. The Y-axis represents the cumulative displacement values (mm). Time series of PSI deformation measurements reported in Figure 14 show a clear subsidence pattern in the last 4 years of the selected time-frame. The cumulative displacement of area A (Figure 14B) is about 28 mm for the period of October 2014 to June 2019.
Figure 15 presents a scatterplot of velocity measured by differential GNSS measurements and PSI derived from the Sentinel-1A SAR data. These two types of measurements show a good agreement with a correlation coefficient (r) of 0.896. The maximum difference in deformation velocities is 1.25 mm·yr−1, while the average and minimum difference are 0.82 and 0.18 mm·yr−1, respectively (Figure 16). The maximum subsidence velocity measured in-situ at the MD, for the period 2016 to August 2017, is 10.19 mm·yr−1. This point is located quite far away, about 266 m NE of area A. There is no accurate PSI near this GNSS station.
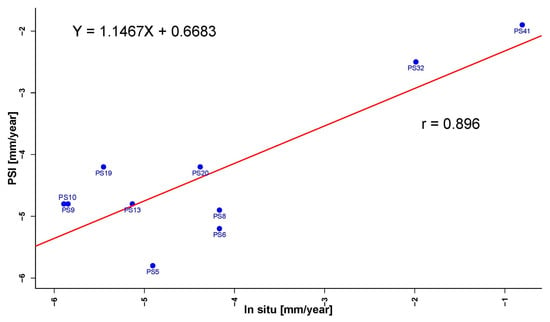
Figure 15.
Result of subsidence velocity validation between SAR/PSI-measurements and the in-situ GNSS-measurements.
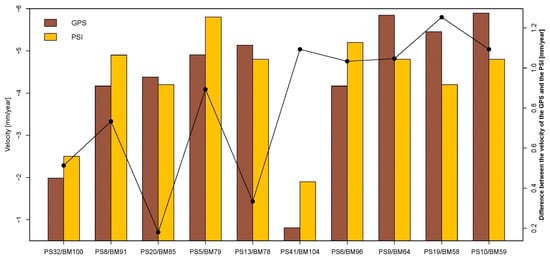
Figure 16.
Error measurement (mm·yr−1) and comparison between the mean velocity (mm·yr−1) of the PSI points and the mean velocity measured from the in-situ GNSS (mm·yr−1) at the Mosul Dam.
The current study shows that the PSI technique can deliver displacement measurements with high accuracy for dam site subsidence. It is a cost-effective method suitable for deformation measurements of large civil engineering structures.
Water level in the MD during the selected time-frame fluctuates, increasing during the rainy and snow melting seasons, especially between December and April. Subsidence within area A decreases with the increasing water level (Figure 17).
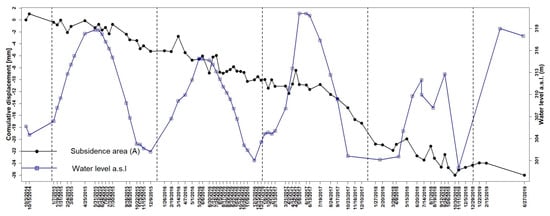
Figure 17.
Subsidence within Area A and water level fluctuation at the MD.
5. Discussion
PSI technique has become an extremely important tool for monitoring deformation in engineering structures, as it provides a robust estimation of displacement parameters [61] that can be utilized as an early warning system. The PSI method requires a large number (at least 30) of SAR images [64,65], which nowadays are readily available through the Sentinel-1 mission. The availability of frequent repeat cycles of Sentinel-1A SAR data for use in the PSI method for identification of potential instability of strategic structures such as the MD is a basic requirement.
Figure 11 shows the distribution of 96 PSI points in the study area. It was found that the maximum subsidence occurred between PSI-1 and PSI-6, which are located in the center of the Dam, and above the old course of the Tigris River channel (Area A). Subsidence velocity decreases as one moves away from PSI-1. The X-coordinate profile in Figure 18 confirms progressive decrease in subsidence velocity away from PSI-1. The X-coordinate profile shows a good polynomial fit between the velocity of displacements in the PSI points and their X-coordinates. The best fit curve depicted in red represents a deformation pattern of the MD. The graph in Figure 19, which shows the relationship between the distance of each PSI point measured from PSI-1 (X-axis) and the computed velocity of PSI (Y-axis), clearly indicates a strong and direct correlation between them.
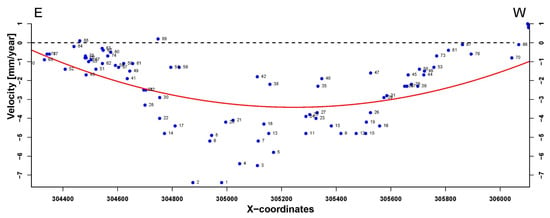
Figure 18.
Relationship between velocity of the PSI points measurements and X-coordinates of the PSI points.
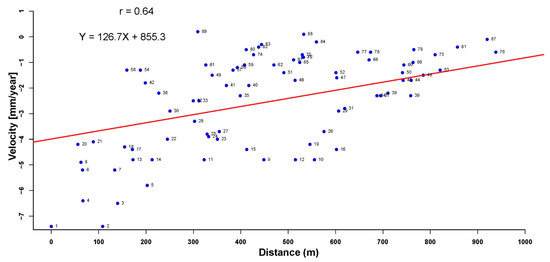
Figure 19.
Relationship between velocities at PSI points and their distance with reference to PSI-1, the maximum velocity point.
The PSIs selected have a global minimum of the optimized criteria, where the sigma of velocity is minimum (< ±0.7 mm·yr−1) and the coherence is maximum (>0.8) [47]. The sigma of the velocity in our case for small area analysis is reasonable [66]. Although sigma of the velocity for PSIs and the velocity of the displacements have a linear trend, it seems that sigma of the velocity slightly increased towards the LOS direction (Figure 12).
Figure 16 shows the difference in velocity (error) and the distance between PSI and the 10 GNSS stations for validation of PSI measurement points. Generally, the error increases as the distance between the GNSS station and the PSI increases. Therefore, the absence of GNSS stations in the same location of the PSIs is one of the major causes of the difference in the velocity values between the PSIs and GNSS stations.
Despite the lack of any supporting geophysical and geological measurements of the area under the old course of the Tigris River, we believe that a major karst feature or subsurface channel exists below area (A) that has caused subsidence under this specific area (Figure 14). Accordingly, the displacement time curve shows a concave shape (Figure 17), with the old course of the Tigris River located at the bottom of the curve. It can also be observed that both sides of the dam are stable, and the velocity of the PSI points are either neutral (zero) or positive. This indicates that solutioning is more pronounced under the old course of the Tigris River than elsewhere. The presence of the Sinjar-Dohuk-Amadiya-Fault beneath the MD [40,41] contributed to the development of cracks and channels in rock formations that accelerated the karstification process. In addition, Butma East anticline plunges very close to the MD, (Figure 4) providing a pathway for movement of groundwater toward the MD foundation [43].
Subsurface karstification is a significant geological problem in civil engineering projects that leads to differential settlement of dam and its eventual failure. The measurement of deformation patterns might be used as a warning of potential safety problems in dams and other infrastructures. It also helps decision makers in adopting appropriate measures to prevent losses [67]. The safety problems assume critical importance for earth-fill dams constructed on soluble evaporitic rocks. In the western U.S. for example, 60 % of earth dams higher than 15 m have failed due to the process of piping and karstification in soluble evaporitic sediments [3]. The presence of the thickest gypsum layer under the old course of the Tigris River (Figure 7) resulted in the formation of large-size voids that seem to be interconnected due to solutioning activities, providing an easy outlet for water discharge. In addition, the maximum hydrostatic pressure is recorded in the vicinity of the old course of the Tigris River because this area has the lowest elevation in the Mosul Reservoir. Based on these observations, we conclude that area A (Figure 11), which has the fastest subsidence velocity at the MD and includes PSI-1, is located on the thickest layer of gypsum.
Figure 14B and Figure 17 show that the displacement along the old course of the Tigris River, which was less in 2014, has been increasing with time, with significant increases occurring in 2019. Maximum precipitation in the study area occurs during the winter months, specifically between December and April (Figure 3) [28]. The displacement curves in Figure 14 clearly show higher subsidence between March and April (peak to the downward) than the general trend for the years 2015, 2016, 2017, and 2018. Therefore, we recommend that grouting prior to or during the precipitation season should be increased to maintain safety of the MD.
Accelerated subsidence may also be the result of termination of grouting in the MD that occurred during the capture and control of the MD by ISIS. We believe that the hiatus in grouting for several months has allowed the subsidence beneath the MD to increase rapidly. Hence, a long and continuous grouting program will be needed to restore the situation to what it was before 2014. While grouting is definitely important for MD safety, lowering the water level in Mosul Reservoir is also important for controlling dissolution rate.
Variation in subsidence in the same year is due to higher hydrostatic pressures caused by greater storage of water in the reservoir (also evident from increase of water level observed by the intensity scenes), which, in turn, results in increased dissolution of gypsum layers. As seen in Figure 14B and Figure 17, there was a slight decrease in MD subsidence from April to October of 2017, which is attributed either to the resumption of grouting or decrease of water level in the Mosul Reservoir.
Milillo et al. [21,22] monitored the MD until March 2016. This research that studied subsidence at the MD confirms our results. However, the velocity of subsidence in our study is slower than those reported by Milillo et al. [21,22]. We also emphasize that subsidence increases with time specially for the area A. However, this conclusion is accurate for the periods between 03 October 2014 and 02 April 2017, and between 23 October 2017 and 29 December 2018. subsidence at MD after 02 April 2017 and until 23 October 2017 showed a slight decrease due to the resumption of grouting (Figure 14B).
In order to maintain safety, we strongly recommend the continuation of a grouting program and maintaining the water level at 319 m (a.s.l.) in the Mosul Reservoir. Increasing the water level beyond 319 m will speed up failure of the MD. Figure 17 shows the influence of higher water levels on increase in subsidence, which was clearly seen during the winter of 2014–2015 and 2016–2017, fall 2015 and 2016, and spring 2016 and 2017. Besides evaluating other frequencies such as X-band, further studies should be planned to determine the relationship between water level fluctuations and displacement of MD. At the same time, other ways to store Tigris River water should be explored to ensure safety of the MD.
6. Conclusions
This study demonstrates the successful application of the Persistent Scatterer Interferometry (PSI) approach for mapping unstable areas and determining geo-hazard risks at Mosul Dam. Seventy-eight Single Look Complex (SLC) scenes from Sentinel-1A, in ascending geometry, acquired from 03 October 2014 to 27 June 2019 were processed using PSI that offered an accurate estimate of dam deformation. Ninety-six PSI measurement points have been used. The maximum subsidence velocity in MD was at PSI-1 (−7.4 mm·yr−1). The area facing the powerhouse, designated subsidence area A, including PSI-1 to PSI-6, had a mean subsidence velocity of about −6.27 mm·yr−1. Area A includes thick gypsum layers, where solutioning activities have created larger voids due to the presence of the Sinjar-Dohuk-Amadiya-Fault under the MD foundation. This area also accounts for the maximum hydrostatic pressure due to its lowest topographic elevation in the Mosul Reservoir, causing greater subsidence than elsewhere in the dam.
Subsidence at the old course of the Tigris River had significantly increased after 2014 due to termination of grouting activities by ISIS, leading to increased dissolution beneath the MD.
In general, maintaining stability and safe operation of MD calls for continuous grouting and a controlled rise of water level in the Mosul Reservoir. Relevant institutions should explore other ways to store water of the Tigris River to meet various needs. Use of other SAR frequencies such as X-band are also encouraged for further studies.
Author Contributions
A.A.O. prepared and processed the data and accomplished the study. He wrote the manuscript and outlined the research. A.F.A.-M., D.A.M.A.-M., V.L., Y.I.A.-S., and A.T.S. supported the analysis and discussion. K.K. assisted with the validation of the PSI results. S.E.H. supported the writing and discussion. All authors have checked and revised the manuscript.
Funding
Veraldo Liesenberg is supported by FAPESC (2017TR1762) and CNPq (313887/2018-7).
Acknowledgments
We thank ESA for providing Sentinel-1A data, and the SARPROZ team for providing the SARPROZ software. We are grateful to the General Survey Authority and Ministry of Planning, Iraq for providing the data. We would like to thank Saffa F.A. Fouad, Director General of Iraq Geological Survey, for his tremendous support and encouragement. We also thank Ahmed K. Obaid (Lecturer, Baghdad University, Iraq) and Varojan Sissakian (Lecturer, Kurdistan University, Iraq) for their valuable comments.
Conflicts of Interest
The authors declare no conflict of interest.
Appendix A

Table A1.
Comparison between the mean velocity (mm·yr−1) of the PSI points and the mean velocity measured from the in-situ GNSS (mm·yr−1) at the Mosul Dam. Coordinates of the in-situ GNSS are in WGS 1984 UTM Zone 38 projection.
Table A1.
Comparison between the mean velocity (mm·yr−1) of the PSI points and the mean velocity measured from the in-situ GNSS (mm·yr−1) at the Mosul Dam. Coordinates of the in-situ GNSS are in WGS 1984 UTM Zone 38 projection.
| GNSS | PSI | Velocity (GNSS) | Velocity (PSI) | X-Coordinate (GNSS) | Y-Coordinate (GNSS) | Distance between PSI and GNSS Station (m) |
|---|---|---|---|---|---|---|
| BM100 | PS32 | −1.99 | −2.5 | 304725 | 4056164 | 23.38 |
| BM91 | PS8 | −4.17 | −4.9 | 304924 | 4056076 | 27.24 |
| BM85 | PS20 | −4.38 | −4.2 | 305035 | 4056026 | 54.10 |
| BM79 | PS5 | −4.91 | −5.8 | 305154 | 4055973 | 15.81 |
| BM78 | PS13 | −5.13 | −4.8 | 305181 | 4056063 | 36.11 |
| BM104 | PS41 | −0.81 | −1.9 | 304611 | 4056215 | 46.19 |
| BM96 | PS6 | −4.17 | −5.2 | 304813 | 4056124 | 22.08 |
| BM64 | PS9 | −5.85 | −4.8 | 305422 | 4055962 | 23.41 |
| BM58 | PS19 | −5.45 | −4.2 | 305509 | 4055937 | 25.25 |
| BM59 | PS10 | −4.8 | −5.89 | 305481 | 4055841 | 25.26 |
References
- Scaioni, M.; Marsella, M.; Crosetto, M.; Tornatore, V.; Wang, J. Geodetic and remote-sensing sensors for dam deformation monitoring. Sensors 2018, 18, 3682. [Google Scholar] [CrossRef] [PubMed]
- Fell, R.; MacGregor, P.; Stapledon, D.; Bell, G. Geotechnical Engineering of Dams; Taylor Francis Group: London, UK, 2005; Volume 53. [Google Scholar]
- Gutiérrez, F.; Desir, G.; Gutiérrez, M. Causes of the catastrophic failure of an earth dam built on gypsiferous alluvium and dispersive clays (Altorricón, Huesca Province, NE Spain). Environ. Geol. 2003, 43, 842–851. [Google Scholar] [CrossRef]
- Ferretti, A.; Prati, C.; Rocca, F. Permanent scatterers in SAR interferometry. IEEE Trans. Geosci. Remote Sens. 2001, 39, 8–20. [Google Scholar] [CrossRef]
- Vajedian, S.; Motagh, M.; Nilfouroushan, F. StaMPS improvement for deformation analysis in mountainous regions: Implications for the Damavand volcano and Mosha fault in Alborz. Remote Sens. 2015, 7, 8323–8347. [Google Scholar] [CrossRef]
- Sowter, A.; Bateson, L.; Strange, P.; Ambrose, K.; Fifiksyafiudin, M. Dinsar estimation of land motion using intermittent coherence with application to the south derbyshire and leicestershire coalfields. Remote Sens. Lett. 2013, 4, 979–987. [Google Scholar] [CrossRef]
- Crosetto, M.; Monserrat, O.; Cuevas-González, M.; Devanthéry, N.; Crippa, B. Persistent Scatterer Interferometry: A review. ISPRS J. Photogramm. Remote Sens. 2016, 115, 78–89. [Google Scholar] [CrossRef]
- Mura, J.C.; Gama, F.F.; Paradella, W.R.; Negrão, P.; Carneiro, S.; de Oliveira, C.G.; Brandão, W.S. Monitoring the vulnerability of the dam and dikes in Germano iron mining area after the collapse of the tailings dam of fundão (Mariana-MG, Brazil) using DInSAR techniques with terraSAR-X data. Remote Sens. 2018, 10, 1507. [Google Scholar] [CrossRef]
- Neokosmidis, S.; Elias, P.; Parcharidis, I.; Briole, P. Deformation estimation of an earth dam and its relation with local earthquakes, by exploiting multitemporal synthetic aperture radar interferometry: Mornos dam case (Central Greece). J. Appl. Remote Sens. 2016, 10, 026010. [Google Scholar] [CrossRef]
- Grenerczy, G.; Wegmüller, U. Deformation analysis of a burst red mud reservoir using combined descending and ascending pass ENVISAT ASAR data. Nat. Hazards 2013, 65, 2205–2214. [Google Scholar] [CrossRef]
- Grenerczy, G.; Wegmüller, U. Persistent scatterer interferometry analysis of the embankment failure of a red mud reservoir using ENVISAT ASAR data. Nat. Hazards 2011, 59, 1047–1053. [Google Scholar] [CrossRef]
- Corsetti, M.; Manunta, M.; Marsella, M.; Scifoni, S.; Sonnessa, A.; Ojha, C. Satellite Techniques: New Perspectives for the Monitoring of Dams BT-Engineering Geology for Society and Territory; Lollino, G., Manconi, A., Guzzetti, F., Culshaw, M., Bobrowsky, P., Luino, F., Eds.; Springer: Cham, The Netherlands, 2015; Volume 5, pp. 989–993. [Google Scholar]
- Corsetti, M.; Fossati, F.; Manunta, M.; Marsella, M. Advanced SBAS-DInSAR technique for controlling large civil infrastructures: An application to the Genzano di Lucania dam. Sensors 2018, 18, 2371. [Google Scholar] [CrossRef] [PubMed]
- Milillo, P.; Perissin, D.; Salzer, J.T.; Lundgren, P.; Lacava, G.; Milillo, G.; Serio, C. Monitoring dam structural health from space: Insights from novel InSAR techniques and multi-parametric modeling applied to the Pertusillo dam Basilicata, Italy. Int. J. Appl. Earth Obs. Geoinf. 2016, 52, 221–229. [Google Scholar] [CrossRef]
- Sato, H.; Sasaki, T.; Kondo, M.; Kobori, T.; Onodera, A.; Yoshikawa, K.; Sango, D.; Morita, Y. Basic investigation of displacement monitoring of dams following earthquakes based on SAR satellite data. J. Disaster Res. 2017, 12, 515–525. [Google Scholar] [CrossRef]
- Emadali, L.; Motagh, M.; Haghshenas Haghighi, M. Characterizing post-construction settlement of the Masjed-Soleyman embankment dam, Southwest Iran, using TerraSAR-X SpotLight radar imagery. Eng. Struct. 2017, 143, 261–273. [Google Scholar] [CrossRef]
- Ullo, S.L.; Addabbo, P.; Martire, D.D.; Sica, S.; Fiscante, N.; Cicala, L.; Angelino, C.V. Application of DInSAR Technique to High Coherence Sentinel-1 Images for Dam Monitoring and Result Validation Through in Situ Measurements. IEEE J. Sel. Top. Appl. Earth Obs. Remote Sens. 2019, 12, 875–890. [Google Scholar] [CrossRef]
- Zhu, X.X.; Wang, Y.; Montazeri, S.; Ge, N.A. Review of ten-year advances of multi-baseline SAR interferometry using terraSAR-X data. Remote Sens. 2018, 10, 1374. [Google Scholar] [CrossRef]
- Jia, H.; Liu, L. A technical review on persistent scatterer interferometry. J. Mod. Transp. 2016, 24, 153–158. [Google Scholar] [CrossRef]
- Di Martire, D.; Tessitore, S.; Brancato, D.; Ciminelli, M.G.; Costabile, S.; Costantini, M.; Graziano, G.V.; Minati, F.; Ramondini, M.; Calcaterra, D. Landslide detection integrated system (LaDIS) based on in-situ and satellite SAR interferometry measurements. CATENA 2016, 137, 406–421. [Google Scholar] [CrossRef]
- Milillo, P.; Bürgmann, R.; Lundgren, P.; Salzer, J.; Perissin, D.; Fielding, E.; Biondi, F.; Milillo, G. Space geodetic monitoring of engineered structures: The ongoing destabilization of the Mosul dam, Iraq. Sci. Rep. 2016, 6, 37408. [Google Scholar] [CrossRef]
- Milillo, P.; Porcu, M.C.; Lundgren, P.; Soccodato, F.; Salzer, J.; Fielding, E.; Burgmann, R.; Milillo, G.; Perissin, D.; Biondi, F. The ongoing destabilization of the mosul dam as observed by synthetic aperture radar interferometry. In Proceedings of the 2017 IEEE International Geoscience and Remote Sensing Symposium, Fort Worth, TX, USA, 23–28 July 2017; pp. 6279–6282. [Google Scholar]
- Riccardi, P.; Tessari, G.; Floris, M. Use of Sentinel-1 SAR Data to Monitor Mosul dam Vulnerability Use of Sentinel-1 SAR Data to Monitor Mosul dam Vulnerability; EGU: Vienna, Austria, 2017. [Google Scholar]
- Issa, I.E. Sedimentological and Hydrological Investigation of Mosul Dam Reservoir. Ph.D. Thesis, Luleå University of Technology, Luleå, Sweden, 2015. [Google Scholar]
- Issa, E.; Al-Ansari, N.; Sherwany, G.; Knutsson, S. Sedimentation processes and useful life of Mosul Dam Reservoir, Iraq. Engineering 2013, 5, 779–784. [Google Scholar] [CrossRef]
- Gill, M.A. Sedimentation and useful life of reservoirs. J. Hydrol. 1979, 44, 89–95. [Google Scholar] [CrossRef]
- Garg, V.; Jothiprakash, V. Estimation of useful life of a reservoir using sediment trap efficiency. J. Spat. Hydrol. 2008, 8, 1–14. [Google Scholar]
- IMOS. Climate Data; IMOS: Iraq, Baghdad, 2018. [Google Scholar]
- Fouad, S.F. Tectonic Map of Iraq, scale 1:1000,000, 3rd ed.; Iraq Geological Survey Publications: Baghdad, Iraq, 2012. [Google Scholar]
- Sissakian, V.K. Geological evolution of the Iraqi Mesopotamia Foredeep, inner platform and near surroundings of the Arabian Plate. J. Asian Earth Sci. 2013, 72, 152–163. [Google Scholar] [CrossRef]
- Moghadam, H.S.; Stern, R.J.; Chiaradia, M.; Rahgoshay, M. Geochemistry and tectonic evolution of the Late Cretaceous Gogher–Baft ophiolite, central Iran. Lithos 2013, 168–169, 33–47. [Google Scholar] [CrossRef]
- McQuarrie, N.; Stock, J.M.; Verdel, C.; Wernicke, B.P. Cenozoic evolution of Neotethys and implications for the causes of plate motions. Geophys. Res. Lett. 2003, 30, 2036. [Google Scholar] [CrossRef]
- Alavi, M. Tectonics of the zagros orogenic belt of iran: New data and interpretations. Tectonophysics 1994, 229, 211–238. [Google Scholar] [CrossRef]
- Alavi, M. Regional stratigraphy of the Zagros fold-thrust belt of Iran and its proforeland evolution. Am. J. Sci. 2004, 304, 1–20. [Google Scholar] [CrossRef]
- Othman, A.A.; Gloaguen, R. Integration of spectral, spatial and morphometric data into lithological mapping: A comparison of different Machine Learning Algorithms in the Kurdistan Region, NE Iraq. J. Asian Earth Sci. 2017, 146, 90–102. [Google Scholar] [CrossRef]
- Othman, A.A.; Gloaguen, R. Automatic extraction and size distribution of landslides in kurdistan region, NE Iraq. Remote Sens. 2013, 5, 2389–2410. [Google Scholar] [CrossRef]
- Othman, A.A.; Gloaguen, R. River Courses Affected by Landslides and Implications for Hazard Assessment: A High Resolution Remote Sensing Case Study in NE Iraq–W Iran. Remote Sens. 2013, 5, 1024–1044. [Google Scholar] [CrossRef]
- Othman, A.A.; Gloaguen, R. Improving lithological mapping by SVM classification of spectral and morphological features: The discovery of a new chromite body in the Mawat ophiolite complex (Kurdistan, NE Iraq). Remote Sens. 2014, 6, 6867–6896. [Google Scholar] [CrossRef]
- Othman, A.A.; Gloaguen, R.; Andreani, L.; Rahnama, M. Improving landslide susceptibility mapping using morphometric features in the Mawat area, Kurdistan Region, NE Iraq: Comparison of different statistical models. Geomorphology 2018, 319, 147–160. [Google Scholar] [CrossRef]
- Al-Kadhimi, J.A.M.; Sissakian, V.K.; Fattah, A.S.; Deikran, D.B. Tectonic Map of Iraq, 2nd ed.; scale 1:1000,000; Iraq Geological Survey: Baghdad, Iraq, 1997. [Google Scholar]
- Tawfiq, J.M.; Domas, J. Geological Mapping of Duhok-Ain Zala Area; Iraq Geological Survey: Baghdad, Iraq, 1977. [Google Scholar]
- USGS Earthquake Data. Available online: https://earthquake.usgs.gov/earthquakes/ (accessed on 30 November 2018).
- Jassim, S.Z.; Jibril, A.S.; Numan, N.M.S. Gypsum karstification in the Middle Miocene Fatha Formation, Mosul area, northern Iraq. Geomorphology 1997, 18, 137–149. [Google Scholar] [CrossRef]
- Hijab, S.R.; Al-Jabbar, M.A. Geophysical Investigation on Mosul Dam area, Stage One: Emergency Microgravity Survey; Iraq Geological Survey Library: Baghdad, Iraq, 2007. [Google Scholar]
- Modacom, J.V. Drawing No.FR 82303. Permeability of Parent Rocks, Mosul, Iraq, 1984.
- ESA Sentinel-1. Available online: https://earth.esa.int/web/guest/missions/esa-operational-eo-missions/sentinel-1 (accessed on 15 October 2019).
- Ruiz-Armenteros, A.M.; Lazecky, M.; Hlaváčová, I.; Bakoň, M.; Manuel Delgado, J.; Sousa, J.J.; Lamas-Fernández, F.; Marchamalo, M.; Caro-Cuenca, M.; Papco, J.; et al. Deformation monitoring of dam infrastructures via spaceborne MT-InSAR. The case of La Viñuela (Málaga, southern Spain). Procedia Comput. Sci. 2018, 138, 346–353. [Google Scholar] [CrossRef]
- Roccheggiani, M.; Piacentini, D.; Tirincanti, E.; Perissin, D.; Menichetti, M. Detection and monitoring of tunneling induced ground movements using Sentinel-1 SAR interferometry. Remote Sens. 2019, 11, 639. [Google Scholar] [CrossRef]
- Rabus, B.; Eineder, M.; Roth, A.; Bamler, R. The shuttle radar topography mission-A new class of digital elevation models acquired by spaceborne radar. ISPRS J. Photogramm. Remote Sens. 2003, 57, 241–262. [Google Scholar] [CrossRef]
- EROS Landsat OLI. Available online: https://earthexplorer.usgs.gov/ (accessed on 15 October 2019).
- Xu, H. Modification of normalised difference water index (NDWI) to enhance open water features in remotely sensed imagery. Int. J. Remote Sens. 2006, 27, 3025–3033. [Google Scholar] [CrossRef]
- Topcon. Introducing the Most Advanced GPS+ Receiver System ever Made, Tokyo, Japan, 2009.
- Perissin, D. SARPROZ, West Lafayette, IN, USA, 2017.
- Perissin, D.; Wang, Z.; Lin, H. Shanghai subway tunnels and highways monitoring through Cosmo-SkyMed Persistent Scatterers. ISPRS J. Photogramm. Remote Sens. 2012, 73, 58–67. [Google Scholar] [CrossRef]
- ESRI. ArcGIS; Redlands, CA, USA, 2011. [Google Scholar]
- R Core Team. R: The Foundation for Statistical Computing, Boston, MA, USA, 2017.
- Crosetto, M.; Monserrat, O.; Cuevas, M.; Crippa, B. Spaceborne differential SAR interferometry: Data analysis tools for deformation measurement. Remote Sens. 2011, 3, 305–318. [Google Scholar] [CrossRef]
- Lazecký, M.; Perissin, D.; Zhiying, W.; Ling, L.; Yuxiao, Q. Observing dam’s movements with spaceborne sar interferometry. In Engineering Geology for Society and Territory-Volume 5: Urban Geology, Sustainable Planning and Landscape Exploitation; Springer: Cham, The Netherlands, 2015; pp. 131–136. [Google Scholar]
- Temporim, F.A.; Gama, F.F.; Mura, J.C.; Paradella, W.R.; Silva, G.G. Application of persistent scatterers interferometry for surface displacements monitoring in N5E open pit iron mine using TerraSAR-X data, in Carajás Province, Amazon region. Braz. J. Geol. 2017, 47, 225–235. [Google Scholar] [CrossRef]
- Hooper, A.; Zebker, H.; Segall, P.; Kampes, B. A new method for measuring deformation on volcanoes and other natural terrains using InSAR persistent scatterers. Geophys. Res. Lett. 2004, 31, 1–5. [Google Scholar] [CrossRef]
- Kampes, B.M. Radar Interferometry Persistent Scatterers Technique; Springer: Dordrecht, The Netherlands, 2006. [Google Scholar]
- Bozzano, F.; Mazzanti, P.; Perissin, D.; Rocca, A.; De Pari, P.; Discenza, E.M. Basin Scale Assessment of Landslides Geomorphological Setting by Advanced InSAR Analysis. Remote Sens. 2017, 9, 267. [Google Scholar] [CrossRef]
- Zebker, H.A.; Villasenor, J. Decorrelation in interferometric radar echoes. IEEE Trans. Geosci. Remote Sens. 1992, 30, 950–959. [Google Scholar] [CrossRef]
- Zhang, Y.; Zhang, J.; Wu, H.; Lu, Z.; Guangtong, S. Monitoring of urban subsidence with SAR interferometric point target analysis: A case study in Suzhou, China. Int. J. Appl. Earth Obs. Geoinf. 2011, 13, 812–818. [Google Scholar] [CrossRef]
- Ferretti, A.; Prati, C.; Rocca, F. Nonlinear subsidence rate estimation using permanent scatterers in differential SAR interferometry. IEEE Trans. Geosci. Remote Sens. 2000, 38, 2202–2212. [Google Scholar] [CrossRef]
- Giardina, G.; Milillo, P.; DeJong, M.J.; Perissin, D.; Milillo, G. Evaluation of InSAR monitoring data for post-tunnelling settlement damage assessment. Struct. Control Heal. Monit. 2019, 26, e2285. [Google Scholar] [CrossRef]
- Jiang, Y.; Liao, M.; Wang, H.; Zhang, L.; Balz, T. Deformation monitoring and analysis of the geological environment of Pudong International Airport with persistent scatterer SAR interferometry. Remote Sens. 2016, 8, 1021. [Google Scholar] [CrossRef]
© 2019 by the authors. Licensee MDPI, Basel, Switzerland. This article is an open access article distributed under the terms and conditions of the Creative Commons Attribution (CC BY) license (http://creativecommons.org/licenses/by/4.0/).