Oil Palm (Elaeis guineensis) Mapping with Details: Smallholder versus Industrial Plantations and their Extent in Riau, Sumatra

 ,
,  , ,
, , 
Abstract

1. Introduction
2. Materials and Methods
2.1. Data and Study Area
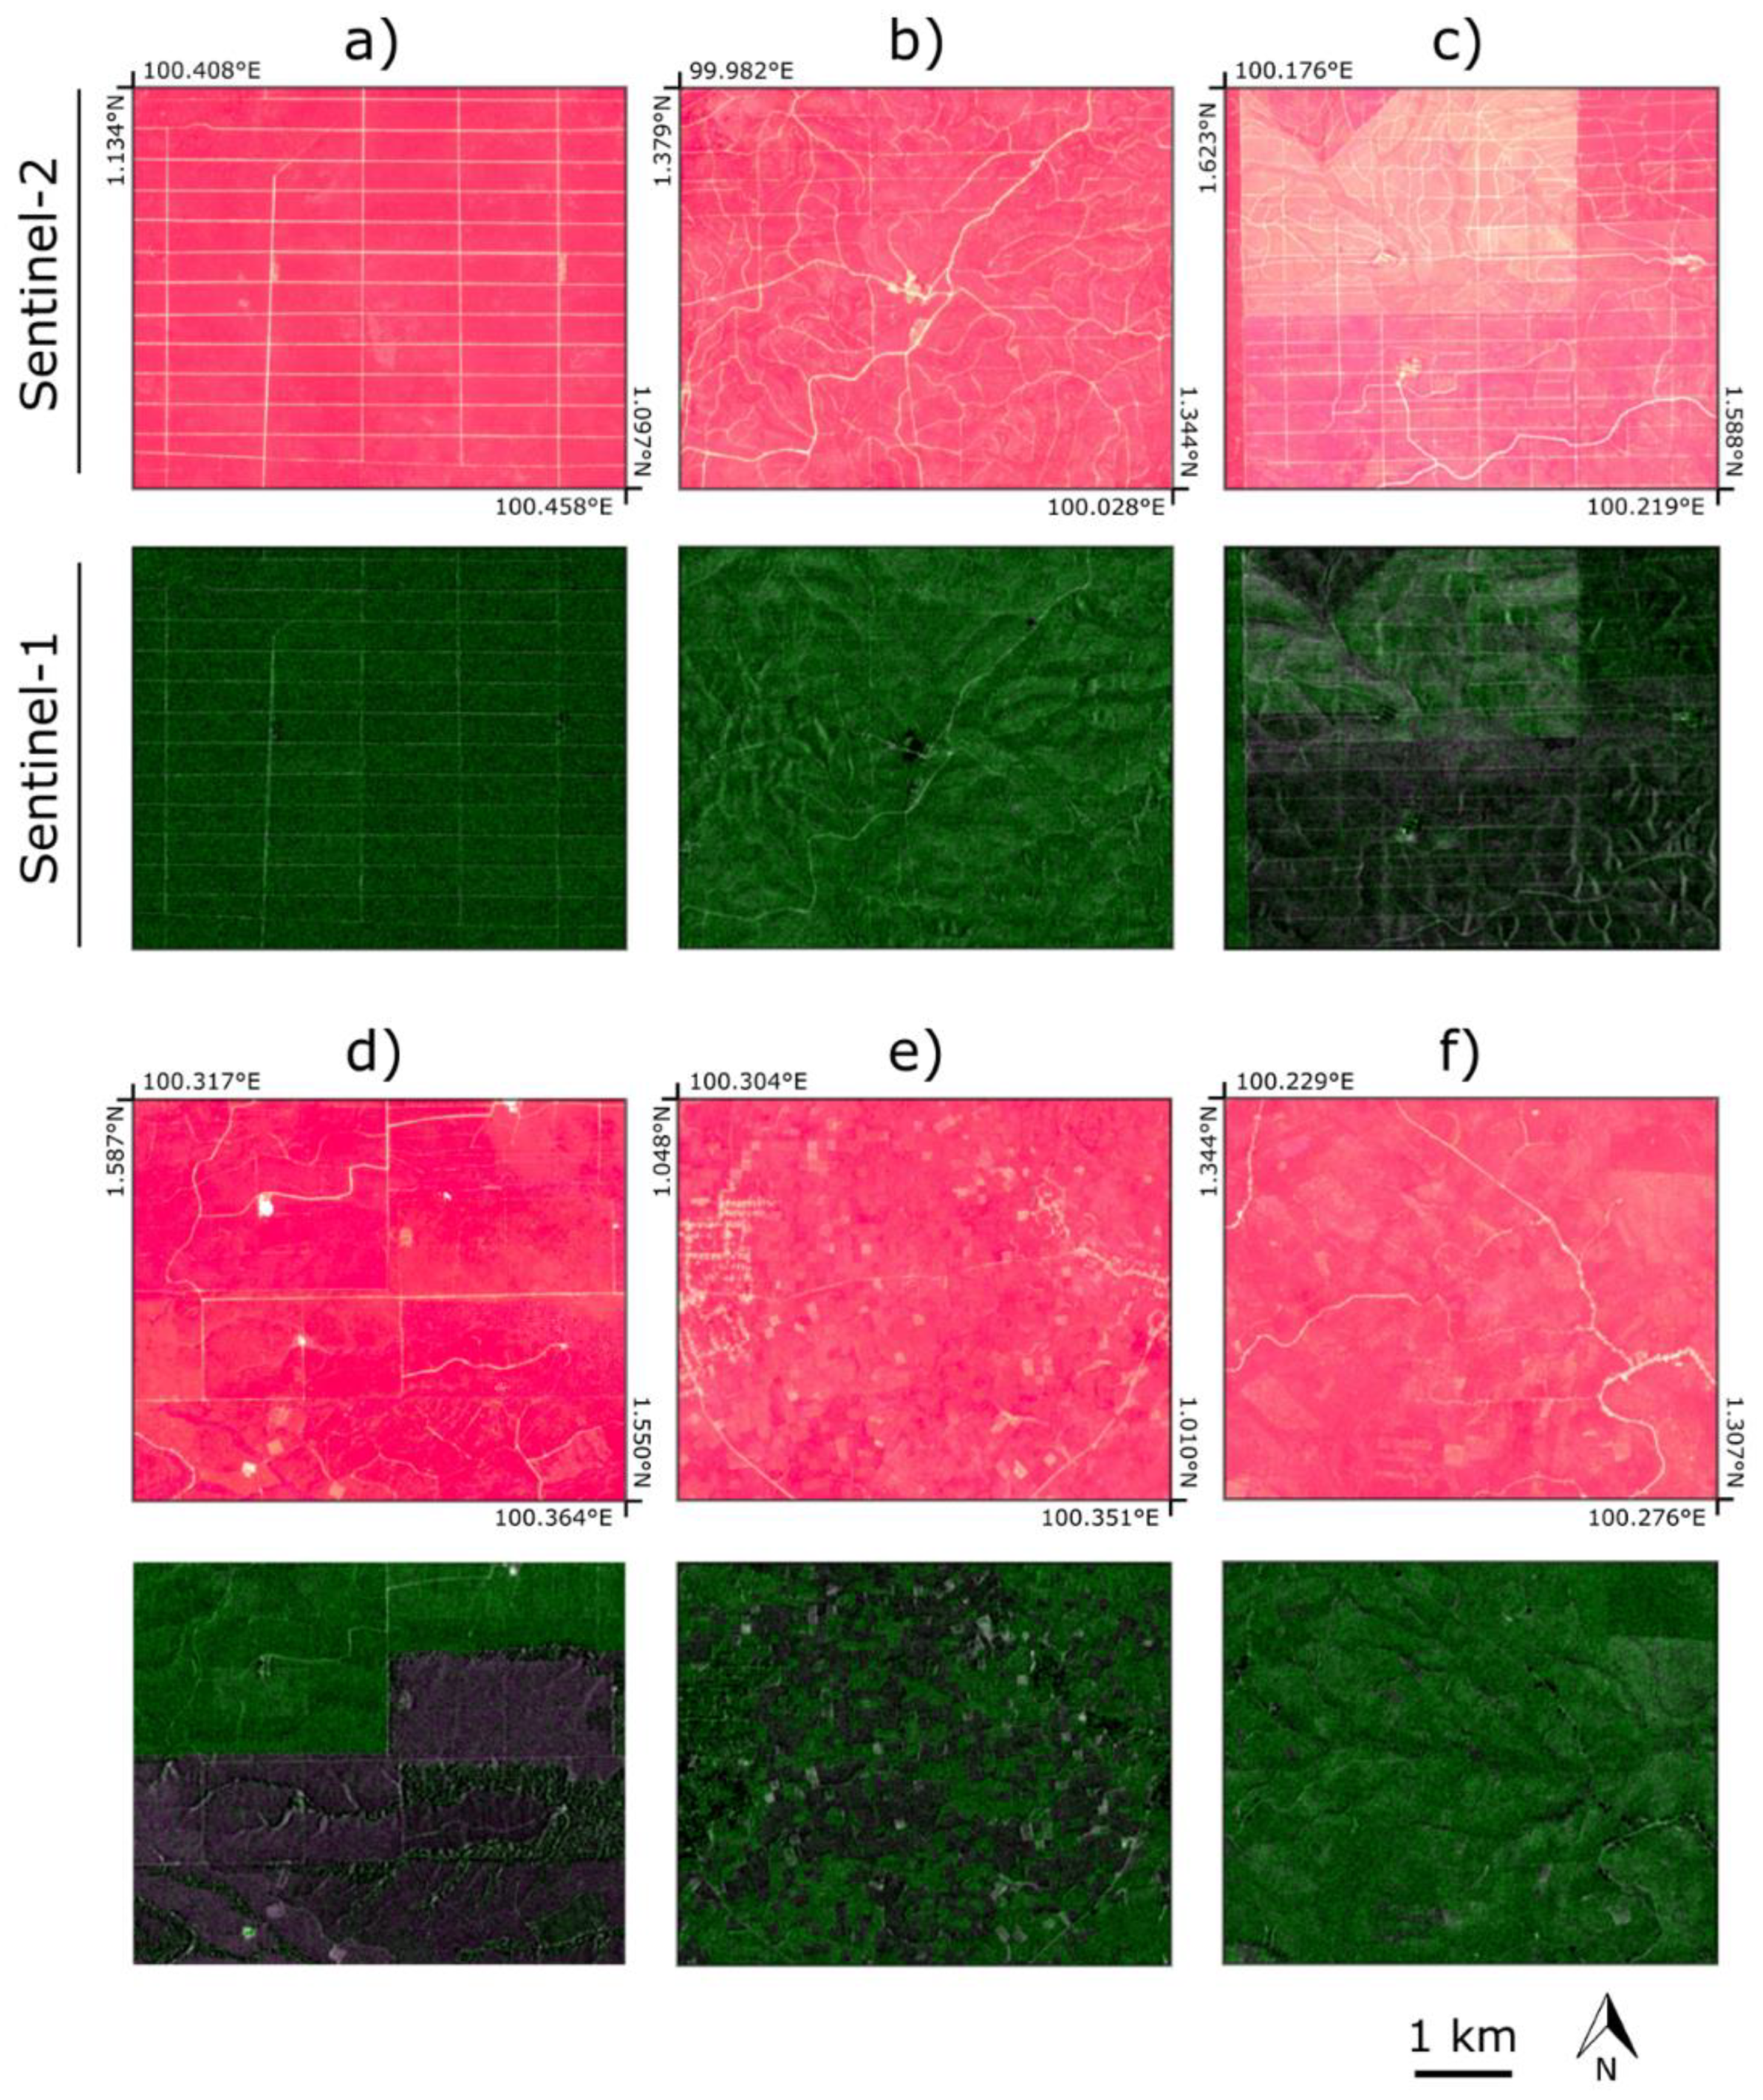
2.1.1. Sentinel Missions
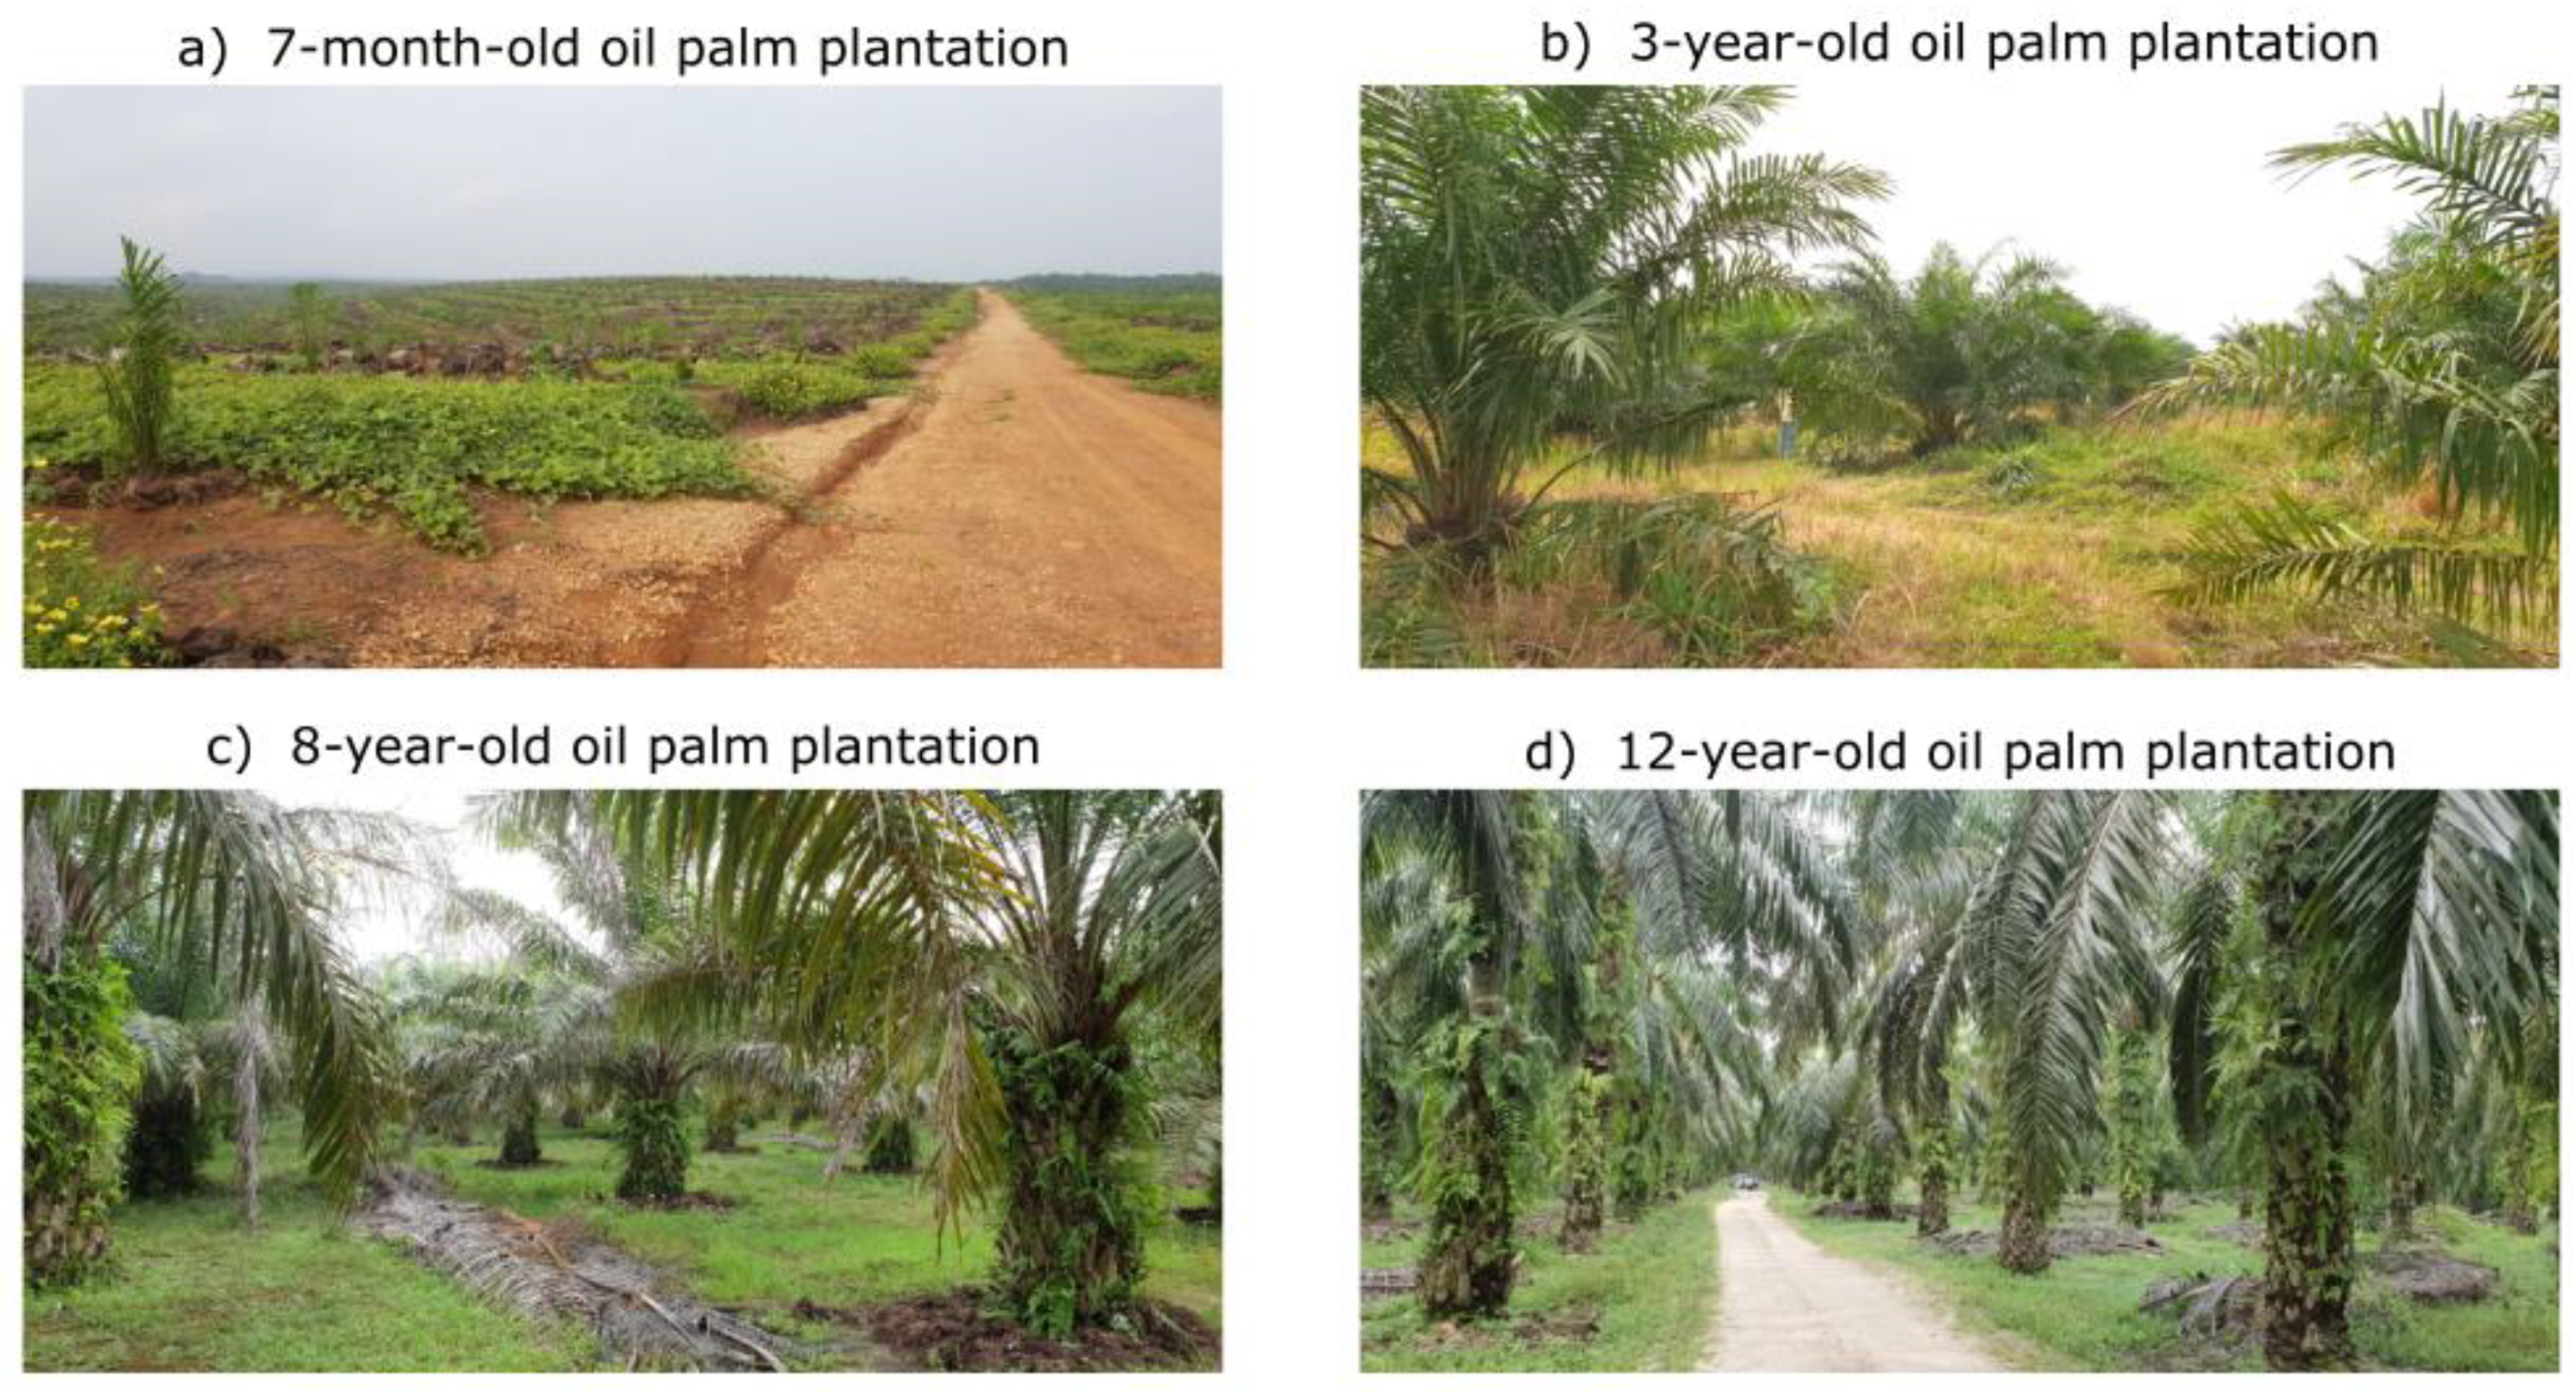
2.1.2. Training and Validation Data Collection
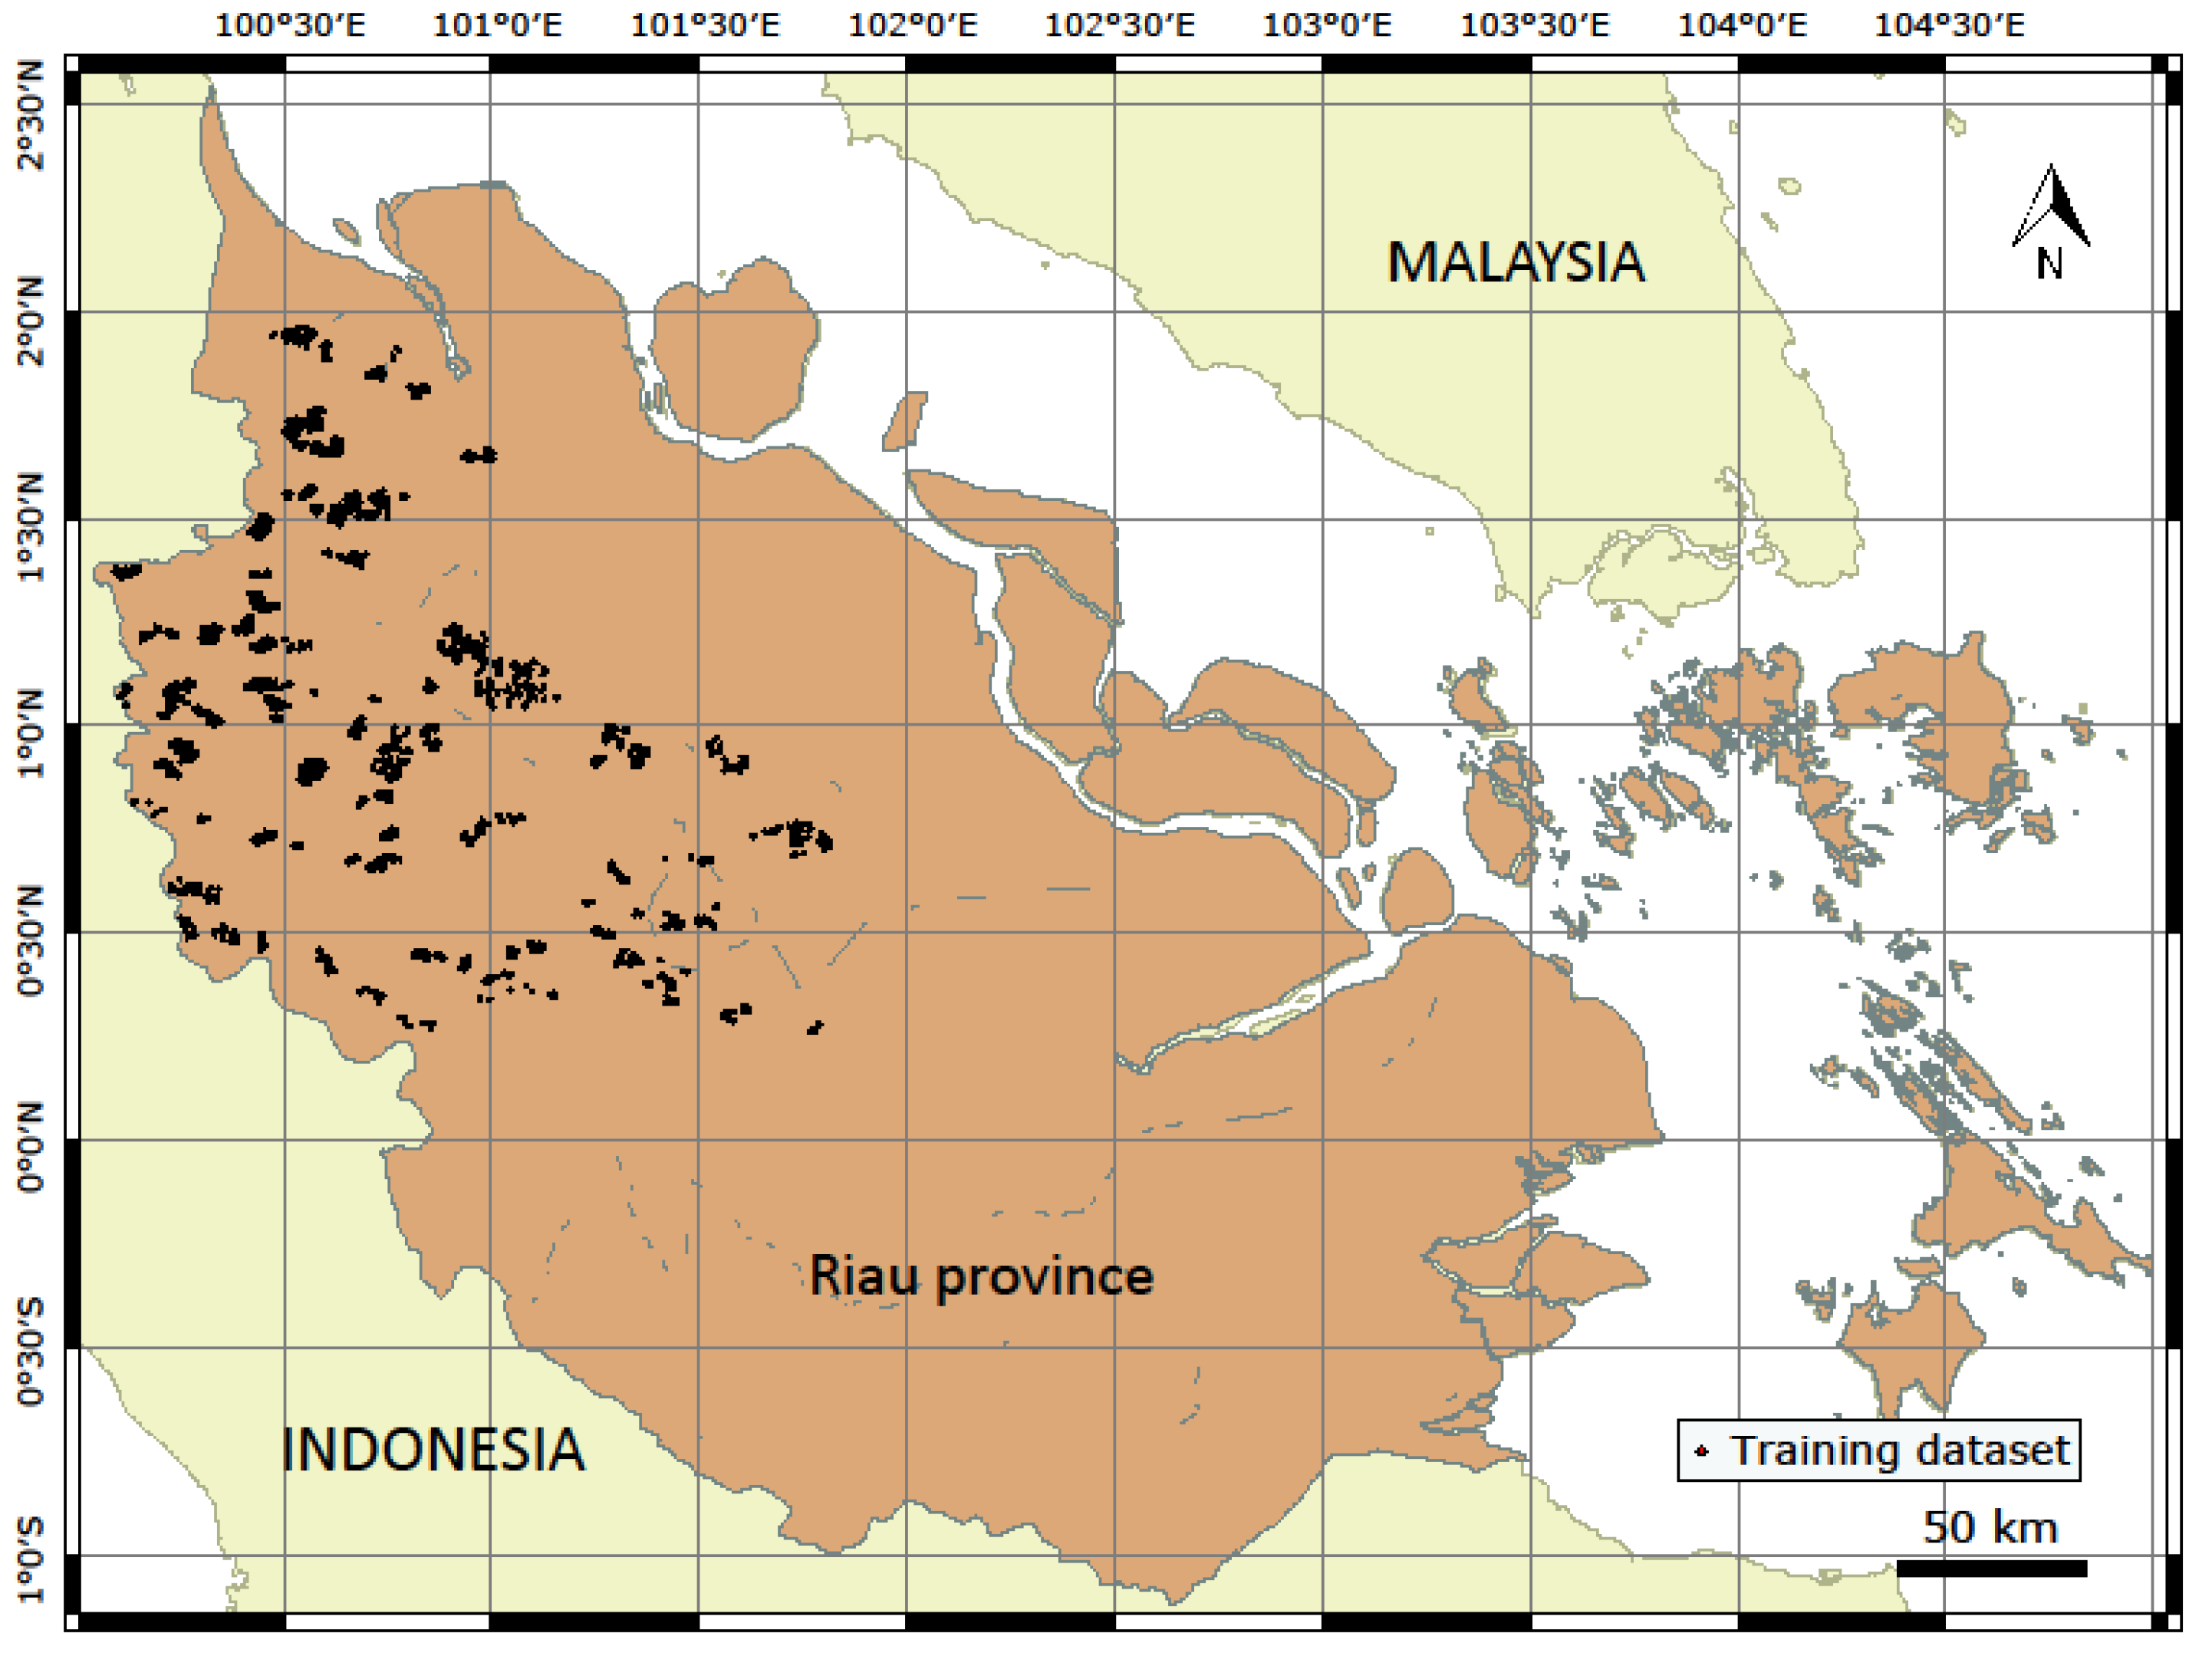
2.1.3. Study Area
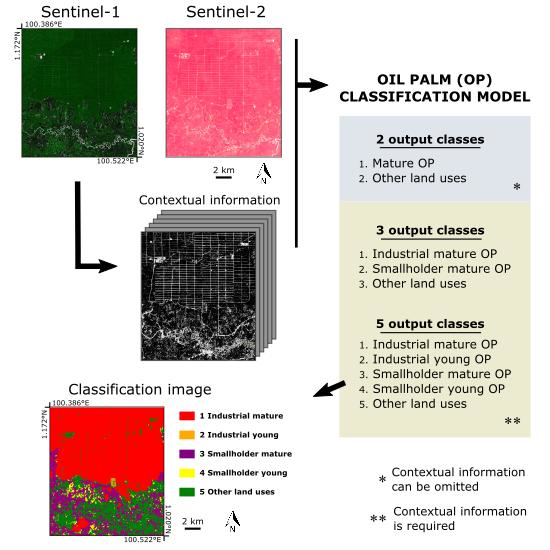
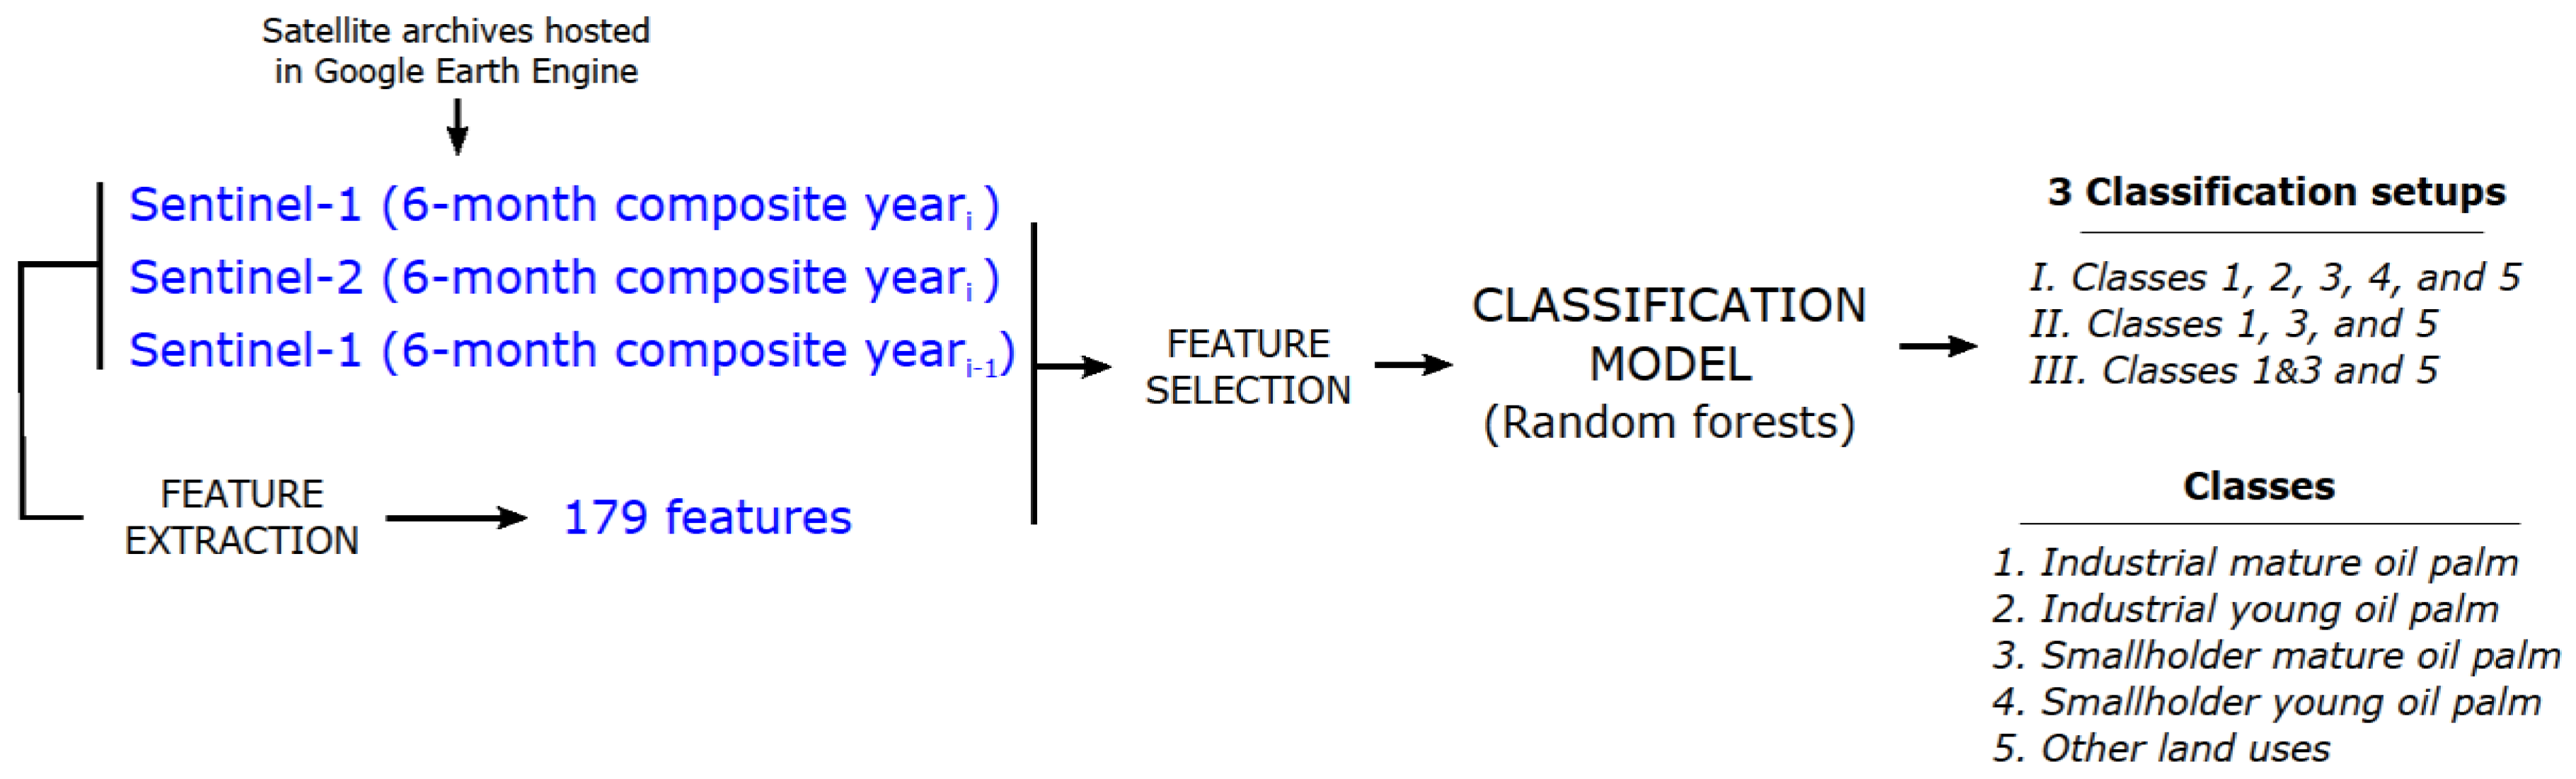
2.2. Algorithm Overview
2.2.1. Sentinel-1 and Sentinel-2 Compositing
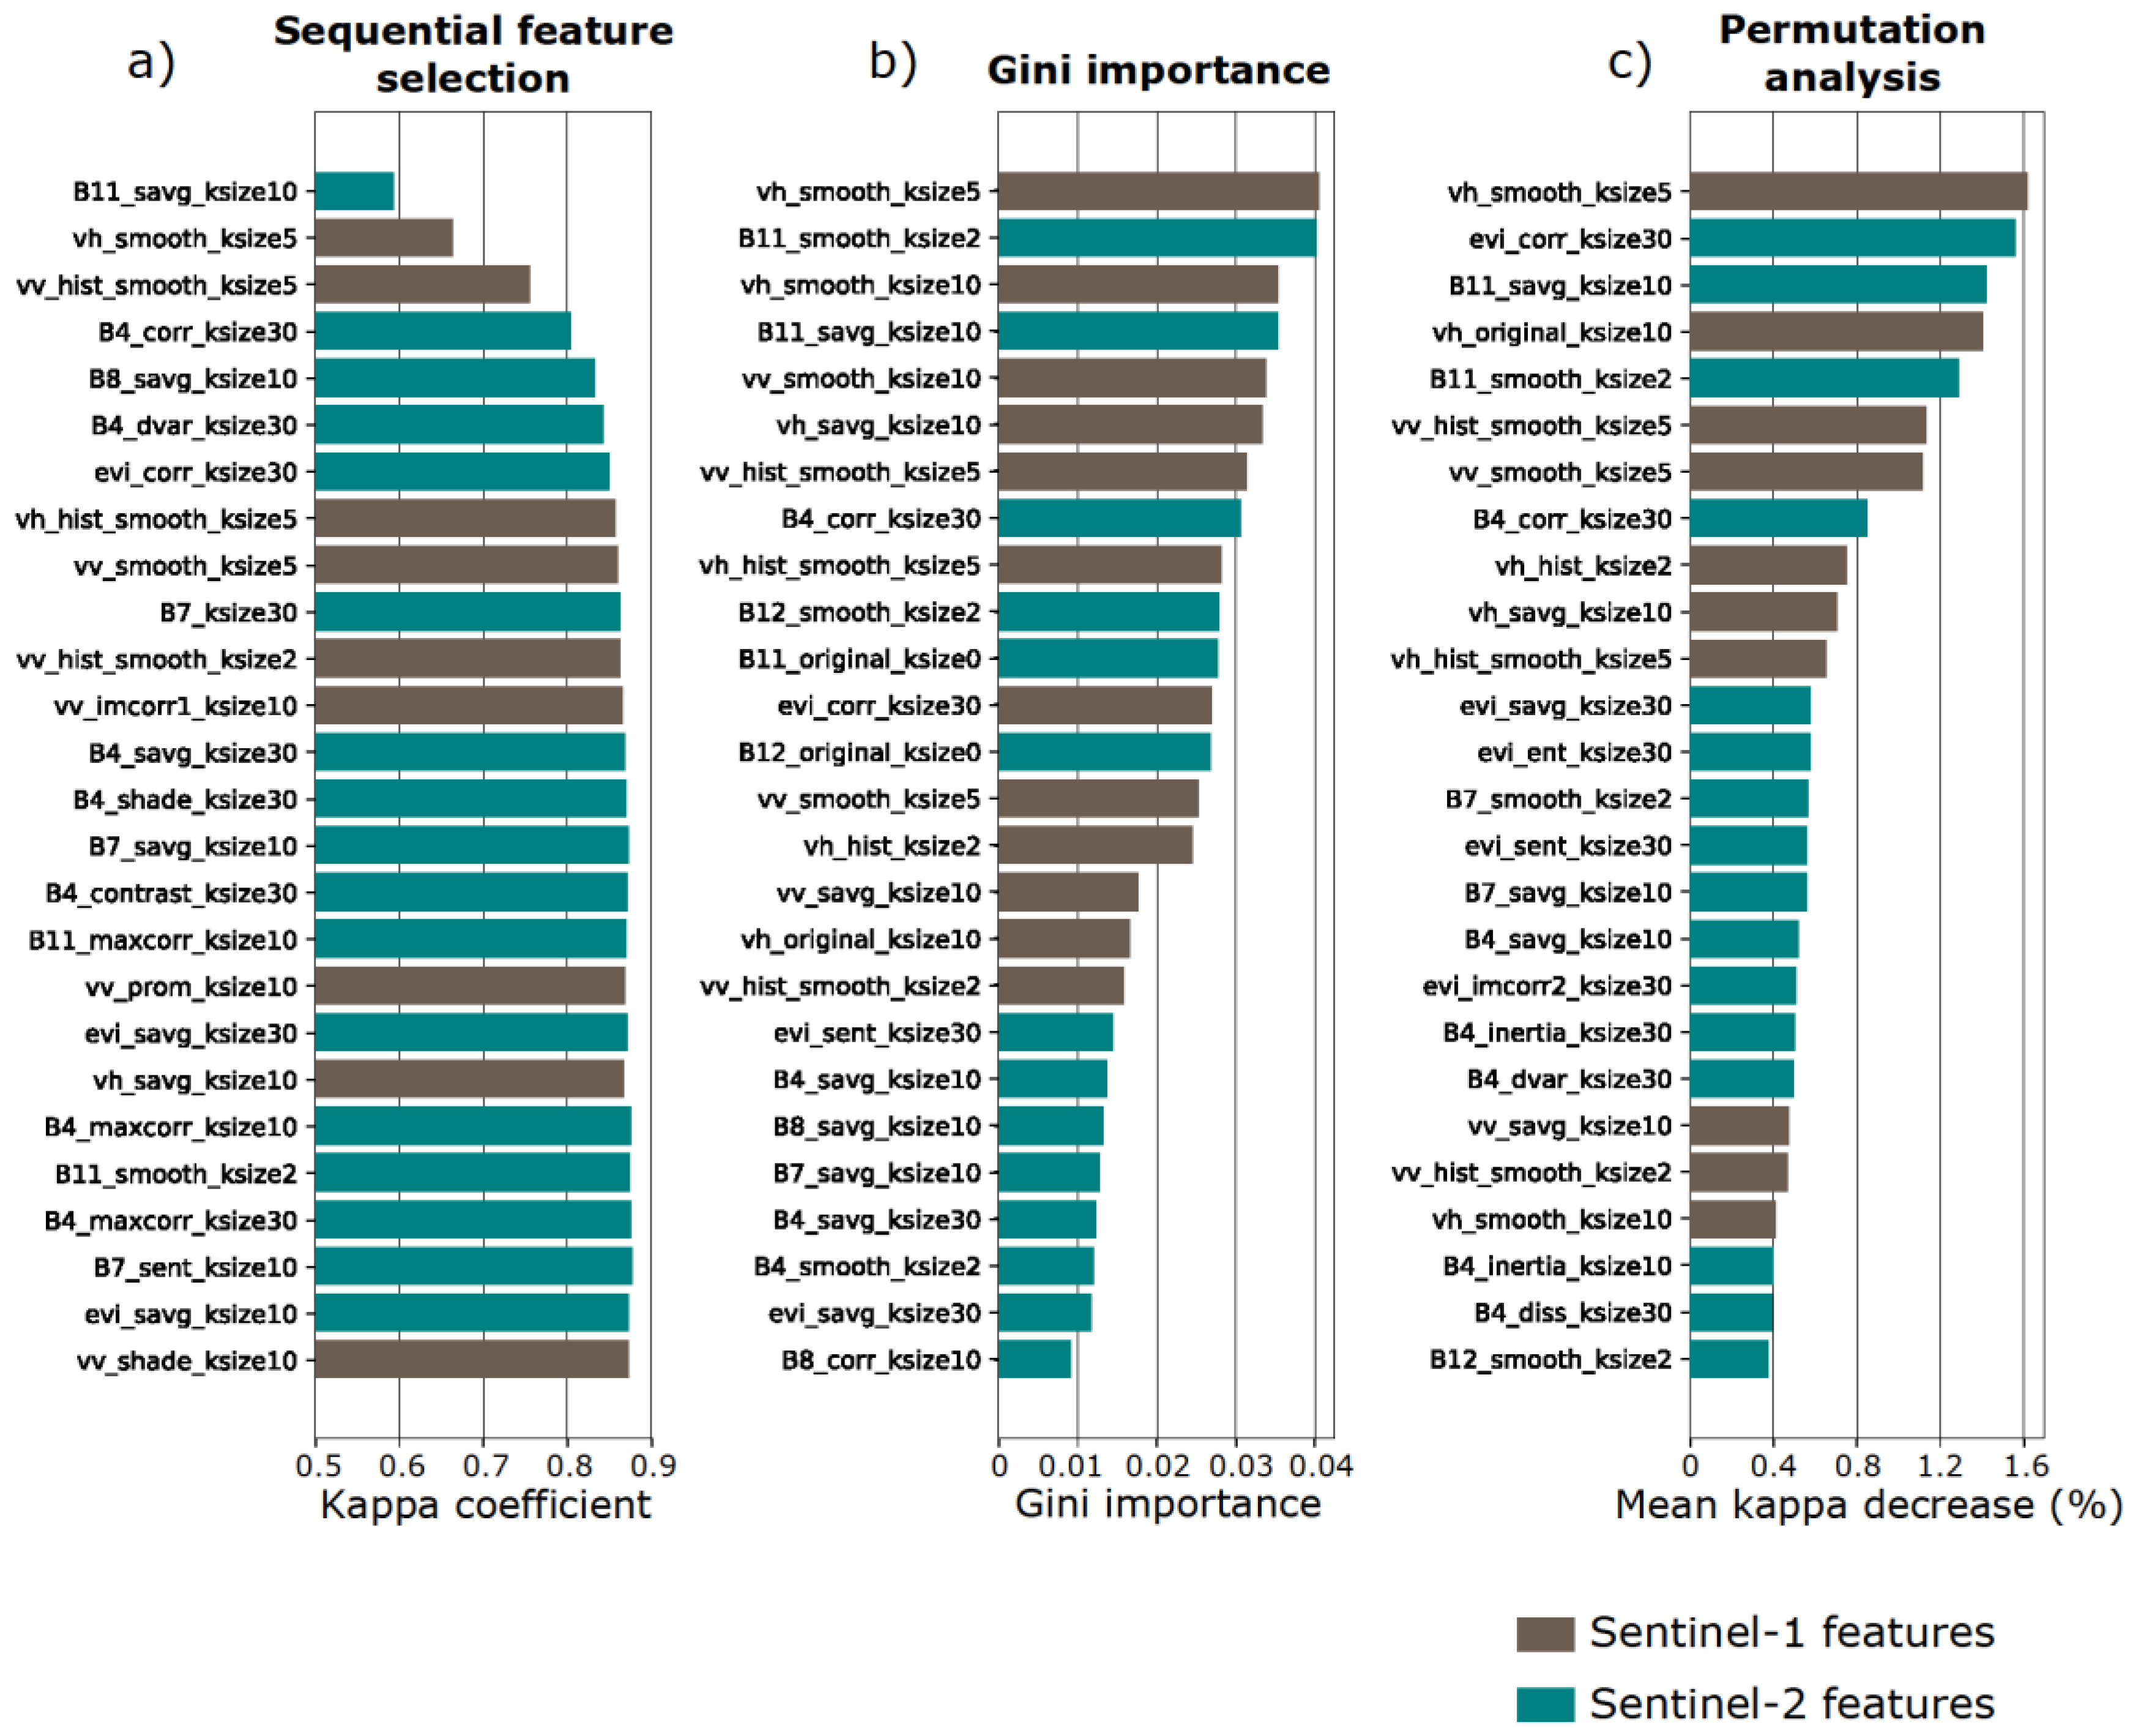
2.2.2. Feature Extraction
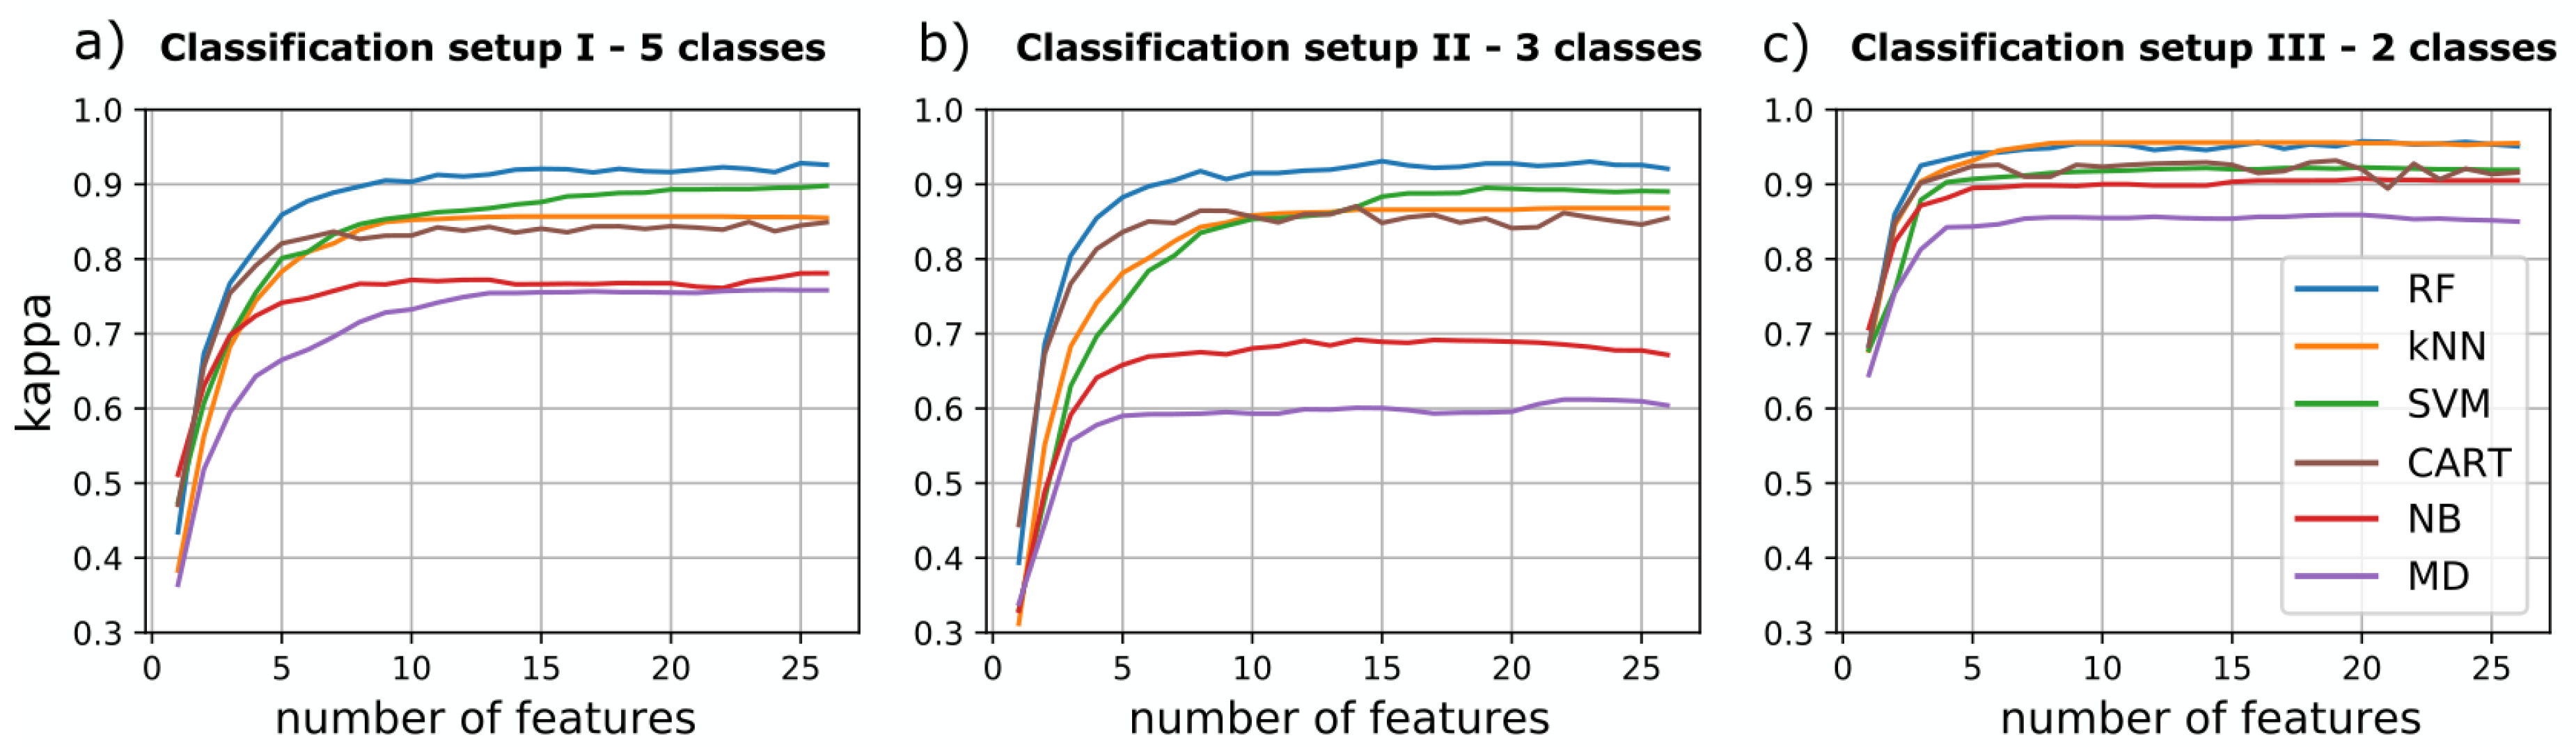
2.2.3. Feature Selection
2.2.4. Random Forest Classification
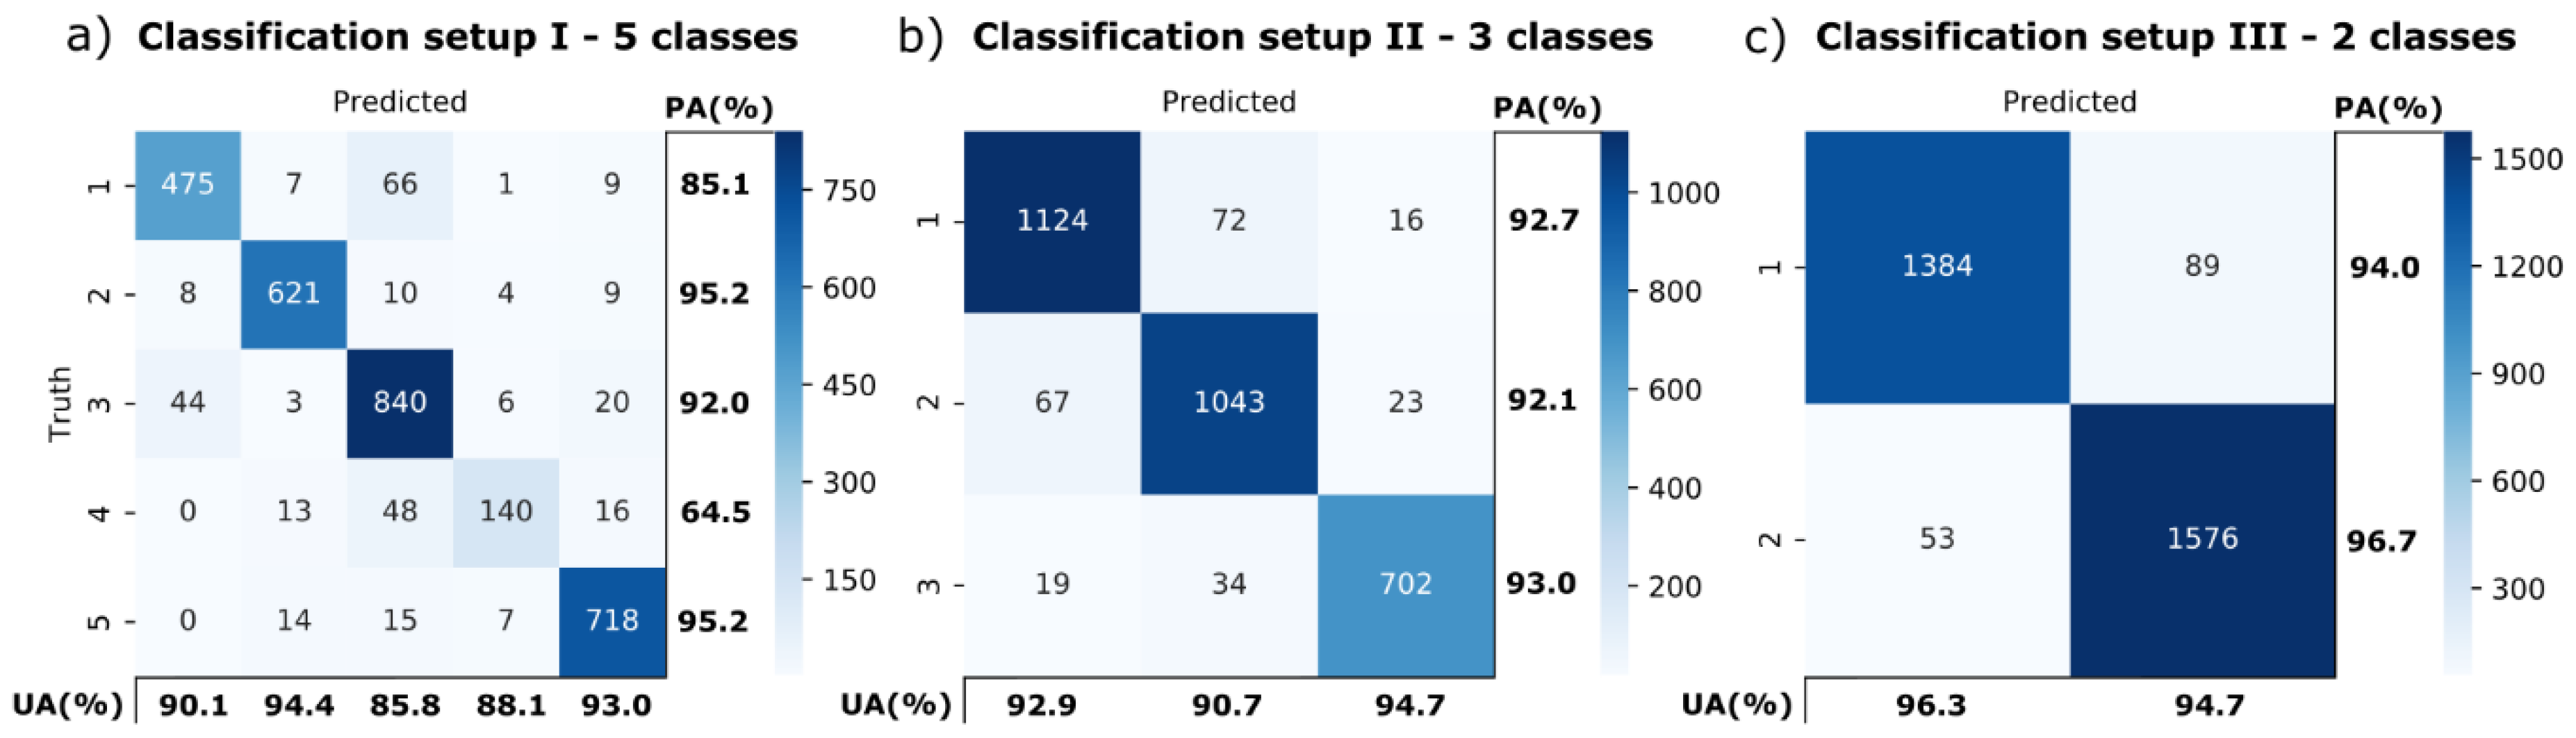
2.3. Accuracy Assessment and Model Selection
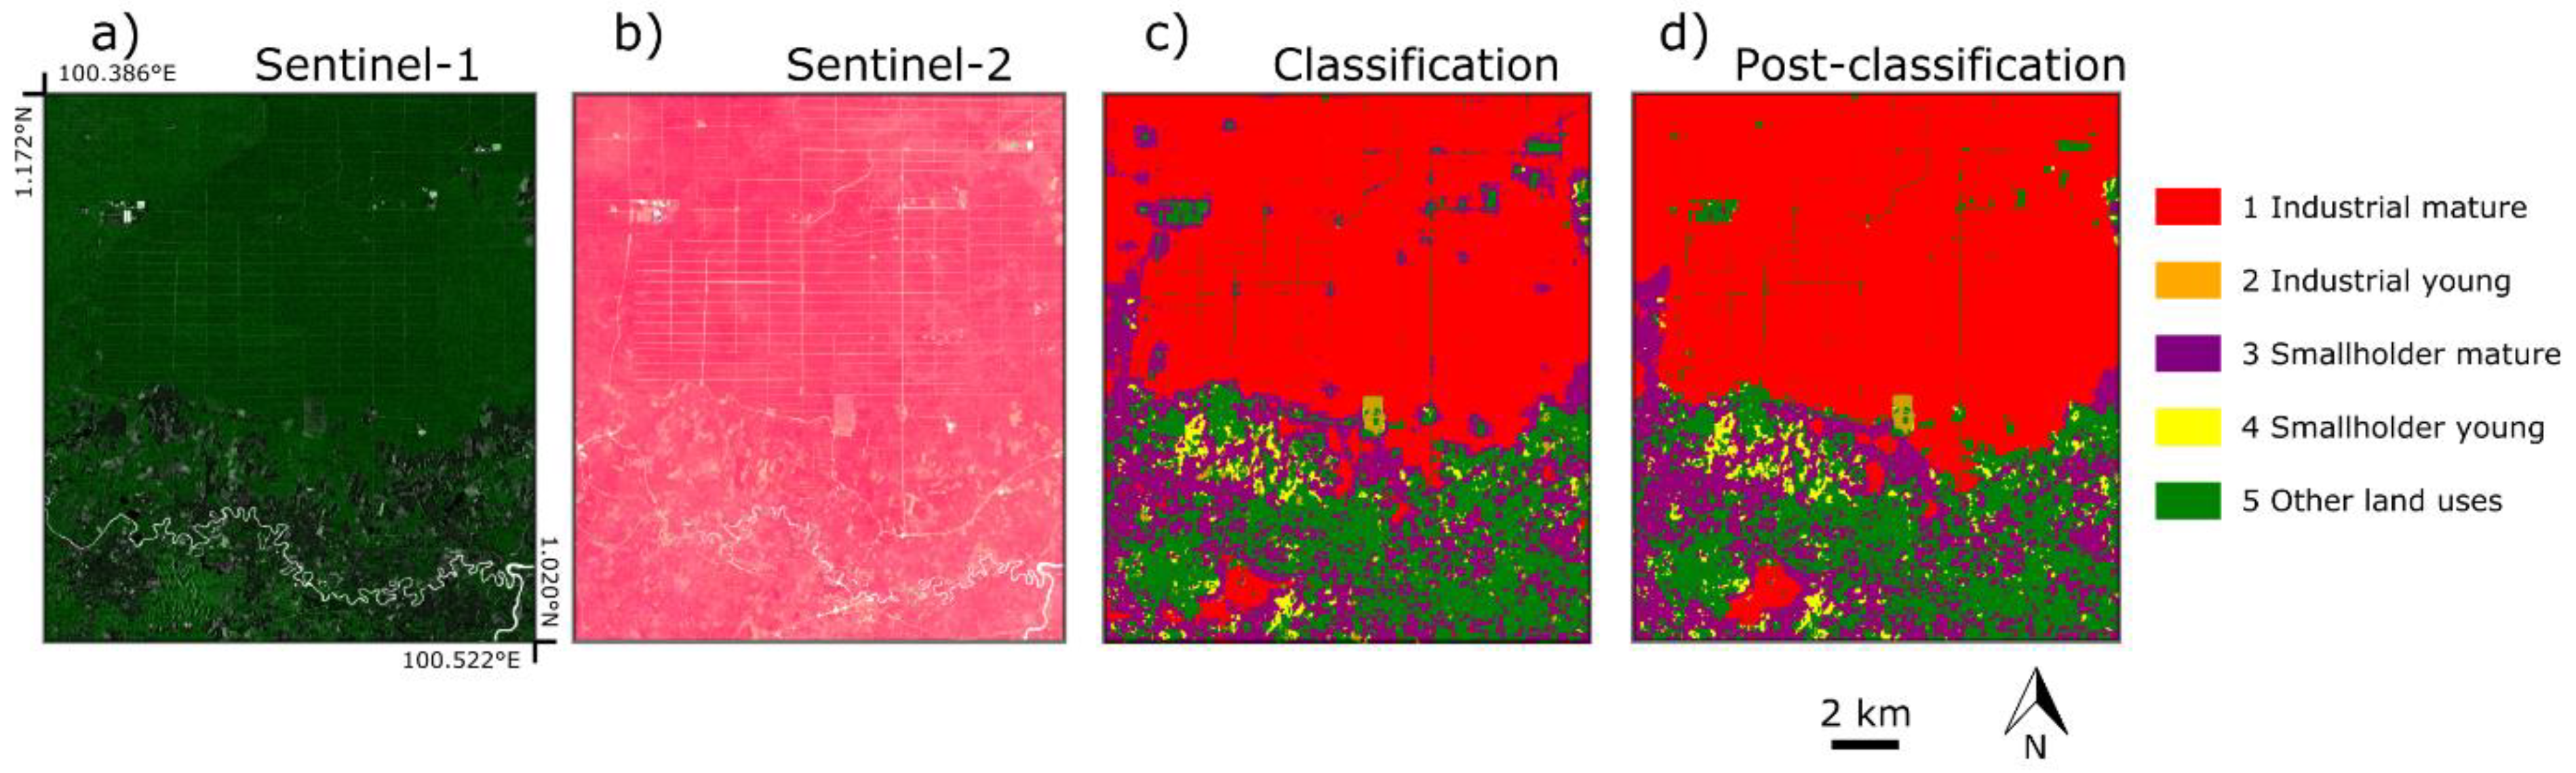
2.4. Post-Processing
- Morphology operations (closing) to remove misclassifications of mature smallholder plantations, particularly inside the mature industrial plantations.
- Reclassification of smallholder young plantations misclassified as industrial young plantations. We reclassified the disconnected patches with a size lower than 150 pixels.
- Mode filter to remove salt-and-pepper effects with a squared-kernel of 3 pixels of diameter.
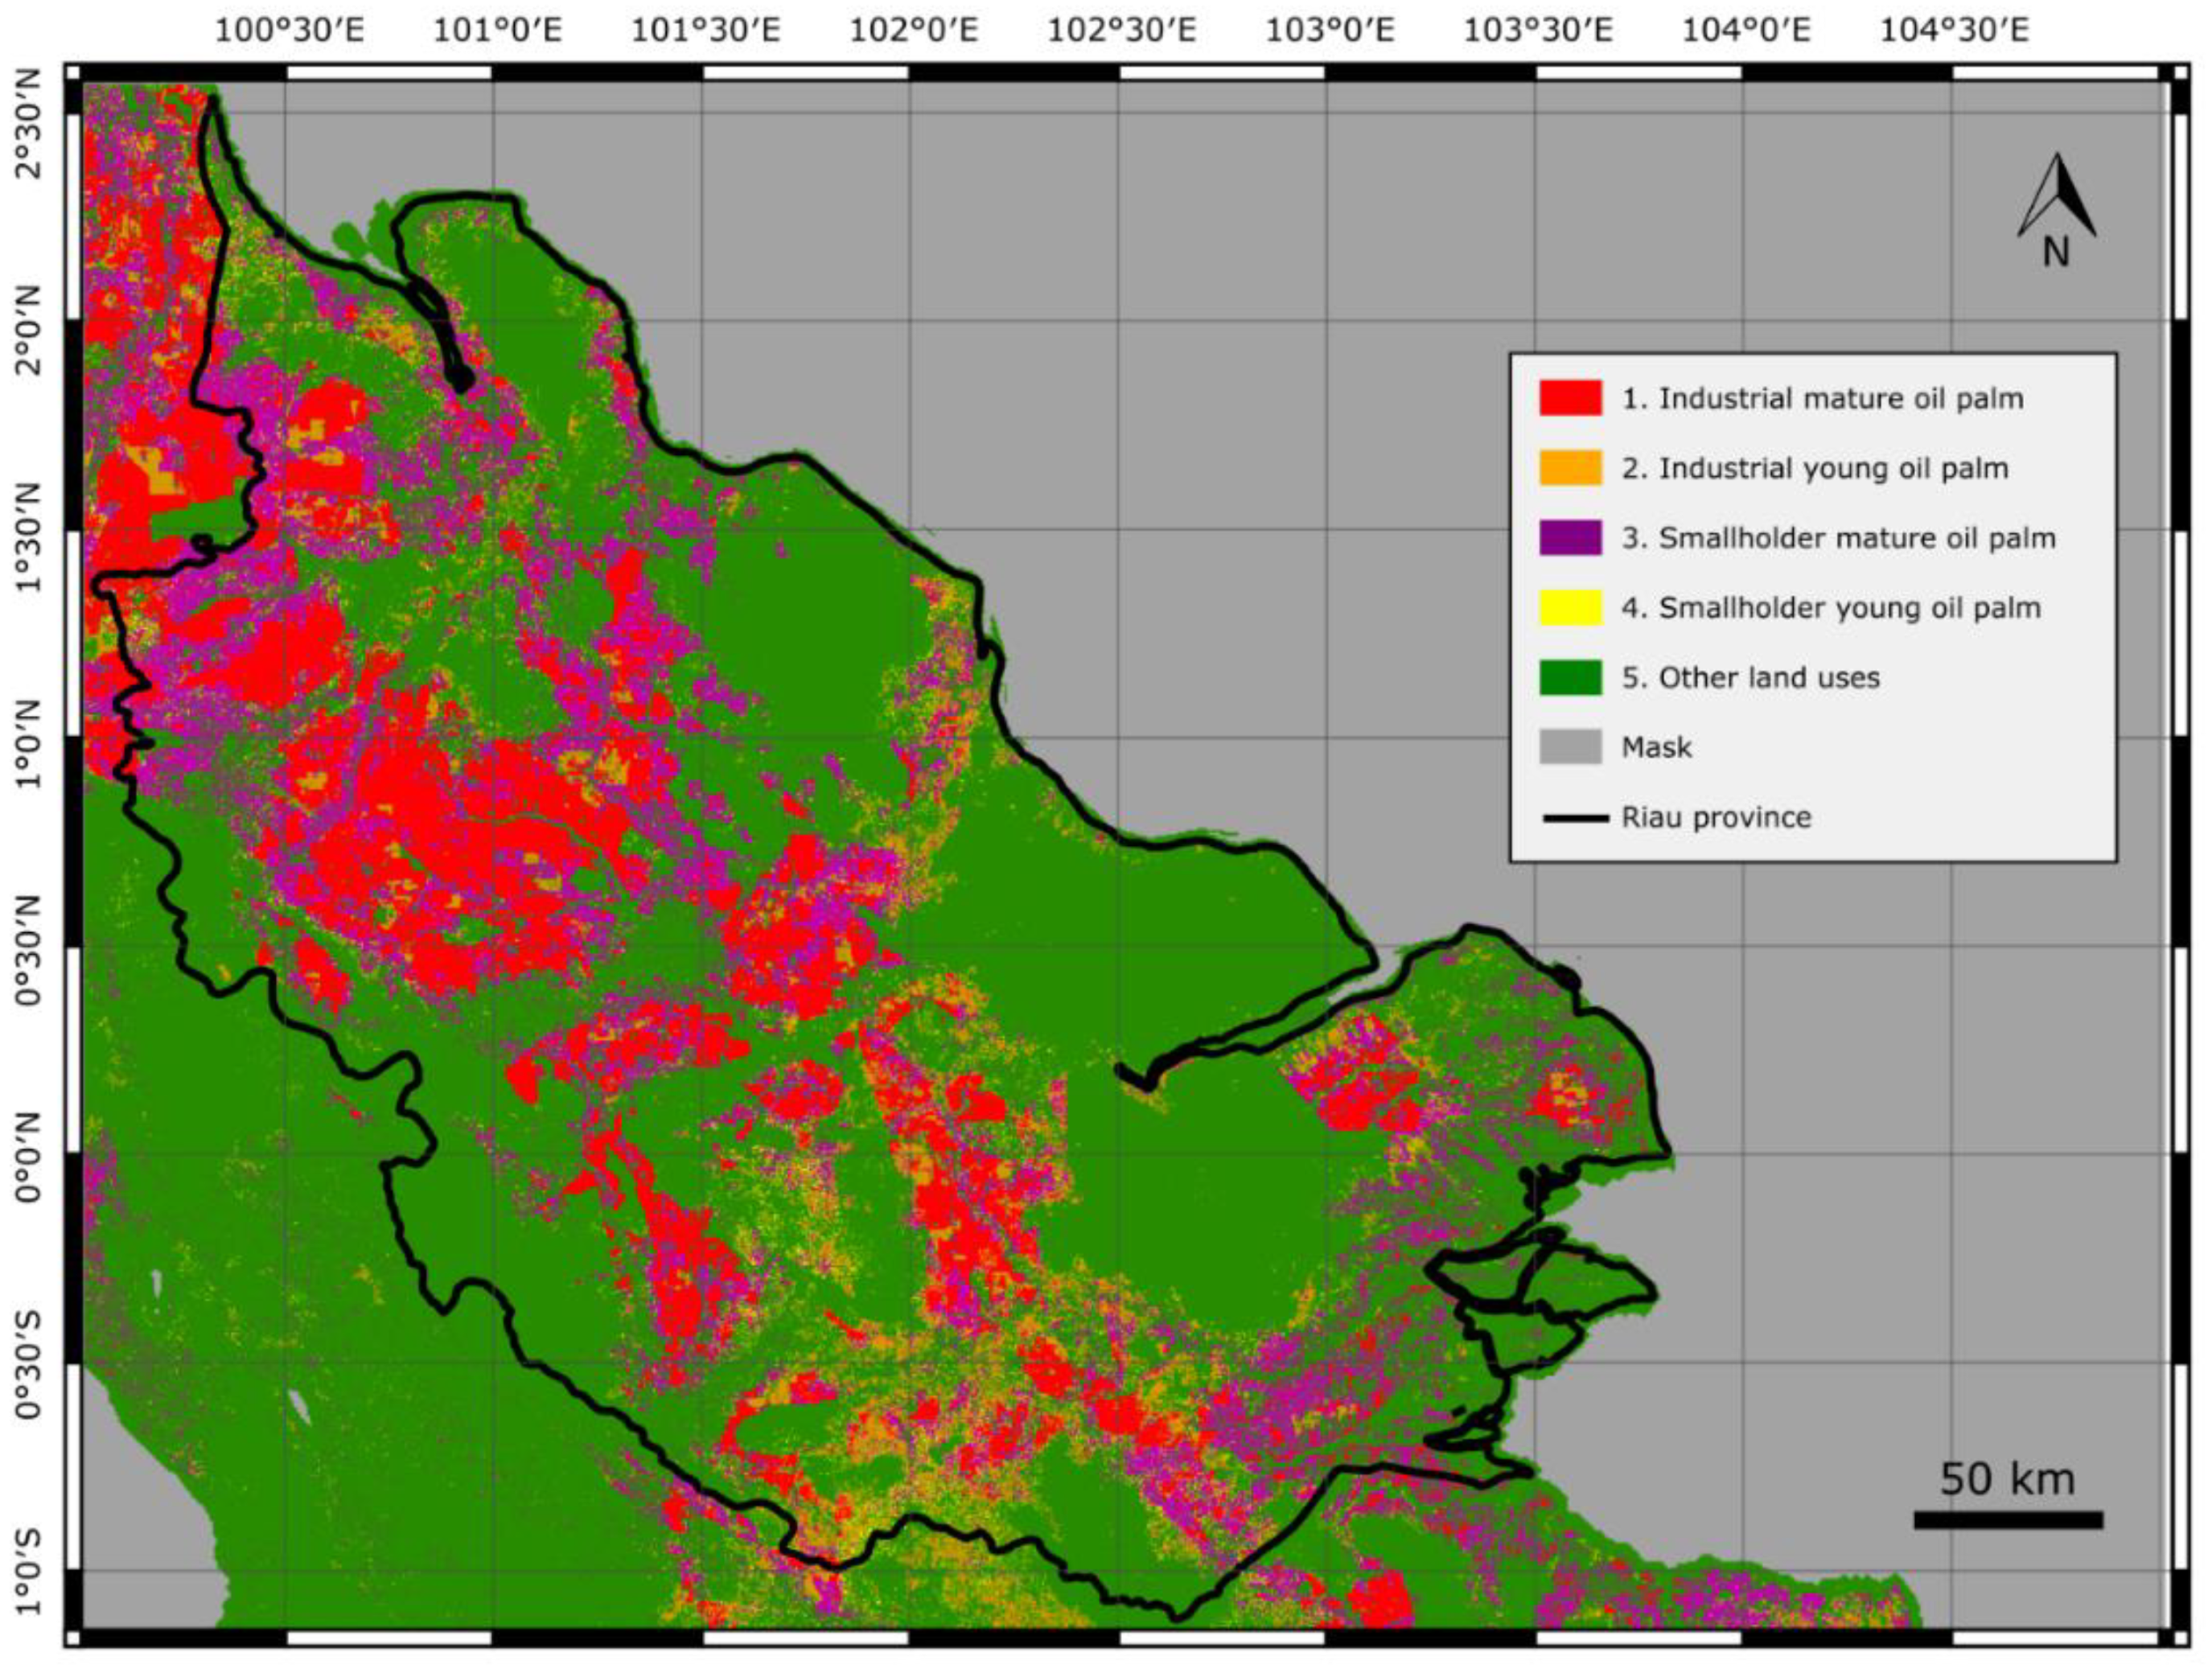
3. Results
4. Discussion
5. Conclusions
Author Contributions
Funding
Acknowledgments
Conflicts of Interest
References
- Susanti, A. Oil Palm Expansion in Indonesia: Serving People, Planet and Profit? Eburon Academic Publishers: Utrecht, The Netherlands, 2016. [Google Scholar]
- Austin, K.G.; Schwantes, A.; Gu, Y.; Kasibhatla, P.S. What causes deforestation in Indonesia? Environ. Res. Lett. 2019, 14, 024007. [Google Scholar] [CrossRef]
- Margono, B.A.; Potapov, P.V.; Turubanova, S.; Stolle, F.; Hansen, M.C. Primary forest cover loss in Indonesia over 2000–2012. Nat. Clim. Chang. 2014, 4, 730. [Google Scholar] [CrossRef]
- Abood, S.A.; Lee, J.S.H.; Burivalova, Z.; Garcia-Ulloa, J.; Koh, L.P. Relative contributions of the logging, fiber, oil palm, and mining industries to forest loss in Indonesia. Conserv. Lett. 2015, 8, 58–67. [Google Scholar] [CrossRef]
- Meijaard, E.; Garcia-Ulloa, J.; Sheil, D.; Wich, S.; Carlson, K.; Juffe-Bignoli, D.; Brooks, T. Oil Palm and Biodiversity: A Situation Analysis by the IUCN Oil Palm Task Force; International Union for Conservation of Nature and Natural Resources (IUCN): Gland, Switzerland, 2018. [Google Scholar]
- Mosnier, A.; Boere, E.; Reumann, A.; Yowargana, P.; Pirker, J.; Havlík, P.; Pacheco, P. Palm Oil and Likely Futures: Assessing the Potential Impacts of Zero Deforestation Commitments and a Moratorium on Large-Scale Oil Palm Plantations in Indonesia; CIFOR: Bogor, Indonesia, 2017; Volume 177. [Google Scholar]
- Austin, K.; Mosnier, A.; Pirker, J.; McCallum, I.; Fritz, S.; Kasibhatla, P. Shifting patterns of oil palm driven deforestation in Indonesia and implications for zero-deforestation commitments. Land Use Policy 2017, 69, 41–48. [Google Scholar] [CrossRef]
- Miettinen, J.; Liew, S.C. Separability of insular Southeast Asian woody plantation species in the 50 m resolution ALOS PALSAR mosaic product. Remote Sens. Lett. 2011, 2, 299–307. [Google Scholar] [CrossRef]
- Lee, J.S.H.; Wich, S.; Widayati, A.; Koh, L.P. Detecting industrial oil palm plantations on Landsat images with Google Earth Engine. Remote Sens. Appl. Soc. Environ. 2016, 4, 219–224. [Google Scholar] [CrossRef]
- Nomura, K.; Mitchard, E.T.; Patenaude, G.; Bastide, J.; Oswald, P.; Nwe, T. Oil palm concessions in southern Myanmar consist mostly of unconverted forest. Sci. Rep. 2019, 9, 1–9. [Google Scholar] [CrossRef]
- Oon, A.; Ngo, K.D.; Azhar, R.; Ashton-Butt, A.; Lechner, A.M.; Azhar, B. Assessment of ALOS-2 PALSAR-2L-band and Sentinel-1 C-band SAR backscatter for discriminating between large-scale oil palm plantations and smallholdings on tropical peatlands. Remote Sens. Appl. Soc. Environ. 2019, 13, 183–190. [Google Scholar] [CrossRef]
- Koh, L.P.; Miettinen, J.; Liew, S.C.; Ghazoul, J. Remotely sensed evidence of tropical peatland conversion to oil palm. PNAS 2011, 108, 5127–5132. [Google Scholar] [CrossRef]
- Szantoi, Z.; Smith, S.E.; Strona, G.; Koh, L.P.; Wich, S.A. Mapping orangutan habitat and agricultural areas using Landsat OLI imagery augmented with unmanned aircraft system aerial photography. Int. J. Remote Sens. 2017, 38, 2231–2245. [Google Scholar] [CrossRef]
- Gorelick, N.; Hancher, M.; Dixon, M.; Ilyushchenko, S.; Thau, D.; Moore, R. Google Earth Engine: Planetary-scale geospatial analysis for everyone. Remote Sens. Environ. 2017, 202, 18–27. [Google Scholar] [CrossRef]
- Meijaard, E.; Sheil, D. The Moral Minefield of Ethical Oil Palm and Sustainable Development. Front. For. Glob. Chang. 2019, 2. [Google Scholar] [CrossRef]
- Chastain, R.; Housman, I.; Goldstein, J.; Finco, M. Empirical cross sensor comparison of Sentinel-2A and 2B MSI, Landsat-8 OLI, and Landsat-7 ETM+ top of atmosphere spectral characteristics over the conterminous United States. Remote Sens. Environ. 2019, 221, 274–285. [Google Scholar] [CrossRef]
- Haralick, R.M.; Shanmugam, K.; Dinstein, I.H. Textural features for image classification. IEEE Trans. Syst. Man Cybern. 1973, 610–621. [Google Scholar] [CrossRef]
- Conners, R.W.; Trivedi, M.M.; Harlow, C.A. Segmentation of a high-resolution urban scene using texture operators. Comput. Vision Graph. Image Process. 1984, 25, 273–310. [Google Scholar] [CrossRef]
- Langley, P.; Sage, S. Induction of selective Bayesian classifiers. In Uncertainty Proceedings 1994; Elsevier: Amsterdam, The Netherlands, 1994; pp. 399–406. [Google Scholar]
- Breiman, L. Some properties of splitting criteria. Mach. Learn. 1996, 24, 41–47. [Google Scholar] [CrossRef]
- Louppe, G.; Wehenkel, L.; Sutera, A.; Geurts, P. Understanding variable importances in forests of randomized trees. In Proceedings of the Advances in Neural Information Processing Systems, Lake Tahoe, NV, USA, 5–10 December 2013; pp. 431–439. [Google Scholar]
- Breiman, L.; Friedman, J.; Olshen, R.; Stone, C. Classification and Regression Trees; Chapman and Hall: Wadsworth, NY, USA, 1984. [Google Scholar]
- Hastie, T.; Tibshirani, R.; Friedman, J.; Franklin, J. The elements of statistical learning: Data mining, inference and prediction. Math. Intell. 2005, 27, 83–85. [Google Scholar]
- Dietterich, T.G. Approximate statistical tests for comparing supervised classification learning algorithms. Neural Comput. 1998, 10, 1895–1923. [Google Scholar] [CrossRef]
- GitHub Repository. Available online: https://github.com/adriadescals/oil_palm_riau (accessed on 25 October 2019).
- Miettinen, J.; Shi, C.; Liew, S.C. Land cover distribution in the peatlands of Peninsular Malaysia, Sumatra and Borneo in 2015 with changes since 1990. Glob. Ecol. Conserv. 2016, 6, 67–78. [Google Scholar] [CrossRef]
- Google Earth Engine Code. Available online: https://code.earthengine.google.com/70a61b2ea4d2e93562397f1acbe6b337 (accessed on 25 October 2019).
- Google Earth Engine Code. Available online: https://code.earthengine.google.com/9be26b9317e8d72eea6f7bcb42f2dc19 (accessed on 25 October 2019).
- Miettinen, J.; Gaveau, D.L.; Liew, S.C. Comparison of visual and automated oil palm mapping in Borneo. Int. J. Remote Sens. 2019, 40, 8174–8185. [Google Scholar] [CrossRef]
- Kussul, N.; Lavreniuk, M.; Skakun, S.; Shelestov, A. Deep learning classification of land cover and crop types using remote sensing data. IEEE Geosci. Remote Sens. Lett. 2017, 14, 778–782. [Google Scholar] [CrossRef]
- Padarian, J.; Minasny, B.; McBratney, A.B. Using deep learning for digital soil mapping. Soil 2019, 5, 79–89. [Google Scholar] [CrossRef]


| Operation | Abbreviation | Input Bands | Kernel Size (Pixels) | Ref. |
|---|---|---|---|---|
| Median | smooth | VH, VV, B2, B3, B4, B6, B7, B8, B8A, B11, B12, evi | 2, 5, and 10 | |
| GLCM asymmetry | asm | |||
| GLCM contrast | contrast | |||
| GLCM correlation | corr | |||
| GLCM variance | var | |||
| GLCM inv. dif. moment | idm | |||
| GLCM sum average | savg | |||
| GLCM sum variance | svar | VV_smooth_ksize5, VH_smooth_ksize5 | 10 and 30 | [17] |
| GLCM sum entropy | sent | VV, B4, B7, B8, B11, evi | ||
| GLCM entropy | ent | |||
| GLCM difference variance | dvar | |||
| GLCM difference entropy | dent | |||
| GLCM correlation 1 | imcorr1 | |||
| GLCM correlation 2 | imcorr2 | |||
| GLCM max. correlation coef. | maxcorr | |||
| GLCM dissimilarity | diss | |||
| GLCM inertia | inertia | VV_smooth_ksize5, VH_smooth_ksize5 | 10 and 30 | [18] |
| GLCM cluster shade | shade | VV, B4, B7, B8, B11, evi | ||
| GLCM cluster prominence | prom |
| (a) Sentinel-1 | (b) Sentinel-2 | (c) Sentinel-1 & Sentinel-2 | (d) Sentinel-1 & Sentinel-2 | |||||
|---|---|---|---|---|---|---|---|---|
| (All Bands and Features) | (All Bands and Features) | (Selected Bands and Features) | (All Bands—without Features) | |||||
| Classification Setup | OA (%) | Kappa (%) | OA (%) | Kappa (%) | OA (%) | Kappa (%) | OA (%) | Kappa (%) |
| 5 classes 1 | 78.2 | 71.5 | 79.4 | 73.1 | 90.2 | 87.2 | 78.2 | 71.5 |
| 3 classes 2 | 82.6 | 73.4 | 81.6 | 71.5 | 92.6 | 88.6 | 80.2 | 69.7 |
| 2 classes 3 | 93.5 | 86.9 | 90.3 | 80.5 | 95.3 | 90.5 | 94.3 | 88.6 |
© 2019 by the authors. Licensee MDPI, Basel, Switzerland. This article is an open access article distributed under the terms and conditions of the Creative Commons Attribution (CC BY) license (http://creativecommons.org/licenses/by/4.0/).
Share and Cite
Descals, A.; Szantoi, Z.; Meijaard, E.; Sutikno, H.; Rindanata, G.; Wich, S. Oil Palm (Elaeis guineensis) Mapping with Details: Smallholder versus Industrial Plantations and their Extent in Riau, Sumatra. Remote Sens. 2019, 11, 2590. https://doi.org/10.3390/rs11212590
Descals A, Szantoi Z, Meijaard E, Sutikno H, Rindanata G, Wich S. Oil Palm (Elaeis guineensis) Mapping with Details: Smallholder versus Industrial Plantations and their Extent in Riau, Sumatra. Remote Sensing. 2019; 11(21):2590. https://doi.org/10.3390/rs11212590
Chicago/Turabian StyleDescals, Adrià, Zoltan Szantoi, Erik Meijaard, Harsono Sutikno, Guruh Rindanata, and Serge Wich. 2019. "Oil Palm (Elaeis guineensis) Mapping with Details: Smallholder versus Industrial Plantations and their Extent in Riau, Sumatra" Remote Sensing 11, no. 21: 2590. https://doi.org/10.3390/rs11212590
APA StyleDescals, A., Szantoi, Z., Meijaard, E., Sutikno, H., Rindanata, G., & Wich, S. (2019). Oil Palm (Elaeis guineensis) Mapping with Details: Smallholder versus Industrial Plantations and their Extent in Riau, Sumatra. Remote Sensing, 11(21), 2590. https://doi.org/10.3390/rs11212590