Article

Uncertainty Assessment in Multitemporal Land Use/Cover Mapping with Classification System Semantic Heterogeneity

1
Department of Land Survey and Geo-Informatics, The Hong Kong Polytechnic University, Hong Kong, China
2
Hubei Soil and Water Conservation Engineering Research Center, Hubei Water Resources Research Institute, Wuhan 430070, China
3
School of Computer Science and Engineering, Xi’An University of Technology, Xi’an 710048, China
*
Author to whom correspondence should be addressed.
Remote Sens. 2019, 11(21), 2509; https://doi.org/10.3390/rs11212509
Submission received: 24 September 2019 / Revised: 17 October 2019 / Accepted: 24 October 2019 / Published: 26 October 2019
(This article belongs to the Special Issue Multitemporal Land Cover and Land Use Mapping)

Abstract

:
Land use/cover (LUC) data are commonly relied on to provide land surface information in a variety of applications. However, the exchange and joint use of LUC information from different datasets can be challenging due to semantic differences between common classification systems (CSs). In this paper, we propose an uncertainty assessment schema to capture the semantic translation uncertainty between heterogeneous LUC CSs and evaluate the data label uncertainty of multitemporal LUC mapping results caused by uncertainty propagation. The semantic translation uncertainty between CSs is investigated using a dynamic semantic reference system (DSRS) model and semantic similarity analysis. An object-based unsupervised change detection algorithm is adopted to determine the probability of changes in land patches, and novel uncertainty metrics are proposed to estimate the patch label uncertainty in LUC maps. The proposed uncertainty assessment schema was validated via experiments on four LUC datasets, and the results confirmed that semantic uncertainty had great impact on data reliability and that the uncertainty metrics could be used in the development of uncertainty controls in multitemporal LUC mapping by referring to uncertainty assessment results. We anticipate our findings will be used to improve the applicability and interoperability of LUC data products.

Graphical Abstract

1. Introduction

Land use/cover (LUC) information derived from the vast amount of available remote sensing data is widely used when studying changes in atmospheric composition, sustainable urban development, and ecosystem modification [1,2,3]. LUC data can provide a thematic representation of a land surface that is spatially continuous and highly consistent across a range of spatial and temporal scales [4]. However, the amount of uncertainty in existing LUC mapping information significantly impairs the reliability of classification products [5]. Researchers developing methods of measuring the uncertainty in LUC data focused on quantifying the uncertainty in remote sensing images, determining the classification uncertainty, and assessing the accuracy of LUC products [6,7,8,9,10,11,12]. For example, Griffith and Chun [7] studied the uncertainty in spatial autocorrelation parameters in a spatial autoregressive model associated with remotely sensed images. Zhang and Zhang [8] proposed a quantitative descriptor that considered the spatial distribution and semantic uncertainty when investigating the inherent uncertainty in remote sensing images caused by object boundaries and high intra-class differences. Comber, Fisher, Brunsdon, and Khmag [9] used a geographically weighted approach to model spatial variations in the classification accuracy of land cover data. Löw, Knöfel, and Conrad [10] investigated the classification uncertainty of remotely sensed data using alpha-quadratic entropy based on per-object class membership estimations obtained via a support vector machine algorithm, whereas the researchers in Reference [11] detailed good practice recommendations for sampling, response, and analysis to facilitate the accurate assessment of land change maps. Shi, Zhang, Hao, Shao, Cai, and Lyu [12] analyzed reliability propagation in the data production process and proposed a validation schema to evaluate the reliability of land cover products based on seven reliability indicators derived from reliability and consistency measurements.
Currently available LUC data are typically provided by national, regional, or global land inventory projects to support the interests of specific communities and different initiatives. However, LUC datasets are often incompatible as they employ different classification schemes in the conversion of satellite images to thematic maps, which is problematic for potential users.
Land inventory projects require an LUC classification system (CS) that defines the standards used for data acquisition, interchange, and sharing along with descriptions of the systematic frameworks, class names, criteria used to discriminate them, and relationships between classes [13]. Some well-known LUC datasets include the global land cover map (GlobCover 2009) [14], the coordination of information on the environment (CORINE) land cover data of the European Union [15], the International Geosphere Biosphere Program (IGBP) land classification data [16], the 30-m-resolution global land cover dataset (GlobeLand30) [17], and the national-scale LUC datasets developed by various governmental agencies and institutions, such as the National Land Cover Database (NLCD) in the United States (US) [18] and the National Land Survey (NLS) database in China [13]. However, despite the wide availability of LUC information, both data producers and users continue to be hampered by data interoperability and exchange problems between heterogeneous datasets due to differences in the classification schemas and class definitions, and such incompatibilities limit the scope of available applications that employ LUC data [19].
To address these challenges, an international joint initiative was launched in 2006 to work toward the harmonization and validation of existing and future land cover datasets [20]. One potential solution to increase the interoperability of various CSs is to develop methods to translate classes between datasets [21,22,23], and this is an area of increasing international focus for those maintaining and developing existing regional and global CSs.
Semantic translation methodologies can be divided into two groups: conventional class by class comparison approaches and semantic analysis based on sets of attributes [24]. In terms of global land cover products, the Land Cover Classification System (LCCS) and the IGBP classification schema are commonly used as links in the conversion between other classification systems to facilitate comparative analysis [24,25,26]. For example, LCCS-based legend translation protocols were leveraged in an effort to provide a generalized categorization of land cover classes on a global scale in which input classes were harmonized into 13 general classes [14,22]. In a comparison of land cover maps in northern Eurasia, a generalized legend was developed based on six dominant life form types (LFT) to serve as a common denominator [27]. Information semantics and tools for the integration of heterogeneous ontologies were applied to model the semantic relationship between LUC CSs [13,28], and ontology-based semantic similarity measures were used to characterize similarities between different LUC classes [29,30].
Semantic similarity measures can be categorized into edge-counting, information content-based, and feature-based measures [31], and feature-based semantic measures were shown to provide better performance than other methods when characterizing semantic similarities in geographic object-based image classification applications [29]. A weighted feature-based approach was employed to compute semantic similarities between categories in different LUC classification systems [32]. Ahlqvist [33] used fuzzy-set-based semantic similarity metrics to assess graded changes for heterogeneous land cover types in the 1992 and 2001 US National Land Cover Databases (NLCDs) and obtained reliable post-classification change detection results. Xu [34] systematically and quantitatively assessed the semantic uncertainty of classes in classification systems with a common foundation in terms of the semantic overlap, semantic gap, semantic overflow, and so on. Pérez-Hoyos, García-Haro, and San-Miguel-Ayanz [24] adopted semantic overlap metrics based on fuzzy sets expressed in terms of nine relevant land attributes irrespective of class names when comparing global land cover maps prepared using different CSs with incompatible legend definitions.
However, translating the classification labels in datasets introduces a certain amount of uncertainty and classification errors that, in the worst case, manifest as land types being allocated to the wrong classes [19]. Some applications, such as multitemporal LUC mapping based on data with heterogeneous CSs, require the relationships between different systems to be explicitly correlated and analyzed. Also, semantic translation and LUC data processes are used to satisfy both the CS consistency and currency requirements when the land surface changes. Even so, these processes introduce semantic uncertainty, which then propagates into the multitemporal LUC mapping process and, ultimately, results in class label errors in the final map. However, little research was conducted to date to quantify the semantic translation uncertainty, to characterize the propagation of semantic uncertainty to data label uncertainty, and to determine their effects on LUC data reliability.
Motivated by the problems listed above, the focus of the current work is to assess the uncertainty in multitemporal LUC mapping caused by inconsistent CSs. To this end, we propose a novel uncertainty assessment schema to measure the semantic translation uncertainty between CSs and estimate the patch label uncertainty of the LUC map as the land surface changes via semantic analysis based on the ontology in combination with an object-based multitemporal change detection (CD) algorithm. The proposed assessment schema was experimentally validated using four LUC datasets with CS semantic heterogeneity and the corresponding multitemporal remote sensing images. To the best of our knowledge, this is the first study to focus on quantifying the semantic translation uncertainty and its propagation in the multitemporal LUC mapping process.
The rest of this paper is organized as follows: the study areas and datasets are presented in Section 2. Section 3 describes the uncertainty assessment schema and novel uncertainty metrics. After that, Section 4 describes the experimental results for the study areas. Then, the findings are discussed in Section 5. Finally, Section 6 draws the conclusions of this research.

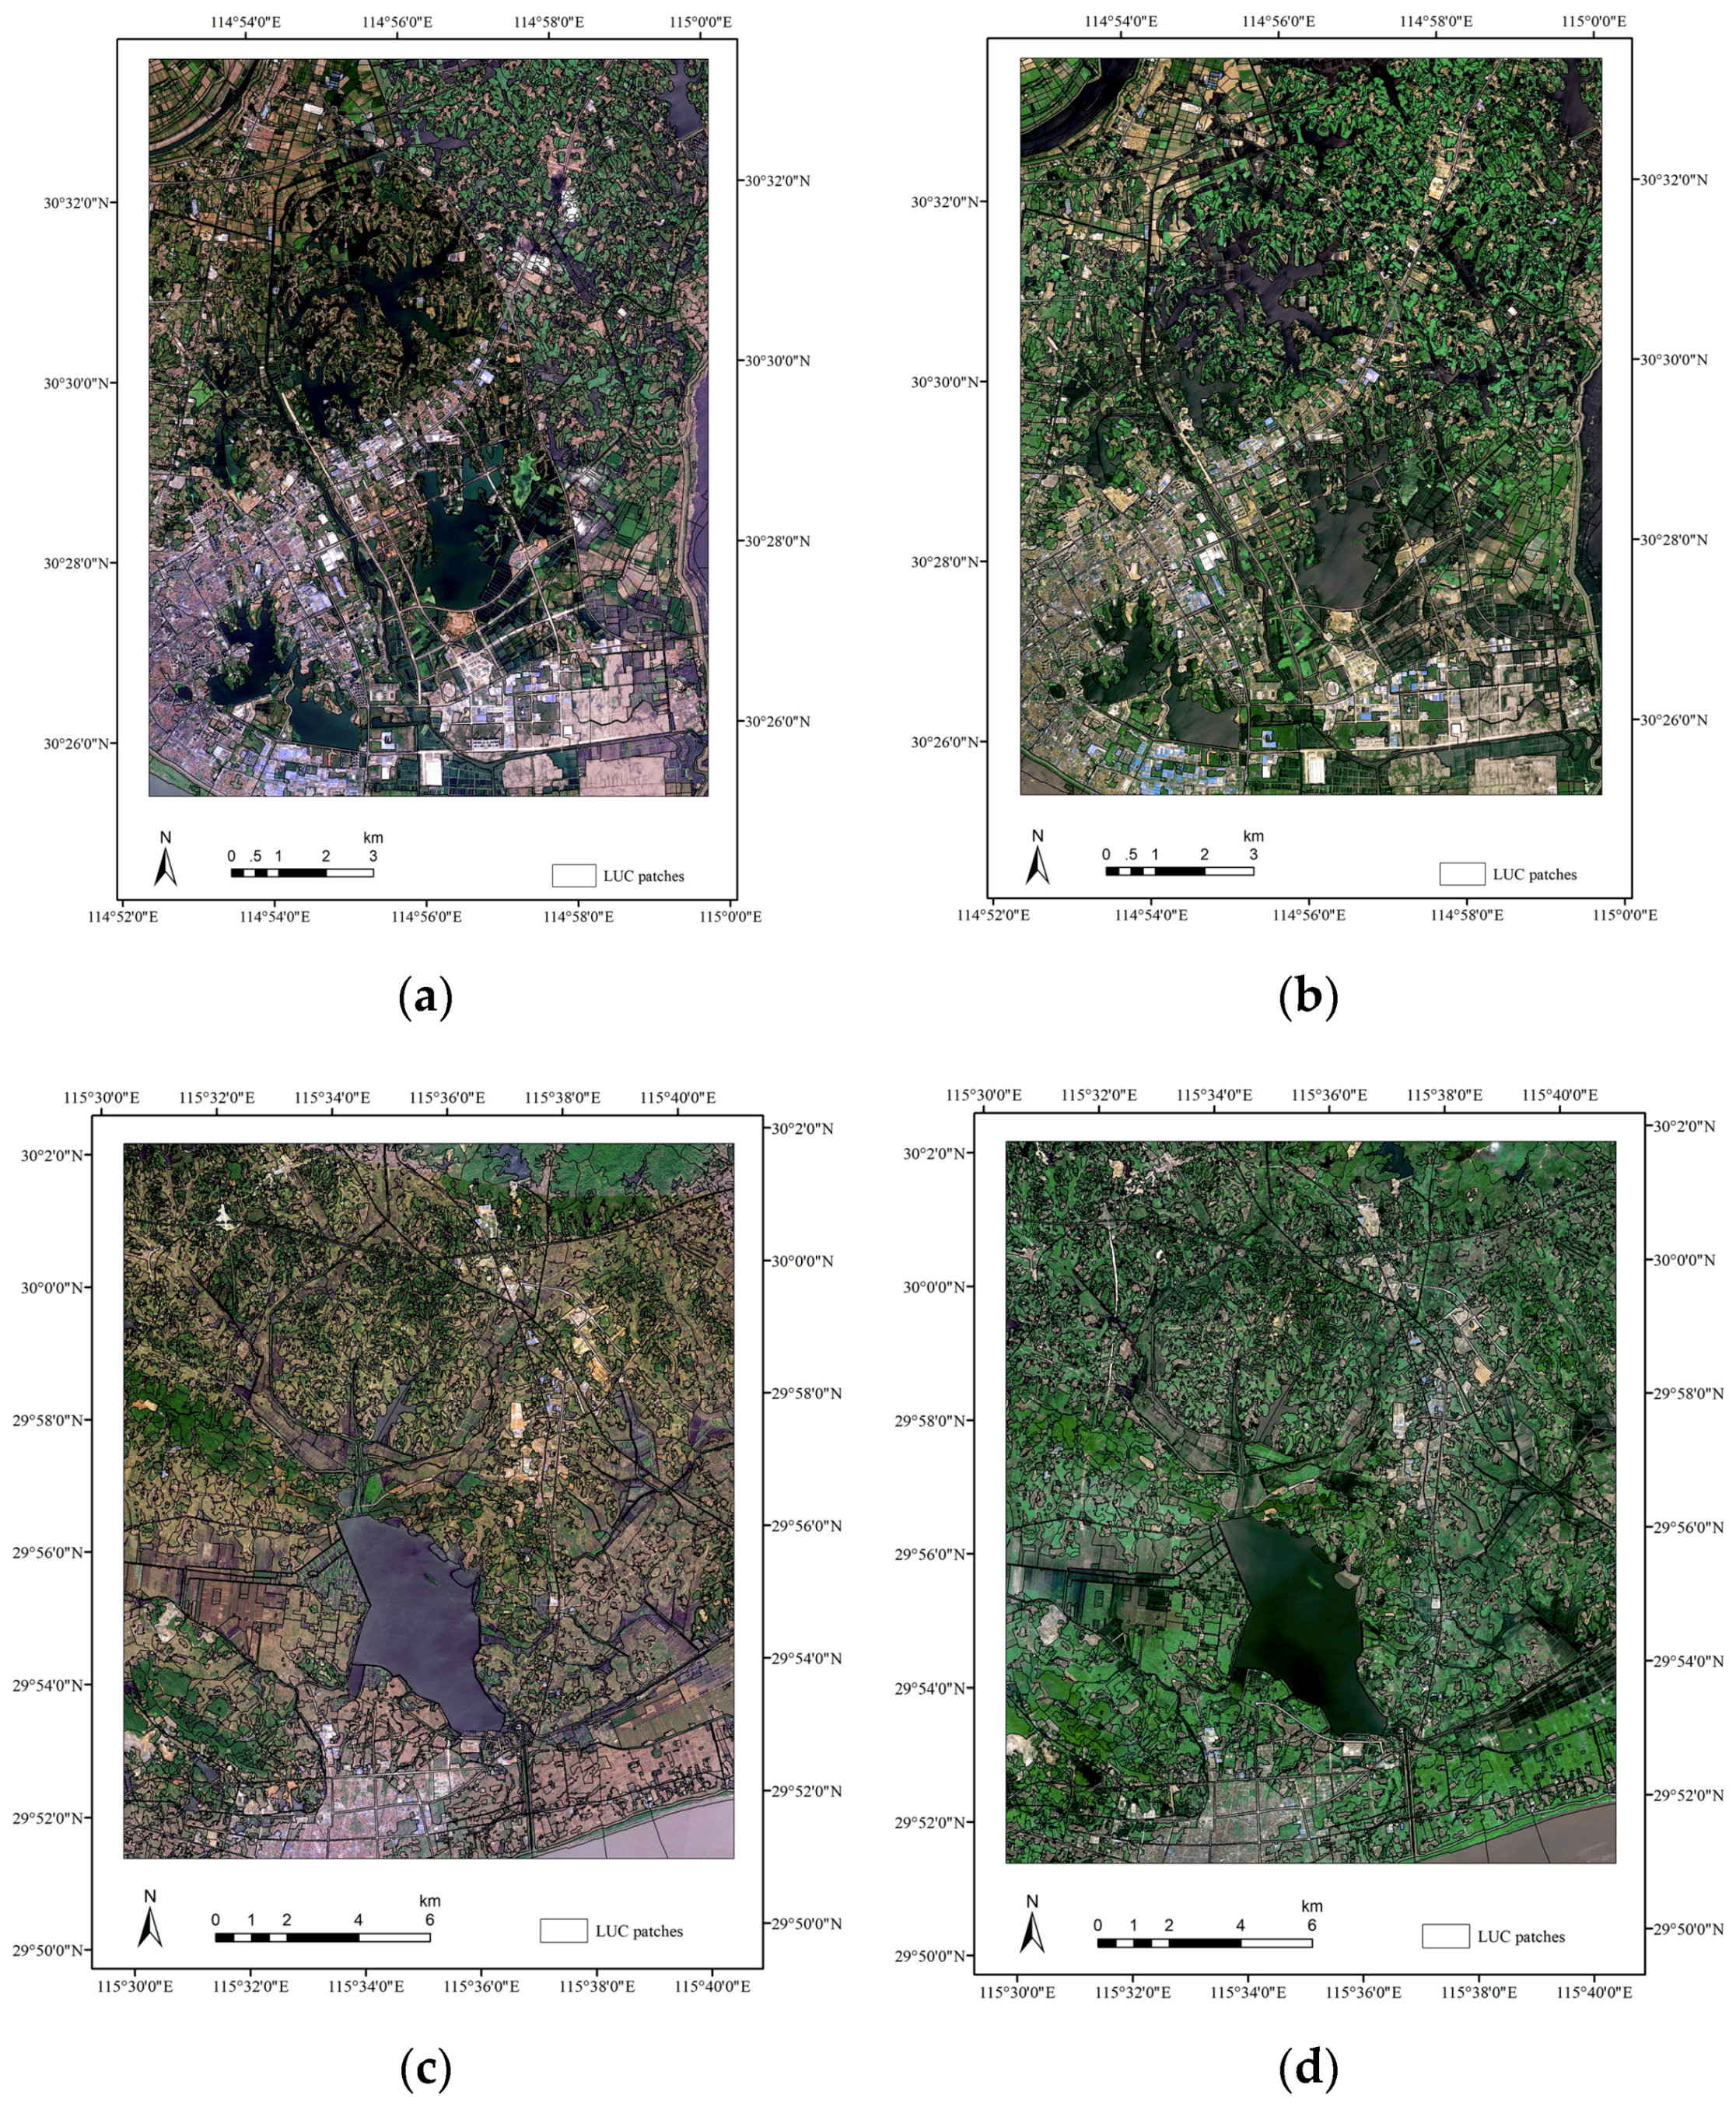
2. Study Areas and Datasets
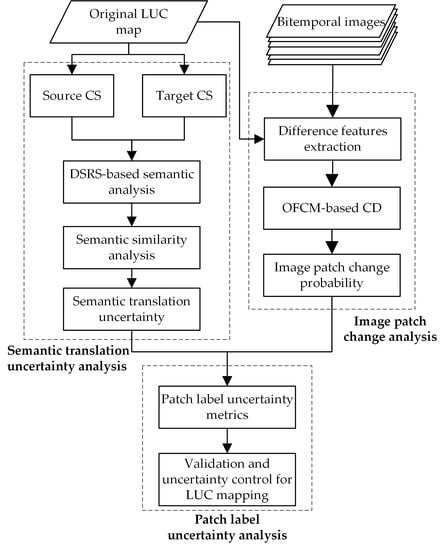
The first test site was located in Huanggang City, Hubei Province, China, and two LUC datasets, namely, Datasets 1 and 2, were selected for processing with the proposed assessment schema. Each dataset contained two LUC maps, one of which was obtained from the 2016 National Land Survey project (NLS) and the other from the 2018 Provincial Water and Soil Conservation Survey Project (PWSCS). The objective of the NLS project was to map the national LUC in China using remote sensing and geographic information system techniques, and the data were organized via a hierarchical CS with seven first-level classes and 29 second-level classes to guarantee a consistent product at the national scale. This structure is depicted in Figure 1a. In contrast, the PWSCS project employed NLS data as geographic base maps to conduct LUC mapping. Multitemporal remote sensing images of the test site were generated by a fusion of 14 map sheets of GF-1 and ZY-3 satellite images acquired on 1 October 2016 (T1) and 26 June 2018 (T2), at 2 m resolution. The total study area covered 1.75 × 10⁴ km2 from which an area of 5911 × 7572 pixels was cropped in Dataset 1, as displayed in Figure 2a,b. A section (8534 × 9992 pixels) of the entire scene was selected in Dataset 2, as shown in Figure 2c,d. The hierarchical CS in the PWSCS project included nine first-level classes and 17 second-level classes in which the definitions of some of the classes differed from those in the NLS project. This structure is shown in Figure 1b.
Two additional datasets, namely, Datasets 3 and 4, were also used, which contained LUC maps generated by the Corine Land Cover (CLC) 2000 project and the updated LUC maps with the Globeland30 CS in 2018 in Europe. The CLC project applied a regional approach to monitor the 30 countries of the European Union based on Landsat images in conjunction with ancillary data. The CS in this project incorporated a three-level hierarchical nomenclature composed of five first-level, 15 second-level, and 44 third-level classes [35], as shown in Figure 1c. The GlobeLand30 project was launched by the National Geomatics Center of China in 2010 and employed a classification schema consisting of 10 first-level classes with the objective of producing a 30-m-resolution global land cover data product [36]. The hierarchical structure of the GlobeLand30 CS is shown in Figure 1d. The simulation experiment conducted in this study involved LUC mapping based on the CLC data to produce an updated LUC map compatible with the GlobeLand30 CS. The primary data sources used for multitemporal LUC mapping in the experiments were a set of multitemporal satellite images that included 30-m Landsat7 Enhanced Thematic Mapper Plus (ETM+) multispectral images captured on 30 August 2000 (T1) and 30-m Landsat8 OLI multispectral images obtained on 9 August 2018 (T2). A section (2937 × 3233 pixels) of the entire image was cropped in Datasets 3 and 4, as displayed in Figure 2e–h.

3. Methodology

The general framework of the proposed uncertainty assessment schema is depicted in Figure 3. The schema was separated into three main phases: (1) semantic translation uncertainty analysis, (2) image patch change analysis, and (3) patch label uncertainty analysis. In the first phase, a dynamic semantic reference system (DSRS) was introduced to represent and integrate the semantic features of source CS and target CS on a common foundation. Then, a semantic translation uncertainty analysis was conducted using ontology-based semantic similarity measurements. After that, the initial semantic translation uncertainty of each patch could be obtained. In the second phase, a multi-temporal remote sensing image CD method—based on an object-based fuzzy C-means (OFCM) algorithm and difference features extraction—was applied to calculate the corresponding image patch change probability. In the third phase, novel uncertainty metrics were proposed to quantitatively measure patch label uncertainty in the LUC map on the basis of semantic translation uncertainty and image patch change probability. Then, results were validated using statistics and reliability evaluation. Finally, uncertainty control could be developed based on patch label uncertainty to improve LUC mapping accuracy.

3.1. Premise and Assumptions

In this study, multitemporal LUC mapping was conducted via semantic translation from the source system to the target system to increase data acquisition efficiency. Then, LUC data were updated with reference to the corresponding multitemporal remote sensing images to satisfy the currency requirements of LUC mapping. In practice, semantic translation between classes is conducted based on expert knowledge, and visual interpretation is employed to update the LUC map, since automatic change detection and classification methods are limited by large number of parameters requiring adjustment and the low accuracy of large-area mapping algorithms [37].
To estimate the LUC patch label uncertainty without ground reference data, the uncertainty assessment and validation procedure in the proposed method were based on the following two assumptions:
  • The impact of human factors, precision of the basic maps, and classification accuracy of updated patches were not considered in this study because there is a large amount of uncertainty in multitemporal LUC mapping and the focus of this research was on the semantic uncertainty between heterogeneous systems and the corresponding effect on the reliability of LUC data.
  • We regarded the semantic translation types and image change magnitudes as the main factors affecting patch label uncertainty to model the semantic translation uncertainty and its propagation. This was because, on the one hand, a single class in the source system can be converted into one or more classes in the target system, which causes the semantic feature consistency of class pairs to be different. On the other hand, image patches with larger change magnitudes are more likely to be detected and updated.

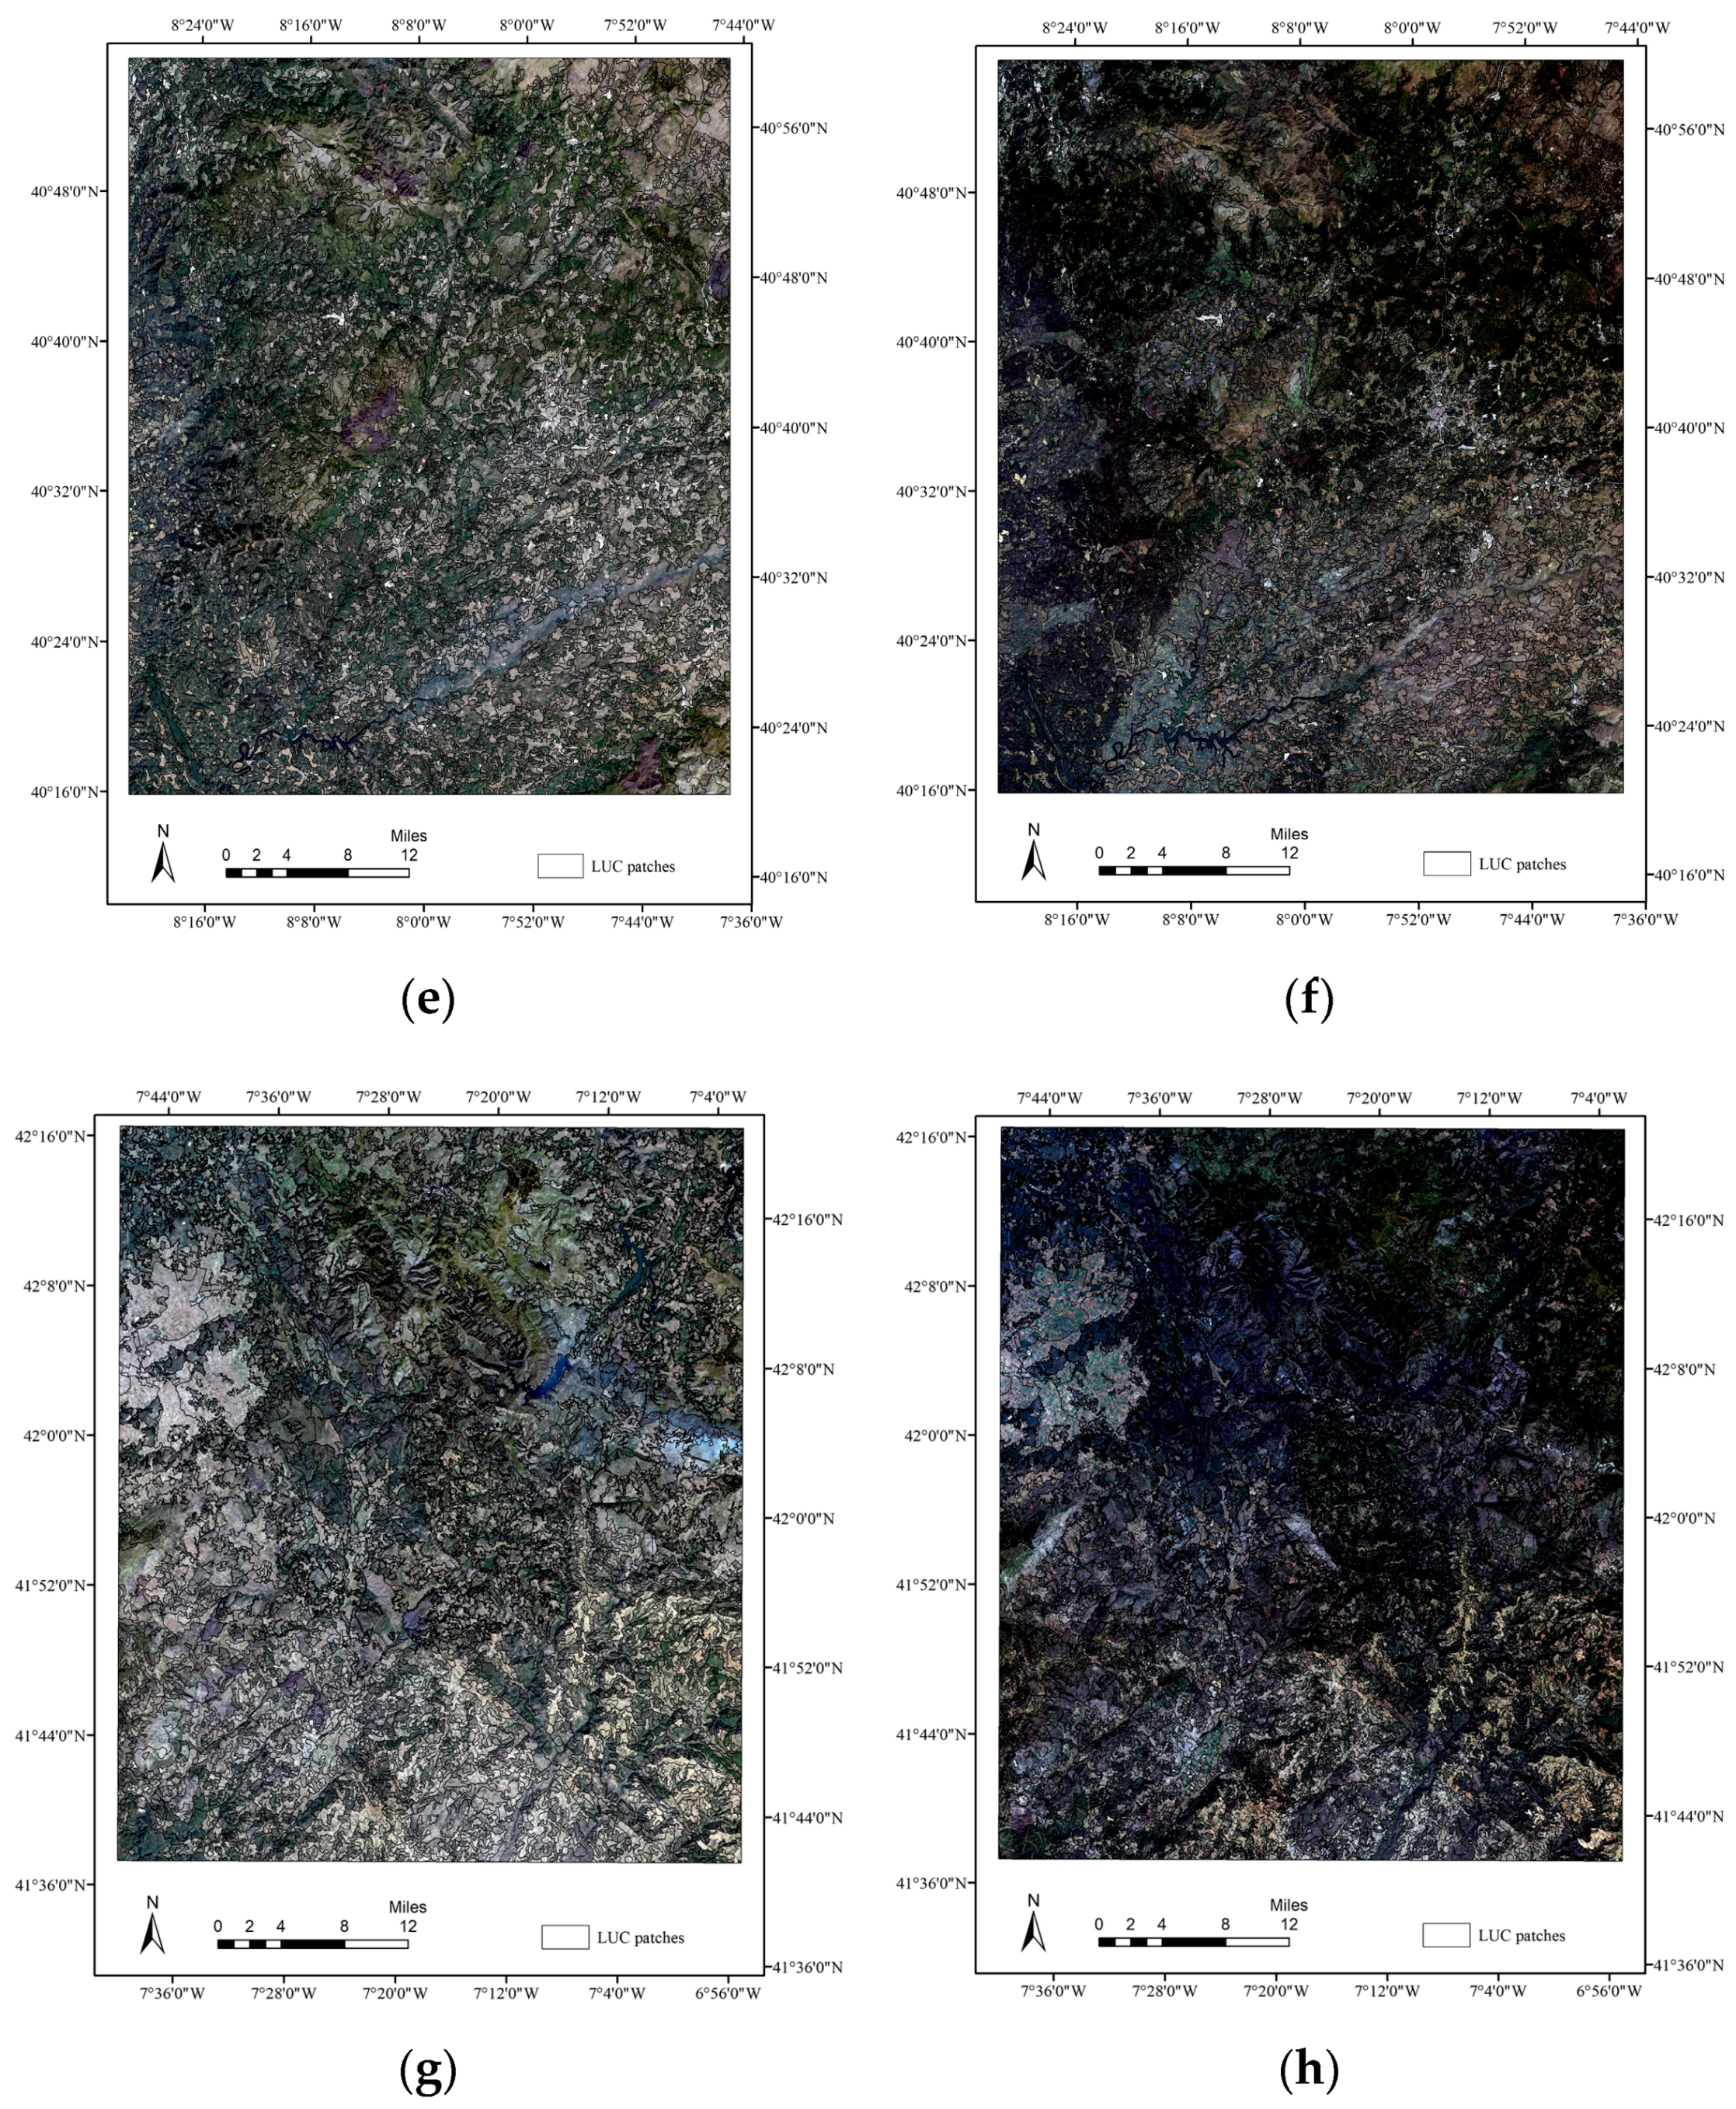
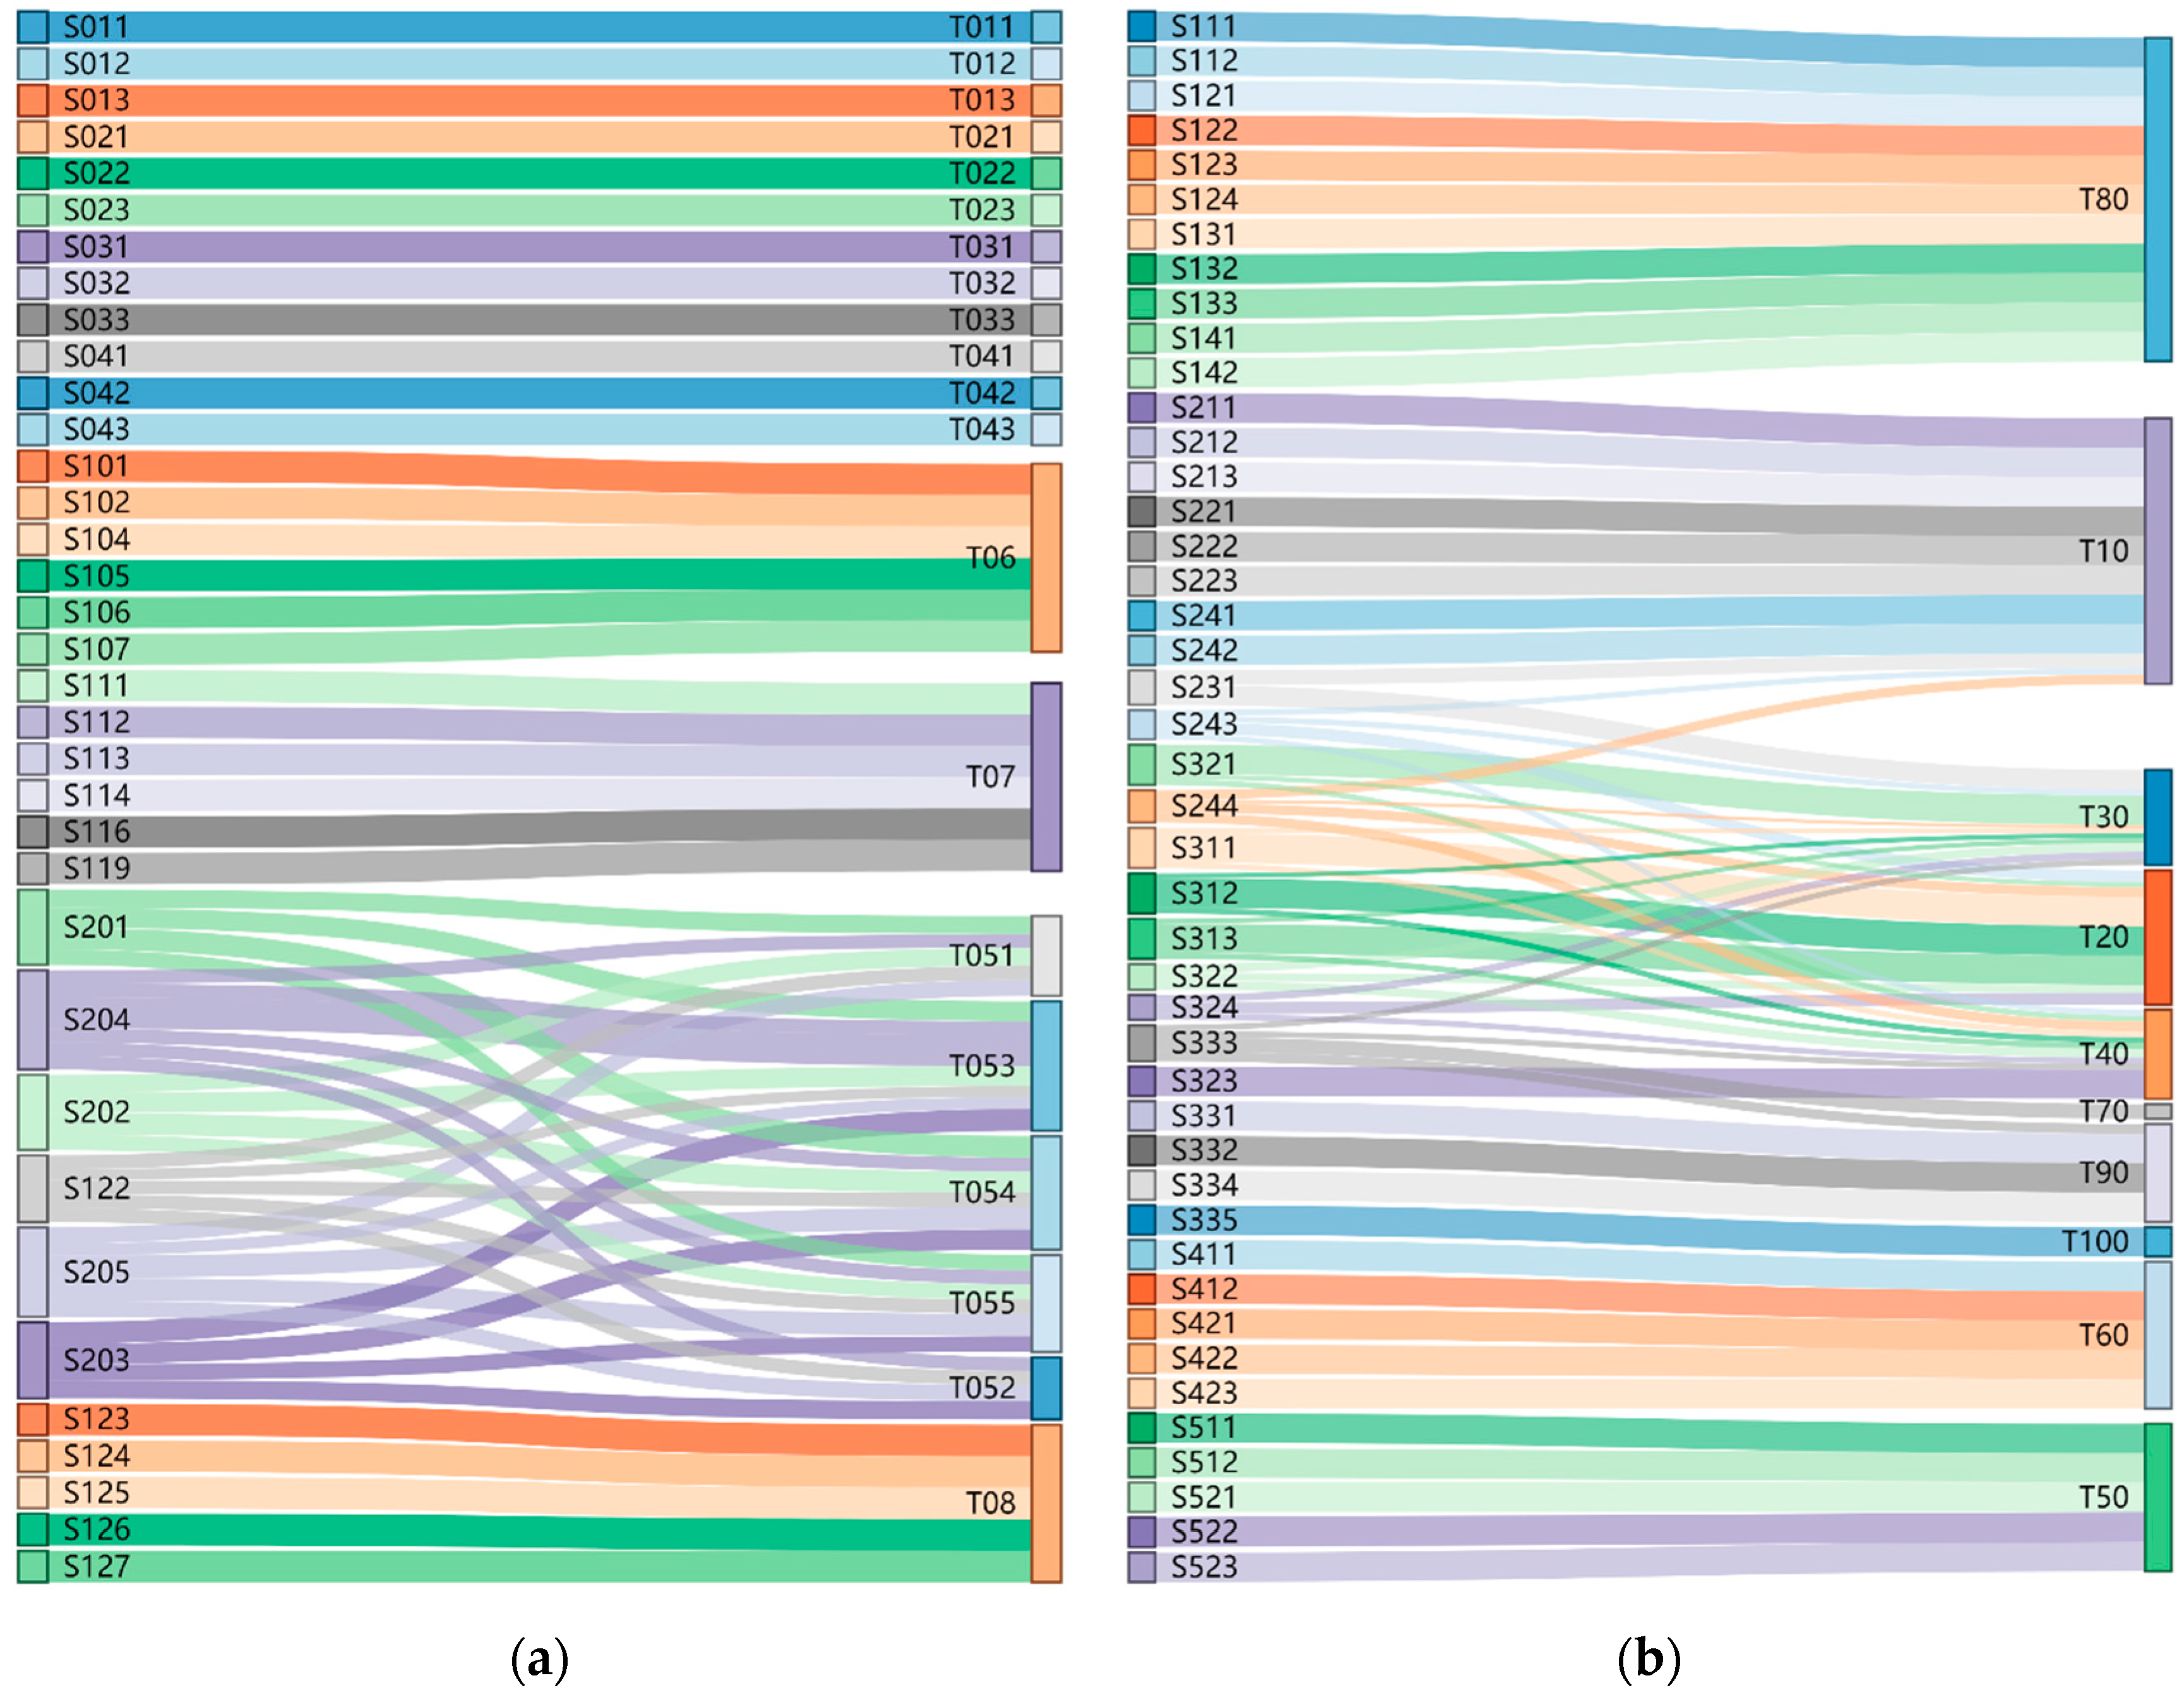
3.2. Semantic Translation Uncertainty Analysis between CSs

In this study, the DSRS model was employed to integrate the semantic features of two CSs as the basis of quantifying semantic information as opposed to directly comparing two semantic schemas, because the DSRS model was demonstrated to be theoretically and practically feasible for representing semantic features on a common foundation [34]. A key advantage of this approach is that it constructs a concept tree model by integrating multiple class concepts and decomposing their definitions into different components in the new context by comparing the semantic features of the concepts. Each node in the tree is a semantic feature set, whereas the edges of the concept tree represent the properties that can be employed to discriminate the semantic feature sets. The DSRS is constructed using a bottom-up method in a step-by-step manner as per a model-construction algorithm. Finally, the semantic information of the class is represented and distinguished by the collection of leaf nodes. Since the constructed DSRS is a concept tree model based on an ontology, graph theory and ontology-based methods can be used to conduct semantic analysis.
A tree model of the semantic features representation of an integrated system could be obtained via the DSRS model. Examples of vegetation classes are illustrated in Figure 4 in which P 1 , P 2 , , P 5 represent the properties employed to construct DSRS and L 1 , L 2 , , L 6 denote the leaf node set. The properties were extracted from the class definitions to distinguish the characteristics of concepts. For instance, P1 = {planted, natural}, P2 = {woody, herbaceous}, and P3 = {water-saturated, non-water-saturated} were extracted through comparing vegetation class definitions and splitting overlaps among properties based on the DSRS construction algorithm. For more details on DSRS, readers may refer to Reference [34].
All of the classes of two systems could then be represented by applying union operations to leaf nodes in the tree model. The proposed method included a feature-based semantic similarity measurement based on the Tversky index, which could be measured using the number of features that match between two classes [38] using Equation (1).
S T v e r s k y ( L 1 , L 2 ) = | A 1 A 2 | | A 1 A 2 | + α | A 1 \ A 2 | + β | A 2 \ A 1 | ,
where A1 and A2 are the sets of attributes of classes L1 and L2, respectively, | A 1 A 2 | is the total number of formal attributes shared by L1 and L2, and α and β are adjustment coefficients.
Then, the semantic similarity of the leaf nodes in the DSRS considering the semantic distance and local semantic density in the tree model could be computed using Equations (2) and (3).
S ( L A , L B ) = D ( L A B , L R o o t ) D ( L A B , L R o o t ) + α D ( L A , L A B ) + β D ( L B , L A B ) ,
w e A , B = { 1 , e U A U B 1 | p e | , e ( U A U B ) ( U B U A ) 0 , o t h e r w i s e ,
where S ( L A , L B ) is the similarity between leaf nodes L A and L B , D ( L A B , L R o o t ) represents the weighted distance between the nearest common parent node L A B and the root node L R o o t , and e is the edge in the tree model, whereas w e A , B represents the weights used when computing the similarity of L A and L B , | p e | denotes the local semantic density in the node connected with e, and U A and U B are the edge unions of L A and L B , respectively.
On the basis of the DSRS and the semantic similarities, the semantic translation probability of LUC classes could be established by considering the relationships between individual LUC classes and sets of attributes using Equation (4).
P ( C s , C t ) = i = 1 | C s | D M a x j = 1 | C t | D S ( L i , L j ) | C s | D ,
where P ( C s , C t ) represents the semantic translation probability between Class C s in the source system and Class C t in the target system, L i and L j are the ith and jth leaf nodes within C s and C t , respectively, | | D is the width of a class that returns the number of leaf nodes covered by the class, and S ( L i , L j ) represents the similarity between L i and L j , which can be computed as per Equation (2).
The initial semantic translation uncertainty could be computed using Equations (5) and (6).
E ( C s ) = i = 1 n P ( C s , C t i ) n o r m log P ( C s , C t i ) n o r m ,
P ( C s , C t i ) n o r m = P ( C s , C t i ) i = 1 n P ( C s , C t i ) ,
where E ( C s ) is the semantic translation uncertainty of Class C s in the source system based on information entropy [39], with the base of the logarithm as 2, n is the number of corresponding classes in the source system, C t i represents the ith class in the target system connected with C s , and P ( C s , C t i ) n o r m is the normalized semantic translation probability.

3.3. Image Patch Change Analysis

Semantic uncertainty arises whenever semantic translations are made between two CSs and propagates to the data update process. To address this, a multi-temporal remote sensing image change detection technique based on an OFCM algorithm was introduced to calculate image patch change probability as a weighting coefficient representing the land surface changes in uncertainty assessment metrics. Advantages of the OFCM algorithm are that it is robust in the presence of ambiguity between changed and unchanged classes and it does not require samples or a probability statistical model for the data distributions. It should be noted that the images in the datasets used in this study were all pre-processed, including co-registration and radiometric calibration. In the proposed method, difference features containing spectral and textural information were extracted from each patch, and then employed to highlight areas that changed between multispectral image patches [40,41,42].
1. Spectral Difference Feature
In the proposed approach, the spectral feature of a patch is the average pixel value within the patch in different bands of the image. The spectral difference between the corresponding patches at the same location in the multispectral image pair can be performed as follows:
Q k = 1 | | A k | | × B b = 1 B ( x , y ) R k ( I 1 b ( x , y ) I 2 b ( x , y ) ) 2 ,
where Q k is the spectral difference of the kth patch in region A k . | | A k | | denotes the number of pixels in the kth patch, B is the number of spectral bands, and I 1 b and I 2 b represent the magnitude of the original image I1 and I2 at the bth band, respectively.
2. Textural Difference Feature
Texture normally reflects the law of spatial distribution of spectral features within the image. The mean feature, derived from the gray-level cooccurrence matrix (GLCM) [43], is used to describe the textural difference of a patch between the bitemporal high-resolution images. It was considered in this study since the GLCM mean feature is the optimal textural feature for high-resolution change detection [40]. The textural difference F k can be described as follows:
F k b = G 2 , k b G 1 , k b ,
where G 1 , k b and G 2 , k b denote the kth patch of the GLCM features in the bth band at two single dates.
The OFCM algorithm was adopted to calculate the image patch change probability of each patch. It is an unsupervised method that attempts to partition a finite collection of data features into a set of fuzzy clusters by minimizing the following objective function [44,45]:
J ( U , V ) = j = 1 C k = 1 N u j k m d 2 ( x k , v j ) ,
where X = [ x 1 , x 2 , , x N ] is the difference features of patches to be grouped, and x k is the feature vector of the kth patch. U is the fuzzy partition matrix; therefore, u j k indicates the membership grade of x k in the jth cluster. C denotes the cluster number, and, for change detection problems, C = 2 . m represents the weighting exponent in each fuzzy membership, V is the set of the cluster center v j associated with the jth cluster, d 2 ( x k , v j ) = x k v j 2 is the squared distance between feature vector and the cluster, And V and U are iteratively updated to approach an optimum solution until convergence is reached. The updated formulation of the OFCM algorithm was given by Equations (10) and (11).
v j = k = 1 N u j k m x k k = 1 N u j k m ,
u j k = 1 i = 1 C ( d 2 ( x k , v j ) d 2 ( x k , v i ) ) 1 / ( m 1 ) .
Then, the computation of image patch change probability R k was performed using Equation (12).
R k = | | x k v c h a n g e d | | 2 j = 1 2 | | x k v j | | 2 .

3.4. Patch Label Uncertainty Assessment

The uncertainty in the LUC data can be determined via semantic translation uncertainty and image patch change analysis. The data label uncertainty measurement integrates the maximum of semantic translation probability P k ( C s , C t i ) between classes and the image patch change probability R k obtained from change detection as shown in Equations (13) and (14).
U n k = i = 1 n w k P k ( C s , C t i ) n o r m log P k ( C s , C t i ) n o r m ,
w k = exp ( R k m a x ( P k ( C s , C t i ) ) 2 ) ,
where U n k is the class label uncertainty of the kth patch, and w k is the adaptive weight coefficient used to model the effects of land surface changes and semantic changes of patch classes on semantic translation uncertainty. Patches with high Un values are more likely to report semantic translation errors than those with lower uncertainties. If the map does not need to be updated, the image change probability is neglected and Equation (13) can be rewritten as follows:
U n k 0 = i = 1 n exp ( m a x ( P k ( C s , C t i ) ) 2 ) P k ( C s , C t i ) n o r m log P k ( C s , C t i ) n o r m ,
where U n k 0 represents the patch label uncertainty in the LUC map after semantic translations.

4. Results

In the experiments, multitemporal images were well preprocessed through ENVI software, including co-registration and radiometric calibration. The CD and semantic uncertainty analysis were implemented in MATLAB R2016a on a workstation with an Intel(R) Core (TM) i7-7700 central processing unit (CPU) @ 3.60 GHz, with 32.0 GB of random-access memory (RAM).

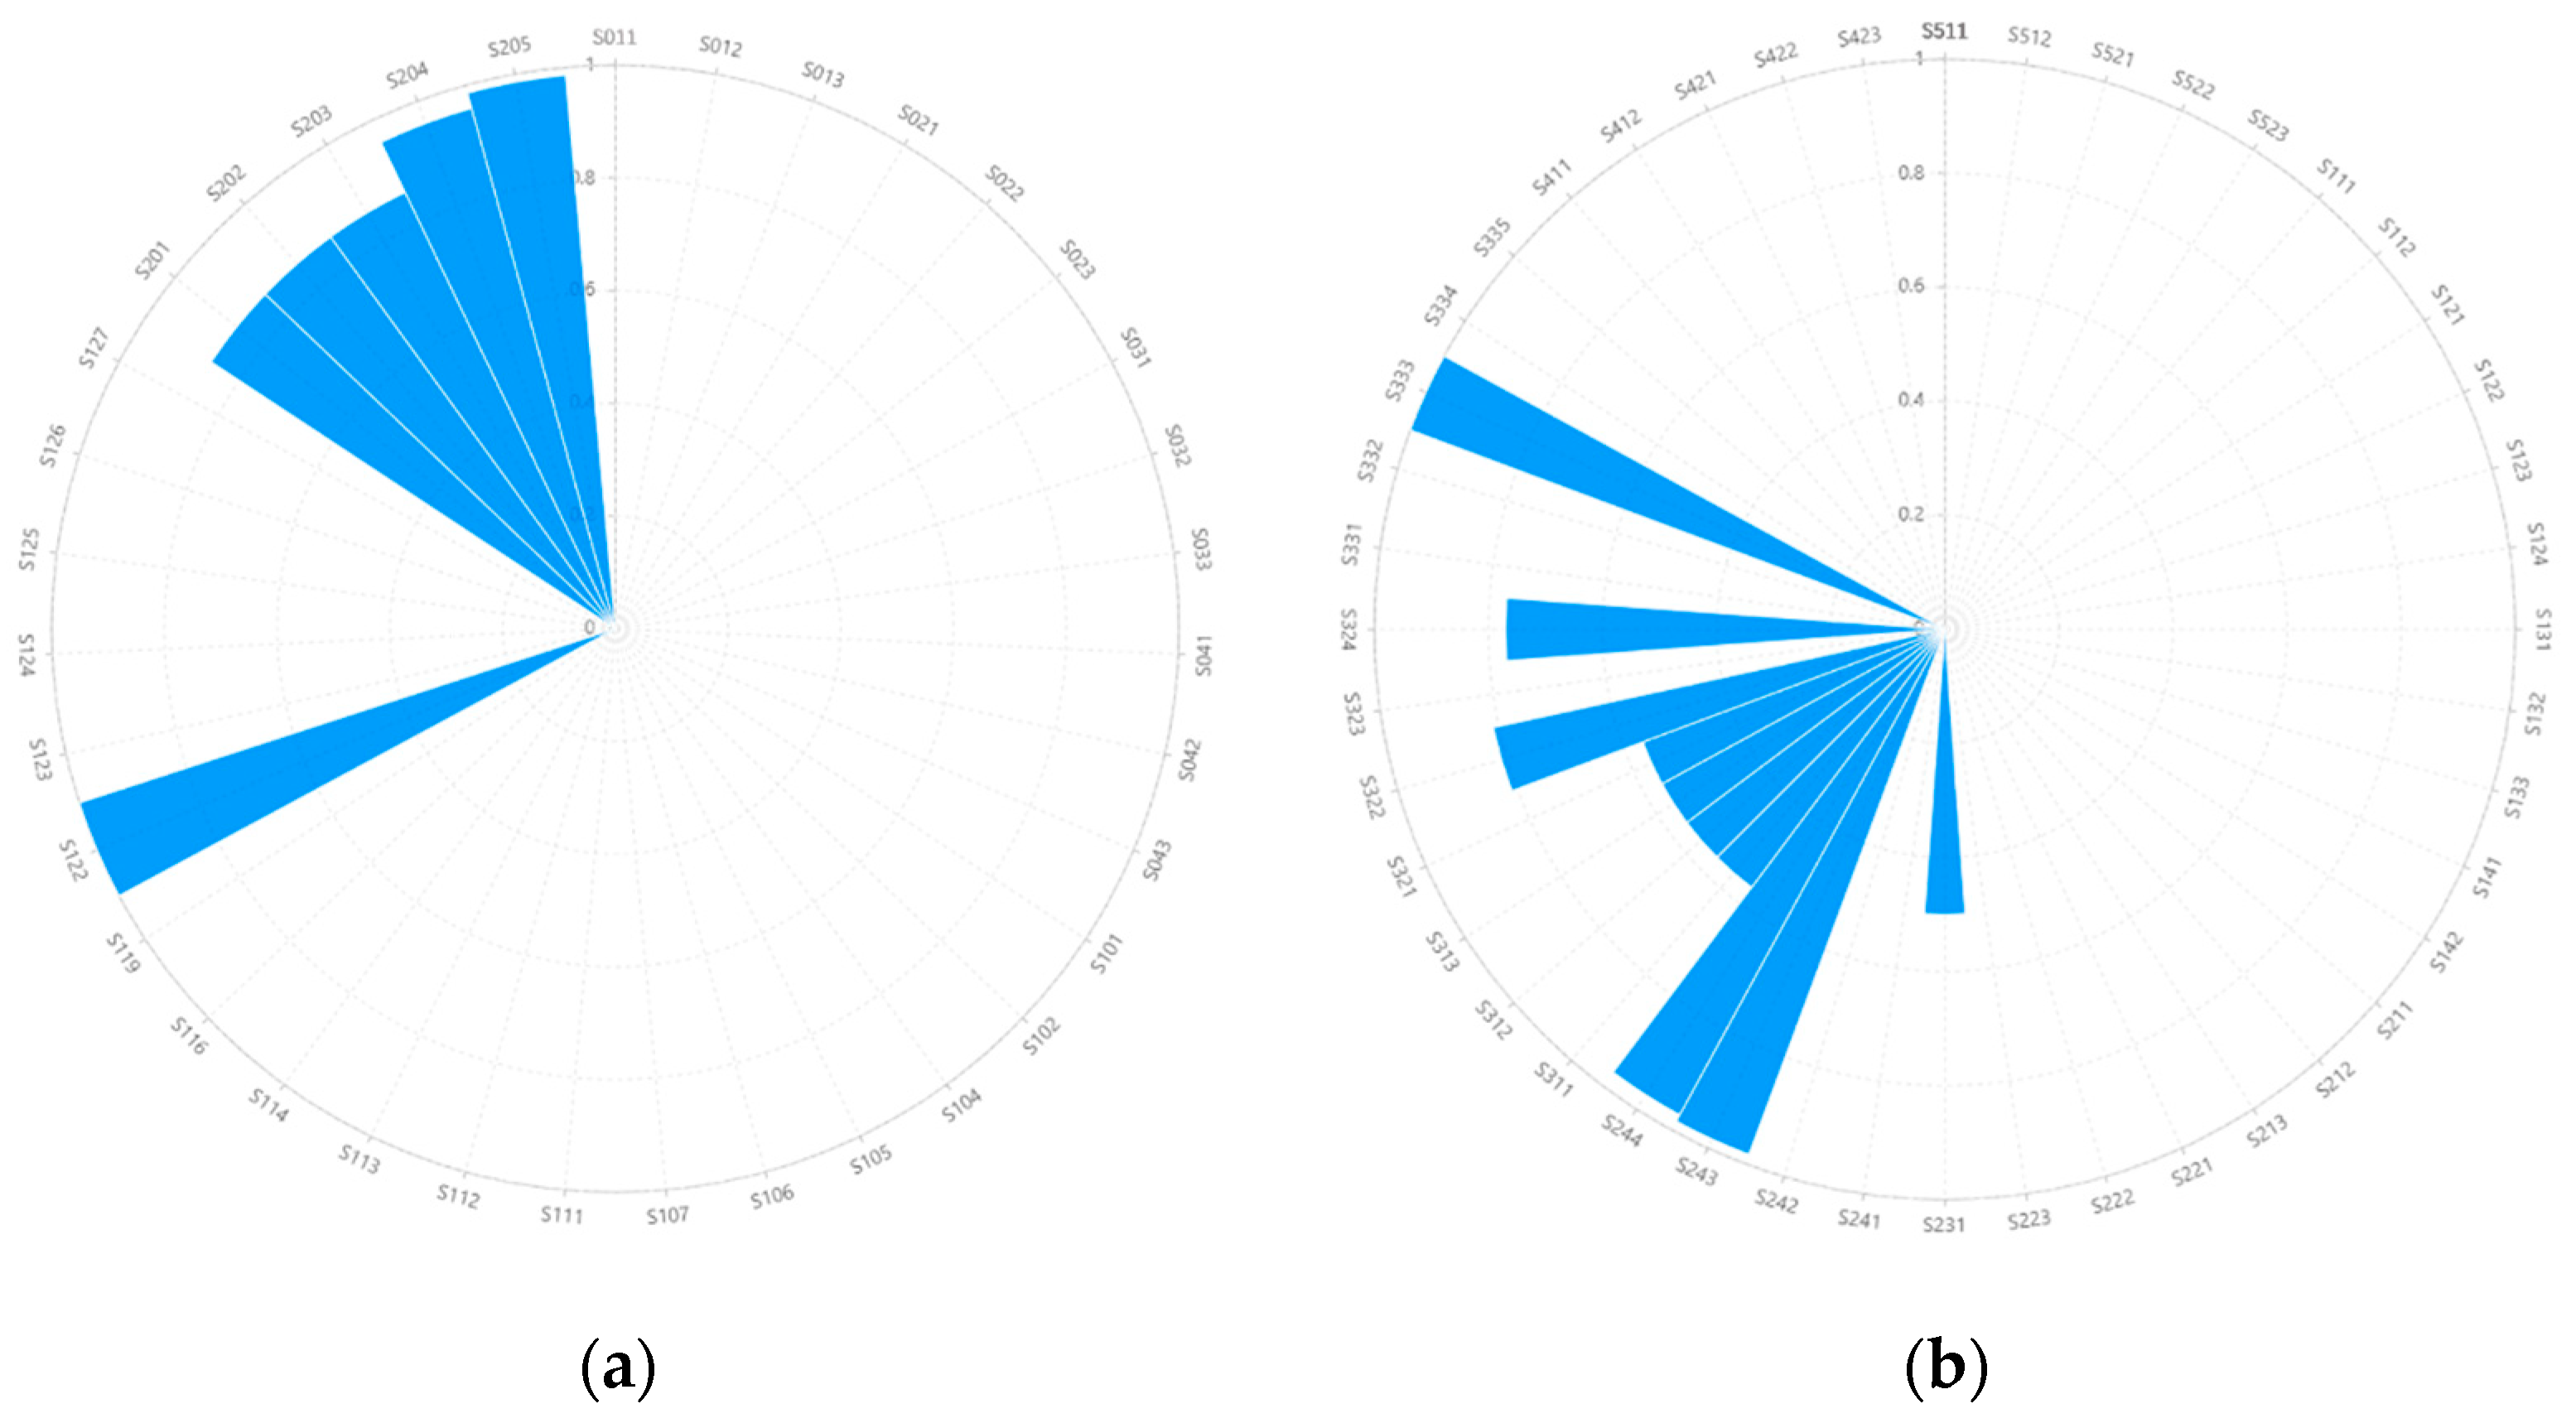
4.1. Results of Semantic Translation Uncertainty Analysis

For the semantic uncertainty analysis, we set α = β = 1 in Equation (2) for the calculation of semantic similarity. The results of calculating the semantic translation probability of the test CSs are illustrated via the Sankey diagram in Figure 5. The diagram depicts the transition flow of semantic information from the source system to the target system, and the width of the flow is proportional to the magnitude of the semantic translation. Thus, a bigger flow denotes a larger semantic translation probability. Classes in a source system with multiple branches had larger uncertainties than classes with only one branch. For example, the classes “S201”, “S204”, “S202”, “S122”, “S205”, and “S203” in NLS had multiple transferable classes in PWSCS, as shown in Figure 5a. This means that these classes could be more easily confused in semantic translations. Translation types with the highest translation probabilities, such as “S201-T051”, “S203-T052” and “S205-T054”, would be chosen to conduct semantic translation during LUC mapping. The translation flows shown in Figure 5b indicate that translation types such as “S231-T10”, “S243-T20”, and “S324-T40” had the highest translation probabilities among the possible translation types from the source classes in CLC. Other source classes in CLC, such as “S111”, “S112”, and “S121”, had only one possible translation flow; thus, these classes generated no semantic uncertainty.
The semantic translation uncertainty of each class in the source system was calculated based on the translation probability from the source system to the target system, and the normalized results are shown in Figure 6. Classes with values larger than zero were found to be more likely to generate semantic translation errors, such as “S122” and “S205” from NLS to PWSCS, and “S333” and “S243” from CLC to GlobeLand30. Patches with uncertainty larger than 0 were expected to contain semantic translation uncertainty or exhibit errors between translation types.

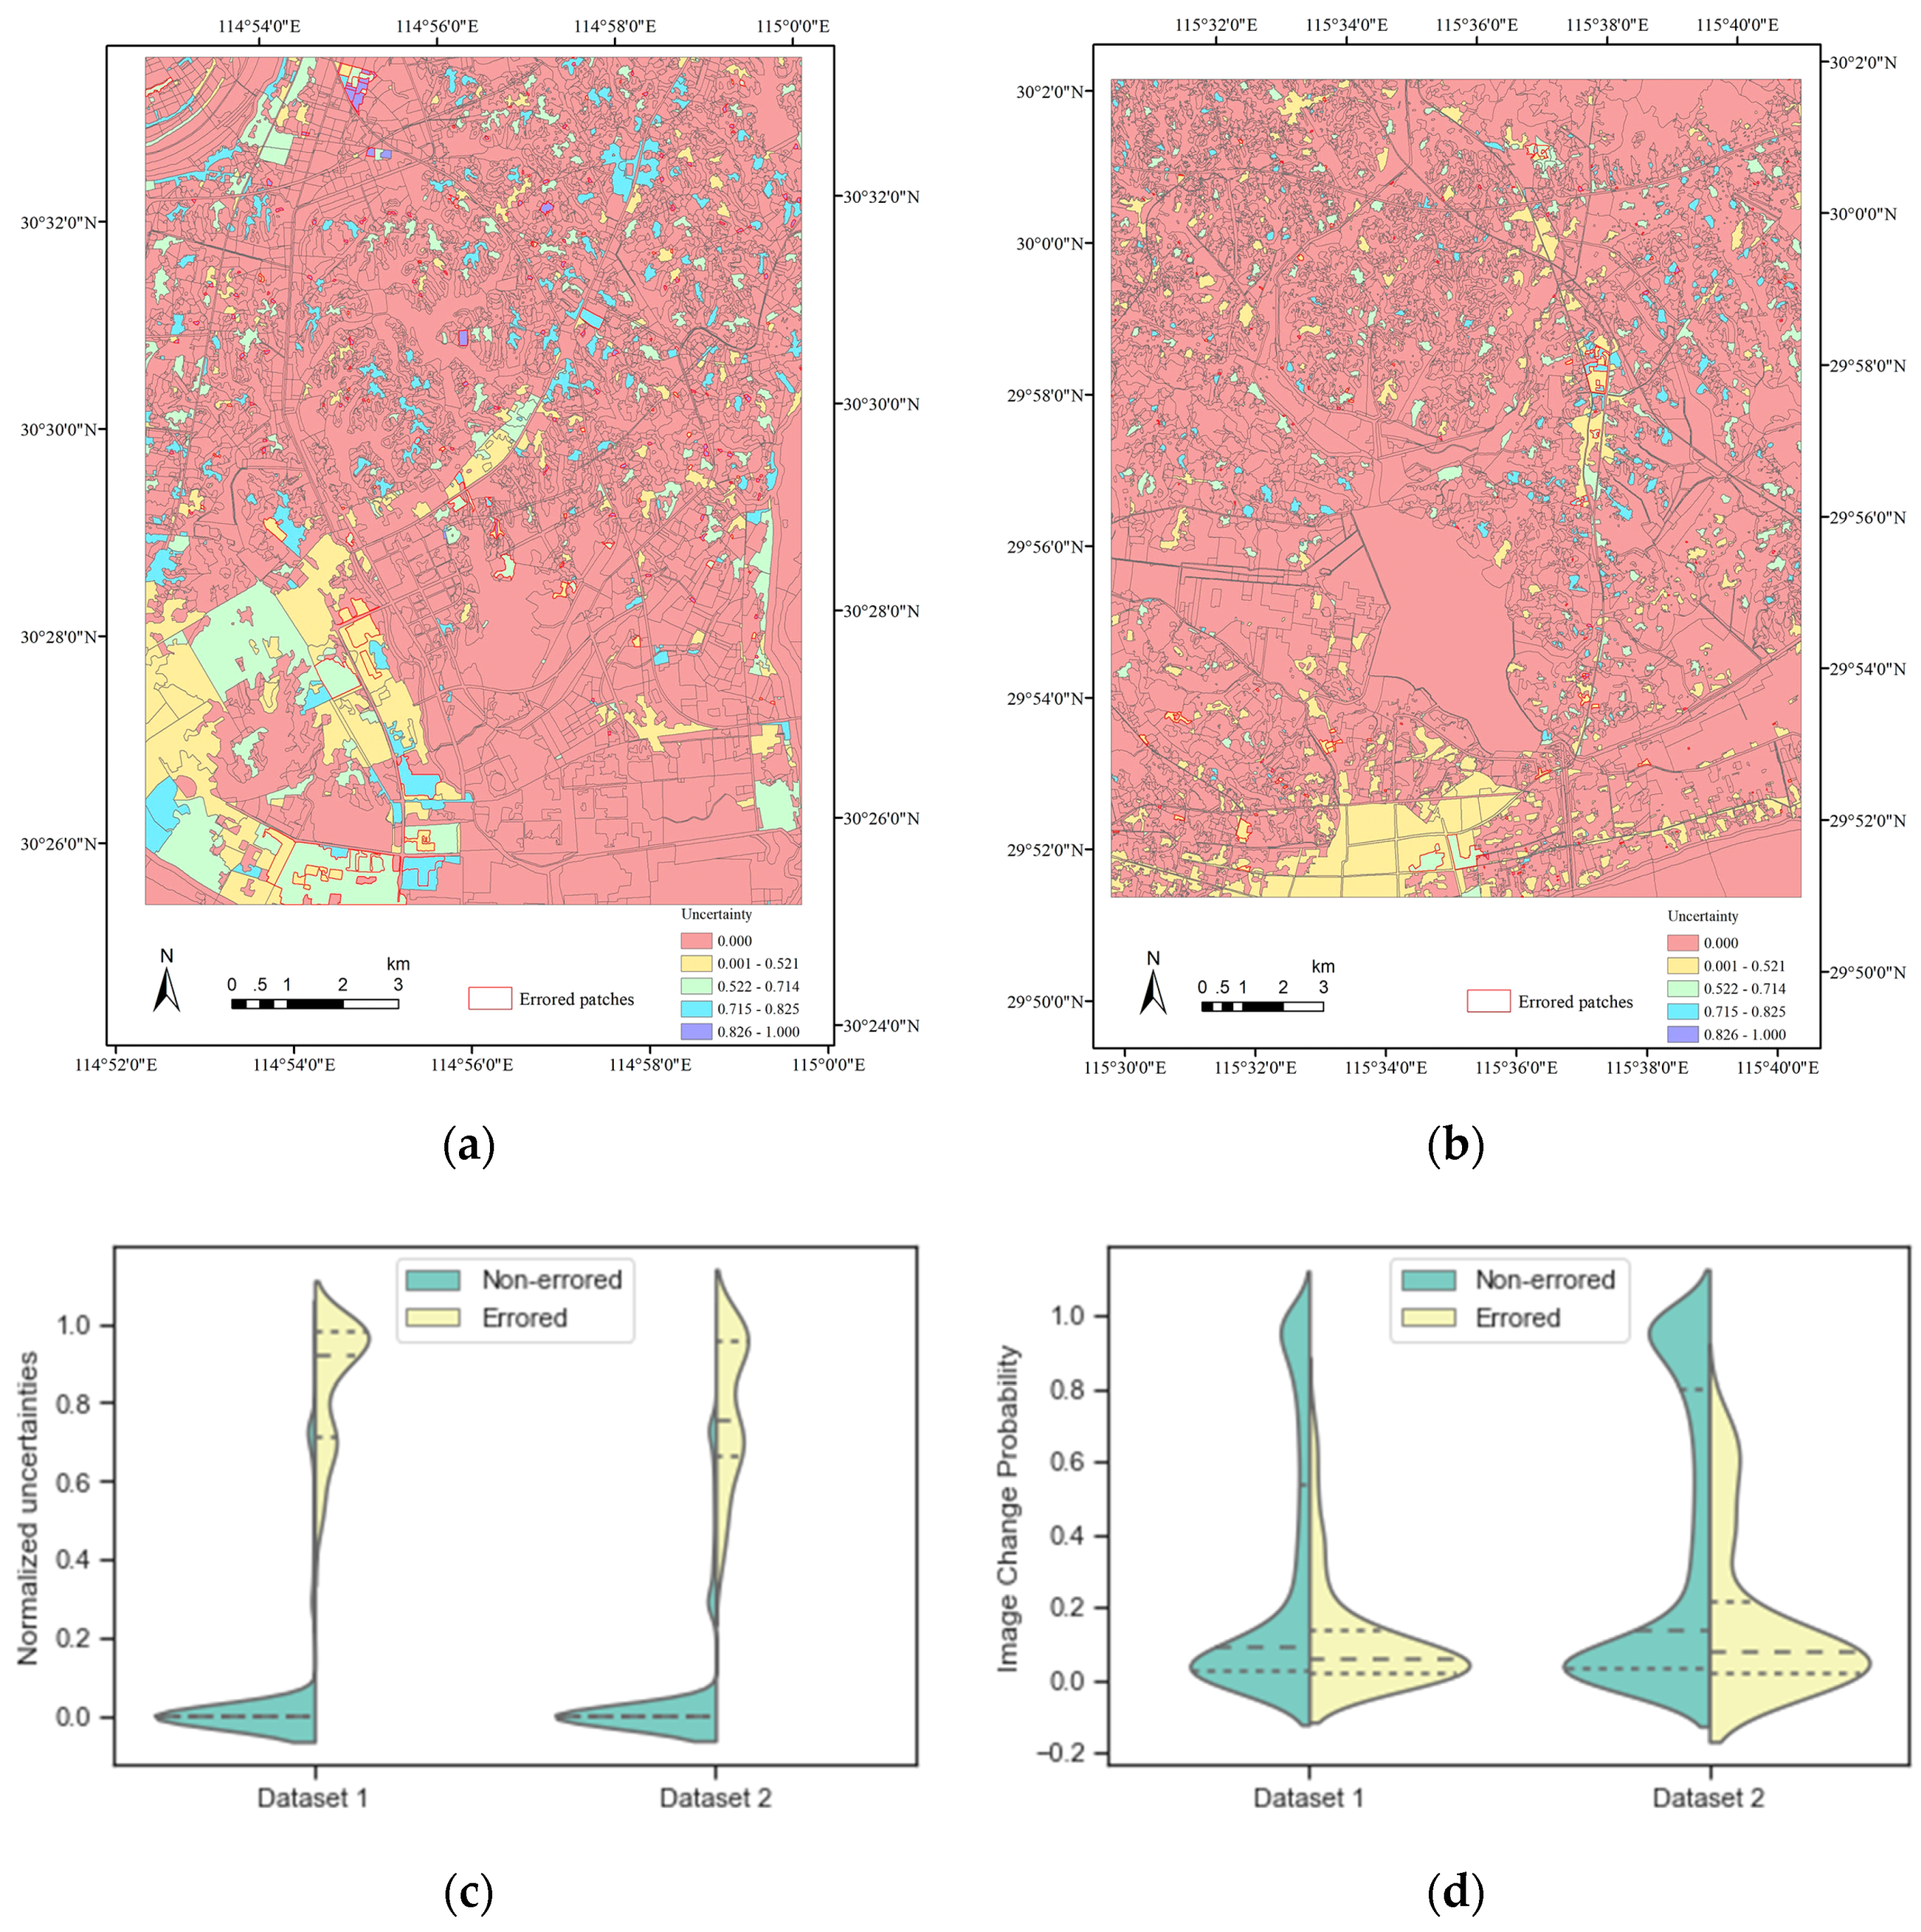
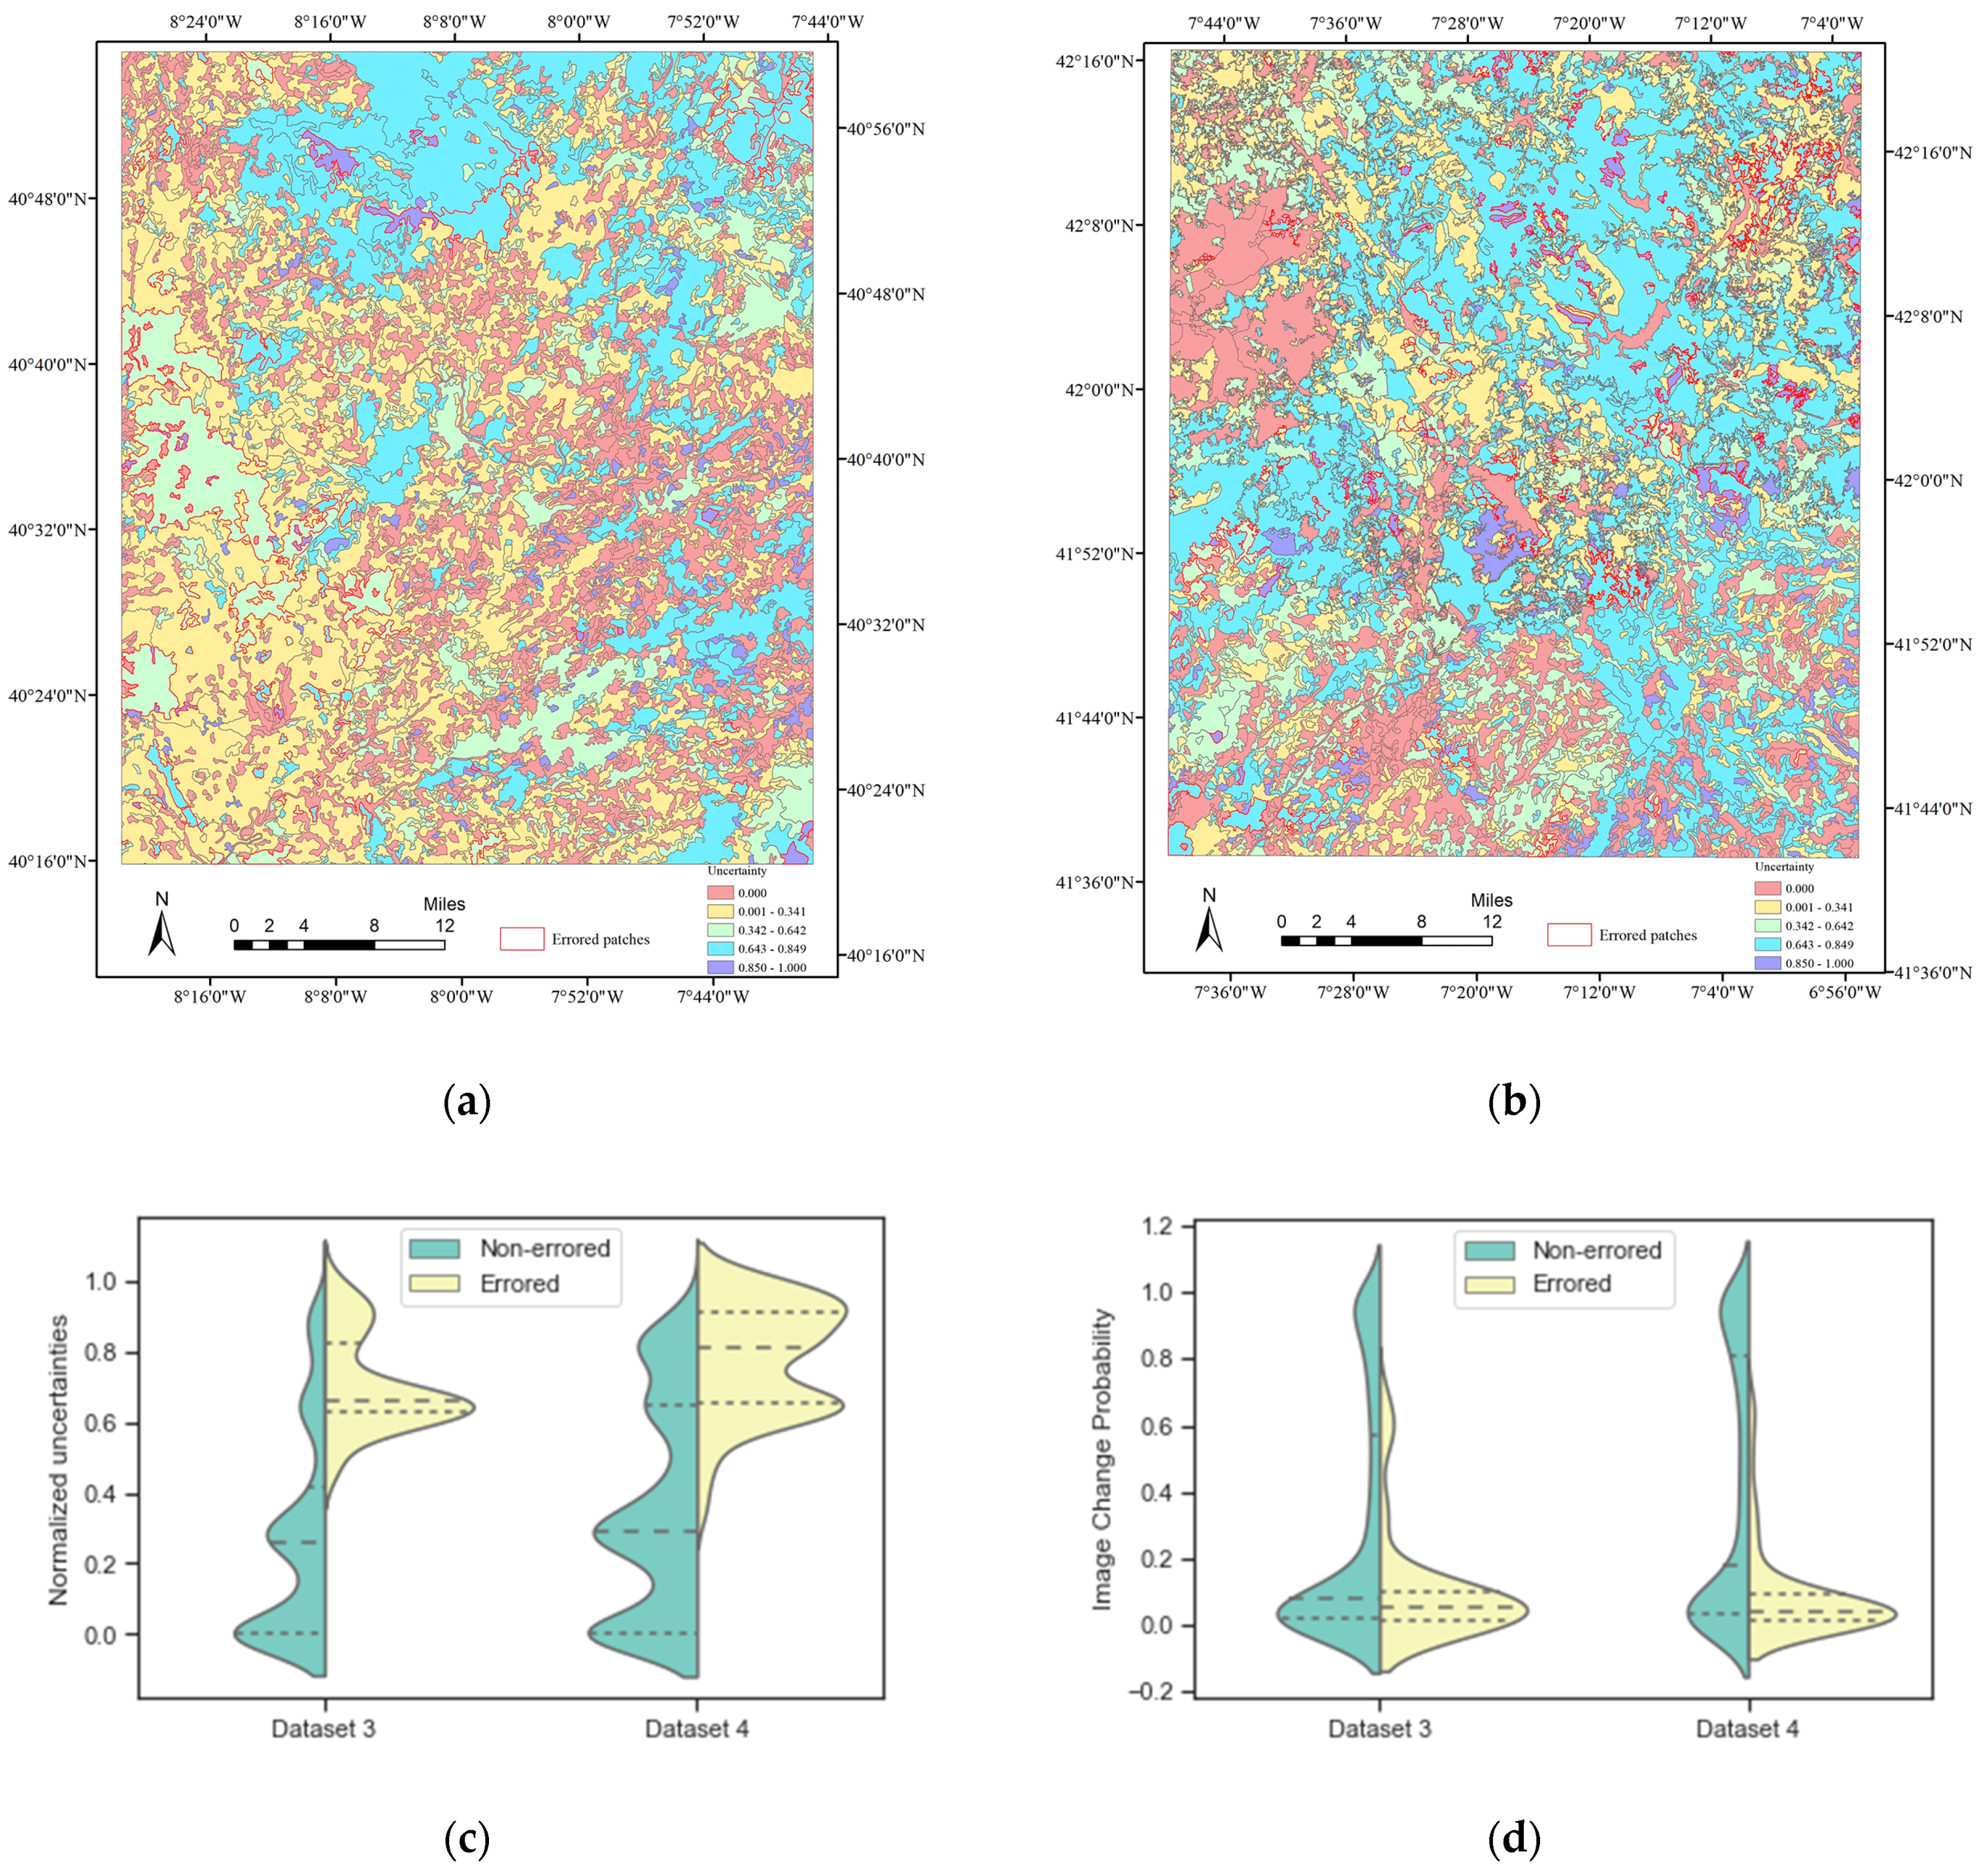
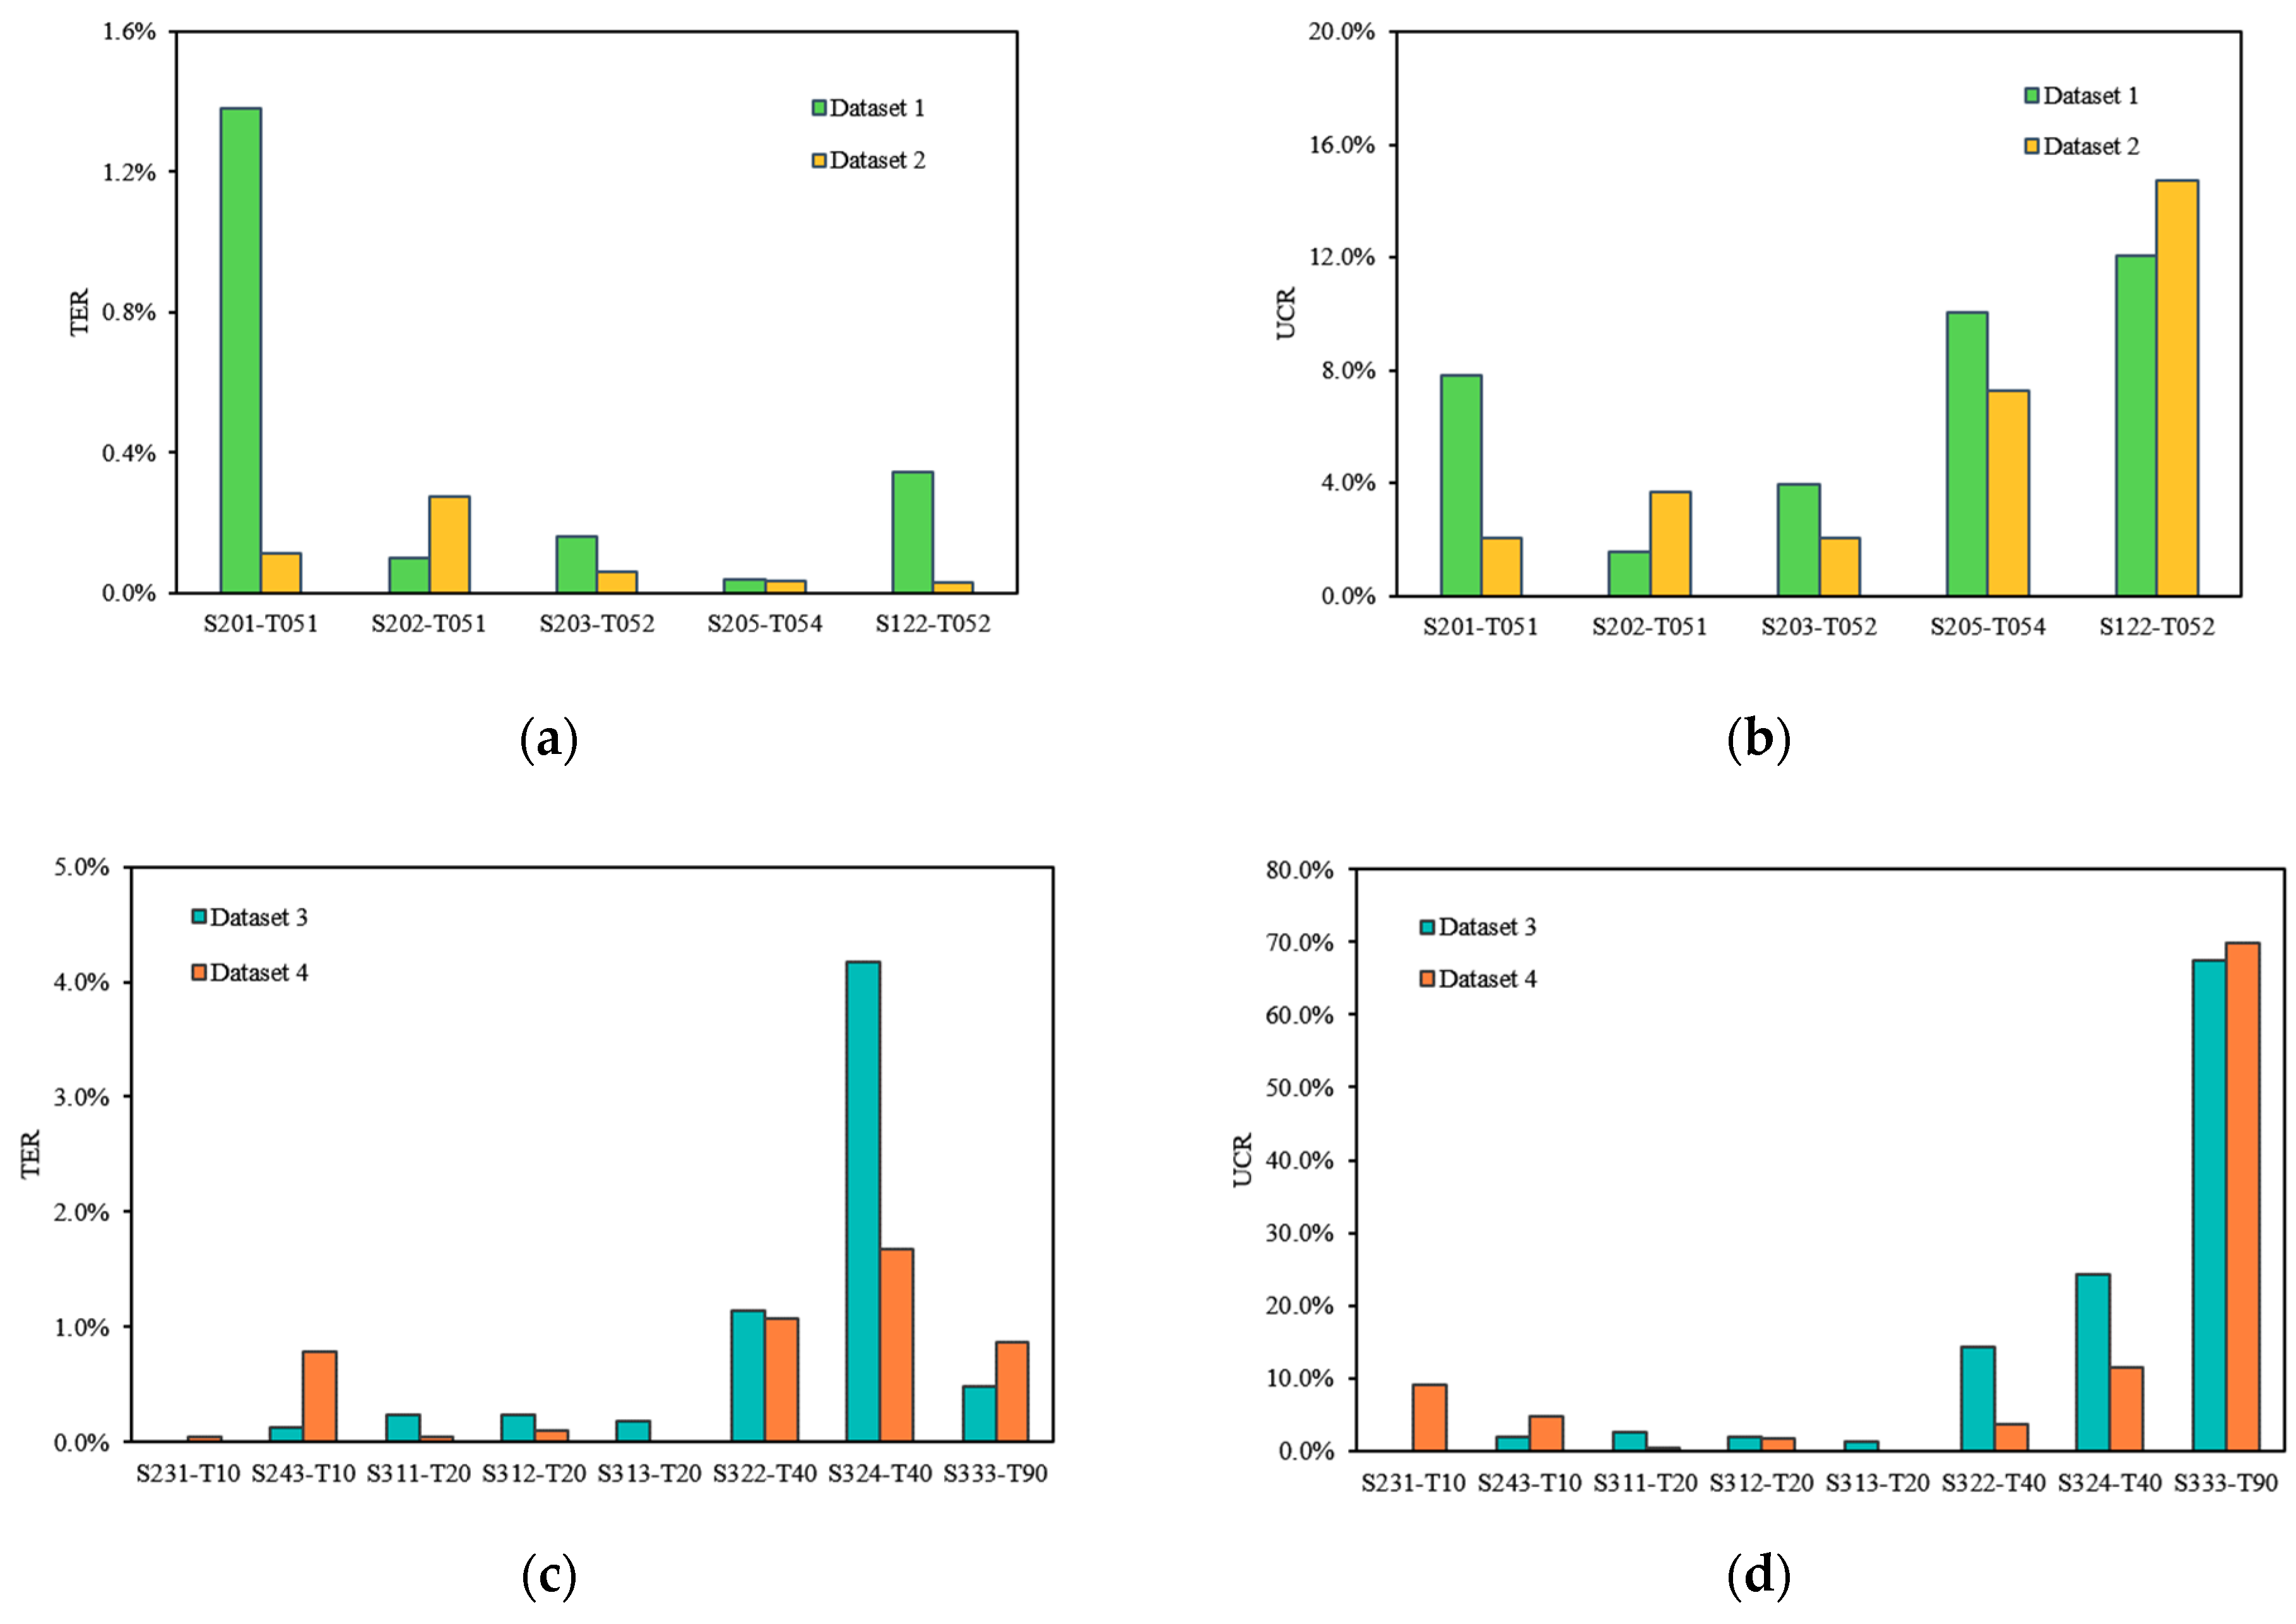
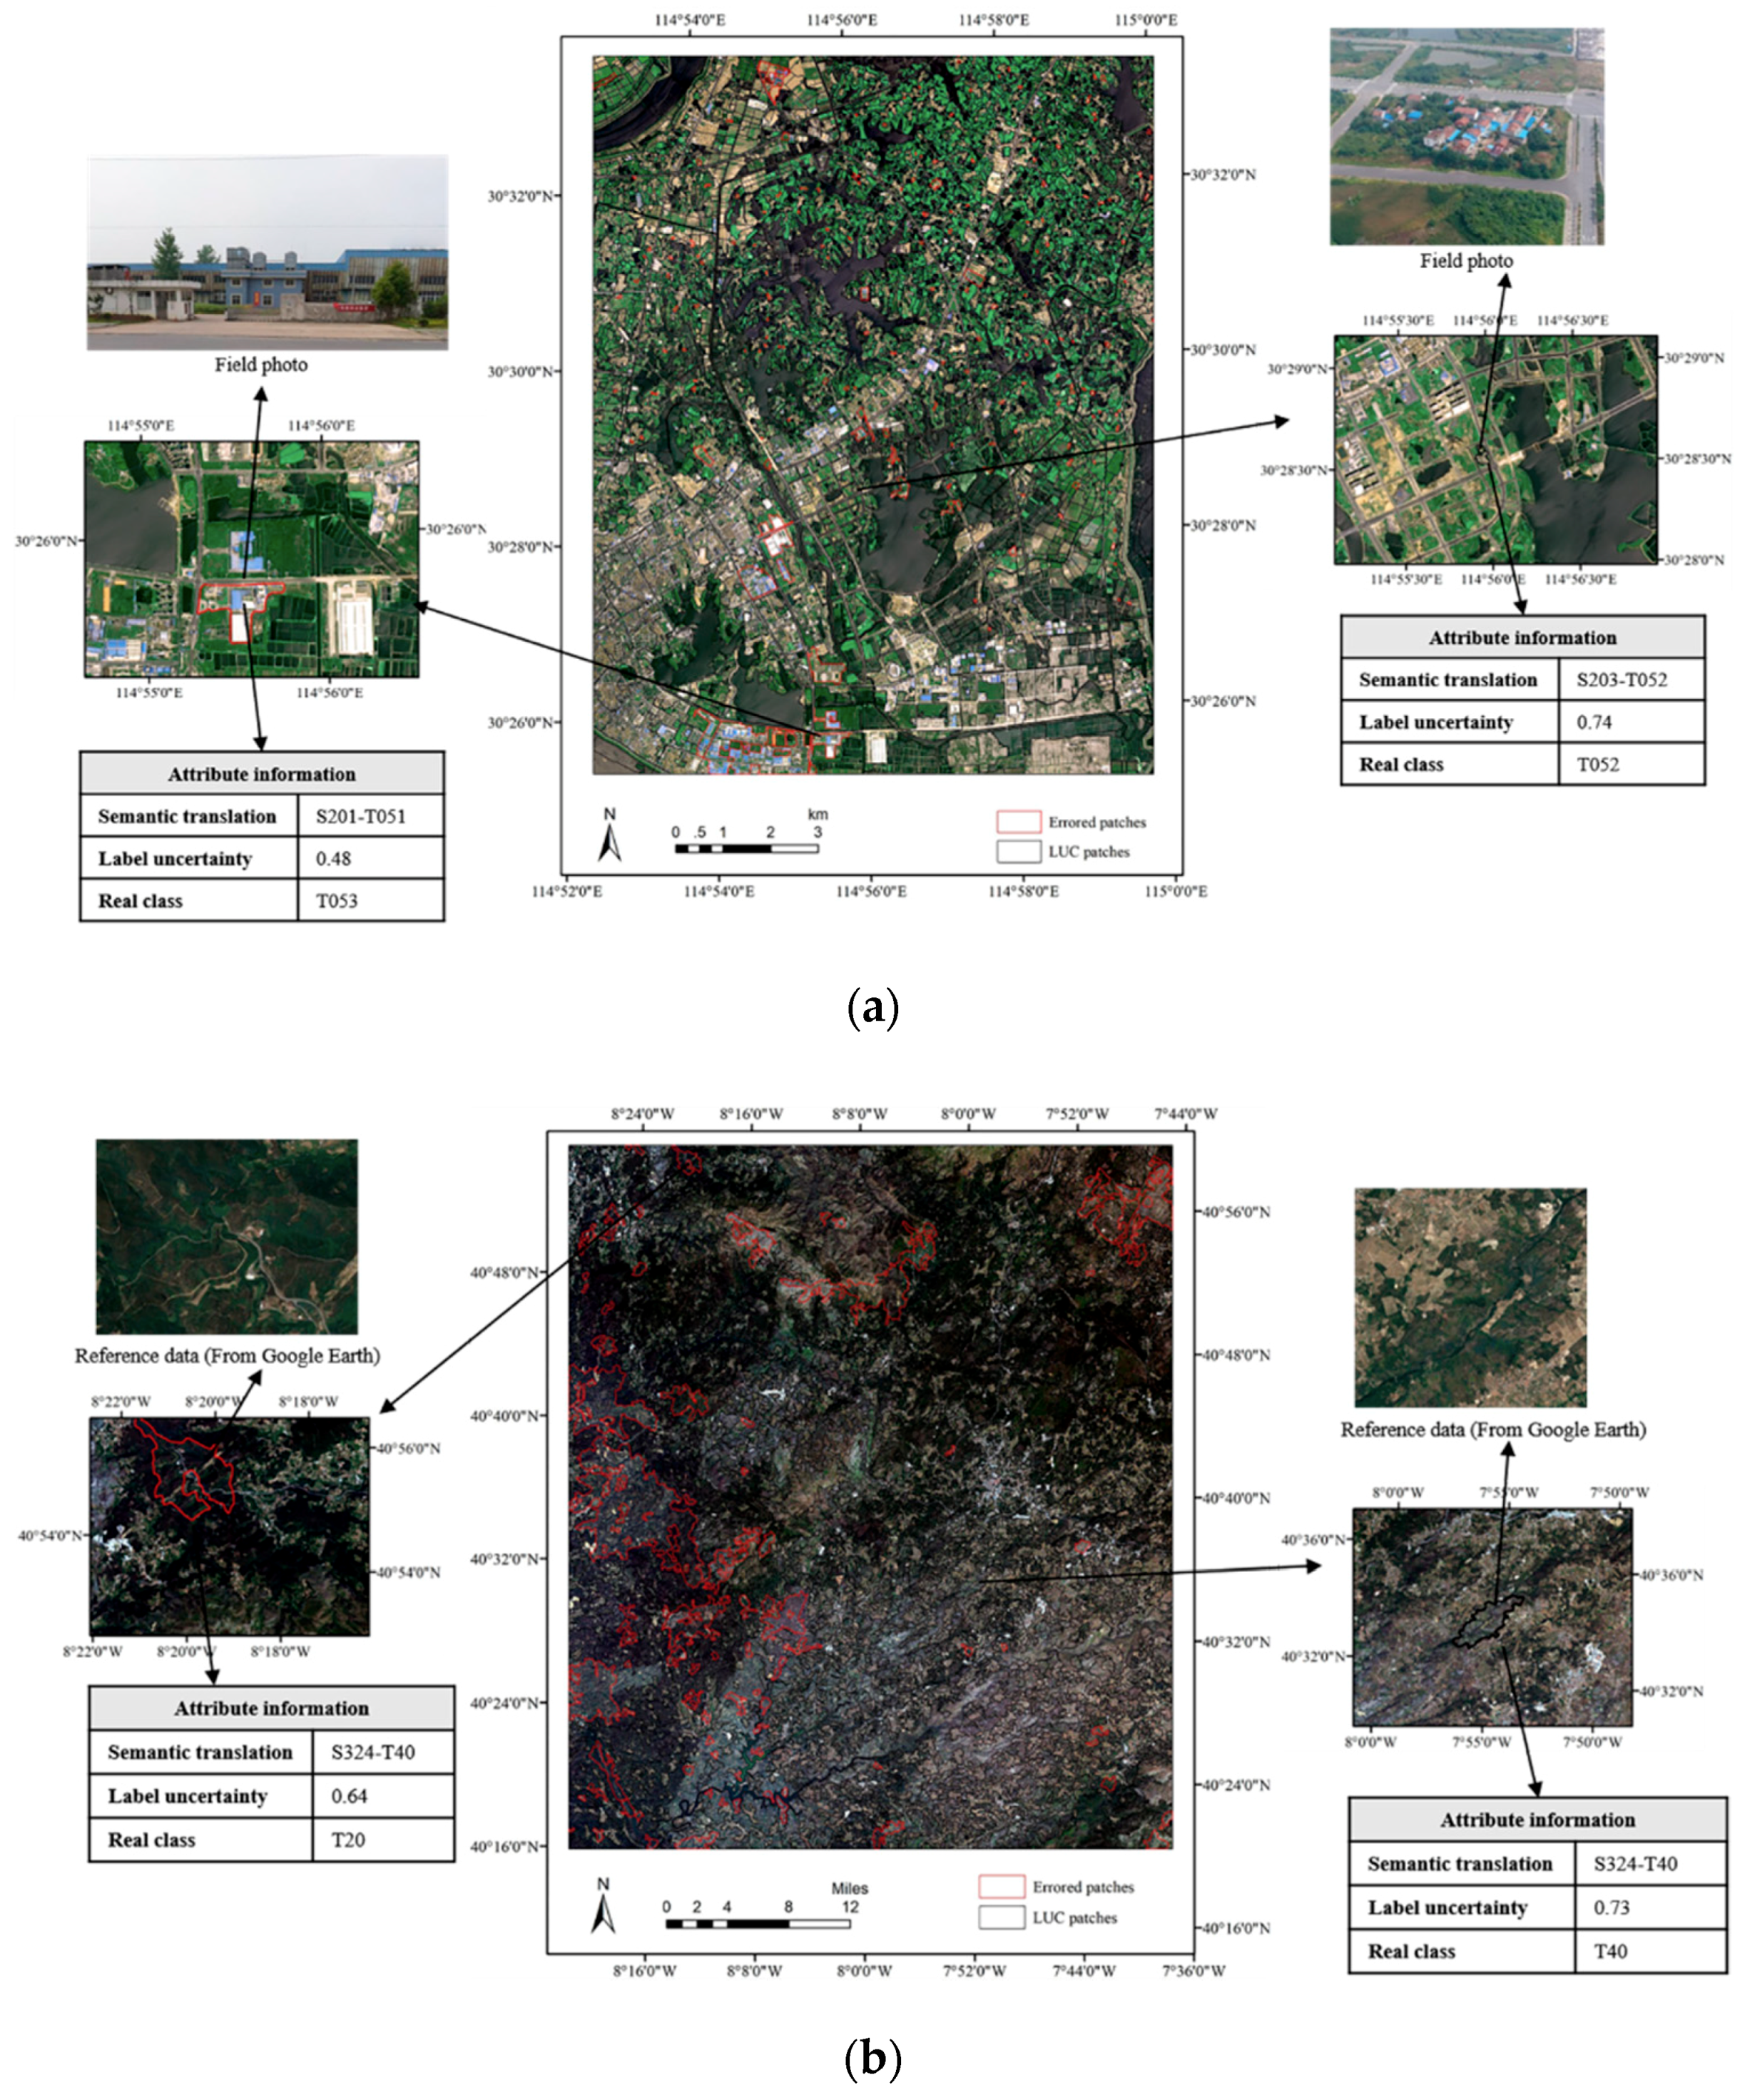
4.2. Results of Patch Label Uncertainty Assessment

The class label uncertainty of each patch in the study area was obtained via the proposed uncertainty metrics, and the spatial distribution of the label uncertainty in the first two study areas is shown in Figure 7a,b. In the experiments, the ground truth was generated by professionals via visual inspections and field surveys for error detection and reliability evaluation. We established a stratified sampling strategy for field surveys based on landscape complexity and the land use/cover type in the study areas. The sample unit was a patch. The sampling strategy was applied in the first two study areas, in which a total of 32 samples covering 0.56 km2 and 41 samples covering 20.8 km2 were selected, respectively. We used a mobile geographic information system (GIS) device for field geospatial data acquisition, in which the global positioning system (GPS) aided positioning of the sample points.
To validate the effectiveness of the quantitative description provided by the proposed uncertainty metrics, violin plots of the uncertainty in the errored and non-errored patches were used to illustrate the probability density of data at different values. As shown in Figure 7c, most errored patches tended to have large uncertainty values, among which the peak value was 0.95. In contrast, uncertainty in non-errored patches tended to be close to either zero or 0.45. In addition, the quartiles of the distribution indicated that the medians of the uncertainty in the errored patches in Datasets 1 and 2 were 0.90 and 0.75, respectively, while the medians of the uncertainty in the non-errored patches were zero. Violin plots of the image patch change probabilities are shown in Figure 7d, where it can be seen that the image change probability of the errored patches with a relatively concentrated distribution were mainly distributed between 0 and 0.4. Nevertheless, the image change probability distribution of non-errored patches was not uniform and had peaks near 0 and 0.95.
The spatial distribution of the patch label uncertainty in Datasets 3 and 4 is illustrated in Figure 8a,b. Here, the ground reference data were collected via visual interpretation of the remote sensing data. Violin plots of the uncertainty in the errored and non-errored patches are displayed in Figure 8c to illustrate the probability density of the patch label uncertainty. In Dataset 3, most non-errored patches had uncertainty values between 0 and 0.58, while those of the errored patches were larger than 0.65. Similarly, the uncertainty in the errored patches fell in the range of 0.75–0.92, while that of the non-error patches was concentrated in the range of 0.4–0.74 in Dataset 4. In terms of the image change probability, shown in Figure 8d, most patches with change probabilities larger than 0.4 were in the non-errored groups, which indicates that these patches were updated and contained correct classification labels.

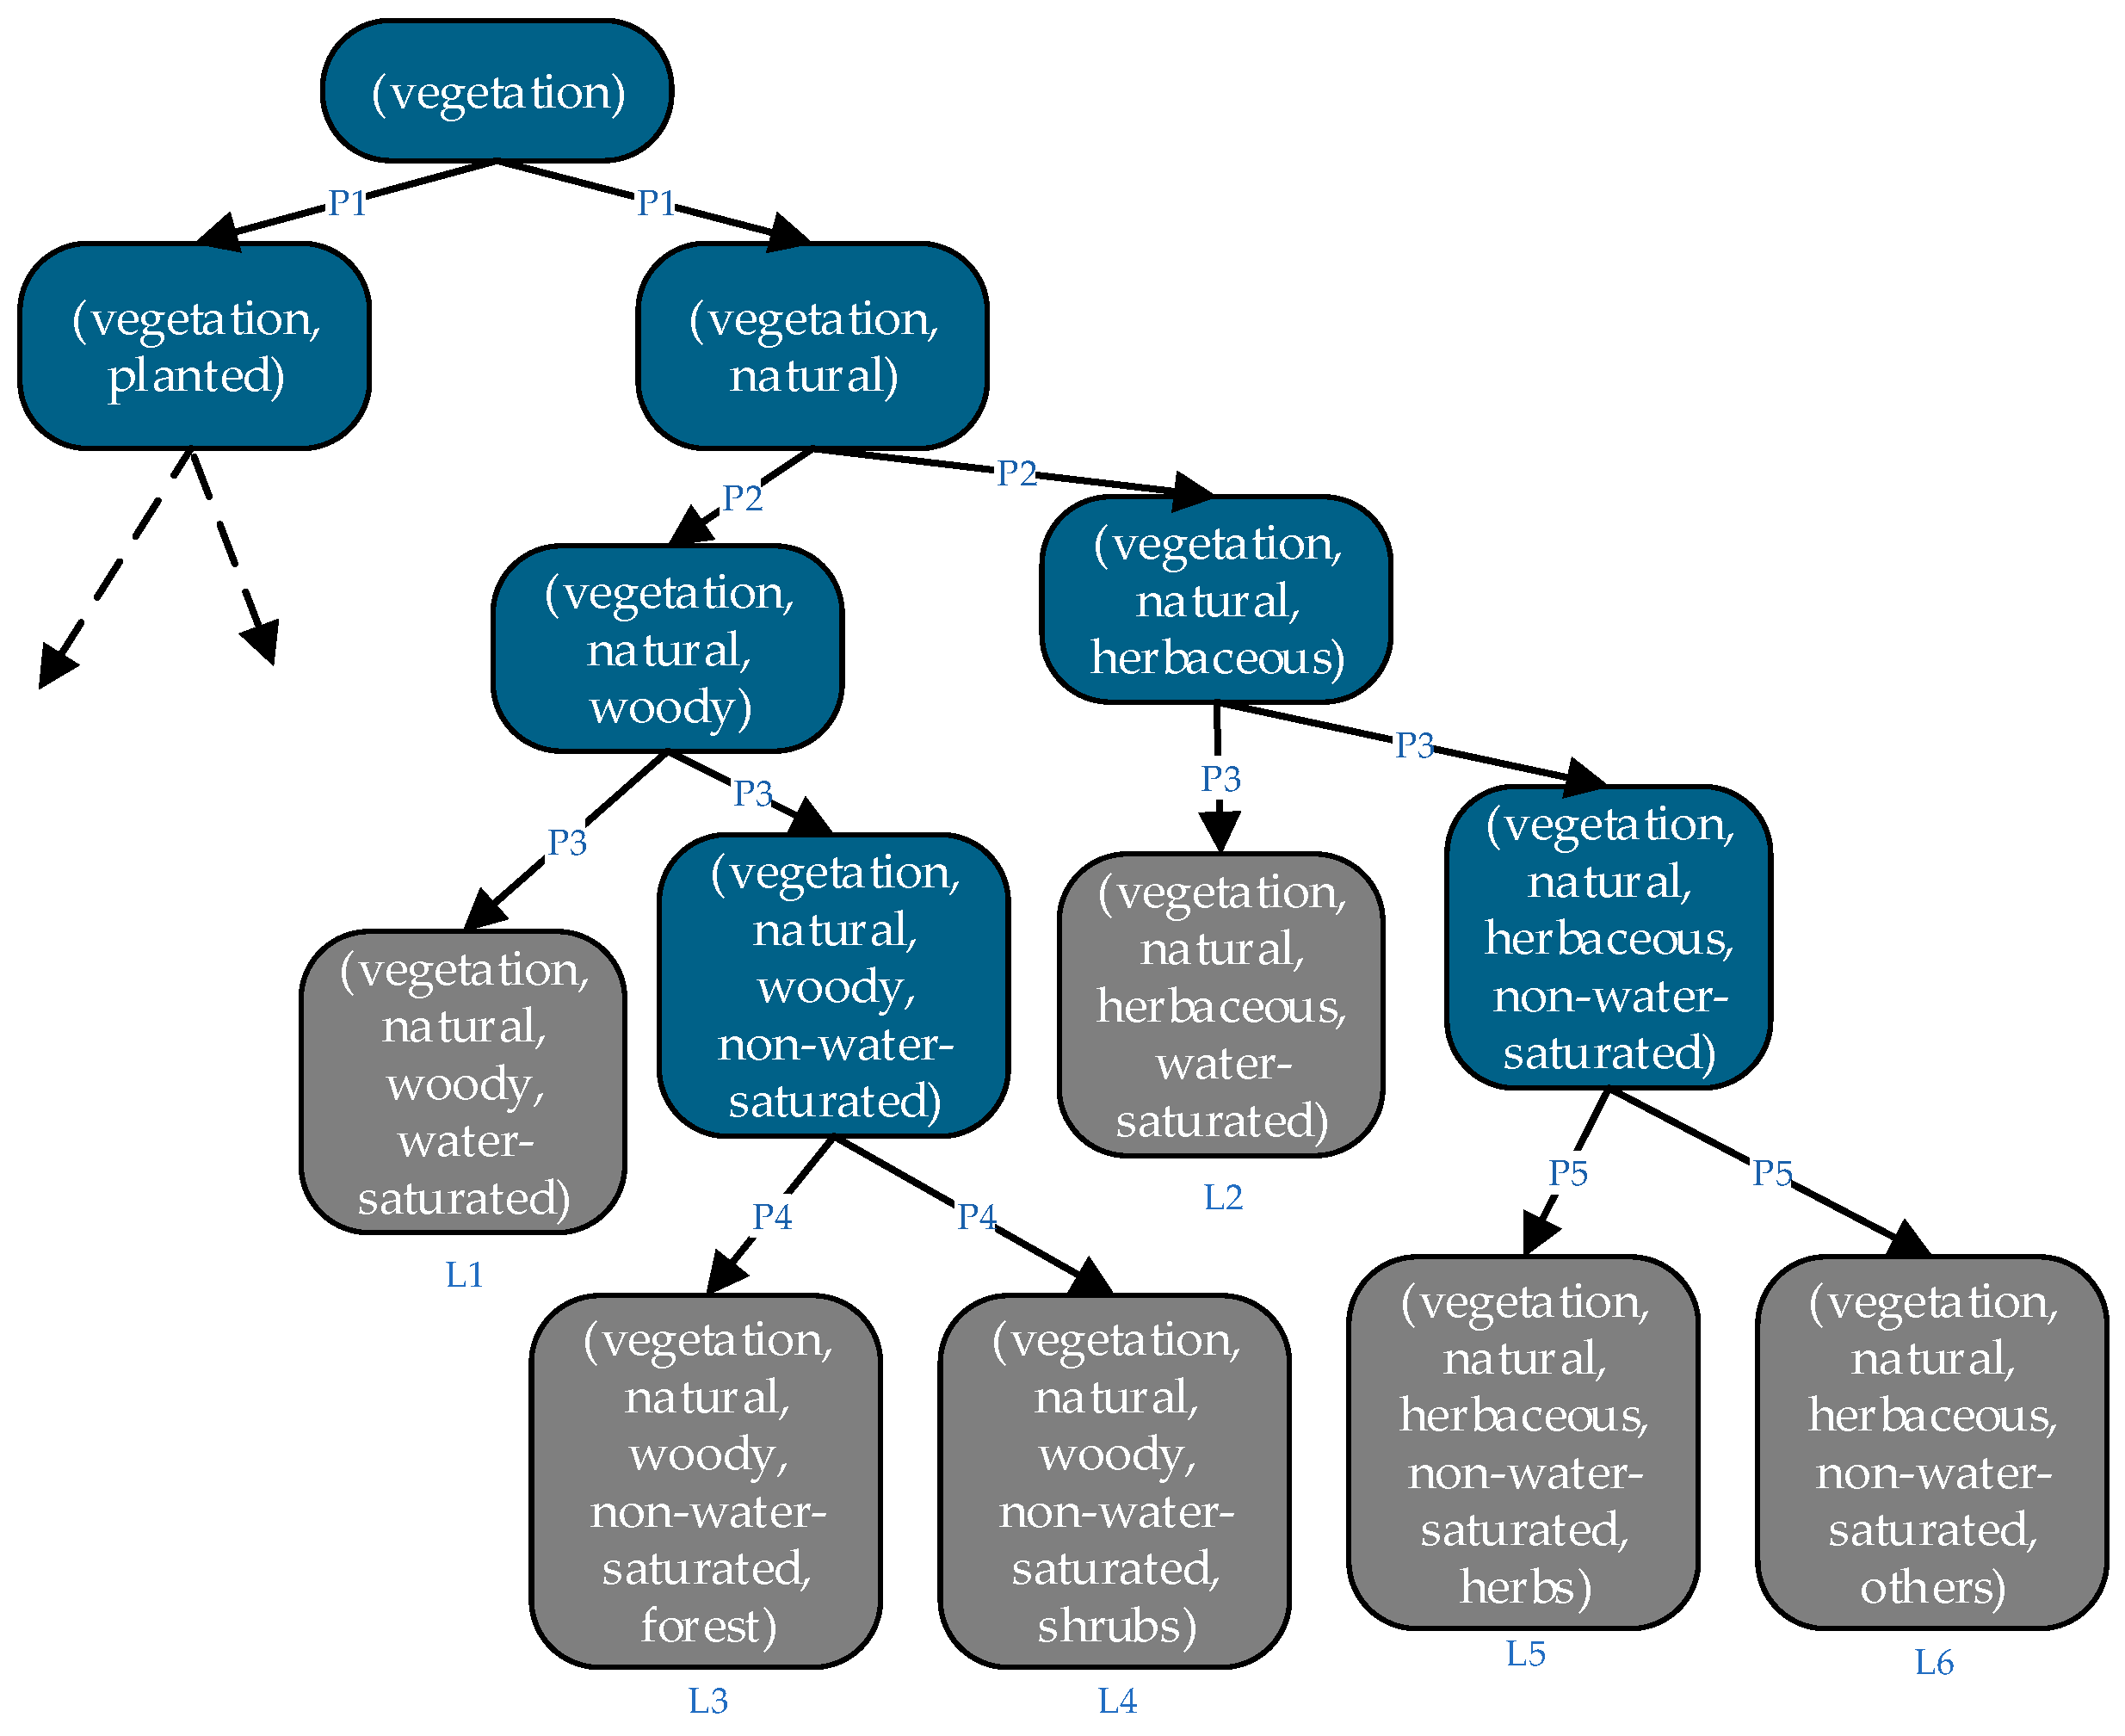
4.3. Effects of Uncertainty on LUC Map Reliability

Effects of uncertainty on LUC map reliability were assessed using the total error rate (TER), which represents the effect of errored patches on the reliability of the final LUC data, and the uncertainty contribution rate (UCR), which represents the contribution of the semantic uncertainty to errored patch labels. These indices are defined mathematically as follows: T E R = A E / A T , where A E is the area of the errored patches and A T is the total area of all the patches in the map; and U C R = A E / A U , where A U is the area of patches with semantic uncertainty. The results of reliability evaluation of the test datasets are shown in Table 1. Although Dataset 1 covered less total area than Dataset 2, the former had a larger UCR value and TER value, which resulted in more errors. Dataset 3 contained fewer uncertain areas, but it had more errors than Dataset 4 due to the larger UCR value. This indicates that the patch label uncertainty had a great impact on the reliability of the LUC data.
The results of a reliability evaluation of each semantic translation error type are shown in Figure 9. Semantic translations of “S205-T054” and “S122-T052” in Datasets 1 and 2 had lower TER values but higher UCR values, which indicates that patches of these two types were more likely to generate errors even though they covered less area. Semantic translation type “S201-T501” in Dataset 1 had a larger TER value than other types, which had a larger effect on the data reliability than in other types. Semantic translation type “S333-T90” from CLC to GlobeLand30 exhibited the largest UCR values, while semantic translation type “S324-T40” had larger TER values than other types in Datasets 3 and 4. Various semantic translation types had different influences on the data reliability based on the UCR and patch areas in these types in the LUC map.

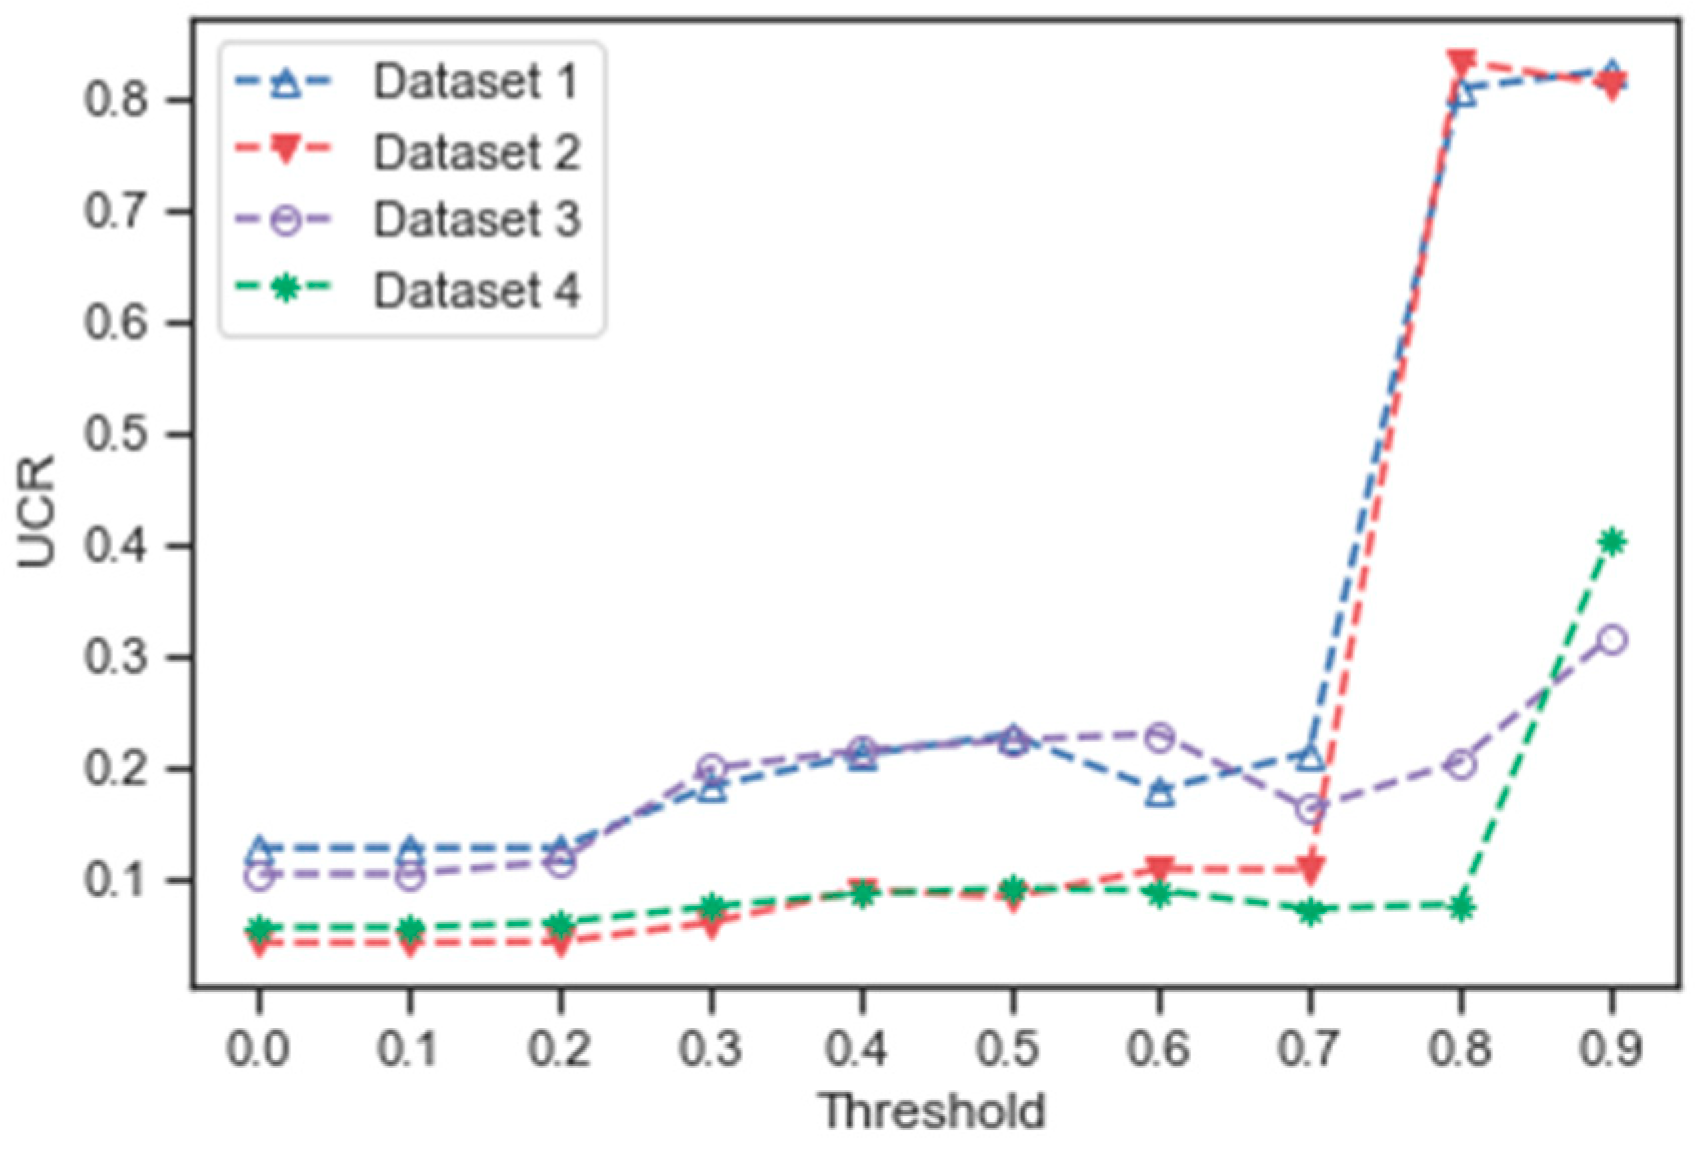
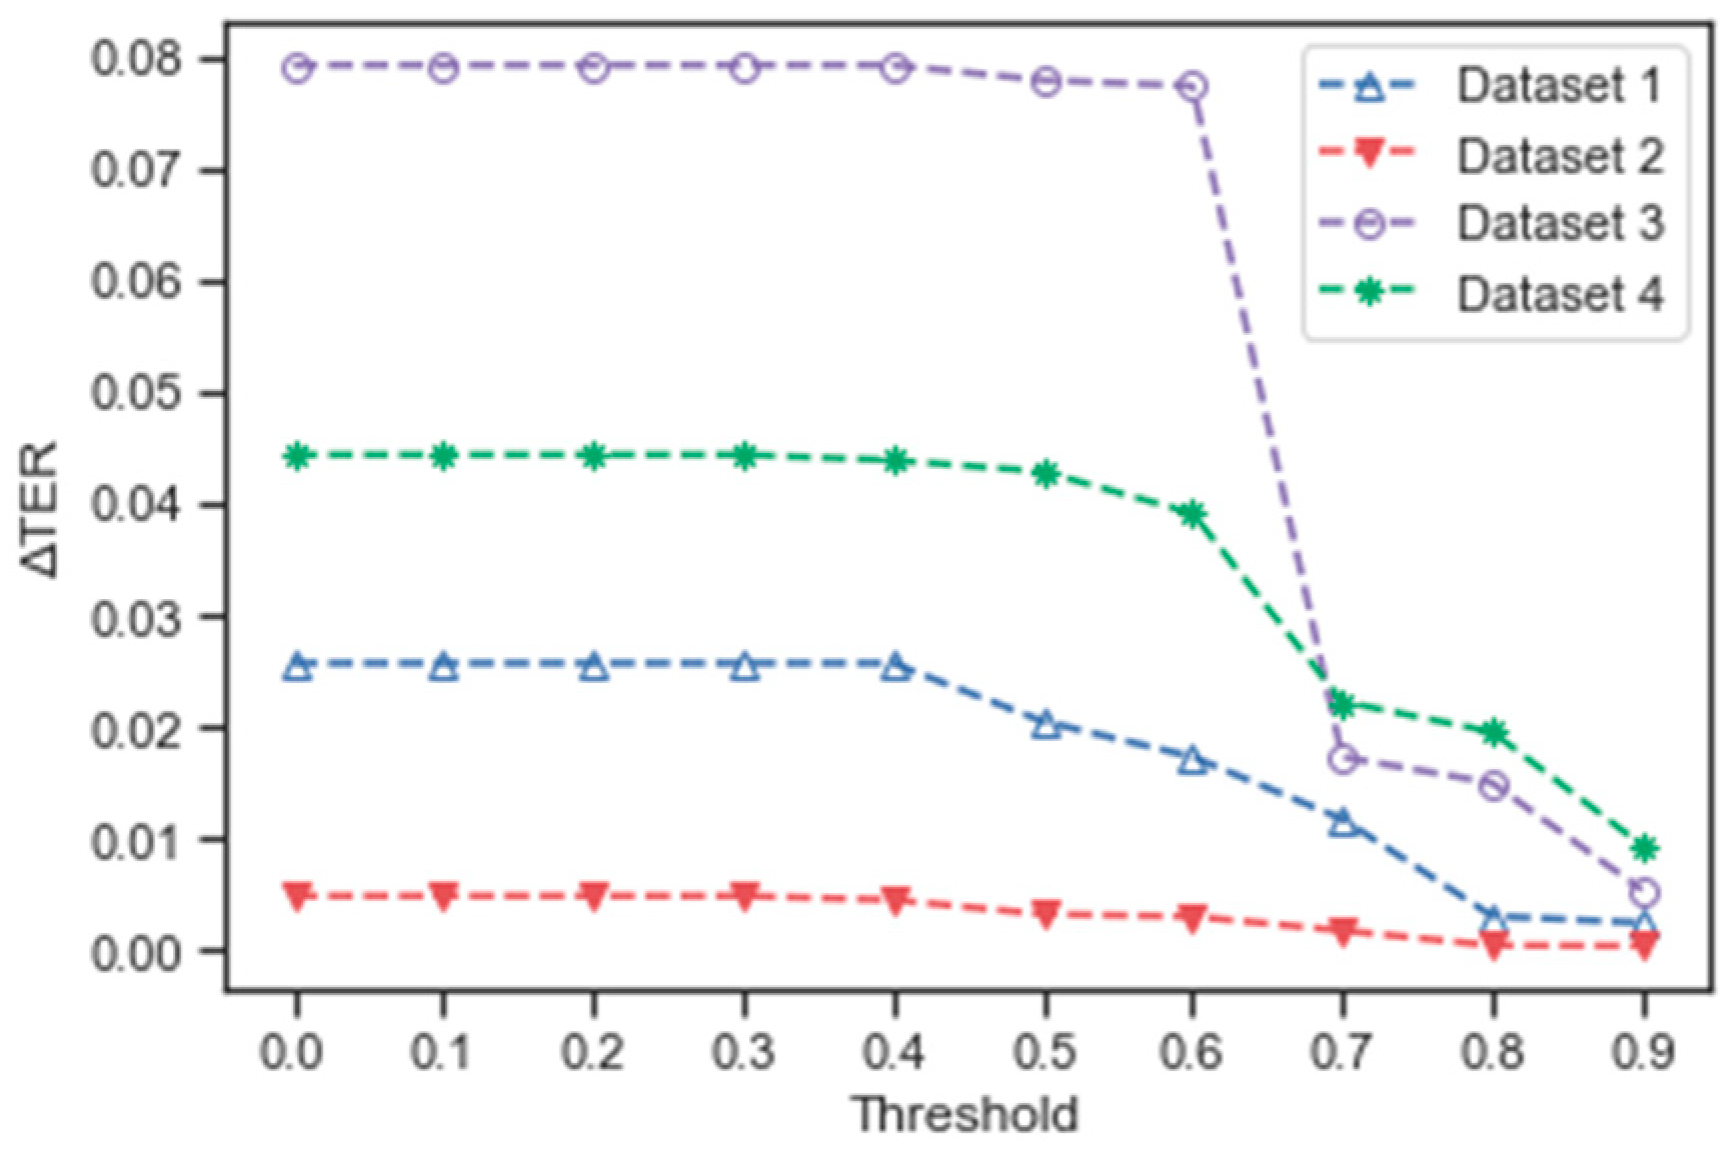
4.4. Uncertainty Control Based on Patch Label Uncertainty

According to the UCR curve with respect to different thresholds presented in Figure 10, the effects of uncertainty on the data label errors increased abruptly when the threshold reached 0.8 in Dataset 1 and Dataset 2 and 0.9 in Dataset 3 and Dataset 4. It indicates that patches with uncertainty values larger than these thresholds were more likely to generate errors than others. These results can be used as a reference in the development of measures to control uncertainty and improve LUC mapping accuracy.
Note that how to best control or suppress uncertainty in the LUC mapping process to improve the reliability of the mapping results was not the focus of this work. This study only adopted a simple and direct but effective uncertainty control method to verify the effectiveness of the proposed uncertainty metrics. Firstly, the patch label uncertainties were computed through the uncertainty assessment. Secondly, we used different thresholds to obtain potential unreliable groups, then checked and rectified the patch labels through visual inspection referring to the high-resolution remote sensing images. Finally, the TER changes were calculated in comparison with the original values. As shown in Figure 11, the TER curve represents the error rate changes with different thresholds, which indicates that the LUC mapping considering patch label uncertainties could improve the LUC map accuracy at different levels.

5. Discussion

The experimental results confirmed the applicability of the proposed uncertainty assessment schema on multitemporal LUC mapping with inconsistent CSs. The proposed semantic uncertainty metrics were shown to provide a valid quantitative description of the patch label uncertainty caused by uncertainty propagation from the semantic translation of LUC data in heterogeneous systems to the data update process. Upon review, it appeared that the errored patches tended to have larger uncertainty values, whereas the non-errored patches tended to have smaller uncertainty values. In addition, the uncertainty metrics were shown to have some capacity to estimate the potential unreliability of patch labels in LUC maps. The evaluation of the reliability of the updated LUC maps found that the semantic uncertainty had a large impact on the LUC data reliability, and its influence was dependent on the UCR values of certain semantic translation types and patch areas containing these types in the LUC map.
It is anticipated that the results of uncertainty assessment can be used in the development of methods to control the uncertainty in LUC data exchange between different CSs and improve LUC mapping accuracy, especially for patches with uncertainty values larger than a particular threshold, such as the patches in Datasets 1 and 2 that had uncertainty values larger than 0.8 and the patches in Datasets 3 and 4 with uncertainty values larger than 0.9.
The primary limitation in the proposed uncertainty assessment schema is that the data label uncertainty metrics rely on semantic translation types and image change magnitudes without reference to other uncertainty factors. Thus, the uncertainty metrics may reflect the relative levels of uncertainty caused by uncertainty propagation from semantic translation to data update and, therefore, cannot be used as a measure with which to validate the LUC data without the ground reference data. The consequence is that some non-errored patches may have larger uncertainty values than errored patches, as shown in Figure 12.

6. Conclusions

In this study, we proposed a novel uncertainty assessment schema to analyze the semantic translation uncertainty and the uncertainty propagation to data label uncertainty in LUC maps during multitemporal LUC mapping with different semantic classification systems. Firstly, a method of semantic translation uncertainty analysis between different CSs was developed based on a DSRS model and semantic similarity measurement. Then, image patch change analysis was implemented based on detecting changes in multitemporal remote sensing images using the OFCM algorithm. Based on the semantic translation uncertainty and image patch change probability, novel uncertainty metrics were proposed to estimate the class label uncertainty caused by uncertainty propagation from semantic translation to LUC data updates. Finally, experiments on four LUC datasets with heterogenous CSs were conducted to validate the effectiveness of the proposed uncertainty measurement and evaluate the effects of semantic uncertainty on the LUC data reliability. The proposed uncertainty metrics were found to be able to provide a distinct quantitative uncertainty description that could be used to estimate the patch label uncertainty in the map. The semantic uncertainty had a significant influence on the LUC data reliability in terms of the semantic translation types and associated patch areas in the LUC map. In addition, patches with large uncertainty values were found to be more likely to generate errors, and accounting for these uncertainties during data processing could somewhat reduce the error rates. It is anticipated that the results of this research will be leveraged to improve the interoperability and facilitate the application of LUC data products by assisting in the development of uncertainty control measures for heterogenous LUC data exchange and multitemporal LUC mapping with semantic heterogeneity. In future work, we will concentrate on uncertainty control methods in automatic LUC change detection and classification considering patch label uncertainty based on the uncertainty assessment schema proposed in this study to improve the multitemporal LUC mapping reliability.

Author Contributions

X.Z. and W.S. were responsible for the overall design of the study. X.Z. performed all the experiments and drafted the manuscript, which was revised by all authors. X.Z. and Z.L. carried out the data processing. All authors read and approved the final manuscript.

Funding

This research was funded by the National Natural Science Foundation of China under Grant 41801323.

Acknowledgments

The authors would like to thank the Corine program and Hubei Water Resources Research Institute for providing the wonderful datasets. The authors are also grateful to the editors and referees for their constructive criticism on this paper.

Conflicts of Interest

The authors declare no conflicts of interest.

References

  1. Foley, J.A.; DeFries, R.; Asner, G.P.; Barford, C.; Bonan, G.; Carpenter, S.R.; Chapin, F.S.; Coe, M.T.; Daily, G.C.; Gibbs, H.K. Global consequences of land use. Science 2005, 309, 570–574. [Google Scholar] [CrossRef] [PubMed]
  2. Running, S.W.; Nemani, R.R.; Heinsch, F.A.; Zhao, M.; Reeves, M.; Hashimoto, H. A continuous satellite-derived measure of global terrestrial primary production. Bioscience 2004, 54, 547–560. [Google Scholar] [CrossRef]
  3. Lambin, E.F.; Turner, B.L.; Geist, H.J.; Agbola, S.B.; Angelsen, A.; Bruce, J.W.; Coomes, O.T.; Dirzo, R.; Fischer, G.; Folke, C. The causes of land-use and land-cover change: Moving beyond the myths. Glob. Environ. Chang. 2001, 11, 261–269. [Google Scholar] [CrossRef]
  4. Foody, G.M. Status of land cover classification accuracy assessment. Remote Sens. Environ. 2002, 80, 185–201. [Google Scholar] [CrossRef]
  5. Shi, W. Principles of Modeling Uncertainties in Spatial Data and Spatial Analyses; CRC Press: Boca Raton, FL, USA, 2009. [Google Scholar]
  6. McRoberts, R.E.; Stehman, S.V.; Liknes, G.C.; Næsset, E.; Sannier, C.; Walters, B.F. The effects of imperfect reference data on remote sensing-assisted estimators of land cover class proportions. ISPRS J. Photogramm. Remote Sens. 2018, 142, 292–300. [Google Scholar] [CrossRef]
  7. Griffith, D.; Chun, Y. Spatial autocorrelation and uncertainty associated with remotely-sensed data. Remote Sens. 2016, 8, 535. [Google Scholar] [CrossRef]
  8. Zhang, Q.; Zhang, P. An Uncertainty Descriptor for Quantitative Measurement of the Uncertainty of Remote Sensing Images. Remote Sens. 2019, 11, 1560. [Google Scholar] [CrossRef]
  9. Comber, A.; Fisher, P.; Brunsdon, C.; Khmag, A. Spatial analysis of remote sensing image classification accuracy. Remote Sens. Environ. 2012, 127, 237–246. [Google Scholar] [CrossRef] [Green Version]
  10. Löw, F.; Knöfel, P.; Conrad, C. Analysis of uncertainty in multi-temporal object-based classification. ISPRS J. Photogramm. Remote Sens. 2015, 105, 91–106. [Google Scholar] [CrossRef]
  11. Olofsson, P.; Foody, G.M.; Herold, M.; Stehman, S.V.; Woodcock, C.E.; Wulder, M.A. Good practices for estimating area and assessing accuracy of land change. Remote Sens. Environ. 2014, 148, 42–57. [Google Scholar] [CrossRef]
  12. Shi, W.; Zhang, X.; Hao, M.; Shao, P.; Cai, L.; Lyu, X. Validation of land cover products using reliability evaluation methods. Remote Sens. 2015, 7, 7846–7864. [Google Scholar] [CrossRef]
  13. Yang, H.; Li, S.; Chen, J.; Zhang, X.; Xu, S. The standardization and harmonization of land cover classification systems towards harmonized datasets: A review. ISPRS Int. J. Geo-Inf. 2017, 6, 154. [Google Scholar] [CrossRef]
  14. Tsendbazar, N.-E.; De Bruin, S.; Fritz, S.; Herold, M. Spatial accuracy assessment and integration of global land cover datasets. Remote Sens. 2015, 7, 15804–15821. [Google Scholar] [CrossRef]
  15. Neumann, K.; Herold, M.; Hartley, A.; Schmullius, C. Comparative assessment of CORINE2000 and GLC2000: Spatial analysis of land cover data for Europe. Int. J. Appl. Earth Obs. Geoinf. 2007, 9, 425–437. [Google Scholar] [CrossRef]
  16. Hansen, M.C.; Reed, B. A comparison of the IGBP DISCover and University of Maryland 1 km global land cover products. Int. J. Remote Sens. 2000, 21, 1365–1373. [Google Scholar] [CrossRef]
  17. Chen, J.; Chen, J.; Liao, A.; Cao, X.; Chen, L.; Chen, X.; He, C.; Han, G.; Peng, S.; Lu, M. Global land cover mapping at 30 m resolution: A POK-based operational approach. ISPRS J. Photogramm. Remote Sens. 2015, 103, 7–27. [Google Scholar] [CrossRef]
  18. Jin, S.; Yang, L.; Zhu, Z.; Homer, C. A land cover change detection and classification protocol for updating Alaska NLCD 2001 to 2011. Remote Sens. Environ. 2017, 195, 44–55. [Google Scholar] [CrossRef]
  19. Congalton, R.; Gu, J.; Yadav, K.; Thenkabail, P.; Ozdogan, M. Global land cover mapping: A review and uncertainty analysis. Remote Sens. 2014, 6, 12070–12093. [Google Scholar] [CrossRef]
  20. Herold, M.; Woodcock, C.E.; Di Gregorio, A.; Mayaux, P.; Belward, A.S.; Latham, J.; Schmullius, C.C. A joint initiative for harmonization and validation of land cover datasets. IEEE Trans. Geosci. Remote Sens. 2006, 44, 1719–1727. [Google Scholar] [CrossRef]
  21. Vancutsem, C.; Marinho, E.; Kayitakire, F.; See, L.; Fritz, S. Harmonizing and combining existing land cover/land use datasets for cropland area monitoring at the African continental scale. Remote Sens. 2013, 5, 19–41. [Google Scholar] [CrossRef]
  22. Herold, M.; Mayaux, P.; Woodcock, C.; Baccini, A.; Schmullius, C. Some challenges in global land cover mapping: An assessment of agreement and accuracy in existing 1 km datasets. Remote Sens. Environ. 2008, 112, 2538–2556. [Google Scholar] [CrossRef]
  23. Giri, C.; Zhu, Z.; Reed, B. A comparative analysis of the Global Land Cover 2000 and MODIS land cover data sets. Remote Sens. Environ. 2005, 94, 123–132. [Google Scholar] [CrossRef]
  24. Pérez-Hoyos, A.; García-Haro, F.; San-Miguel-Ayanz, J. Conventional and fuzzy comparisons of large scale land cover products: Application to CORINE, GLC2000, MODIS and GlobCover in Europe. ISPRS J. Photogramm. Remote Sens. 2012, 74, 185–201. [Google Scholar] [CrossRef]
  25. McCallum, I.; Obersteiner, M.; Nilsson, S.; Shvidenko, A. A spatial comparison of four satellite derived 1 km global land cover datasets. Int. J. Appl. Earth Obs. Geoinf. 2006, 8, 246–255. [Google Scholar] [CrossRef]
  26. Yang, Y.; Xiao, P.; Feng, X.; Li, H. Accuracy assessment of seven global land cover datasets over China. ISPRS J. Photogramm. Remote Sens. 2017, 125, 156–173. [Google Scholar] [CrossRef]
  27. Pflugmacher, D.; Krankina, O.N.; Cohen, W.B.; Friedl, M.A.; Sulla-Menashe, D.; Kennedy, R.E.; Nelson, P.; Loboda, T.V.; Kuemmerle, T.; Dyukarev, E. Comparison and assessment of coarse resolution land cover maps for Northern Eurasia. Remote Sens. Environ. 2011, 115, 3539–3553. [Google Scholar] [CrossRef]
  28. Yu, L.; Qiu, P.; Liu, X.; Lu, F.; Wan, B. A holistic approach to aligning geospatial data with multidimensional similarity measuring. Int. J. Digit. Earth 2018, 11, 845–862. [Google Scholar] [CrossRef]
  29. Rajbhandari, S.; Aryal, J.; Osborn, J.; Lucieer, A.; Musk, R. Leveraging machine learning to extend Ontology-Driven Geographic Object-Based Image Analysis (O-GEOBIA): A case study in forest-type mapping. Remote Sens. 2019, 11, 503. [Google Scholar] [CrossRef]
  30. Gu, H.; Li, H.; Yan, L.; Liu, Z.; Blaschke, T.; Soergel, U. An object-based semantic classification method for high resolution remote sensing imagery using ontology. Remote Sens. 2017, 9, 329. [Google Scholar] [CrossRef]
  31. Sánchez, D.; Batet, M.; Isern, D.; Valls, A. Ontology-based semantic similarity: A new feature-based approach. Expert Syst. Appl. 2012, 39, 7718–7728. [Google Scholar] [CrossRef]
  32. Feng, C.-C.; Flewelling, D.M. Assessment of semantic similarity between land use/land cover classification systems. Comput. Environ. Urban. Syst. 2004, 28, 229–246. [Google Scholar] [CrossRef]
  33. Ahlqvist, O. Extending post-classification change detection using semantic similarity metrics to overcome class heterogeneity: A study of 1992 and 2001 US National Land Cover Database changes. Remote Sens. Environ. 2008, 112, 1226–1241. [Google Scholar] [CrossRef]
  34. Xu, Q. Modelling Semantic Uncertainty of Land Classification System. Ph.D. Thesis, The Hong Kong Polytechnic University, Hong Kong, China, 2016. [Google Scholar]
  35. CORINE Land Cover—Contents. Available online: http://www.eea.europa.eu/publications/COR0-landcover (accessed on 1 January 1995).
  36. GLC30 Information Service. Available online: http://www.globallandcover.com (accessed on 21 February 2017).
  37. Zhang, Z.; Wang, X.; Zhao, X.; Liu, B.; Yi, L.; Zuo, L.; Wen, Q.; Liu, F.; Xu, J.; Hu, S. A 2010 update of National Land Use/Cover Database of China at 1: 100000 scale using medium spatial resolution satellite images. Remote Sens. Environ. 2014, 149, 142–154. [Google Scholar] [CrossRef]
  38. Tversky, A. Features of similarity. Psychol. Rev. 1977, 84, 327. [Google Scholar] [CrossRef]
  39. Shannon, C.E.; Weaver, W. The Mathematical Theory of Communication; University of Illinois Press: Champaign, IL, USA, 1998. [Google Scholar]
  40. Gong, M.; Zhan, T.; Zhang, P.; Miao, Q. Superpixel-based difference representation learning for change detection in multispectral remote sensing images. IEEE Trans. Geosci. Remote Sens. 2017, 55, 2658–2673. [Google Scholar] [CrossRef]
  41. Zhang, X.; Shi, W.; Liang, P.; Hao, M. Level set evolution with local uncertainty constraints for unsupervised change detection. Remote Sens. Lett. 2017, 8, 811–820. [Google Scholar] [CrossRef]
  42. Lv, Z.; Liu, T.; Zhang, P.; Benediktsson, J.A.; Lei, T.; Zhang, X. Novel Adaptive Histogram Trend Similarity Approach for Land Cover Change Detection by Using Bitemporal Very-High-Resolution Remote Sensing Images. IEEE Trans. Geosci. Remote Sens. 2019, 1–21. [Google Scholar] [CrossRef]
  43. Haralick, R.M.; Shanmugam, K.; Dinstein, I.H. Textural features for image classification. IEEE Trans. Syst. Man Cybern. 1973, 610–621. [Google Scholar] [CrossRef]
  44. Shao, P.; Shi, W.; He, P.; Hao, M.; Zhang, X. Novel approach to unsupervised change detection based on a robust semi-supervised FCM clustering algorithm. Remote Sens. 2016, 8, 264. [Google Scholar] [CrossRef]
  45. Krinidis, S.; Chatzis, V. A robust fuzzy local information C-means clustering algorithm. IEEE Trans. Image Process. 2010, 19, 1328–1337. [Google Scholar] [CrossRef]
Figure 1. Classification systems in the experimental datasets: (a) National Land Survey (NLS); (b) Provincial Water and Soil Conservation Survey (PWSCS); (c) Corine Land Cover (CLC); (d) GlobeLand30.
Remotesensing 11 02509 g001
Figure 2. Datasets used in the study. Images showing land use/cover (LUC) patches in Dataset 1 on (a) 1 October 2016 and (b) 26 June 2018; Dataset 2 on (c) 1 October 2016 and (d) 26 June 2018; Dataset 3 on (e) 30 August 2000 and (f) 9 August 2018; and Dataset 4 on (g) 30 August 2000 and (h) 9 August 2018.
Remotesensing 11 02509 g002aRemotesensing 11 02509 g002b
Figure 3. General framework of the proposed uncertainty assessment schema.
Remotesensing 11 02509 g003
Figure 4. Integrated representative semantic features based on the dynamic semantic reference system (DSRS): example of vegetation classes.
Remotesensing 11 02509 g004
Figure 5. Sankey diagram showing the semantic translation probability (a) from NLS to PWSCS, and (b) from CLC to GlobeLand30.
Remotesensing 11 02509 g005
Figure 6. Normalized semantic translation uncertainty results (a) from NLS to PWSCS, and (b) from CLC to GlobeLand30.
Remotesensing 11 02509 g006
Figure 7. Spatial distribution of the final uncertainty in (a) Dataset 1 and (b) Dataset 2, and violin plots of errored and non-errored patches in Datasets 1 and 2 showing (c) patch label uncertainty and (d) image change probability.
Remotesensing 11 02509 g007
Figure 8. Spatial distribution of final uncertainty in (a) Dataset 3 and (b) Dataset 4, and violin plots of errored and non-errored patches in Datasets 3 and 4 showing (c) patch label uncertainty and (d) image change probability.
Remotesensing 11 02509 g008
Figure 9. Reliability evaluation of different error types: (a,b) total error rate (TER) and uncertainty contribution rate (UCR) of Datasets 1 and 2; (c,d) TER and UCR of Datasets 3 and 4.
Remotesensing 11 02509 g009
Figure 10. UCR curve with respect to different thresholds of the test datasets.
Remotesensing 11 02509 g010
Figure 11. The curve of TER changes with respect to different thresholds of the test datasets.
Remotesensing 11 02509 g011
Figure 12. Two examples showing exceptional situations of uncertainty assessment that were validated through field surveys and auxiliary data: (a) example from Dataset 1; (b) example from Dataset 3.
Remotesensing 11 02509 g012
Table 1. Reliability of the final maps in the datasets. TER—total error rate; UCR—uncertainty contribution rate.
AT (km2)AU (km2)AE (km2)TERUCR
Dataset 1178.9936.394.602.57%12.64%
Dataset 2341.0139.891.650.48%4.13%
Dataset 34605.223702.00365.197.93%10.31%
Dataset 44603.844280.80204.304.44%5.52%

