Article

The Impact of EU Grants Absorption on Land Cover Changes—The Case of Poland

Faculty of Geographical Sciences, University of Lodz, Kopcińskiego31, 90-142 Łódź, Poland
*
Author to whom correspondence should be addressed.
Remote Sens. 2019, 11(20), 2359; https://doi.org/10.3390/rs11202359
Submission received: 11 September 2019 / Revised: 6 October 2019 / Accepted: 9 October 2019 / Published: 11 October 2019

Abstract

:
The main goal of the paper is to verify the impact of the absorption of European Union (EU) grants on land cover changes in Polish municipalities in the years 2012–2018. The selection of the research area was justified by the fact that Poland is the largest and significantly spatially differentiated transition economy in Central-Eastern Europe, recognised as a substantial beneficiary of EU accession in 2004. The time range of analysis was set as the result of a comparison of data availability in Corine Land Cover (CLC) and Statistics Poland. The CLC dataset referring to land cover and land use changes between 2012 and 2018 was used. The focus on modifications taking place within one of the main land cover groups at level 3 of detail was applied in this research. These changes were analysed as percentages referring to the area of the municipality and to the total area of changes in the investigated period. Two categories of EU grants were considered: total and infrastructural (granted under EU Operational Programme “Infrastructure and Environment”). Moreover, some control economic, social, demographic, institutional, infrastructural, and environmental variables were applied to better explain land cover changes. Moran’s local statistic was employed to detect spatial hot-spots of EU grants absorption, as well as hot-spots of land cover changes. Then, a collection of various variables related to determinants of land cover changes was set. Economic factors, including EU grants absorption, as well as factors related to accessibility, agrarian structure, demography, environment, and spatial planning were investigated. Principal Component Analysis (PCA) was employed to convert the set of all considered variables into a set of few uncorrelated predictors. Finally, Geographically Weighted Regression (GWR) was applied to describe the spatially varied impact of investigated determinants, including EU grants, represented by estimated principal components on land cover changes.

Graphical Abstract

1. Introduction

The main purpose of this research is to identify the impact of spatially varying absorption of EU funds on land cover changes in Polish municipalities in the years 2012–2018. Many studies done in different parts of the world have shown that land cover changes can be caused by many different factors, such as fast consumption of natural resources, urbanisation processes, or agricultural policies [1,2]. Studies on land cover changes are a key element in understanding the relations between anthropogenic factors and the natural environment changes [3]. It needs to be emphasised that contemporary science tends to use GIS tools for analysis of land cover changes [4,5,6,7,8]. On the other hand, different types of regression methods are used for simulating and forecasting land cover changes [9,10,11,12,13,14].
The absorption of EU funds and its impact on the economic growth and convergence of the regions has already been widely discussed in literature [15,16,17,18]. Interestingly, the results of the present research shows contradictory evidence of the impact of EU funds on the economic growth of the regions [19]. The access to EU funds became an important determinant of the economic development of Poland after its EU accession in 2004 [20]. There have been several important studies reviewing the effectiveness of EU funds in different regions of Poland [21,22,23,24]. However, these studies do not put appropriate emphasis on the interrelation between the absorption of the EU funds and land cover or land use changes.
Since territorial cohesion is the goal of EU funds, it should be hypothesised that relatively less developed regions should be benefitted by higher EU grants absorption (mainly under the Operational Programme “Infrastructure and Environment” which covered 42.7% of total EU support during the investigated period, and was oriented mainly on infrastructural investments) and, in consequence, show larger land cover changes. Thus, the applicational goal of this research is to evaluate European spatial policy. This fits into a research niche in geographical and GIS studies. This research should prove applicable from the perspective of local and regional authorities, as the studies on land use changes are generally recognised as useful for strategic planning and spatial policies [25]. The identification of the most significant determinants of land cover changes could also become relevant to EU cohesion policy [26].
The paper is organised as follows. The section “literature review” briefly presents the review of previous works on land cover changes. The subsequent part, “methodological framework” contains a description of applied methods, data collection process, and research area. “Results” present the findings of the research. The paper is closed by “conclusions and discussions” summarising the main findings regarding the relations between land cover changes and EU funds, and confronting the present results with the ones obtained of other authors.

2. Literature Review

Land cover changes are a component of wider global geographical changes affected by many factors such as climate change, resource management, and spatial planning and policies [1,27]. Land cover changes are the result of complicated processes related to many different domains like politics, economy, culture, environment, and others [27,28,29].
The influence of socioeconomic, environmental, and demographic factors on land cover changes has already been studied by Bonilla-Moheno et al. [30]. The results indicated the impact of global economic and demographic factors on changes in land cover, mainly in forested areas. Such changes, mainly deforestation, are influenced significantly by the processes of urbanisation. Areas located close to urban centres, densely populated, and well connected to the transportation network are substantially much more exposed to land cover changes. A similar impact on deforestation has been diagnosed in areas where intensive production-oriented, medium and large farms are dominant in the agrarian structure. On the other hand, both environmental protection and agriculture based on small family-owned farms are crucial inhibitors of land cover changes [31]. Ariti et al. [32] found that most significant prohibitors of deforestation include investments, agricultural expansion and overgrazing related to population pressure, as well as inappropriate government land policy. The causes of similar land cover changes were examined by Lambin et al. [33]. They considered five classes of land cover transformation: tropical deforestation, rangeland modifications, agricultural intensification, and urbanisation. Moreover, they revealed that global economic and political factors are mainly responsible for the changes. These determinants might also strengthen or weaken local factors such as poverty or population growth. Interestingly, the impact of global processes and institutional decentralisation on land cover changes was also discussed by Wu et al. [34], who investigated the development of special economic zones in China.
Urbanisation processes in metropolitan regions are an interesting example of recent spatial patterns in land cover changes. As Alphan [35] suggested, urban sprawl negatively affects the natural environment as it reduces natural and semi-natural areas crucial for wildlife conservation and recreational activities of inhabitants. Hence, the availability of green spaces which determines the quality of urban life conditions might be significantly limited. Moreover, urbanisation results in the transformation of agricultural areas as the demand from increasing urban population for products of intensive production-oriented farming is rising. The population growth causes an increased pressure on land resources [32,35].
Research of land cover changes in Poland has become more popular and it has already been widely discussed in literature (e.g., [36,37,38,39]). Borowska-Stefańska et.al. [29] investigated land use changes on municipal level between 1990 and 2012 based on GIS tools. They noticed that changes in land cover in Poland were very intensive and involved a considerable surface of the country. These changes mainly took place within agricultural land, but also included non-agricultural areas, including artificial surfaces and forest, and semi-natural areas. Cegielska et al. [3], who investigated Lesser Poland region and Pest county in Hungary, emphasised that the most intensive anthropogenic changes identified in land cover are visible in areas near big cities. Ciołkosz et al. [40] discovered some spatial patterns of land cover changes in Poland. Woch et al. [41], who investigated rural areas in Poland, noticed the decreasing pace of changes in agricultural land into non-agricultural purposes. Interestingly, the area of agricultural land is systematically decreasing and changes mainly into forests and urban areas.
Matyka [42] emphasised that after Poland’s accession to the EU, the European Common Agricultural Policy has had an important impact on structural transformation of agriculture in the country. The dynamics and direction of change in land use are significantly influenced by intensity and marketability of agricultural production in the region. Nalej [7], who researched metropolitan areas in Poland, argued that the agricultural areas, which cover more than half of the metropolitan areas, are undergoing severe changes. The change in agricultural land cover takes place under the influence of metropolisation processes and, at the same time, are their reflection in space. Kurowska et al. [43] noticed that for land use structure formation, apart from market mechanisms, a more and more important role is played by organisational changes related to categorisation of a particular holding to or its registration with a given commune. Tokarczyk-Dorociak [44] found a noticeable increase in the share of residential, industrial and service development in the zones adjacent to the city and access roads. Łowicki [45] pointed out that differences in the economic activity of residents were the causative factors for the polarisation of landscape changes.
Based on Aguiar et al. [31] discussion, and the results of the literature review, various variables describing determinants of changes in land cover or land use were identified (Table 1). As the goal of the present research is to identify the impact of EU funds absorption on land cover changes, two additional variables describing EU grants were considered: the sum of EU support from 2012 until 2018 per square km, and the sum of EU support under the Operational Programme “Infrastructure and Environment” from 2012 until 2018 per square km.

3. Methodological Framework

3.1. Research Area

The study area of this paper is Poland, which is a state located in Central-Eastern Europe. The area of the country is about 322 thousand km2. With a population of 38.4 million people in 2017, Poland is the 6th most populated member of the EU. The capital city and the biggest metropolis is Warszawa, with a population of about 1.8 million in 2018. The gross domestic product (GDP) of Poland in 2017 was 524.5 billion USD. The neighbouring countries of Poland are Germany in the west, the Czech Republic and Slovakia in the south, Ukraine and Belarus in the east, and Lithuania and Russia (Kaliningrad Oblast) in the northeast. In the north, Poland is also bordered by the Baltic Sea.
Trying to characterise and interpret contemporary phenomena in Poland in their spatial dimension, it is necessary to emphasize the role of political changes which took place after 1989. That period saw a radical transformation of many elements of the country’s social and economic life [45,55]. Since 1989, we may talk about the political transformation and transition from centrally planned economy to a market economy [29,56]. The most important changes in Poland after 1989 directly affecting land development include: (a) the decentralisation of the political authority and economy, (b) the adjustment of legal regulations to the EU standards, and (c) obtaining access to structural funds and agricultural subsidies of the European Union when Poland joined the EU [40,57,58]. At the beginning of 1990s, the privatisation process, applied together with returns of assets appropriated in the communist period, influenced a diversification of agricultural land use forms and ownership [59]. After the accession of Poland to the EU in 2004, regional policy changes have been introduced, due to the availability of much higher amounts of money spent for this purpose [21]. Access to EU structural funds has become an important factor in the economic development of Poland [20,23].
The division of Poland into the smallest administrative units (municipalities) was applied in this study. The reason for this choice was the accessibility of statistical data on EU fund expenditures. As a result of the decentralisation process in Poland, a new division has been created. Since the beginning of 1999, the administrative division of Poland has been based on 3 levels of subdivision [20,60]. The country is divided into 16 regions (PL województwo), 379 counties (PL powiat) including 65 cities, and 2479 municipalities (PL gmina). To the best of our knowledge, there has not been any research on the relations between EU funds and land cover changes in municipalities in Poland. Once again, it is crucial to emphasise that we focused on the period between 2012 and 2018.

3.2. Data Collection

Data from Corine Land Cover (CLC), provided by Copernicus Land Monitoring Services (2019), set from 2012 and 2018 in Poland were used. CLC is a vector database with polygon topology that stores European data concerning land cover. It was created based on satellite images. The minimum discreet area is 25 ha, with a minimum width of 100 m, which corresponds to a map precision of 1:100,000. Forms of land cover distinguished in the CLC were divided into 3 levels. The first one comprises 5 main types of land cover, such as: (a) artificial surfaces, (b) agricultural areas, (c) forest and semi natural areas, (d) wetlands, (e) water bodies. The second level includes 15 forms of land cover, while the third level consists of 44 classes, 31 of which can be found in Poland. To investigate land cover changes, CLC-Change 2012–2018 dataset was used. The CLC-Change database was created by mapping real changes with a minimum area of 5 ha and a width of at least 100 m visible on satellite images. Changes within an area of over 25 ha were automatically entered into the database, changes with a smaller area were generalized in accordance with the priority adopted in the project. Changes were considered for land cover classes at the 3rd level of detail and two categories were distinguished: transformations, namely, the changes of land cover classes into areas belonging, according to CLC classification, to the other main type of land cover and modifications into other land cover classes within one main land cover type. The changes were analysed as percentages referring to the area of the municipality and to the total area of changes in the investigated period. Areas of land cover change included 1.1% of the territory of Poland. Modifications accounted for 76.3% and transformations for 23.7% of the total area of changes (respectively 0.8% and 0.3% of Poland’s area). The modifications, due to their dominance were applied in this research as changes.
The statistical material used in the study came from several sources. Most data were obtained from the Local Data Bank (Statistics Poland, 2019) which is the largest Polish database on economy, society and the environment, providing data for territorial division units, in this case for municipalities. It was a source of demographic data such as population in years 2012 and 2018, and density of population in 2018. It also provided economic data, in particular the number of enterprises and municipal incomes in 2018 and the amount of EU funds obtained in years 2012 and 2018 as the value of all signed agreements for co-financing with additional distinction of the Operational Programme “Infrastructure and Environment”. It must be emphasized that the data on the amount of EU funds obtained by municipalities during the investigated period relate to the real spatial allocation of mentioned funds. Moreover, data on environmental protection, including the surface of protected areas in the year 2018 were obtained from the Local Data Bank. Unfortunately, not all data were available for the study period. Data on the agrarian structure, including the number of farms, their area and farm animal population came from the 2010 agricultural census. These numbers were the basis for determining the variables referring to demography, economics, agrarian structure and environment. The variables were designated mainly by referring data values to the areas of municipalities, but also by determining average values or the inequality of data values from different ones.
Another rich source of data used in the analysis was The Head Office of Geodesy and Cartography (2019), which gathers data sets from the State Surveying and Cartographic Resource. These resources include, among others: State Register of Borders, Land and Building Registration, Numerical Terrain Model or the Database of Topographic Object. The State Register of Borders provides information on the borders and the area of territorial division units in Poland, including the territorial units chosen for the analysis—the municipalities. Based on the Land and Building Records and Numerical Terrain Model with a grid interval of at least 100 m, information of the area of cadastral plots and terrain was obtained. Those data were valid for the year 2019 and allowed us to determine variables concerning environment and spatial planning, respectively, as the average plot size and declines for each municipality.
A lot of information came from the Database of Topographic Object at the level of data accuracy and detail of topographic maps of 1:10,000. This resource is a spatial database containing information about spatial location and descriptive attributes of topographic objects valid for the year 2016. The resource was created based on the vectorisation of a digital orthophoto map, direct measurements and a number of registers kept by public institutions. From the Database Topographic of Objects, information about the location of topographic objects such as: cities, roads, railway stations, ports and airports, as well as buildings was acquired. This was the basis for determining variables related to accessibility or spatial planning calculated as distance from the centroid of each municipality to selected topographic objects, or as density of objects. Only data on annual precipitation for years 2012–2018 were obtained from the Institute of Meteorology and Water Management in the form of maps, while values assigned to each of the municipalities served as variables related to the environment.

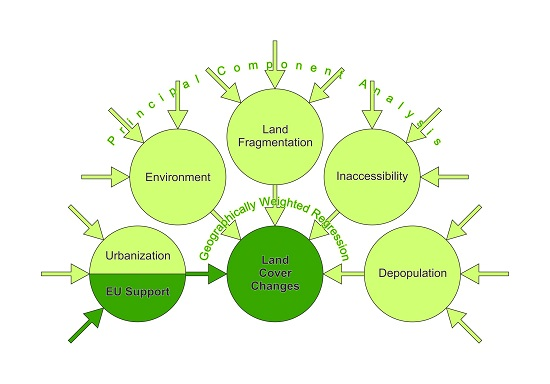
3.3. Methods of Analysis

Local Moran’s I statistic was used to discover spatial hot spots and cold spots of two investigated phenomena across Poland in the years 2012–2018, namely, land cover changes and absorption of EU funds. Local Moran’s I statistic is a local indicator of spatial association. This is the technique of exploratory spatial data analysis [61]. The technique enables the procedure of spatial cluster identification within every investigated municipality, but also in its surroundings. The estimation of local Moran’s I statistic in every j investigated municipality should be expressed as follows [62]:
I j = ( x j x ¯ ) i = 1 k w j i ( x i x ¯ ) i = 1 k ( x i x ¯ ) 2 k
where xj represents a value of the particular variable in j municipality, xi equals the value of the same variable in every i of k surrounding municipalities, and wji equals the element of weight matrix of neighbourhood type between municipalities j and i (1 when j and i are identified as neighbours, and 0 when they are not) [62]. Local Moran’s I statistics range between +1 and −1. The closer to +1 in particular j municipality the value of the local Moran’s I statistic, the more significant the positive spatial cluster (hot spot when a high value is surrounded by high ones, or cold spot when a low value is surrounded by low ones). On the other hand, the closer to −1 this value is, the more significant the negative spatial cluster (high value surrounded by low ones, or low value surrounded by high ones) [61].
Principal Component Analysis (PCA) was applied to convert the set of all d values considered, possibly correlated determinants (including absorption of EU funds) of land cover changes into the set of few uncorrelated predictors called principal components [63,64,65]. Before running PCA, all investigated X variables representing determinants of land cover changes were pre-processed to standardise their mean and variance to enable all variables to be treated on the same scale [66]. Then, the R covariance matrix of Z standardised values of every investigated X land cover change determinant in n municipalities was estimated:
R = 1 n Z T Z
Using iterative methods of computation, the λ eigenvalues of the R covariance matrix were estimated:
d e t | R λ I | = 0
where I refers to identity matrix. Then, the eigenvectors corresponding to the above eigenvalues were calculated, and sorted by decreasing eigenvalues. P number of eigenvectors with the largest eigenvalues were selected to form the d × P dimensional matrix W. Finally, PComp matrix containing values of every considered principal component was estimated:
P C o m p = Z W
Geographically Weighted Regression (GWR) is the core method of analysis applied in this study. It was used to estimate the impact of all considered predictors on land cover changes in Polish municipalities, diagnosed in the years 2012–2018. The results were compared with traditional Ordinary Least Square (OLS) modelling which assumes that patterns in data are spatially constant [67]. However, OLS regression allowed global analysis of investigated impact of P selected principal components on land cover changes, and might be expressed as:
L a n d C o v e r C h a n g e s = I n t e r c e p t + i = 1 P C o e f f i P C o m p i + E r r o r
On the other hand, GWR enabled local models for every j Polish municipality described by geographical coordinates Long, and Lat. GWR allowed us to estimate local spatial patterns of various impacts on land cover changes, and solved the issue of inability of global statistics to explore spatial variations in relationships between investigated variables [68]. Thus, it was possible to find where and how (in terms of significance and value) land cover changes were influenced by each considered principal component. The mentioned impact might be expressed as:
L a n d C o v e r C h a n g e s j = I n t e r c e p t ( L o n g j , L a t j ) + i = 1 P C o e f f i ( L o n g j , L a t j ) P C o m p i + E r r o r
When estimating local models in every j municipality, GWR applies the weighted distance decay function w, also called kernel function, to find the h bandwidth for every k municipality spatially distributed around the j location to be included in the calculations [48,67]. The weight applied for each local model depends on the distance d between considered j location and every k surrounding observation. The closer the observation is located, the more significant its impact on the estimation:
w j k = ( d j k 2 h 2 ) e
The weight of observations located further than the bandwidth from considered location is equal to zero [48,69]. It needs to be explained that GWR is based on Euclidean distance between the centroids of polygons, e.g., municipalities [70]. Regarding suggestions of Brown et al. [67], the corrected Akaike information criterion was applied to delimit optimal bandwidth. The resulting bandwidth is adaptative: smaller where observations are located densely and larger when sparsely. It is argued that the adaptive bandwidth offers a more desirable assessment than a fixed one [71].
A map of local coefficients of determination, and maps of values and significance of estimated local parameters of independent variables are the basic results of GWR implementation [70,72,73]. Maps of local coefficients of determination allow us to identify how well local models fit the observations. Maps of estimated values of local parameters present spatially varying impact of investigated selected principal components on land cover changes. Finally, maps of values of t-Student tests for mentioned parameters refer to statistical significance of identified impact of each principal component on land cover changes. It needs to be emphasised that spatial differentiation of identified impacts might be substantial: positive impacts can be identified for particular locations, and negative for others [74]. Before estimating GWR, the problem of multicollinearity needs to be discussed. The issue of local multicollinearity might occur where the values of particular predictors are spatially clustered. Thus, the condition number for data matrix was estimated. If the condition number is greater than 30, local collinearity results in unreliable coefficient estimates [75].

4. Results

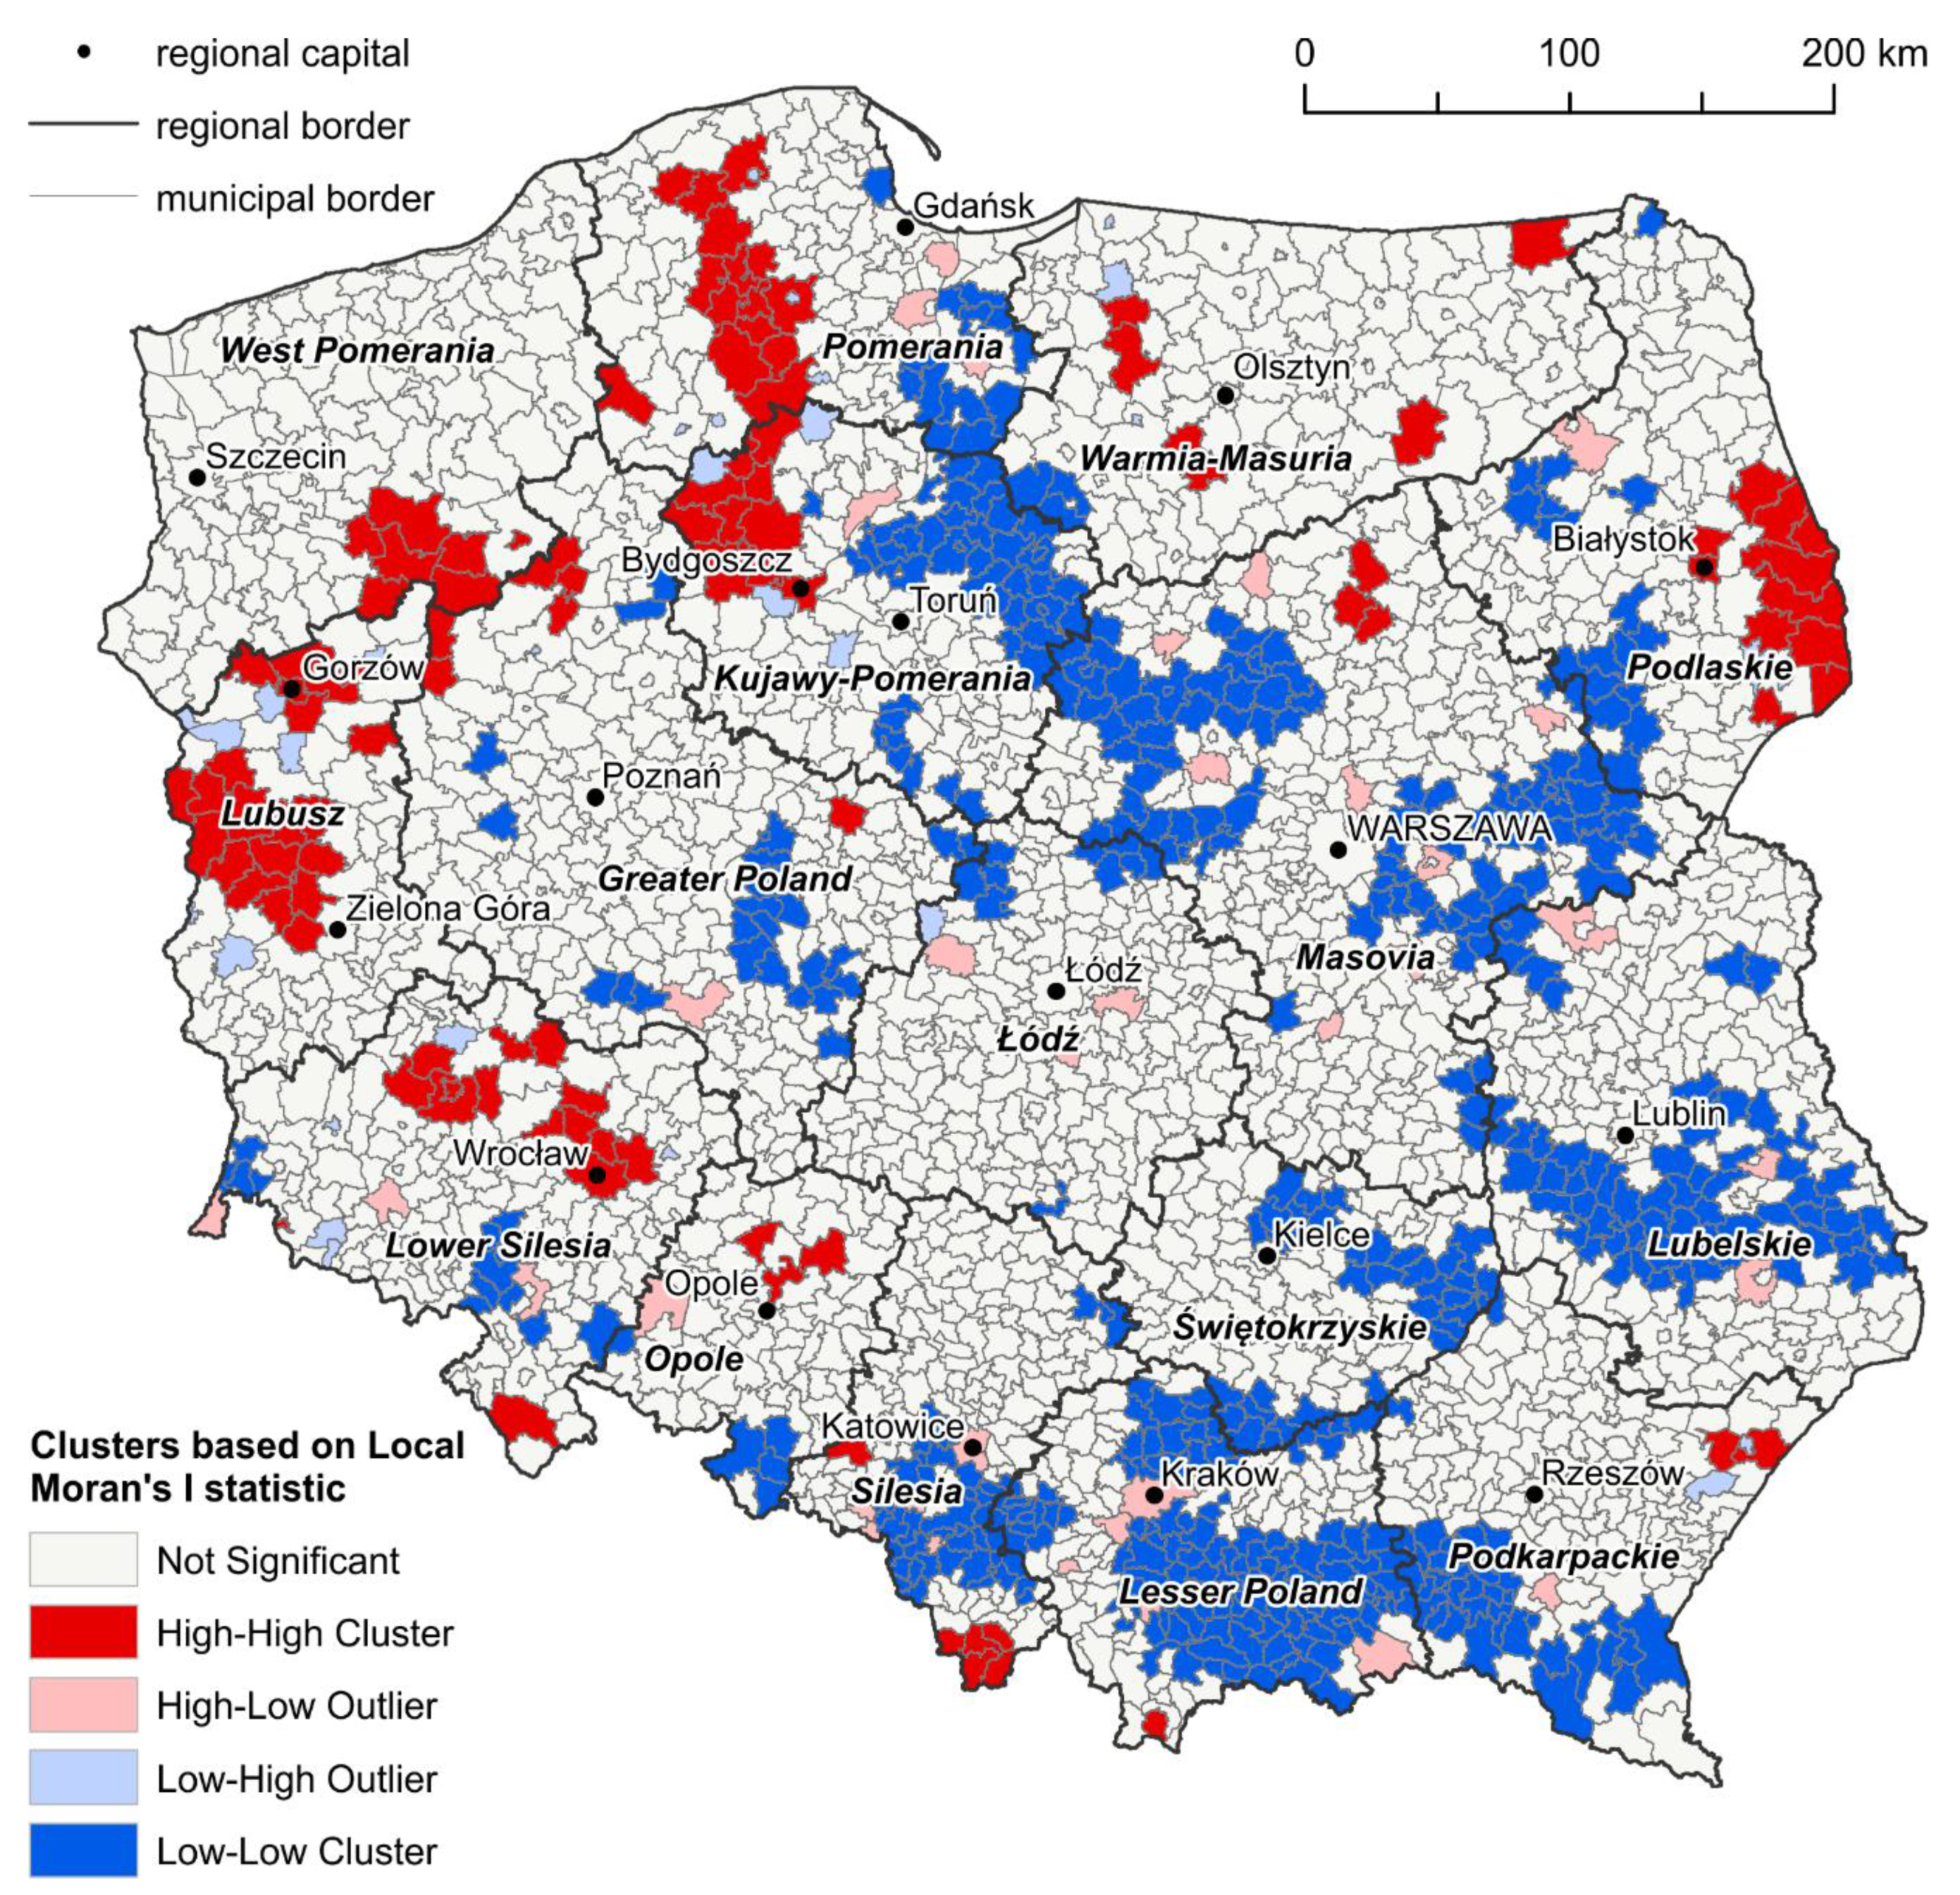
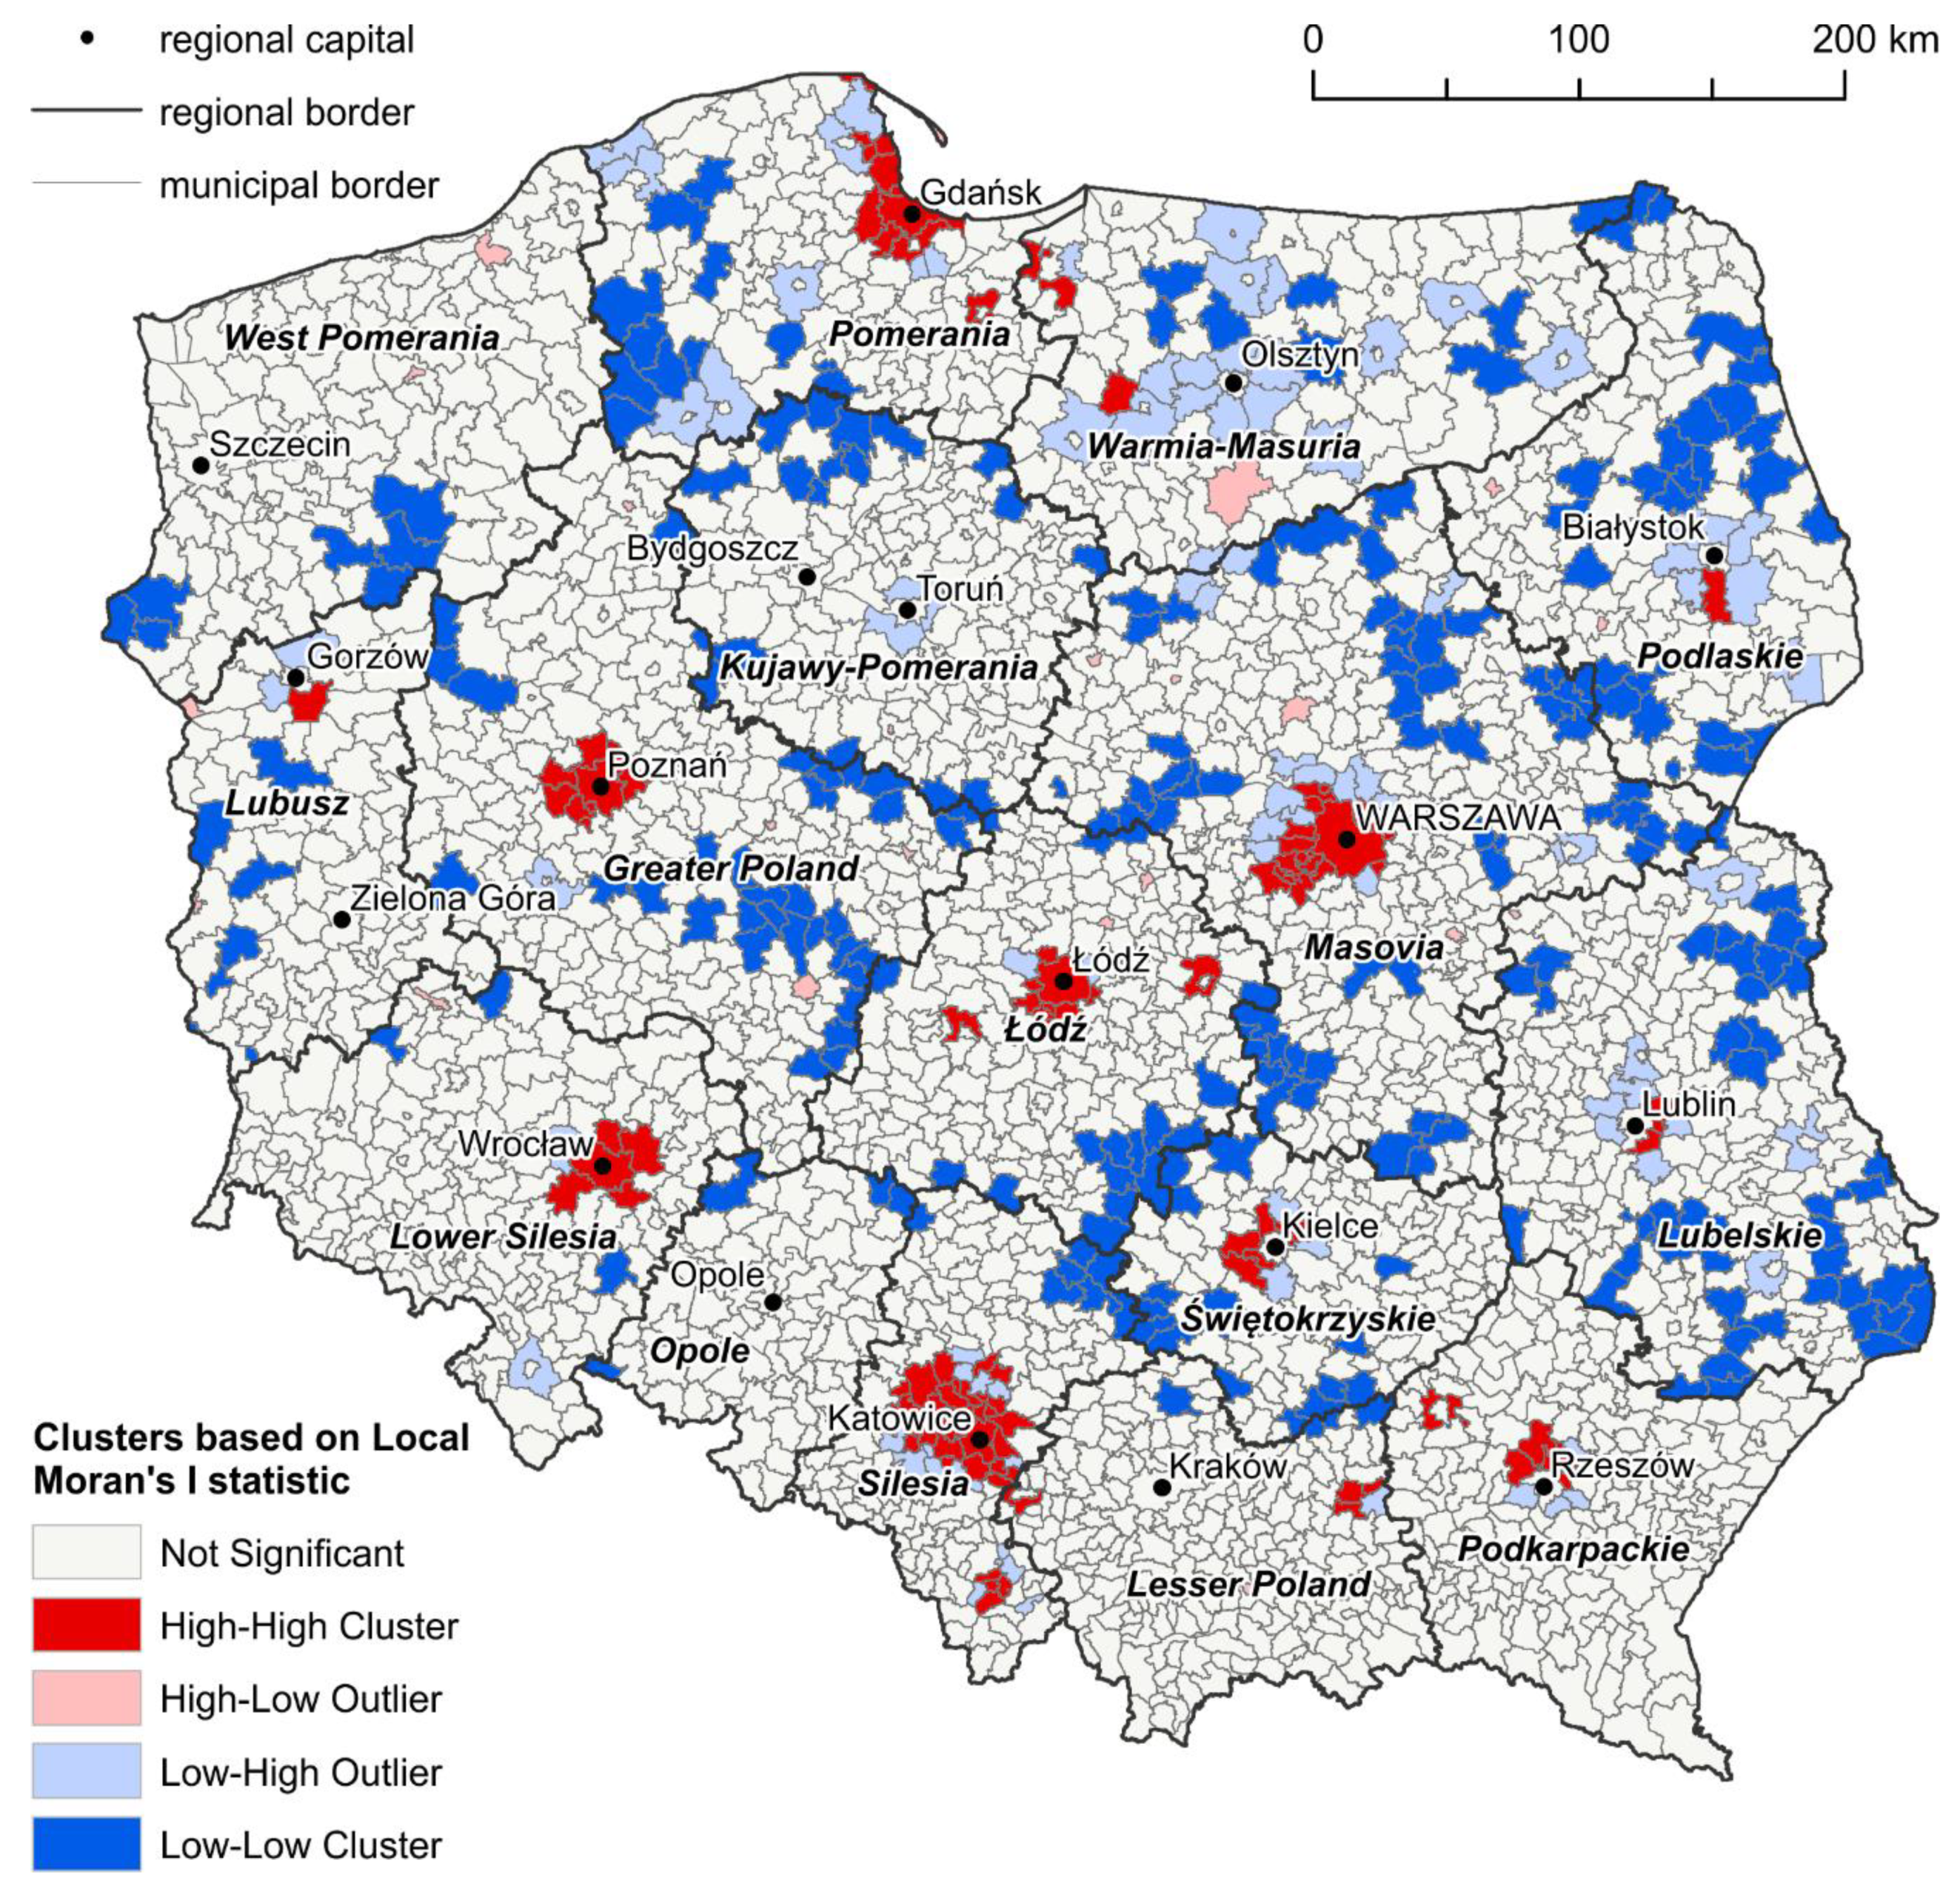
4.1. Hot Spots and Cold Spots of Land Cover Changes and EU Support

Moran’s I statistic was applied to identify hot spots and cold spots of the following investigated variables: land cover changes (Figure 1), total EU support (Figure 2), and EU support under the “Infrastructure and Environment” Operational Programme (Figure 3). Four areas of significant land cover changes need to distinguished: highly forested and relatively sparsely populated area extending from Lubusz Lake District to Central Pomerania in the north-west part of Poland, Podlaskie characterised by similar attributes, located in the north-east, the metropolitan area of Wrocław in the south-west, and the mountain region of Beskid Śląski and Beskid Żywiecki in the south. On the other hand, few clusters of very limited land cover changes were identified: the large rural area extending from Chełmno Lake District to the west part of Masovia region, the east part of Masovia, and few clusters located in the south-east of Poland, mainly in the region of Kielce, Kraków, Lublin, and Rzeszów. Interestingly, the mining region of Upper Silesia was also identified as a significant cluster of limited land cover changes.
Amount of EU support per area of investigated Polish municipalities is spatially varying (Figure 2). Most of the metropolitan areas of the biggest Polish cities were recognised as hot spots of spatial distribution of total EU support per square km. It is not surprising that EU support follows the spatial distribution of population. Interestingly, areas characterised by significantly reduced support from the EU are located mainly in the regional peripheries. Clusters of low EU support are located along regional borders. It needs to be stressed that regional authorities are responsible for the distribution of a significant part of EU funds. Thus, less interest of regional authorities in peripheral areas needs to be emphasised. Similar findings resulted from the analysis of spatial distribution of EU support under the “Infrastructure and Environment” Operational Programme (Figure 3). However, regarding infrastructural context of EU support, initiatives and projects in eastern part of Poland seem to be generally less funded.

4.2. Determinants of Land Cover Changes

Analysis of degree of explained variance by best principal components allowed us to set the number of components to be included for further consideration as five. It needs to be emphasised that a cumulative proportion of variance of all investigated variables explained by five principal components equals 64.7%. The proportion of variance of the first principal component equals 32.0%, second—10.8%, third—8.1%, fourth—7.3%, and fifth—6.4%.
The contribution of original determinants of land cover changes to principal components was analysed (Table 2). The first component is contributed to mainly by the following factors: density of roads, population density, sum of total EU support from 2012 until 2018 per square km, commune income per square km, density of enterprises, and density of buildings. Moreover, the contribution of EU support under the “Infrastructure and Environment” Operational Programme was identified as significant as well. All mentioned variables contributed to the component positively. Regarding the identified contributing variables, the first principal component was recognised as “urbanisation and EU support”. The second component is influenced mainly and positively by the following determinants: average slope, annual average precipitation, and protected areas per square km. A negative impact of breeding was identified as well. Regarding identified contributing variables, the second principal component was recognised as “environment”. Two following variables are the most substantial contributors of the third component: average farm size, and average plot size. It needs to be emphasised that the contribution of variables to the discussed component is recognised as negative. “Land fragmentation” was proposed as the name for the third component. The fourth component is contributed to by the following factors: distance to the closest airport or seaport, distance to the closest railway station, and distance to the closest capital of region. Regarding the character and negative impact of all contributing variables, “inaccessibility” was suggested as the name of the fourth component. Finally, the fifth principal component was influenced mainly and negatively by changes in population potential. Thus, it is suggested to name this component “depopulation”. However, the negative contribution of distance to the closest main road, and the sum of EU support under the “Infrastructure and Environment” Operational Programme needs to be emphasised as well.
From the perspective of the goal of this paper, the identification of influence of the first and fifth components will be crucial. Interestingly, urbanisation and EU grants absorption were identified as correlated. Thus, most populated and developed municipalities are recognised as benefitting most from EU grants, mainly the metropolitan areas of the biggest Polish cities. However, it needs to be reiterated that relative values (related to the area) of all mentioned variables were considered. It is logical that EU support focuses on residents rather than their areas. On the other hand, the most attractive regions regarding economic development are also the most populated ones.

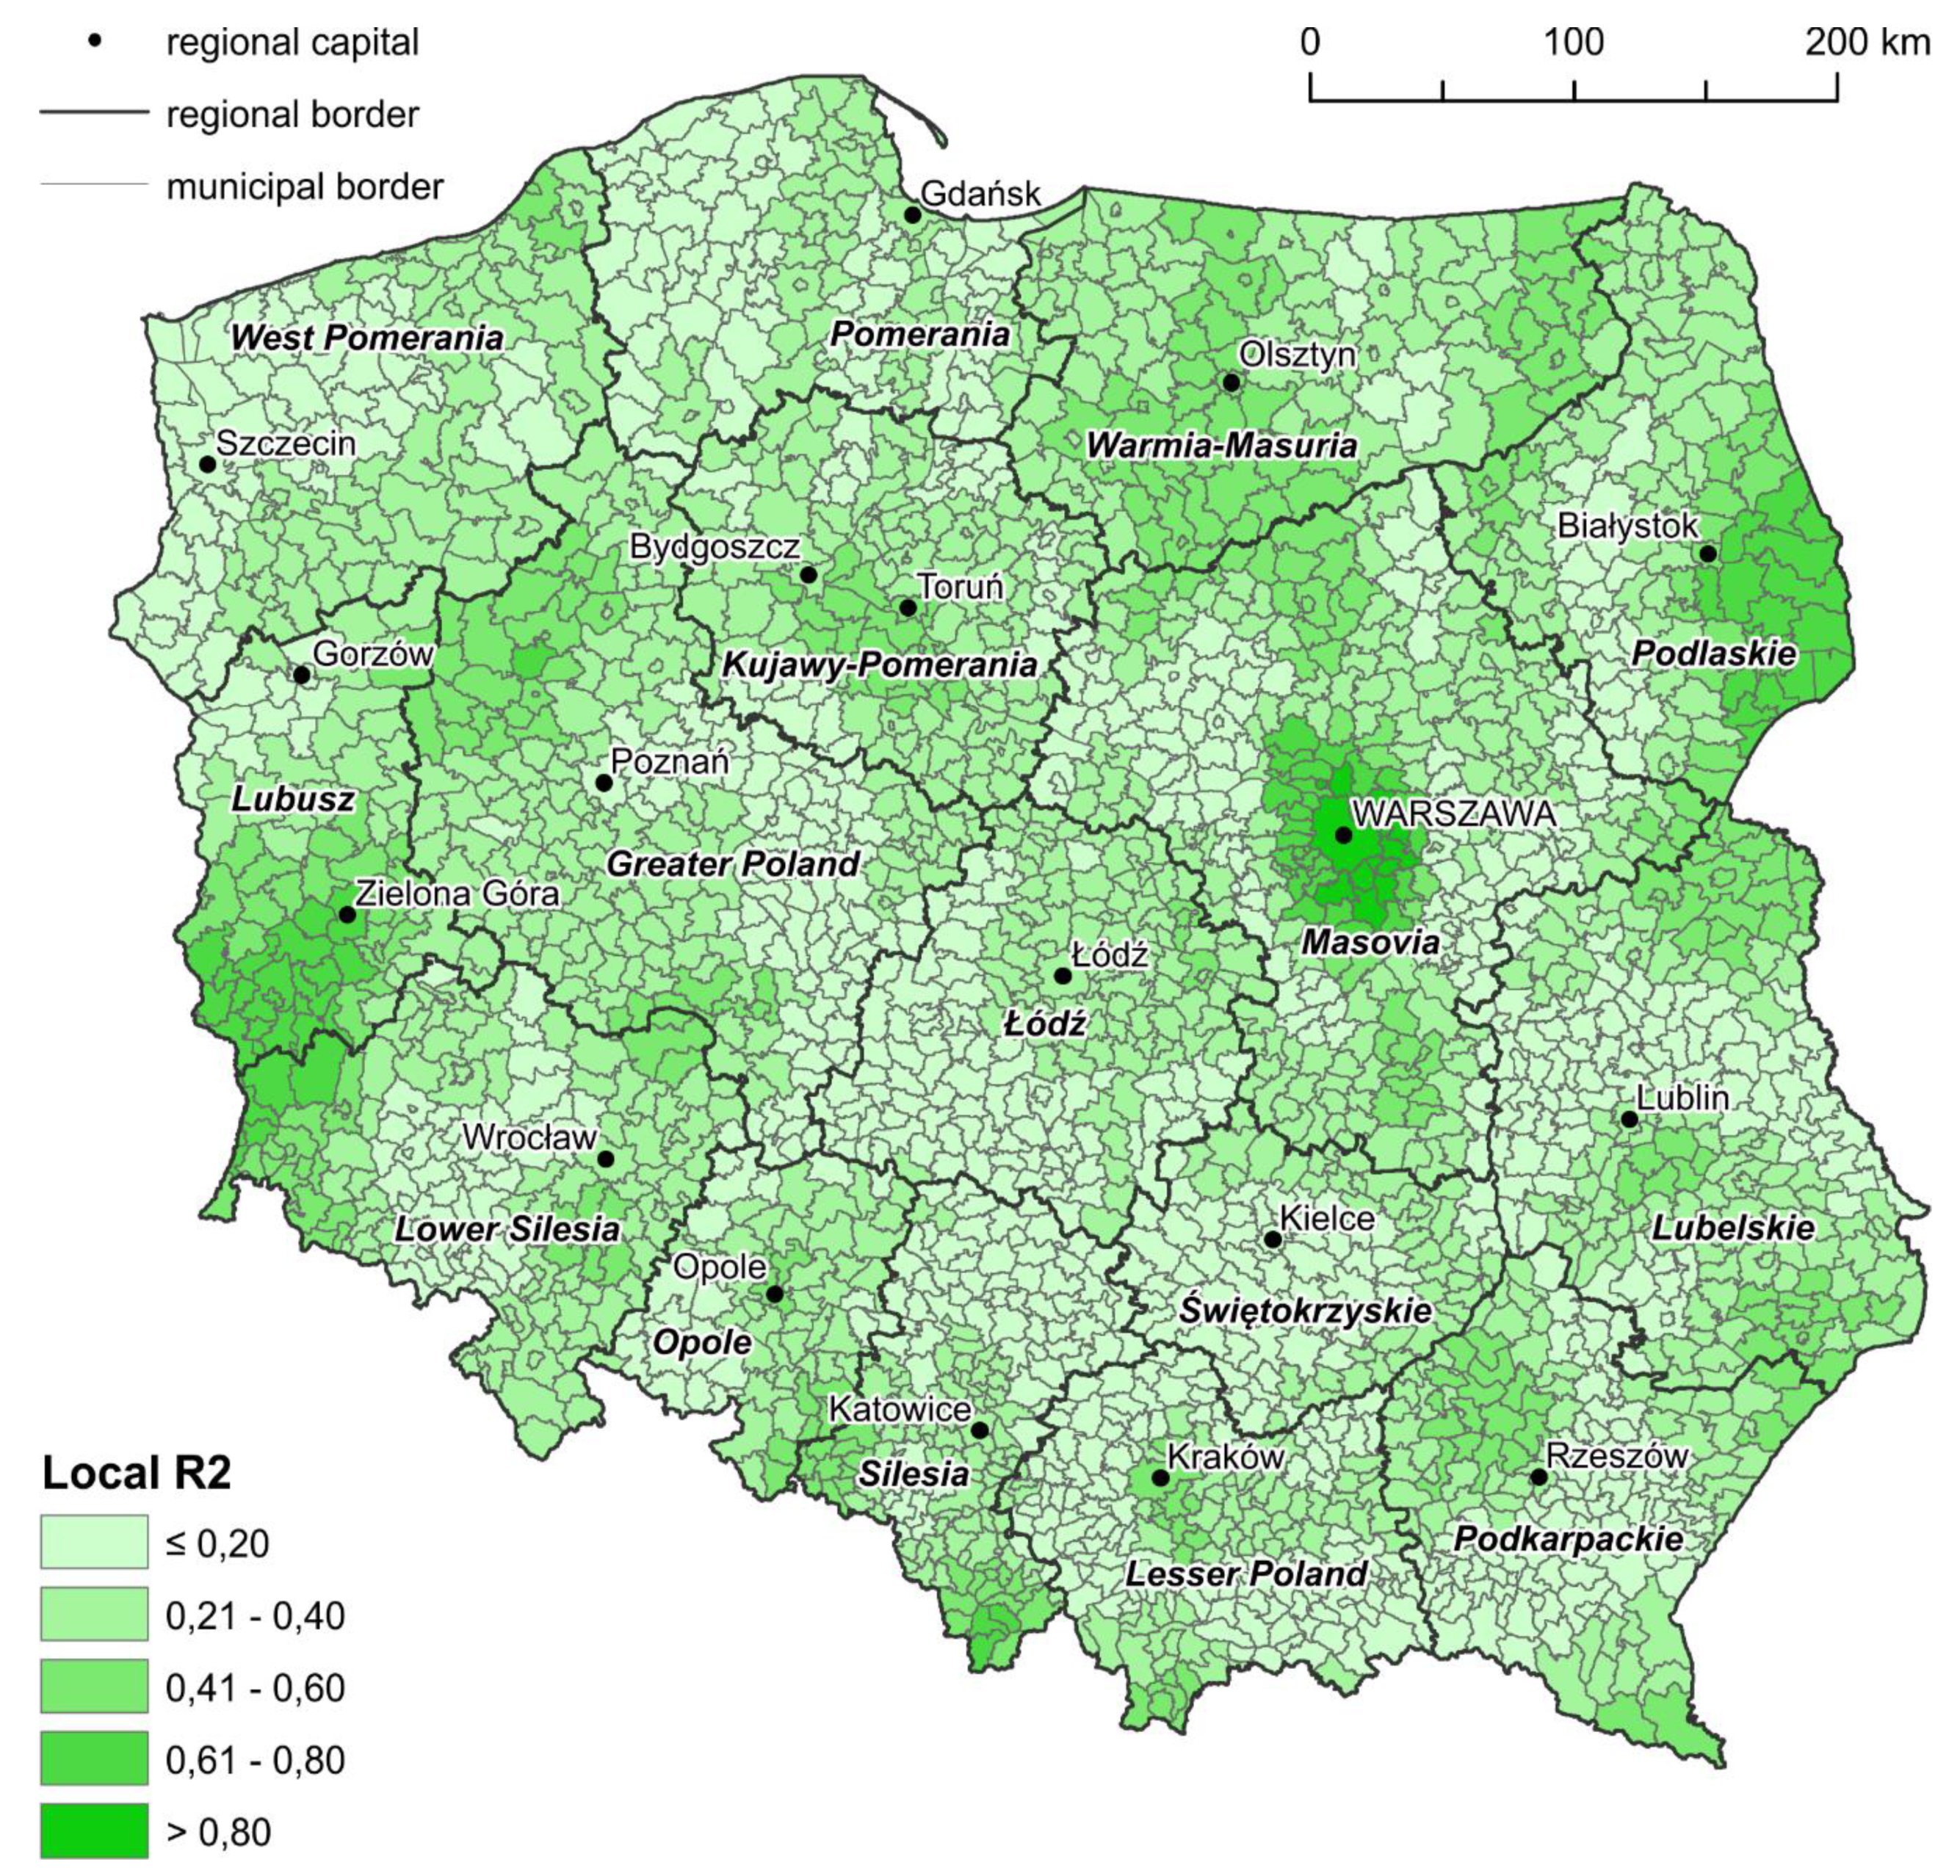
4.3. Global and Local Models of Land Cover Changes

A global model explaining the impact of five considered principal components describing determinants on land cover changes was estimated (Table 3). It needs to be emphasised that the coefficient of determination of the abovementioned model equals 0.102. Thus, the estimated global model of investigated impact needs to be considered as insufficient. However, three of five considered components were identified as significant determinants: urbanisation and EU support (PComp1), environment (PComp2), and land fragmentation (PComp3). It might be concluded, that the estimation of local models based on GWR method seems to be advantageous. Generally, land cover changes were negatively influenced by urbanisation and EU support. Thus, land cover changes occurred mainly in less populated and less supported municipalities. On the other hand, environmental factors positively impacted land cover changes. Interestingly, increased environmental protection, diversity of terrain, and precipitation resulted in increased land cover changes. Land fragmentation was the last factor identified as a significant determinant of land cover changes in the global model. It is not a surprise that the more fragmented the land is, the less land cover changes.
The accuracy of explanation based on GWR of observed variability of land cover changes is spatially varying (Figure 4). Best estimations of land cover changes in Poland, in the years 2012–2018, by investigated components were achieved in highly forested and relatively sparsely populated areas: Podlaskie in the north-east, and the area extending from Lubusz Lake District in the west, through Central Pomerania to Warmia and Masuria region in the northern part of the country. Moreover, relatively higher values of local coefficients of determination were noticed in many metropolitan areas of Polish biggest cities, with the highest value in the capital city Warszawa and neighbouring municipalities.
Significant impact of the first component “urbanisation and EU support” on land cover changes was identified in the area from Central Pomerania to Warmia-Masuria region in the north (Figure 5). Interestingly, the diagnosed influence is generally negative. It means that the less urbanised and supported the areas, the more substantial the land cover changes. However, the whole indicated region is generally less urbanised and less supported by all considered EU funds. Moreover, the most inaccessible part in terms of transportation of the discussed area (the core of Central Pomerania) is characterised by the opposite, positive relation between land cover changes and influential factors related to urbanisation and EU funds absorption. It might be concluded that in most peripheral and relatively less developed regions, any increase of urbanisation processes, economic development and any external support like EU grants might significantly stimulate land cover changes.
Environmental factors are spatially the most significant determinants of land cover changes (Figure 6). There are few administrative regions in the north part of Poland where the impact of investigated environmental component is recognised as both significant and positive: Lubusz region, southern parts of West Pomeranian and Pomeranian regions, western part of Kujawy-Pomeranian region, western part of Warmia-Masuria region, and most of municipalities located in Podlaskie region in the north-east Poland. Similar influence was also diagnosed in the south of Poland: the region of Opole, and Roztocze region located close to Polish-Ukrainian border. All of these regions are relatively highly forested. The positive impact of environmental factors on land cover changes might be interpreted in two ways. On the one hand, the increase of environmental protection might confirm higher attractiveness of the area, stimulate the awareness of investment capital, and in consequence increase land cover changes. Hence, environmental degradation might occur. On the other hand, the increase of environmental protection might directly result in land cover changes like reforestation programmes. Concluding, a detailed analysis of land cover changes resulting from the impact of environmental component is require.
Two opposing tendencies of the significant influence of land fragmentation on land cover changes were identified in Poland (Figure 7). The negative impact was diagnosed in the area from Lubusz region to Central Pomerania, and in the area of Roztocze located in eastern Poland. In these areas, the less fragmented the land is, the more land cover changes occur. This is in line with the findings from the global model describing the aforementioned relation. All mentioned areas are recognised as peripheral in terms of urbanisation, relatively less populous, less developed, and more forested. Thus, it might be concluded that this type of region demands less fragmented plots to enable land cover changes.
Transport issues were identified as a significant stimulant of land cover changes in the core of Central Pomerania region, found as one of the most inaccessible parts in terms of transport, less populated and urbanised, and relatively less supported by EU grants (Figure 8). The more peripheral and less accessible municipalities are, the more action-oriented, including spatial policy, local authorities are. Hence, land cover changes are expected. An opposite relation was identified for peripheral areas located in the regions of Podlaskie, and Warmia-Masuria. An increase of transport accessibility enables land cover changes. In such areas, policy oriented on transport investments might be a reasonable tool for achieving expected land cover changes.
Depopulation was the fifth and last investigated component influencing land cover changes in Poland in the years 2012–2018 (Figure 9). Negative population dynamics are significantly correlated with land cover changes in the functional areas of four of the biggest Polish cities characterised by substantial decrease in the number of residents: Bydgoszcz, Katowice, Kielce, and Łódź. In these cities, depopulation is recognised as an indirect driving factor determining land cover changes, as it stimulates active investment policy of local and regional authorities. On the contrary, peripheral core of Central Pomerania region needs to be emphasised. As discussed above, the region is recognised as less developed, less supported by EU grants, and less accessible in terms of transport. In such areas, any positive population changes are strongly required to support local or regional spatial policy and, in consequence, land cover changes.

5. Discussion

The goal of this research was to empirically verify the impact of absorption of EU grants on land cover changes in Polish municipalities between 2012 and 2018. The results are based on the application of the GWR method. The general methodological findings are in line with the results from other researchers [48,68,69,71,74,76], who confirmed that the efficiency of local models in explanation any spatially varying phenomenon, including land cover changes, is much higher compared to a global model estimated using the OLS method.
Based on the assumption that the territorial cohesion is a significant goal of EU funds, it was hypothesised that relatively less developed regions should be benefitted by higher EU grants absorption (mainly under the “Infrastructure and Environment” Operational Programme) and, in consequence, larger land cover changes. However, reality was identified as much more complex. It was diagnosed that in most peripheral and relatively less developed regions, any increase of urbanisation processes, economic development and any external support like EU grants might substantially influence land cover changes. This finding is complementary to the results of Su et al. [48] or Aguiar et al. [31], who confirmed that in areas where urbanisation is recognised as a driving force of development, all anthropogenic factors might disturb rural landscape and significantly influence changes of agricultural land cover. However, it must be noted that the investigated effectiveness of EU spatial policy was confirmed only for particular areas. Thus, the research hypothesis should be indicated as only partially confirmed. Moreover, CLC was found as an interesting and valuable data source, useful for discussion about the effectiveness of EU spatial policy.
It was found that environmental factors were spatially the most influential determinant of land cover changes in Poland. However, based on the results of this research, discussed impact is difficult to assess and constitutes one of the limitations of this research. On the one hand, the increase of environmental protection might indirectly result in negative land cover changes, as it contributes to higher investment attractiveness of the area and forces environmental degradation. On the other hand, the increase of environmental protection might directly stimulate positive land cover changes like reforestation. Both of these spatial tendencies were also confirmed by Woch et al. [41] for Poland. It also needs to be noted that slopes were also considered as a variable contributing to the environmental component. Two contrary tendencies between slopes and land cover changes should be considered [77] as well. On the one hand, steeper slopes increase the cost of investment projects and reduce land cover changes in consequence. On the other hand, though, steeper slopes characterise usually more attractive areas with greater amenities. Thus, land cover changes are much more expected. Hence, in-depth research on land cover changes resulted from the impact of environmental component are required. The focus on achieving sustainable landscapes is a crucial inhibitor of land cover changes, mainly in the protected areas, but also in all locations where an equilibrium between ecological, social and economic functions was set up [76].
This study confirmed that areas identified as peripheral in terms of urbanisation, namely, those relatively less populated, less developed and more forested, demand less fragmented plots to enable land cover changes. This explanation would be consistent with findings from Demetriou et al. [78] and Borowska-Stefańska et al. [79], who emphasised that excessive fragmentation can be a barrier for optimal agricultural development and can cause some difficulties in effective agricultural production. On the other hand, agricultural expansion and population growth could be also significant determinants of changes in land use [52].
The impact of transport network on land cover changes was found as a complex relation. On the one hand, transport issues might, paradoxically, be a prohibitor of various actions undertaken by local and regional authorities for social and economic development, and in consequence a stimulant of land cover changes. On the other hand, better access is recognised as a significant determinant of investment attractiveness. Thus, land cover changes might be indirectly stimulated by the increase of transport accessibility. Aguiar et al. [31] and Daunt et al. [80] confirmed that the distance to roads is an important factor determining land cover changes. Fiedoń [4] noticed that within the areas located near motorways interchanges, a decrease in agricultural land is observed, which usually becomes overgrown by forest areas. On the other hand, in the direct surroundings of motorway interchanges, a substantial increase in the built-up areas is visible, mainly for industry and services [81,82]. Interestingly, land cover changes are determined by land access, but at the same time influenced by different types of bottom-up or top-down interventions and policies [83].
In cities characterised by a decreasing number of residents, depopulation is recognised as an indirect driving factor determining land cover changes. It was confirmed in this research that in such cities, depopulation stimulates an active investment policy of local and regional authorities and, in consequence, land cover changes. This is in line with other studies whose authors recognised population growth as a significant negative prohibitor of urban land use changes [25,80]. These authors also refer to the so-called ‘congestion effect’ [25], when relatively higher population density decreases the investment attractiveness of already developed areas. If there is no room for brand new investment initiatives, land cover changes will not occur. On the other hand, discussed changes might be transferred to areas surrounding densely populated cities by the urban sprawl [84,85], which is recognized as typical characteristic of development of Central-Eastern European cities [85]. Meanwhile, economic development followed by population growth has great impact on urban land use. Thus, the GDP per capita, population density and the degree of market openness are significant determinants positively influencing land cover changes [86].

6. Conclusions

The impact of European Union grants on land cover changes in Polish municipalities between 2012 and 2018 was discussed in this research. It was diagnosed that in most peripheral and relatively less developed territories, any increase of urbanisation processes, economic development and any external support like EU grants might substantially influence land cover changes. On the other hand, limited general impact of EU grants on land cover changes was evidenced, and fitted into the overall scepticism about the contemporary role of EU financial support. However, the wider framework of the discussion about spatial benefits of EU grants is needed. Environmental factors were diagnosed as the most influential determinant of land cover changes in Poland. Interestingly, mentioned impact is difficult to assess. Both reforestation and environmental degradation were found as plausible. This was recognized as the main limitation of the research. Thus, it is suggested to focus on the direction of changes in future studies. From the methodological perspective, Corine Land Cover was found as an interesting and valuable data source, useful for discussion about the effectiveness of EU spatial policy Moreover, efficiency of local models estimated by Geographically Weighted Regression in explanation any spatially varying phenomenon was confirmed.

Author Contributions

Conceptualization, K.L.-N., M.N. and T.N.; methodology, M.N. and T.N.; software, K.L.-N., M.N. and T.N.; validation, K.L.-N., M.N. and T.N.; formal analysis, T.N.; investigation, K.L.-N. and M.N.; data curation, M.N.; writing—original draft preparation, K.L.-N., M.N. and T.N.; writing—review and editing, K.L.-N.; visualization, K.L.-N. and T.N.

Funding

This research received no external funding.

Acknowledgments

This work has been supported by Faculty of Geographical Sciences at University of Lodz. We would like to thank all the reviewers for their constructive remarks.

Conflicts of Interest

The authors declare no conflict of interest.

References

  1. Wang, J.; Lin, Y.; Glendinning, A.; Xu, Y. Land-use changes and land policies evolution in China’s urbanization processes. Land Use Policy 2018, 75, 375–387. [Google Scholar] [CrossRef]
  2. Schulp, C.J.E.; Levers, C.; Kuemmerle, T.; Tieskens, K.F.; Verburg, P.H. Mapping and modelling past and future land use change in Europe’s cultural landscapes. Land Use Policy 2019, 80, 332–344. [Google Scholar] [CrossRef]
  3. Cegielska, K.; Noszczyk, T.; Kukulska, A.; Szylar, M.; Hernik, J.; Dixon-Gough, R.; Jombach, S.; Valánszki, I.; Filepné Kovács, K. Land use and land cover changes in post-socialist countries: Some observations from Hungary and Poland. Land Use Policy 2018, 78, 1–18. [Google Scholar] [CrossRef]
  4. Fiedeń, Ł. Changes in land use in the communes crossed by the A4 motorway in Poland. Land Use Policy 2019, 85, 397–406. [Google Scholar] [CrossRef]
  5. Ikiel, C.; Dutucu, A.; Ustaoglu, B.; Kilic, D. Land use and land cover (LULC) classification using Spot-5 image in the Adapazari plain and its surroundings, Turkey. TOJSAT—Online J. Sci. Technol. 2012, 2, 37–42. [Google Scholar]
  6. Iverson, L.R. Land-use changes in Illinois, USA: The influence of landscape attributes on current and historic land use. Landsc. Ecol. 1988, 2, 45–61. [Google Scholar] [CrossRef]
  7. Nalej, M. Agricultural land cover changes in metropolitan areas of Poland for the period 1990–2012. Misc. Geogr. 2016, 20, 39–45. [Google Scholar] [CrossRef]
  8. Schaffert, M.; Steensen, T. Land Cover Changes in Northern Germany Between 1990 and 2000—An East-West Perspective. A study based on CORINE Land Cover data. In Land Ownership and Land Use Development: He Integration of Past, Present, and Future in Spatial Planning and Land Management Policies; Hepperle, E., Dixon-Goug, R., Mansberger, R., Paulsson, J., Hernik, J., Kalbro, T., Eds.; VDF Hochschulverlag AG: Zurich, Switzerland, 2017; pp. 157–169. [Google Scholar]
  9. Boucher, Y.; Grondin, P.; Auger, I. Land use history (1840–2005) and physiography as determinants of southern boreal forests. Landsc. Ecol. 2014, 29, 437–450. [Google Scholar] [CrossRef]
  10. Van Doorn, A.M.; Bakker, M.M. The destination of arable land in a marginal agricultural landscape in South Portugal: An exploration of land use change determinants. Landsc. Ecol. 2007, 22, 1073–1087. [Google Scholar] [CrossRef]
  11. Rutherford, G.N.; Guisan, A.; Zimmermann, N.E. Evaluating sampling strategies and logistic regression methods for modelling complex land cover changes. J. Appl. Ecol. 2007, 44, 414–424. [Google Scholar] [CrossRef]
  12. Prishchepov, A.A.; Müller, D.; Dubinin, M.; Baumann, M.; Radeloff, V.C. Determinants of agricultural land abandonment in post-Soviet European Russia. Land Use Policy 2013, 30, 873–884. [Google Scholar] [CrossRef] [Green Version]
  13. Stoebner, T.J.; Lant, C.L. Geographic determinants of rural land covers and the agricultural margin in the Central United States. Appl. Geogr. 2014, 55, 138–154. [Google Scholar] [CrossRef] [Green Version]
  14. Tu, J. Spatially varying relationships between land use and water quality across an urbanization gradient explored by geographically weighted regression. Appl. Geogr. 2011, 31, 376–392. [Google Scholar] [CrossRef]
  15. Badinger, H.; Müller, W.G.; Tondl, G. Regional convergence in the European Union 1985–1999: A spatial dynamic panel analysis. Reg. Stud. 2004, 38, 241–253. [Google Scholar] [CrossRef]
  16. Dall’erba, S.; Le Gallo, J. Regional convergence and the impact of European structural funds over 1989–1999: A spatial econometric analysis. Pap. Reg. Sci. 2008, 82, 219–244. [Google Scholar] [CrossRef]
  17. Lolos, S.E.G. The effect of EU structural funds on regional growth: Assessing the evidence from Greece, 1990–2005. Econ. Chang. Restruct. 2009, 42, 211–228. [Google Scholar] [CrossRef]
  18. Percoco, M. The Impact of Structural Funds on the Italian Mezzogiorno, 1994–1999. Reg. Dev. 2005, 21, 141–152. [Google Scholar]
  19. Mohl, P.; Hagen, T. Do EU structural funds promote regional growth? New evidence from various panel data approaches. Reg. Sci. Urban Econ. 2010, 40, 353–365. [Google Scholar] [CrossRef]
  20. Churski, P. Structural funds of the European Union in Poland—Experience of the first period of membership. Eur. Plan. Stud. 2008, 16, 579–607. [Google Scholar] [CrossRef]
  21. Dąbrowski, M. Structural funds as a driver for institutional change in Poland. Eur. Asia Stud. 2008, 60, 227–248. [Google Scholar] [CrossRef]
  22. Kasza, A. Two Ends of a Stick? Regional Strategic Planning and Operational Programming in Poland in the Context of EU Membership. Reg. Stud. 2009, 43, 625–636. [Google Scholar] [CrossRef] [Green Version]
  23. Lewandowska, A.; Stopa, M.; Humenny, G. The European Union Structural Funds and Regional Development. The Perspective of Small and Medium Enterprises in Eastern Poland. Eur. Plan. Stud. 2015, 23, 758–797. [Google Scholar] [CrossRef]
  24. Štreimikiene, D. Review of financial support from EU Structural Funds to sustainable energy in Baltic States. Renew. Sustain. Energy Rev. 2016, 58, 1027–1038. [Google Scholar] [CrossRef]
  25. Chakir, R.; Parent, O. Determinants of land use changes: A spatial multinomial probit approach. Pap. Reg. Sci. 2009, 88, 327–344. [Google Scholar] [CrossRef]
  26. Zoppi, C.; Lai, S. Determinants of land take at the regional scale: A study concerning Sardinia (Italy). Environ. Impact Assess. Rev. 2015, 55, 1–10. [Google Scholar] [CrossRef]
  27. Li, L.; Wang, Y. Land Use/Cover Change from 2001 to 2010 and its Socioeconomic Determinants in Guangdong Province, A Rapid Urbanization Area of China. J. Agric. Sci. 2016, 22, 275–294. [Google Scholar]
  28. Feranec, J.; Šuri, M.; Ot’ahel’, J.; Cebecauer, T.; Kolář, J.; Soukup, T.; Zdeňková, D.; Waszmuth, J.; Vâjdea, V.; Vîjdea, A.M.; et al. Inventory of major landscape changes in the Czech Republic, Hungary, Romania and Slovak Republic 1970s–1990s. ITC J. 2000, 2, 129–139. [Google Scholar] [CrossRef]
  29. Borowska-Stefańska, M.; Leśniewska-Napierała, K.; Wiśniewski, S. Land cover changes in Poland between 1990 and 2012. Geografie 2018, 123, 63–83. [Google Scholar] [Green Version]
  30. Bonilla-Moheno, M.; Aide, T.M.; Clark, M.L. The influence of socioeconomic, environmental, and demographic factors on municipality-scale land-cover change in Mexico. Reg. Environ. Chang. 2012, 12, 453–557. [Google Scholar] [CrossRef]
  31. Aguiar, A.P.D.; Câmara, G.; Escada, M.I.S. Spatial statistical analysis of land-use determinants in the Brazilian Amazonia: Exploring intra-regional heterogeneity. Ecol. Modell. 2007, 209, 169–188. [Google Scholar] [CrossRef]
  32. Ariti, A.T.; van Vliet, J.; Verburg, P.H. Land-use and land-cover changes in the Central Rift Valley of Ethiopia: Assessment of perception and adaptation of stakeholders. Appl. Geogr. 2015, 65, 28–37. [Google Scholar] [CrossRef]
  33. Lambin, E.F.; Turner, B.L.; Geist, H.J.; Agbola, S.B.; Angelsen, A.; Bruce, J.W.; Coomes, O.T.; Dirzo, R.; Fischer, G.; Folke, C.; et al. The causes of land-use and land-cover change: Moving beyond the myths. Glob. Environ. Chang. 2001, 11, 161–269. [Google Scholar] [CrossRef]
  34. Wu, C.; Wei, Y.D.; Huang, X.; Chen, B. Economic transition, spatial development and urban land use efficiency in the Yangtze River Delta, China. Habitat Int. 2017, 63, 67–78. [Google Scholar] [CrossRef]
  35. Alphan, H. Land-use change and urbanization of Adana, Turkey. Land Degrad. Dev. 2003, 14, 575–586. [Google Scholar] [CrossRef]
  36. Dannenberg, P.; Kuemmerle, T. Farm Size and Land Use Pattern Changes in Postsocialist Poland. Prof. Geogr. 2010, 62, 197–210. [Google Scholar] [CrossRef]
  37. Łowicki, D.; Mizgajski, A. Typology of physical-geographical regions in Poland in line with land-cover structure and its changes in the years 1990–2006. Geogr. Pol. 2013, 86, 255–266. [Google Scholar] [CrossRef]
  38. Noszczyk, T. Land use change monitoring as a task of local government administration in Poland. J. Ecol. Eng. 2018, 19, 170–176. [Google Scholar] [CrossRef]
  39. Woch, F. Ocena zmian wykorzystania przestrzeni wiejskiej w Polsce. Pol. J. Agron. 2014, 18, 52–62. [Google Scholar]
  40. Ciołkosz, A.; Poławski, Z. Zmiany użytkowania ziemi w Polsce w II połowie XX wieku na podstawie analizy danych kartograficznych. Rocz. Geomatyki Ann. Geomat. 2005, 3, 17–26. [Google Scholar]
  41. Woch, F.; Woch, R. Zmiany użytkowania przestrzeni wiejskiej w Polsce. Infrastruct. Ecol. Rural Areas 2014, 1, 111–124. [Google Scholar]
  42. Matyka, M. Analiza regionalnego zróżnicowania zmian w użytkowaniu gruntów w Polsce. Pol. J. Agron. 2012, 10, 16–20. [Google Scholar]
  43. Kurowska, K.; Rudnicki, R. Changes in land use in Poland—Comparative study of period 2002–2010. In Proceedings of the 7th International Scientific Conference Rural Development 2015, Kaunas, Lithuania, 19–20 November 2015; Raupeliene, A., Ed.; Aleksandras Stulginskis University: Kaunas, Lithuania, 2015. [Google Scholar]
  44. Tokarczyk-Dorociak, K.; Kazak, J.; Szewrański, S. The impact of a large city on land use in suburban area—The case of Wrocław (Poland). J. Ecol. Eng. 2018, 19, 89–98. [Google Scholar] [CrossRef]
  45. Łowicki, D. Land use changes in Poland during transformation. Case study of Wielkopolska region. Landsc. Urban Plan. 2008, 87, 279–288. [Google Scholar] [CrossRef]
  46. Bergeron, G.; Pender, J. Determinants of Land Use Change: Evidence from a Community Study in Honduras; Discussion Paper; EPTD: Washington, DC, USA, 1999; No. 46. [Google Scholar]
  47. Braimoh, A.K.; Onishi, T. Spatial determinants of urban land use change in Lagos, Nigeria. Land Use Policy 2007, 24, 502–515. [Google Scholar] [CrossRef]
  48. Su, S.; Xiao, R.; Zhang, Y. Multi-scale analysis of spatially varying relationships between agricultural landscape patterns and urbanization using geographically weighted regression. Appl. Geogr. 2012, 32, 360–375. [Google Scholar] [CrossRef]
  49. Wear, D.N.; Bolstad, P. Land-use changes in Southern Appalachian landscapes: Spatial analysis and forecast evaluation. Ecosystems 1998, 1, 575–594. [Google Scholar] [CrossRef]
  50. Verburg, P.H.; Ritsema van Eck, J.R.; de Nijs, T.C.M.; Dijst, M.J.; Schot, P. Determinants of land-use change patterns in the Netherlands. Environ. Plan. B Plan. Des. 2004, 31, 125–150. [Google Scholar] [CrossRef]
  51. Bamwerinde, W.; Bashaasha, B.; Ssembajjwe, W.; Place, F. Determinants of Land Use in the Densely Populated Kigezi Highlands of Southern Uganda; 2006; Available online: https://core.ac.uk/download/pdf/6653411.pdf (accessed on 20 August 2019).
  52. Handavu, F.; Chirwa, P.W.C.; Syampungani, S. Socio-economic factors influencing land-use and land-cover changes in the miombo woodlands of the Copperbelt province in Zambia. For. Policy Econ. 2019, 100, 75–94. [Google Scholar] [CrossRef]
  53. Nguyen, T.T.; Nguyen, L.D.; Lippe, R.S.; Grote, U. Determinants of Farmers’ Land Use Decision-Making: Comparative Evidence from Thailand and Vietnam. World Dev. 2017, 89, 199–213. [Google Scholar] [CrossRef]
  54. Nguyen, S.T. Determinants of land-use change: A case study from the lower Mekong delta of southern Vietnam. Electron. Green J. 2008, 1, 1–12. [Google Scholar]
  55. Bański, J. Koncepcje rozwoju struktury przestrzennej w Polsce—Polaryzacja czy równoważenie? Prz. Geogr. 2007, 79, 45–77. [Google Scholar]
  56. Gorzelak, G. Regional and Local Potential for Transformation in Poland; European Institute for Regional and Local Development: Warsaw, Poland, 1998. [Google Scholar]
  57. Węcławowicz, G.; Bański, J.; Degórski, M.; Komornicki, T.; Korcelli, P.; Śleszyński, P. Przestrzenne Zagospodarowanie Polski na Początku XXI Wieku; IGiPZ PAN: Warsaw, Poland, 2006. [Google Scholar]
  58. Kowalski, T. Globalization and Transformation in Central European Countries: The Case of Poland; Poznań University of Economics: Poznań, Poland, 2013. [Google Scholar]
  59. Bański, J. The consequences of changes of ownership for agricultural land use in Central European countries following the collapse of the Eastern Bloc. Land Use Policy 2017, 66, 120–130. [Google Scholar] [CrossRef]
  60. Wendt, J.A. The administrative division of Poland and the prospects of the transborder cooperation. In Changing Role of Border Areas and Regional Policies, Region and Regionalism No. 5; Koter, M., Ed.; Wydawnictwo Uniwersytetu Łódzkiego: Łódź-Opole, Poland, 2001; pp. 39–48. [Google Scholar]
  61. Majewska, J. Inter-regional agglomeration effects in tourism in Poland. Tour. Geogr. 2015, 17, 408–436. [Google Scholar] [CrossRef]
  62. Majewska, J.; Napierała, T.; Adamiak, M. Wykorzystanie nowych technologii i informacji do opisu przestrzeni turystycznej. Folia Tur. 2016, 41, 309–339. [Google Scholar]
  63. Chojnicki, Z.; Czyż, T.; Parysek, J.J.; Ratajczak, W. Badania Przestrzennej Struktury Społeczno-Ekonomicznej Polski Metodami Czynnikowymi; Państwowe Wydawnictwo Naukowe: Warsaw, Poland, 1978. [Google Scholar]
  64. Dunteman, G.H. Principal Component Analysis; Sage Publications: Newburry Park, CA, USA, 1989. [Google Scholar]
  65. Jolliffe, I.T. Principal Component Analysis; Springer: New York, NY, USA, 2002. [Google Scholar]
  66. Cheng, L.; Bingyu, W. Principal Components Analysis; 2014; Available online: http://www.ccs.neu.edu/home/vip/teach/MLcourse/5_features_dimensions/lecture_notes/PCA/PCA.pdf (accessed on 18 August 2019).
  67. Brown, S.; Versace, V.L.; Laurenson, L.; Ierodiaconou, D.; Fawcett, J.; Salzman, S. Assessment of Spatiotemporal Varying Relationships between Rainfall, Land Cover and Surface Water Area Using Geographically Weighted Regression. Environ. Model. Assess. 2012, 17, 241–254. [Google Scholar] [CrossRef]
  68. Huang, J.; Huang, Y.; Pontius, R.G.; Zhang, Z. Geographically weighted regression to measure spatial variations in correlations between water pollution versus land use in a coastal watershed. Ocean Coast. Manag. 2015, 103, 14–24. [Google Scholar] [CrossRef]
  69. Li, C.; Li, F.; Wu, Z.; Cheng, J. Exploring spatially varying and scale-dependent relationships between soil contamination and landscape patterns using geographically weighted regression. Appl. Geogr. 2017, 82, 101–114. [Google Scholar] [CrossRef]
  70. Gao, J.; Li, S. Detecting spatially non-stationary and scale-dependent relationships between urban landscape fragmentation and related factors using Geographically Weighted Regression. Appl. Geogr. 2011, 31, 292–302. [Google Scholar] [CrossRef]
  71. Taghipour Javi, S.; Malekmohammadi, B.; Mokhtari, H. Application of geographically weighted regression model to analysis of spatiotemporal varying relationships between groundwater quantity and land use changes (case study: Khanmirza Plain, Iran). Environ. Monit. Assess. 2014, 186, 3123–3138. [Google Scholar] [CrossRef]
  72. Matthews, S.A.; Yang, T.C. Mapping the results of local statistics: Using geographically weighted regression. Demogr. Res. 2012, 26, 151–166. [Google Scholar] [CrossRef]
  73. Mennis, J. Mapping the results of geographically weighted regression. Cartogr. J. 2006, 43, 171–179. [Google Scholar] [CrossRef]
  74. Pineda Jaimes, N.B.; Bosque Sendra, J.; Gómez Delgado, M.; Franco Plata, R. Exploring the driving forces behind deforestation in the state of Mexico (Mexico) using geographically weighted regression. Appl. Geogr. 2010, 30, 576–591. [Google Scholar] [CrossRef]
  75. Charlton, M.; Fotheringam, S. Geographically Weighted Regression. A Tutorial on Using GWR in ArcGIS 9.3; National Centre for Geocomputation National University of Ireland Maynooth: Maynooth, Ireland, 2009. [Google Scholar]
  76. Shariff, N.M.; Gairola, S.; Talib, A. Modelling urban land use change using geographically weighted regression and the implications for sustainable environmental planning. In Proceedings of the Modelling for Environment’s Sake: 5th Biennial Conference of the International Environmental Modelling and Software Society, iEMSs 2010, Ottawa, ON, Canada, 5–8 July 2010. [Google Scholar]
  77. Wrenn, D.H.; Sam, A.G. Geographically and temporally weighted likelihood regression: Exploring the spatiotemporal determinants of land use change. Reg. Sci. Urban Econ. 2014, 44, 60–74. [Google Scholar] [CrossRef]
  78. Demetriou, D.; Suntilwell, J.; See, L. A new methodology for measuring land fragmentation. Comput. Environ. Urban Syst. 2013, 39, 71–80. [Google Scholar] [CrossRef] [Green Version]
  79. Borowska-Stefańska, M.; Leśniewska-Napierała, K.; Wiśniewski, S. Spatial variation in size and shape of land plots in Mazowieckie voivodship. Eur. Spat. Res. Policy 2018, 25, 113–130. [Google Scholar] [CrossRef]
  80. Pierri Daunt, A.B.; Sanna Freire Silva, T. Beyond the park and city dichotomy: Land use and land cover change in the northern coast of São Paulo (Brazil). Landsc. Urban Plan. 2019, 189, 352–361. [Google Scholar] [CrossRef]
  81. Asadi, A.; Barati, A.A.; Kalantari, K.; Odeh, I. Study of relationship between roads network development and agricultural land conversion in Iran NorthWest. Int. J. Environ. Res. 2016, 10, 51–58. [Google Scholar]
  82. Villarroya, A.; Puig, J. Urban and industrial land-use changes alongside motorways within the Pyrenean area of Navarre, Spain. Environ. Eng. Manag. J. 2012, 11, 1213–1220. [Google Scholar]
  83. Xu, Y. Rethinking the politics of land-use change: Insights from the rise of the industrial tree plantation sector in Southern China. Land Use Policy 2019, 87, 1–10. [Google Scholar] [CrossRef]
  84. Martinuzzi, S.; Gould, W.A.; Ramos González, O.M. Land development, land use, and urban sprawl in Puerto Rico integrating remote sensing and population census data. Landsc. Urban Plan. 2007, 79, 288–297. [Google Scholar] [CrossRef]
  85. Oueslati, W.; Alvanides, S.; Garrod, G. Determinants of urban sprawl in European cities. Urban Stud. 2015, 52, 1594–1614. [Google Scholar] [CrossRef] [PubMed] [Green Version]
  86. Yu, J.; Zhou, K.; Yang, S. Land use efficiency and influencing factors of urban agglomerations in China. Land Use Policy 2019, 88, 104143. [Google Scholar] [CrossRef]
Figure 1. Hot spots and cold spots of spatial distribution of land cover changes in Poland, in the years 2012–2018.
Remotesensing 11 02359 g001
Figure 2. Hot spots and cold spots of spatial distribution of total EU support per square km in Poland, in the years 2012–2018.
Remotesensing 11 02359 g002
Figure 3. Hot spots and cold spots of spatial distribution of EU support under the Operational Program “Infrastructure and Environment” per square km in Poland, in the years 2012–2018.
Remotesensing 11 02359 g003
Figure 4. Coefficients of determination of local models estimating land cover changes in Poland, in the years 2012–2018.
Remotesensing 11 02359 g004
Figure 5. Value (a) and significance (b) of impact of the first component “urbanisation and EU support” on land cover changes in Poland, in the years 2012–2018.
Remotesensing 11 02359 g005
Figure 6. Value (a) and significance (b) of impact of the second component “environment” on land cover changes in Poland, in the years 2012–2018.
Remotesensing 11 02359 g006
Figure 7. Value (a) and significance (b) of impact of the third component “land fragmentation” on land cover changes in Poland, in the years 2012–2018.
Remotesensing 11 02359 g007
Figure 8. Value (a) and significance (b) of impact of the fourth component “inaccessibility” on land cover changes in Poland, in the years 2012–2018.
Remotesensing 11 02359 g008
Figure 9. Value (a) and significance (b) of impact of the fifth component “depopulation” on land cover changes in Poland, in the years 2012–2018.
Remotesensing 11 02359 g009
Table 1. Description of determinants of land cover or land use changes.
VariableAbbreviationData Source for This ResearchMeasure [Unit]Research Where the Variable Was Considered Before
Density of roadsDENSROADSHead Office of Geodesy and CartographyDensity of roads [km/km2][12]
Distance from the main roadsDISTMROADHead Office of Geodesy and CartographyDistance to the closest main road [km][25,31,46,47,48,49]
Distance from the nearest airport/seaportDISTPORTHead Office of Geodesy and CartographyDistance to the closest airport/seaport [km][47,50]
Distance from the nearest railway stationDISTRAILHead Office of Geodesy and CartographyDistance to the closest railway station [km][50]
Distance to the closest major urban centreDISTCITYHead Office of Geodesy and CartographyDistance to the closest centroid of capital of a region [km][12,13,25,31,48,49,50]
Farm sizeAVFARMStatistics PolandAverage farm size [ha][10,46,51,52]
Type of breedingDENSBREEIXStatistics PolandIndex of breeding [index/km2][10,46]
DemographyChanges in population potential [POPCHANGE]Statistics PolandRelative population change between 2012 and 2018 [%][25,47]
Population densityPOPDENSITYStatistics PolandDensity of population [number/km2][12,25,31,52]
Absorption of EU fundsEU1218ALL; EU1218INFRStatistics PolandSum of EU support from 2012 until 2018 [PLN/km2]; Sum of EU support under the Operational Programme “Infrastructure and Environment” from 2012 until 2018 [PLN/km2]Own proposal
IncomeMUNICINCStatistics PolandMunicipal income [PLN/km2][25,52,53]
Number of enterprisesDENSENTERPStatistics PolandDensity of enterprises [number/km2][54]
LandformSLOPEHead Office of Geodesy and CartographyAverage slope [deg.][25,46,47,49]
Precipitation and humidityRAINInstitute of Meteorology and Water ManagementAnnual average precipitation [mm][13,25,31]
Density of buildingsDENSBUILDHead Office of Geodesy and CartographyDensity of buildings [number/km2][49]
Protected areasSHAREPROTECStatistics PolandProtected areas [% of municipal area][13,31]
Size of plotsAVPLOTHead Office of Geodesy and CartographyAverage plot size [m2][46,54]
Table 2. Contribution of original determinants of land cover changes to principal components.
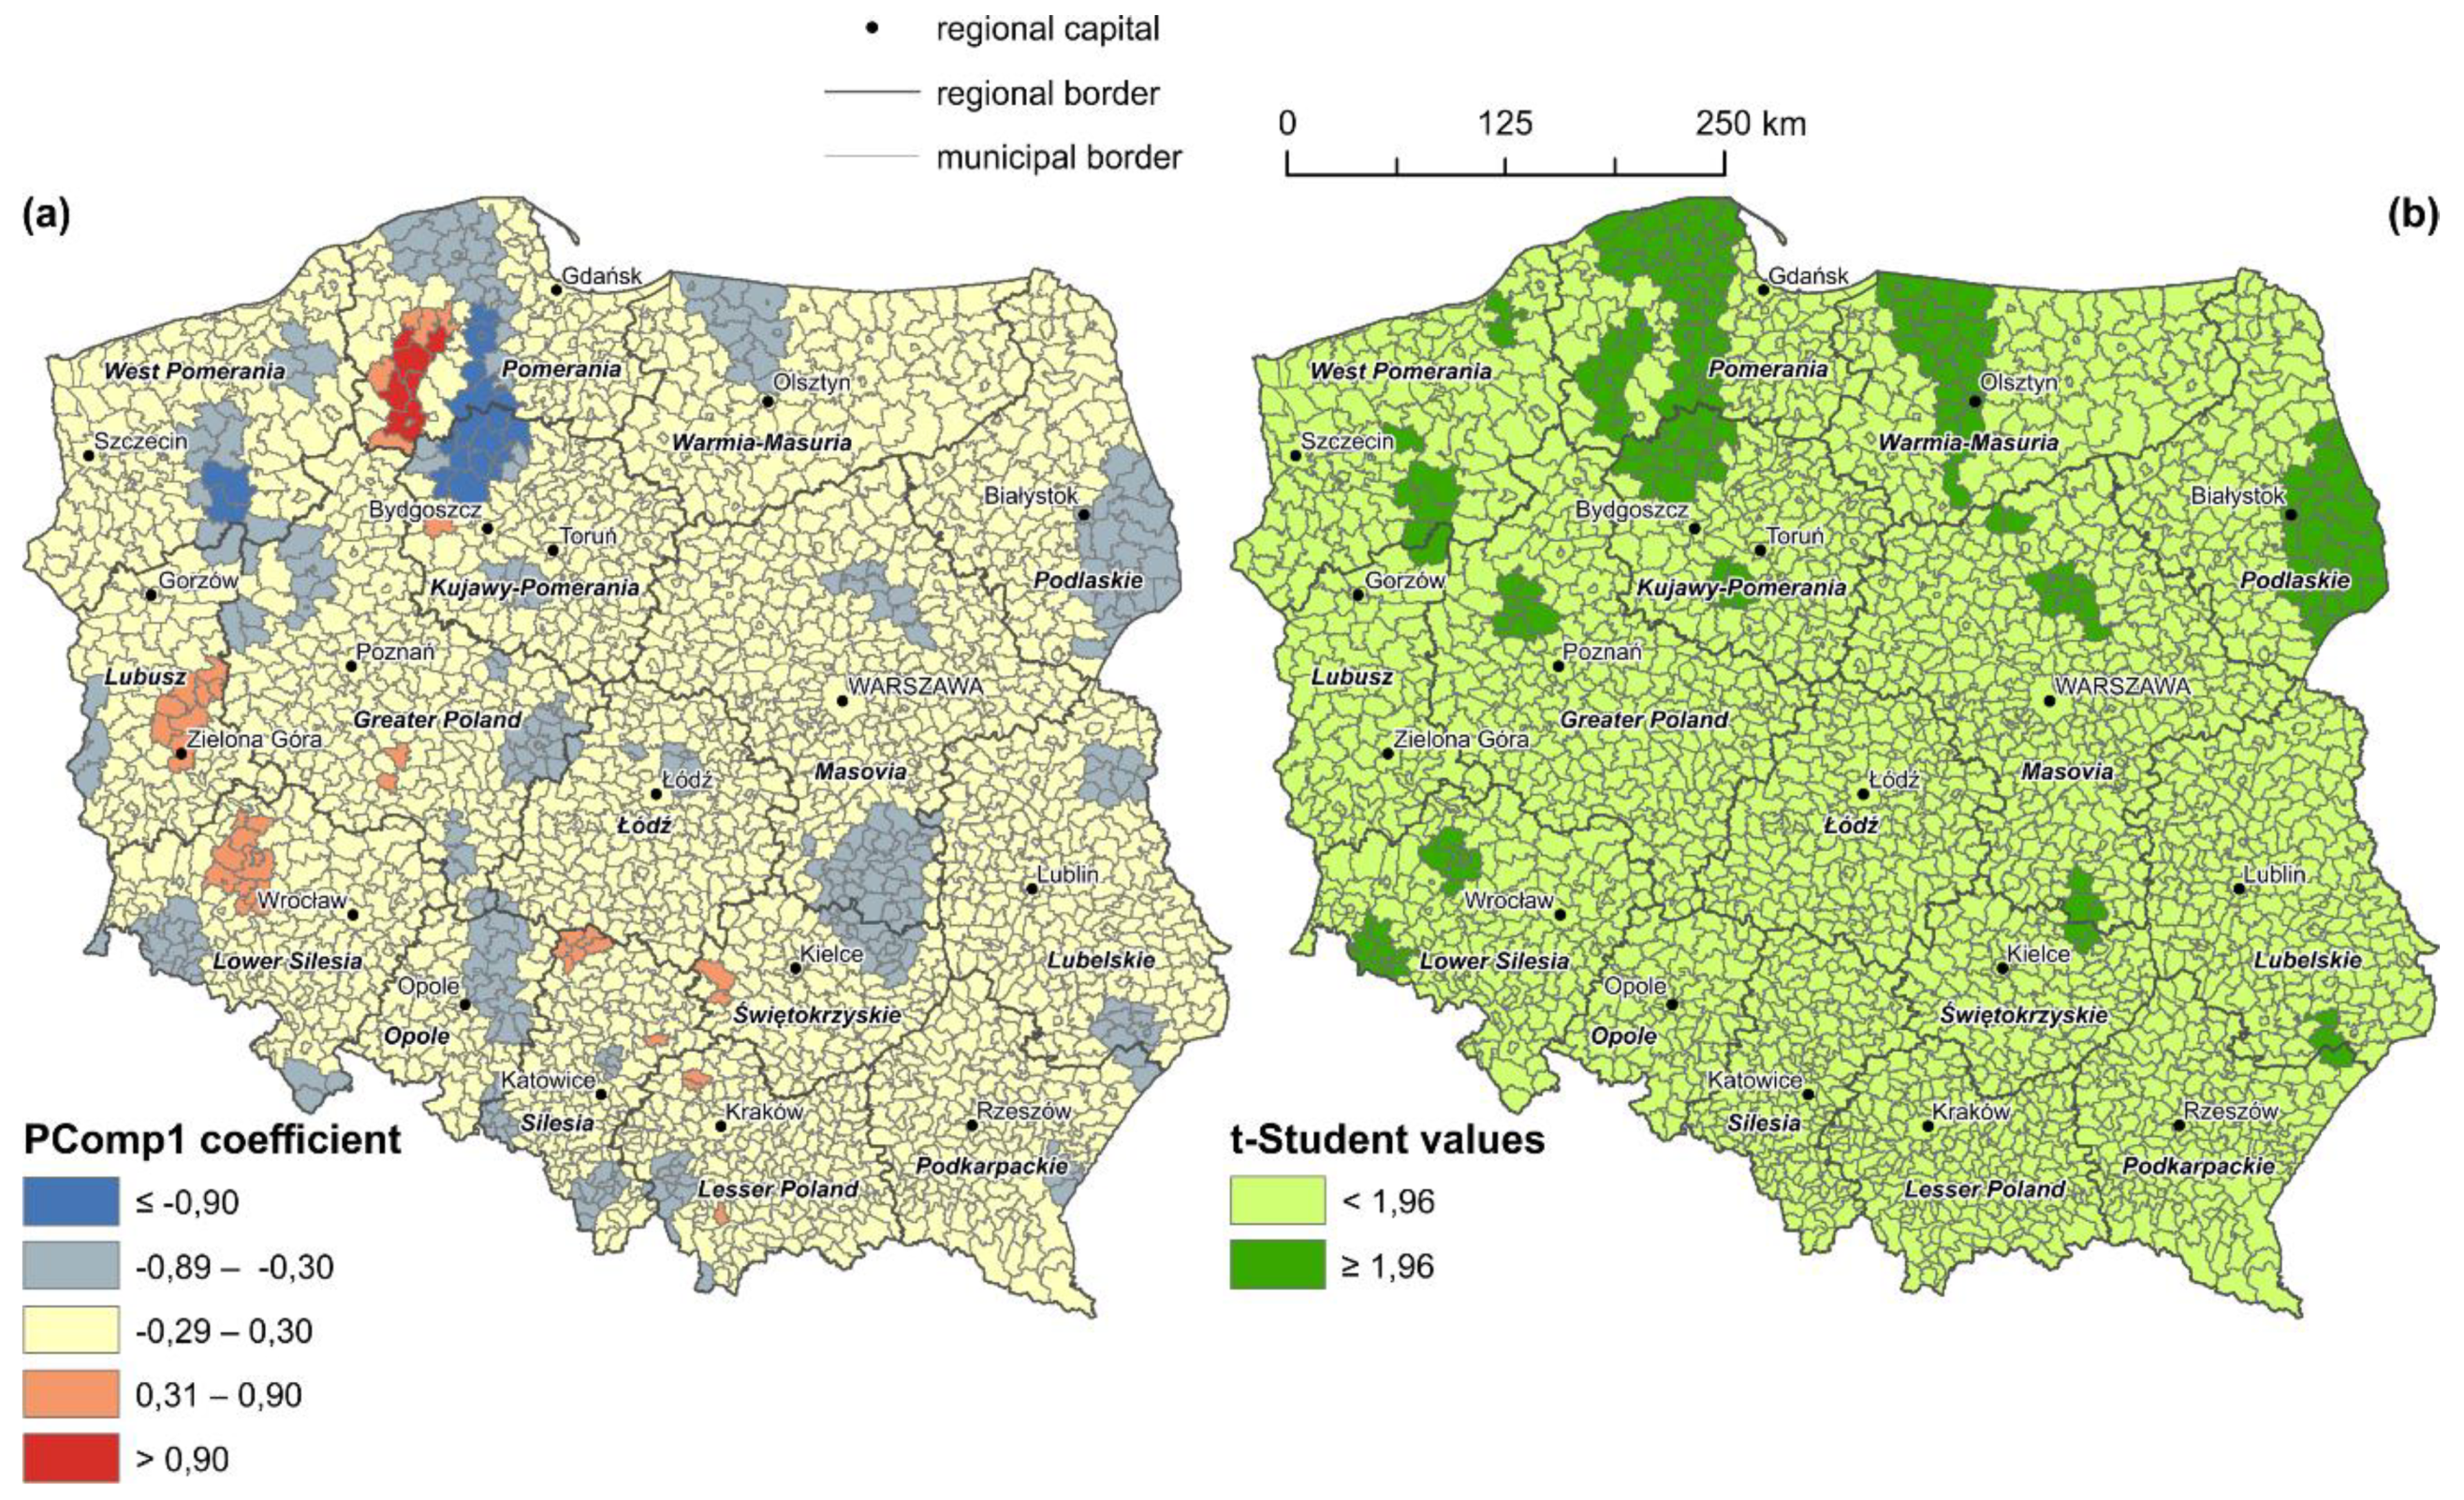
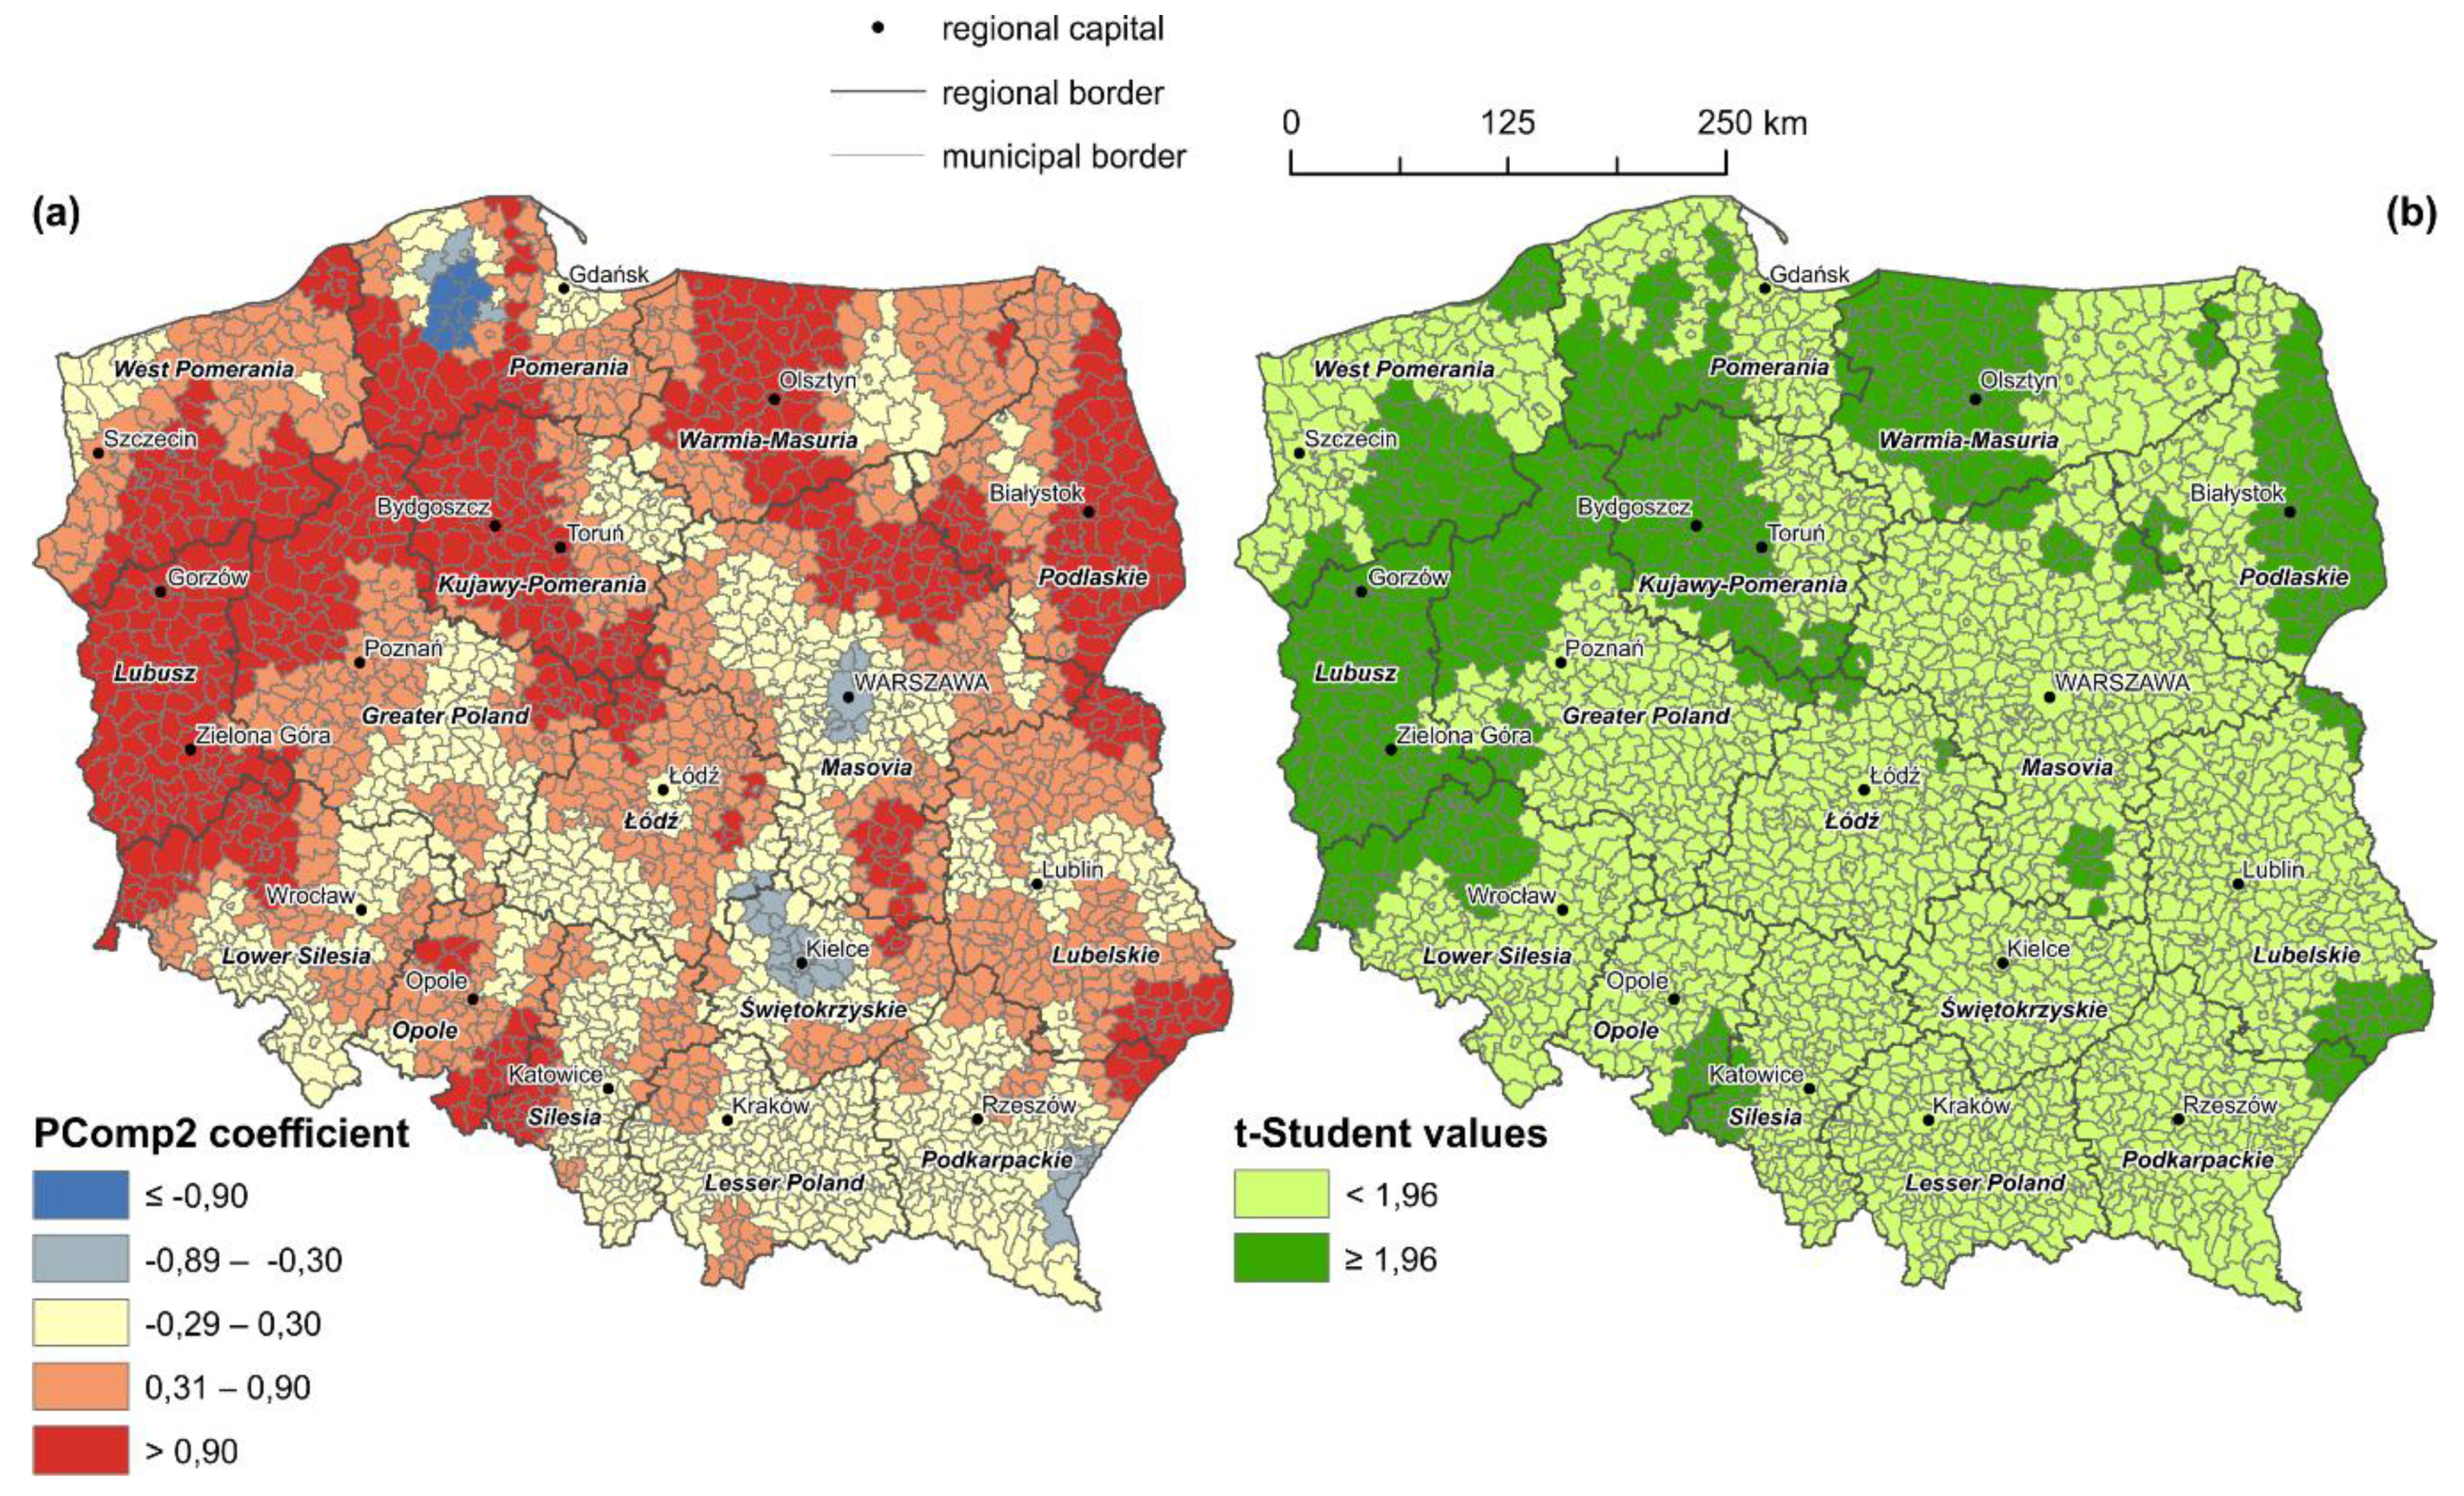
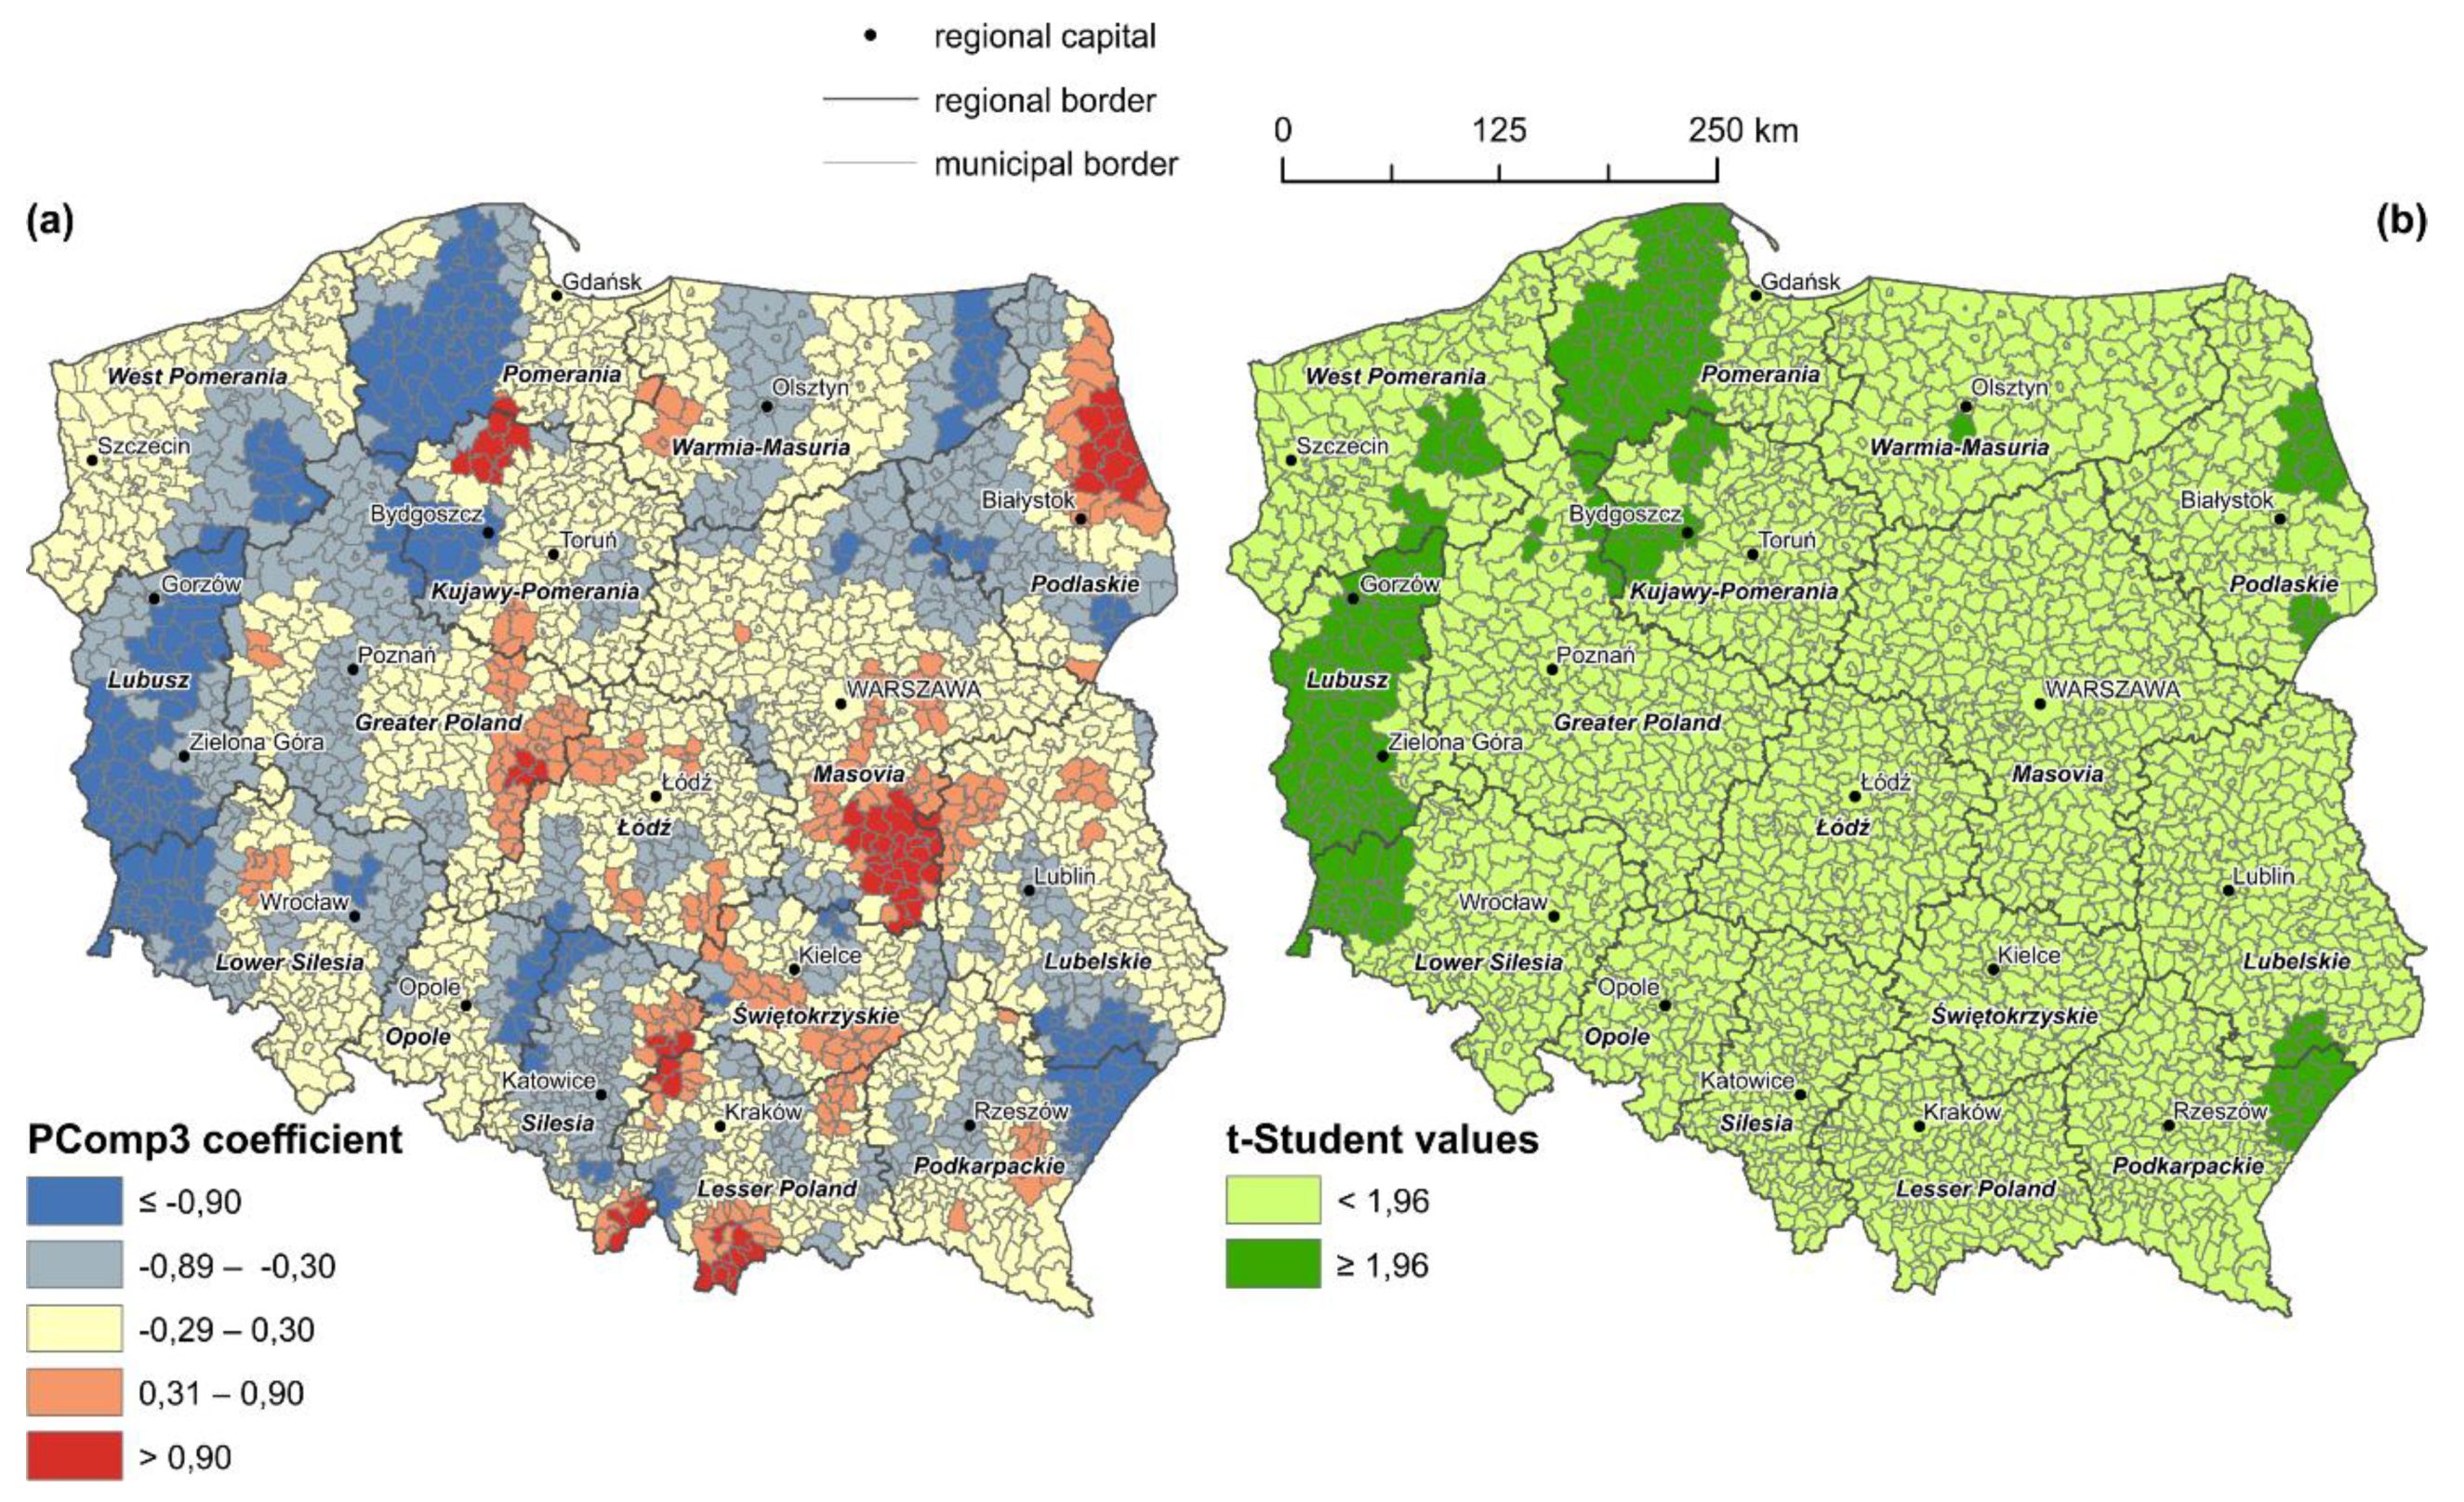
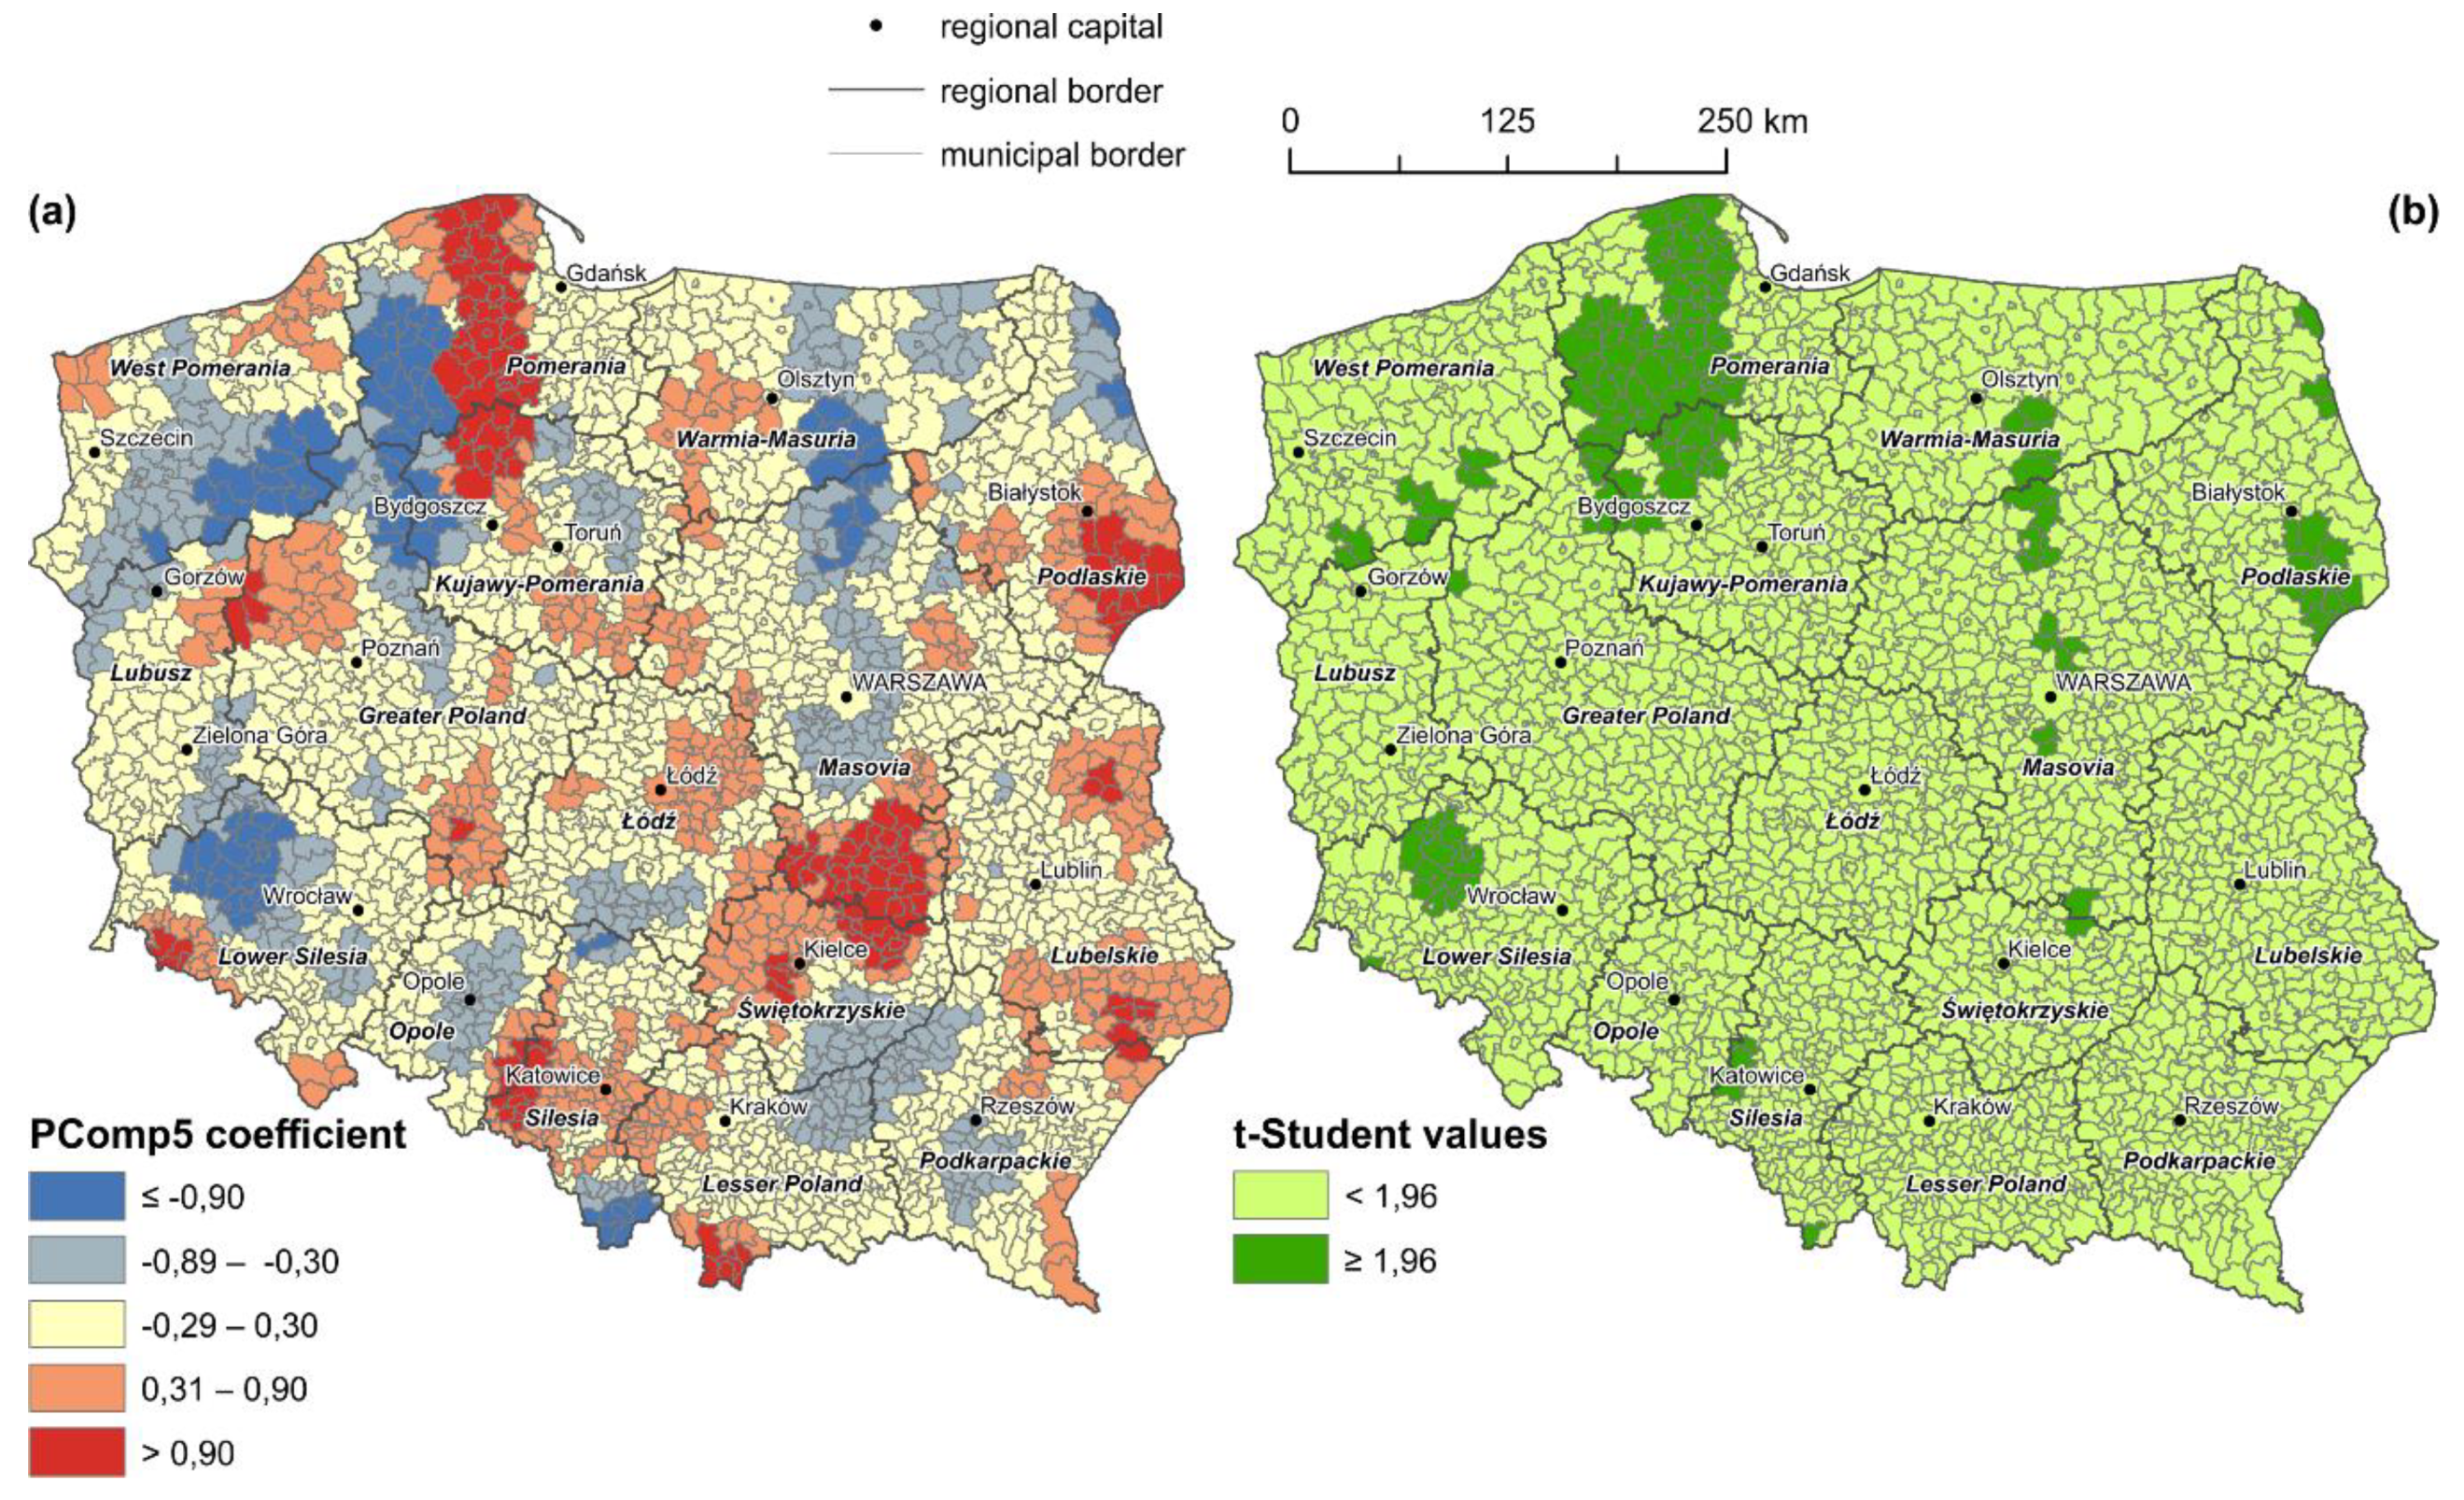
Abbreviation of Investigated DeterminantPrincipal Component 1 [Urbanization and EU Support]Principal Component 2 [Environment]Principal Component 3 [Land Fragmentation]Principal Component 4 [Inaccessibility]Principal Component 5 [Depopulation]
DENSROADS0.295−0.2650.139−0.1120.077
DISTMROAD−0.107−0.040−0.017−0.229−0.378
DISTPORT−0.118−0.1890.118−0.438−0.206
DISTRAIL−0.158−0.072−0.056−0.450−0.299
DISTCITY−0.106−0.053−0.082−0.5490.166
AVFARM−0.090−0.104−0.641−0.0610.216
DENSBREEIX−0.035−0.335−0.055−0.092−0.133
POPCHANGE0.0020.072−0.1700.284−0.604
POPDENSITY0.3930.014−0.044−0.1560.103
EU1218ALL0.3550.088−0.225−0.044−0.181
EU1218INFR0.2620.112−0.2900.043−0.347
MUNICINC0.3940.039−0.104−0.1370.014
DENSENTERP0.3900.043−0.113−0.128−0.002
SLOPE−0.0800.5440.015−0.2000.074
RAIN0.0080.5530.062−0.1520.095
DENSBUILD0.372−0.0190.143−0.0950.085
SHAREPROTEC−0.0930.3600.044−0.106−0.192
Table 3. Global model estimating land cover changes in Poland, in the years 2012–2018.
Determinants of Land Cover ChangesCoefficientsStandard Errorst-Valuesp-Values
Intercept1.3560.04728.611p-value → 0
Principal component 1 (urbanization and EU support)−0.1310.020−6.646p-value → 0
Principal component 2 (environment)0.2900.0348.552p-value → 0
Principal component 3 (land fragmentation)−0.4980.039−12.705p-value → 0
Principal component 4 (inaccessibility)0.0710.0411.7290.084
Principal component 5 (depopulation)0.0040.0440.0790.937

