1. Introduction
In coastal areas and urbanized zones, the recent sedimentation or shallow deposits, even anthropogenic, generally bury the previous deposits that can often be rather different from surface formations. This setting frequently hampers the correct assessment of the subsoil, even in the first 5–30 m. This paper analyzes the possible relationship existing between the geological and geomorphological features of an urbanized sector of the coastal plain located in north eastern Italy, and its rate of subsidence measured by multi-temporal differential synthetic aperture radar interferometry (DInSAR) techniques. Here, we test the potential of this method on reconstructing the shallow stratigraphic sequence in areas where traditional in situ and remote sensing surveys, such as geological and geomorphological field work and air-photo interpretation, are difficult or impossible because of the presence of anthropogenic structures.
Land subsidence commonly affects urban areas as a consequence of intensive groundwater exploitation, which reduces the pore water pressure and activates soil consolidation processes. Several cases are deeply studied all around the world as Kolkata [
1], Bucharest [
2], most of the big cities in Central Mexico area [
3]. A well-known case study corresponds to the area of Venice and its mainland, which is rather close to the study area and where several pioneering researches were carried out [
4,
5,
6] (and reference therein). Another frequent cause of subsidence is the realization of new buildings and infrastructure that are underground excavations and tunneling, which alter the subsoil stress conditions and trigger compaction effects [
7,
8,
9].
Monitoring of land subsidence could be performed through conventional techniques, which include repeated leveling or global positioning system (GPS) surveys [
10,
11,
12]. Despite the relatively high horizontal and vertical accuracy, the main limitations of these monitoring strategies are the punctual nature and low resolution of the measurements. Alternatively, remote sensing techniques, like unmanned aerial vehicle (UAV) [
13], airborne laser scanning [
14], or airborne surveys in general, lead to distributed information over the area of interest. Unfortunately, a dense temporal resolution of these measurements is costly and time-consuming, limiting their availability to very few areas. Therefore, in the last two decades, DInSAR techniques have been extensively applied to estimate displacements caused by subsidence [
15,
16,
17,
18,
19]. DInSAR techniques provide a good compromise between the temporal and spatial resolution of these measurements, which could be effective for the analysis of surface deformation over extended areas.
When applied to urbanized areas, DInSAR techniques are generally used to detect and assess surface deformations and damage induced on buildings, or other anthropogenic structures by natural or human-induced processes. An increasing number of studies have been performed on the effects of recent urbanization and subsidence effects, exploiting space-borne satellite data and trying to find a connection between interferometric remote sensing techniques, civil engineering, and urban developing planning. Some recent applications focused on cross-rail, being in London [
20], on the effect of differential subsidence affecting buildings in some Rome neighborhoods [
21], or on bridge-monitoring [
22].
Due to the numerous advantages of DInSAR techniques and the growing availability of synthetic aperture radar (SAR) satellite data, amplitude and phase information from SAR images have also been used by applying different techniques in order to investigate many topics of geosciences, including geology [
23,
24]. Most of the geological applications are related to earthquakes [
25,
26,
27], volcanic eruptions [
28,
29,
30], tectonics [
31,
32,
33,
34], and landslides [
35,
36,
37,
38], while few research has been focused on the potential of multi-temporal DInSAR as a tool for geological and geomorphological mapping [
39]. This represents the main aim of our research.
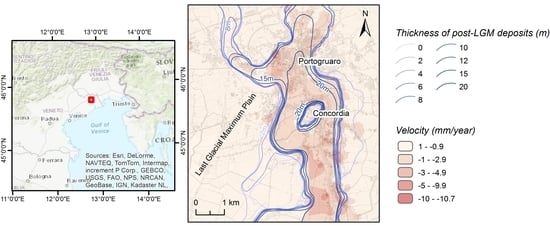
To test our hypothesis, we considered an area near the city of Portogruaro, in the eastern part of the Venetian Plain (
Figure 1) at the passage from the alluvial to the coastal plain, where fluvial and lagoon/coastal deposits are present. In this area, the on-going subsidence was investigated at a regional scale. The combined use of DInSAR and DGPS measurements highlighted the occurrence of a zone where the subsidence value reaches up to 2–7 mm/year, while in the surrounding zones the average values are between 0 and 1 mm/year [
6,
12,
40,
41]. This down-lifting area is elongated in N-S direction, has an average width between 1 and 2 km [
41] and, when compared to geological maps [
42], seems to coincide with a major incised filled fluvial valley existing in the area. The sedimentary deposits filling this valley are very different from the ones forming the external alluvial plain and they are characterized by a larger compressibility. These characteristics led to mapping the differential subsidence currently affecting the area by multi-temporal DInSAR techniques, and check whether the pattern of down-lift matches with the planform of the buried valley so that it can eventually improve the detection of its boundaries. The comparison between remote-sensed data and geological ground truth is supported by the availability of recent geological maps, and a huge database of stratigraphic cores and geotechnical tests [
42,
43].
In the next sections, the main geological and geomorphological features of the study area are reported (
Section 2); after the description of SAR data and processing and post-processing methods used to test the contribution of interferometric data in geological and geomorphological mapping (
Section 3), the obtained results are presented (
Section 4). Finally, the results are discussed in
Section 5 where, due to the large amount of gathered information, we will preliminary explore the possible causes of the subsidence.
2. Study area
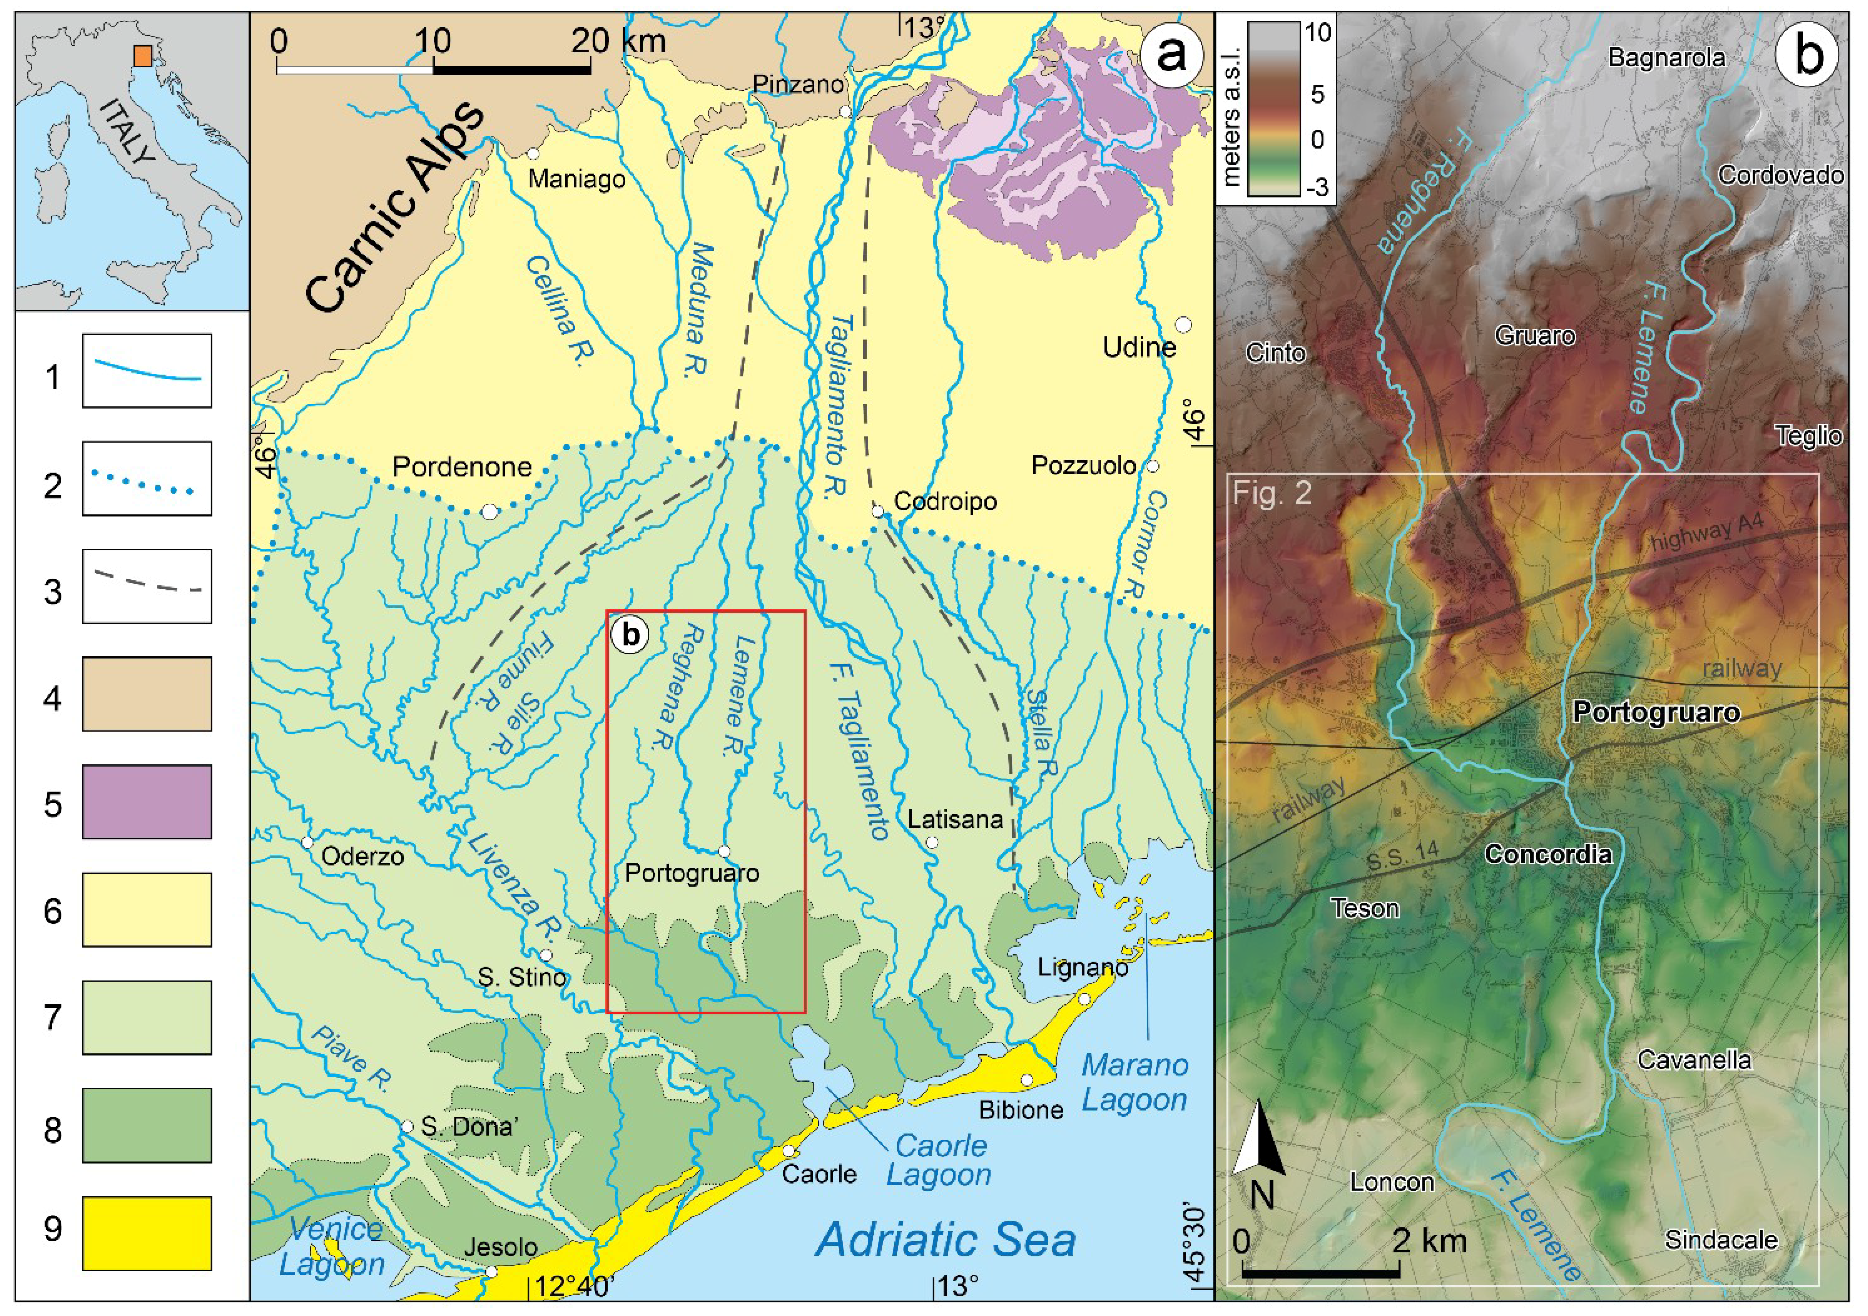
This research analyzes the distal sector of the alluvial megafan of Tagliamento River (
Figure 1), that is fed by the Carnic and Julian Alps and is one of the major streams of the Venetian-Friulian Plain [
44]. The plain corresponds to the foreland basin of the south-eastern Alps and is formed by Plio-Quaternary deposits, which along the coastal sector, between Tagliamento and Livenza rivers, have a thickness from 500 to 800 meters [
45]. Active tectonic structures are not present in the study area, but the distal plain is affected by a long-term subsidence related to crustal flexuring and the compaction of Quaternary deposits, with an average vertical rate of −0.4 mm/year in the last 125 kyr [
40,
46].
In the study area the first subsoil consists of Late-Quaternary alluvial sediments, alternated with coastal deposits. A major phase of deposition occurred during the Last Glacial Maximum (LGM, 29–19 kyr BP [
48]), when the Tagliamento alluvial megafan was formed and 15-30 m of alluvial sediments aggraded over the whole Venetian-Friulian Plain. During that period, the mountain catchment of Tagliamento hosted a major Alpine glacier, which reached the plain with its front (#5 in
Figure 1a [
49]). The Tagliamento River was one of the main glacial outwashes but, at that time, it was characterized by an unconfined channel, which transported the gravel only up to 15-25 km from the glacial front, while sands, silts, and clays reached the distal sector of the plain [
50]. Thus, the distal portion of the LGM megafan of Tagliamento is dominated by fine sediments and along the boundary, between coarse (permeable) and fine sediments (impermeable), a belt of springs feed a dense network of minor streams (
Figure 1a). These are groundwater-fed rivers, which are characterized by a rather steady water discharge along the year and almost no sedimentary load, as they originate in the middle of the plain [
51] (and reference therein).
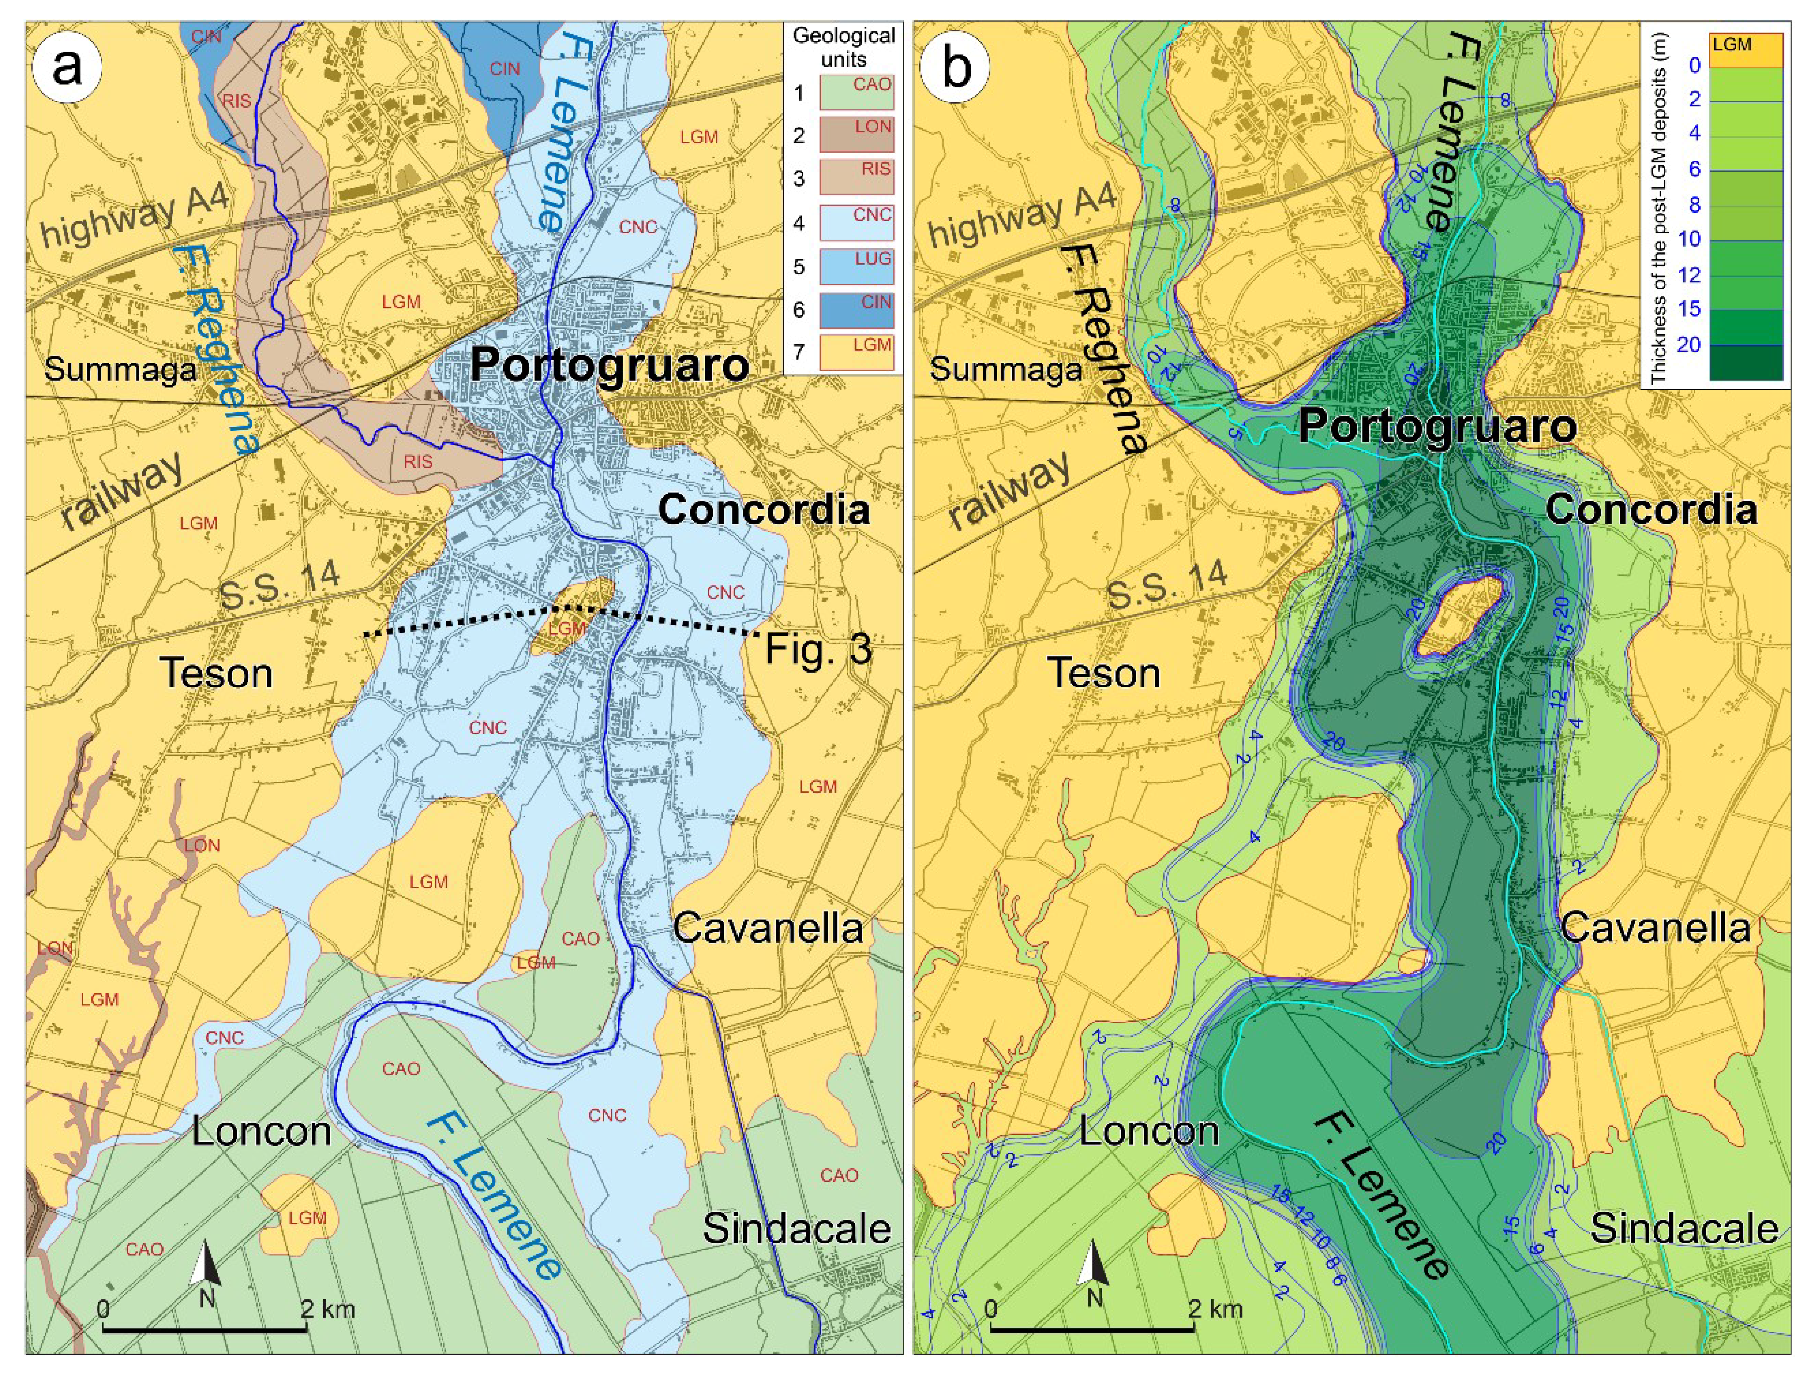
Since 19.5 kyr BP, the front of Tagliamento glacier withdrawn from the plain and, consequently, the fluvial system experienced a severe starvation in the sediment supply that led the river to entrench along few narrow incised valleys [
50]. This process induced the river to abandon, almost completely, the alluvial megafan, leading the LGM surface to be exposed over large sectors of the plain up to the present (
Figure 2a). Where the LGM surface is still cropping out, is marked by a rather well-developed soil, which is over consolidated and characterized by the occurrence of calcic horizon [
51] (and reference therein) [
52].
Two of the major fluvial valleys incised by the ancient Tagliamento, in the post-LGM, have been occupied by Lemene and Reghena River, which are important groundwater-fed streams (
Figure 2b). The incised landforms can be recognized in the landscape up to Portogruaro, where the rivers join. The geomorphological evolution occurred along the Holocene brought to the abandonment of the incised valleys and their progressive infill, leading to the obliteration of their topographic evidence in the coastal plain. The combined analyses of detailed digital elevation models (DEMs) and stratigraphic cores that can recognize and characterize the fluvial incision between Portogruaro and the Lagoon of Caorle (
Figure 2b). This buried sector of the incised valley has been also named the valley of Concordia, after the name of the Roman city of
Julia Concordia, that was built over a remnant terrace of LGM plain isolated inside the valley [
42,
47,
50].
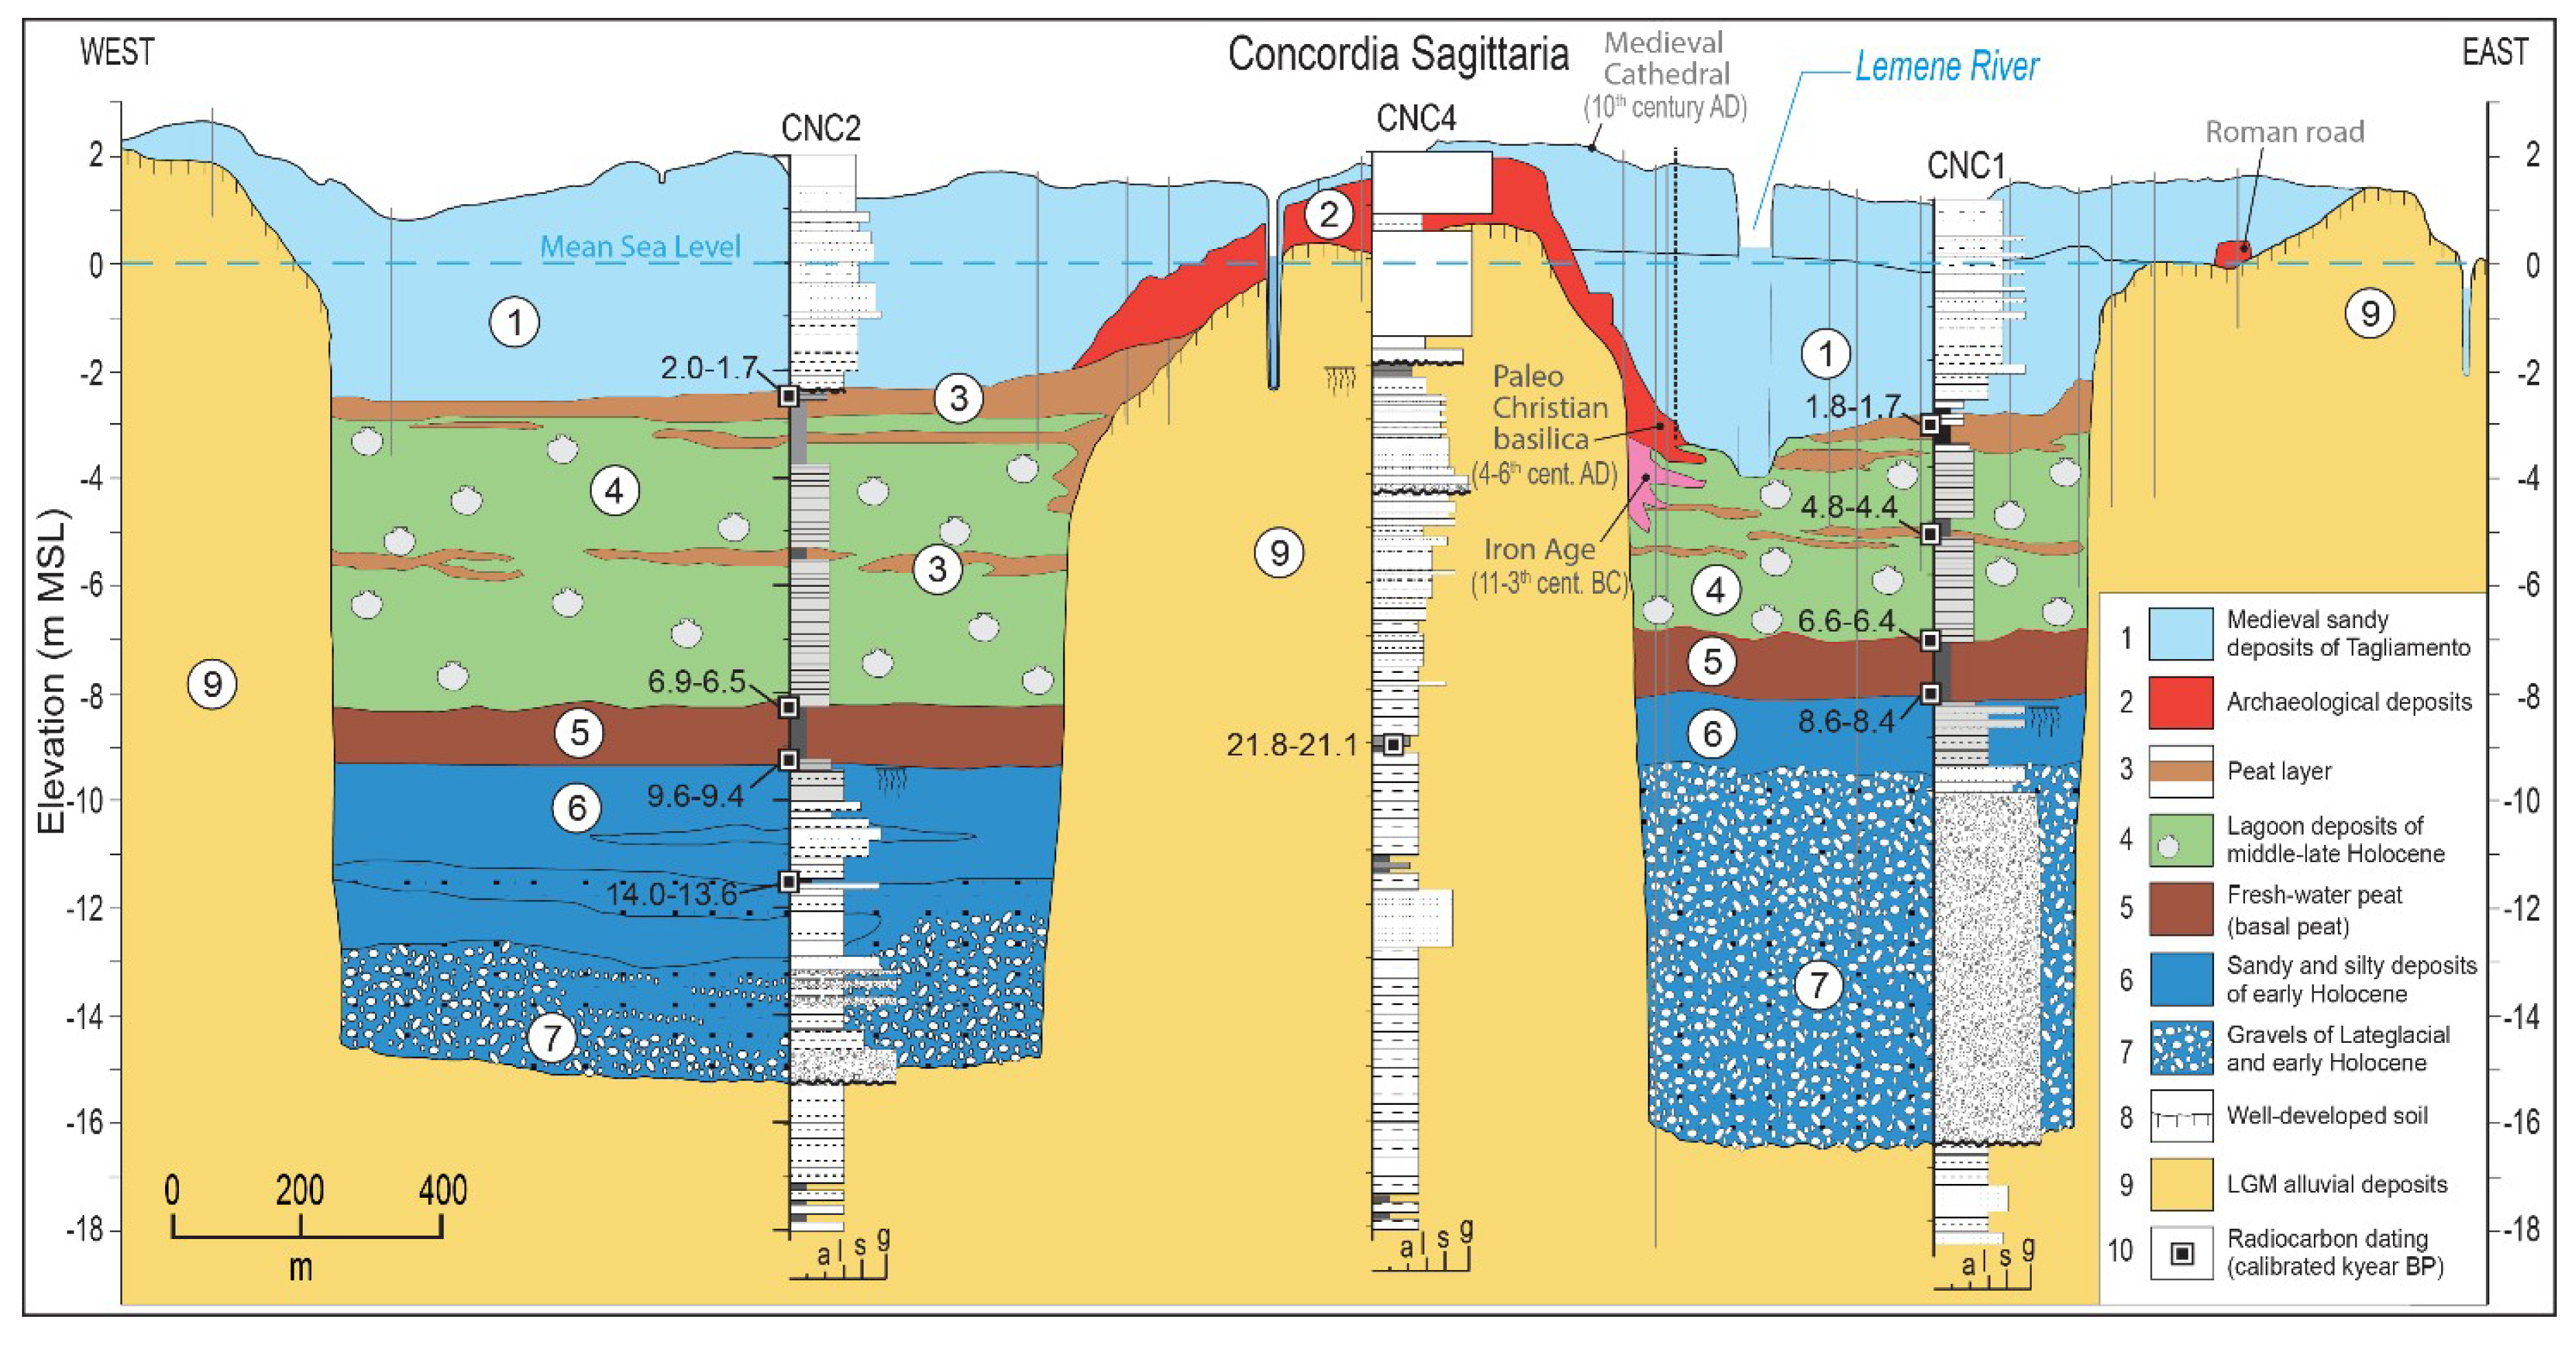
In the distal plain, the fluvial incisions were active between Late Glacial and Early Holocene (i.e., 19–8 kyr BP) and these landforms were between 500 and 2000 m wide and reached a maximum depth of 20 m to the top of the LGM (
Figure 2b and
Figure 3 [
42,
51]). Because of the funneling of the river flux, at the bottom of the incised valleys the gravels could be transported far more downstream than during the LGM and reached the present coastal plain. Avulsion processes occurred upstream of the study area between 9.6 and 8.4 kyr BP and caused the eastern shifting of the Tagliamento River, leading to the abandonment of the incision. The valley of Concordia was rapidly waterlogged and occupied by swampy environments that favored the accumulation of up to 1.5 m of peat and organic sediments (#5 in
Figure 3).
Between 8.5 and 7.5 kyr BP, the post-LGM marine transgression reached the present coast [
53] and led the lagoon waters to expand along the pre-existing depressed areas, as the abandoned fluvial incisions. Thus, the brackish environment occupied the bottom of the valley up to the center of Portogruaro, and deposited within the incised valley a greenish gray muddy unit characterized by the common occurrence of lagoon fossils and some lenses of peat. This brackish and swampy setting characterized the valley of Concordia until the early Medieval, when an important avulsion phase led the Tagliamento to temporarily activate a branch along the present Lemene River [
42,
47]. Between the 6th and 8th century AD, the river floods deposited a huge quantity of sediment that completely buried the valley downstream of Portogruaro and sealed large sectors of the ancient city of
Julia Concordia [
47] (and references therein). This phase formed a remarkable fluvial ridge, which is visible from the highway A4 almost to the present lagoon (
Figure 1b). The Lemene River is currently flowing along the residual channel of Tagliamento, that was maintained open and prone to the activity of groundwater after a sudden avulsion, which moved the Alpine river to its present direction near Latisana (
Figure 1a [
47]).
The last important phase in shaping the present landscape occurred in the first part of the 20th century, when large sectors of the Caorle Lagoon had been reclaimed for agricultural purposes. Nowadays, between Tagliamento and Livenza rivers, about 100 km
2 are lower than sea and are drained thanks to the lagoon dykes and a complex network of ditches, canals, and pumping stations (#8 in
Figure 1b).
3. Materials and Methods
The evolution and rate of surface deformations have been obtained through the processing of several space borne synthetic aperture radar (SAR) datasets, acquired by different national and international missions, and characterized by various ground resolutions, satellite revisiting time, and acquisition geometries. As listed in
Table 1, ERS-1/2, ENVISAT, COSMO-SkyMed, and Sentinel-1 datasets have been considered. The main specifics of each dataset influence the expected results. One of the parameters, which could condition the multi-temporal DInSAR results is the wavelength, which determines the data sensitivity to surface variation and vegetation changes. Moreover, the satellite revisiting time acts on the data temporal decorrelation, therefore the multi-temporal coherence and the persistent scatterers density tends to increase as the time span between subsequent images decreases. All the technical details of the considered SAR data are reported in
Table 1. The availability of this archive data has allowed the reconstruction of almost 26 year deformations, from 1992 up to 2017, with some limited temporal gaps. For all the datasets, descending acquisition geometry has been considered because of the larger amount of available scenes, in particular for the ERS, ENVISAT and COSMO-SkyMed (CSK) datasets. The unique acquisition geometry allows a consistent comparison of the results along the line-of-sight (LOS), despite some differences in the incidence angles. Only the ERS data, both ascending and descending datasets, have been considered to verify whether the expected vertical direction of deformation, common for the subsidence phenomenon, could be confirmed.
The multi-temporal DInSAR techniques extend InSAR analyses to retrieve the spatio-temporal evolution of deformations over large areas, considering a stack of data. In this context, the numerous approaches, developed in the last two decades, can be classified into two main categories, the persistent scatterers interferometry (PSI) [
54,
55] and the small baseline subset (SBAS) [
56]. Generally, the PSI approach generates all the interferograms referred to as a common master image, detecting point targets characterized by a stable back-scattered signal over time, and a high coherence between different acquisitions. The SBAS algorithm maximizes the spatio-temporal coherence by relying on interferograms characterized by small perpendicular baseline values. Therefore, PSI is generally applied to analyze deformation affecting urban areas while SBAS is more adequate on distributed scattering conditions.
Here, data processing was performed through the PSI technique as the study area is densely urbanized. This remote sensing technique can measure Earth surface displacement from space, with millimetric sensitivity. This method exploits multiple SAR scenes acquired over the same area and, through the algorithm proposed by [
54,
55], is able to separate the displacement component of the phase from the back-scattered signal. Identifying the persistent scatterers (PS) candidates depends on the dispersion of the amplitude of the backscatter signal in time, but additionally a multi-temporal coherence threshold could be defined to filter the most reliable points. Thus, the density of the output results is strongly dependent on the land use and, in our case, on the urbanization density.
The main output of the PSI processing is a mean deformation velocity map along the satellite line of sight (LOS) showing a velocity value for each of the selected PS. Furthermore, the time-series of displacements is obtained, providing not only the mean displacement rate but also the evolution in time of the deformation trends. This is essential information to support the results interpretation and its connection with a specific triggering factor. The precision of the deformation velocity depends on several factors, as the number of scenes and their temporal distribution, the PS density, their coherence, the characteristics of the deformation evolution in time, the reference point quality, the distance from the reference point [
57]. According to [
24], numerous PSI validations have been carried out in the last 15 years, providing an inter-comparison of common PSI results from different groups. In the framework of Terrafirma project [
58], the standard deviation of the deformation velocity differences ranges between 0.4 and 0.5 mm/yr, while it reaches 1.1 to 4 mm for deformation time-series. These values refer to ERS and Envisat datasets, considering urban areas with zero or moderate deformation velocities.
ERS-1/2 and ENVISAT interferometric data, derived by PSI processing performed by TRE srl, were provided by the Italian Ministry of the Environment and for Protection of the Land and Sea in the framework of the “Not Ordinary Plan of Remote Sensing” project (
http://www.pcn.minambiente.it/mattm/en/). COSMO SKY-Med and Sentinel-1 interferometric data were derived by the PSI processing of SAR images through the SARscape software developed by sarmap SA.
To support one of the main aims of this work, that is, the comparison of PSI results with ground information and specifically with thickness of post-LGM sediments, sparsely distributed PS velocities have been interpolated. The interpolation has been performed on ERS ascending and descending PSI results through the inverse distance weighted (IDW) method. To avoid the underestimation of the ground displacements and better investigate the possible causes of subsidence, interpolated maps have been combined to assess the vertical and horizontal (E-W) deformation components using the following equations [
59,
60,
61,
62]:
where h and e are the LOS directional cosines. If there are no horizontal components, as in the case hypothesized in this study, the vertical displacement rate can be easily derived by taking into account the LOS incidence angle (
:
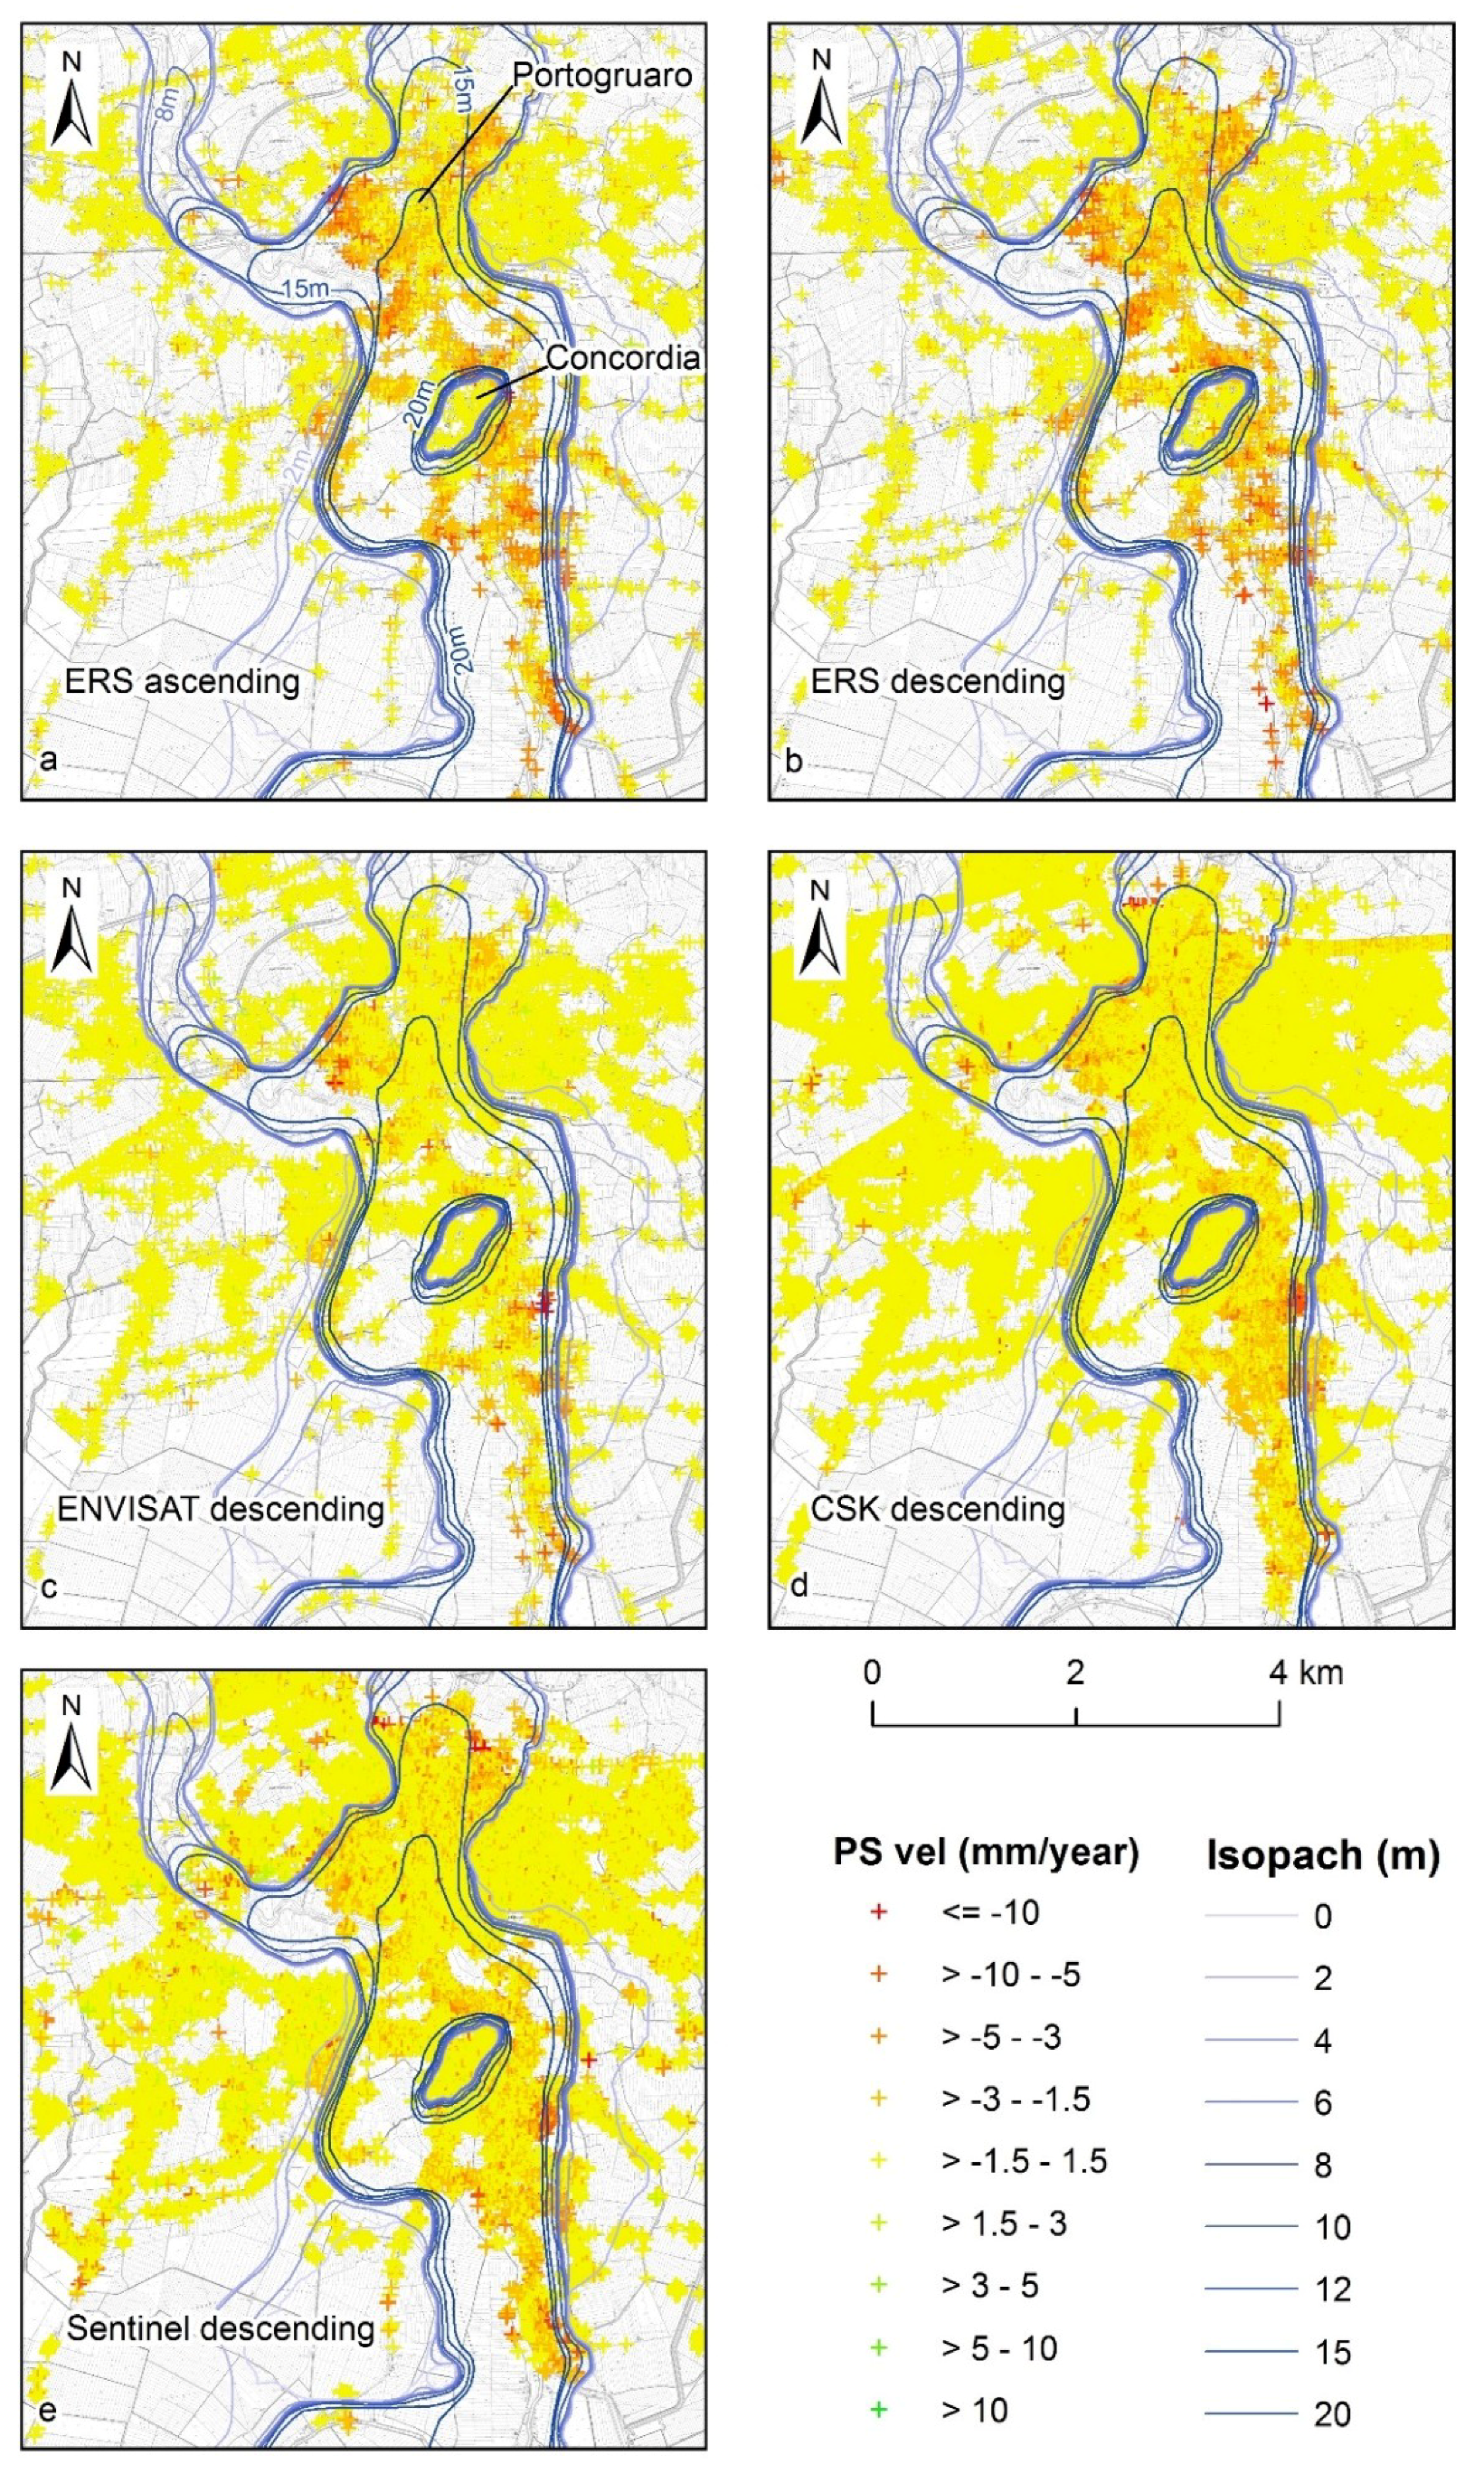
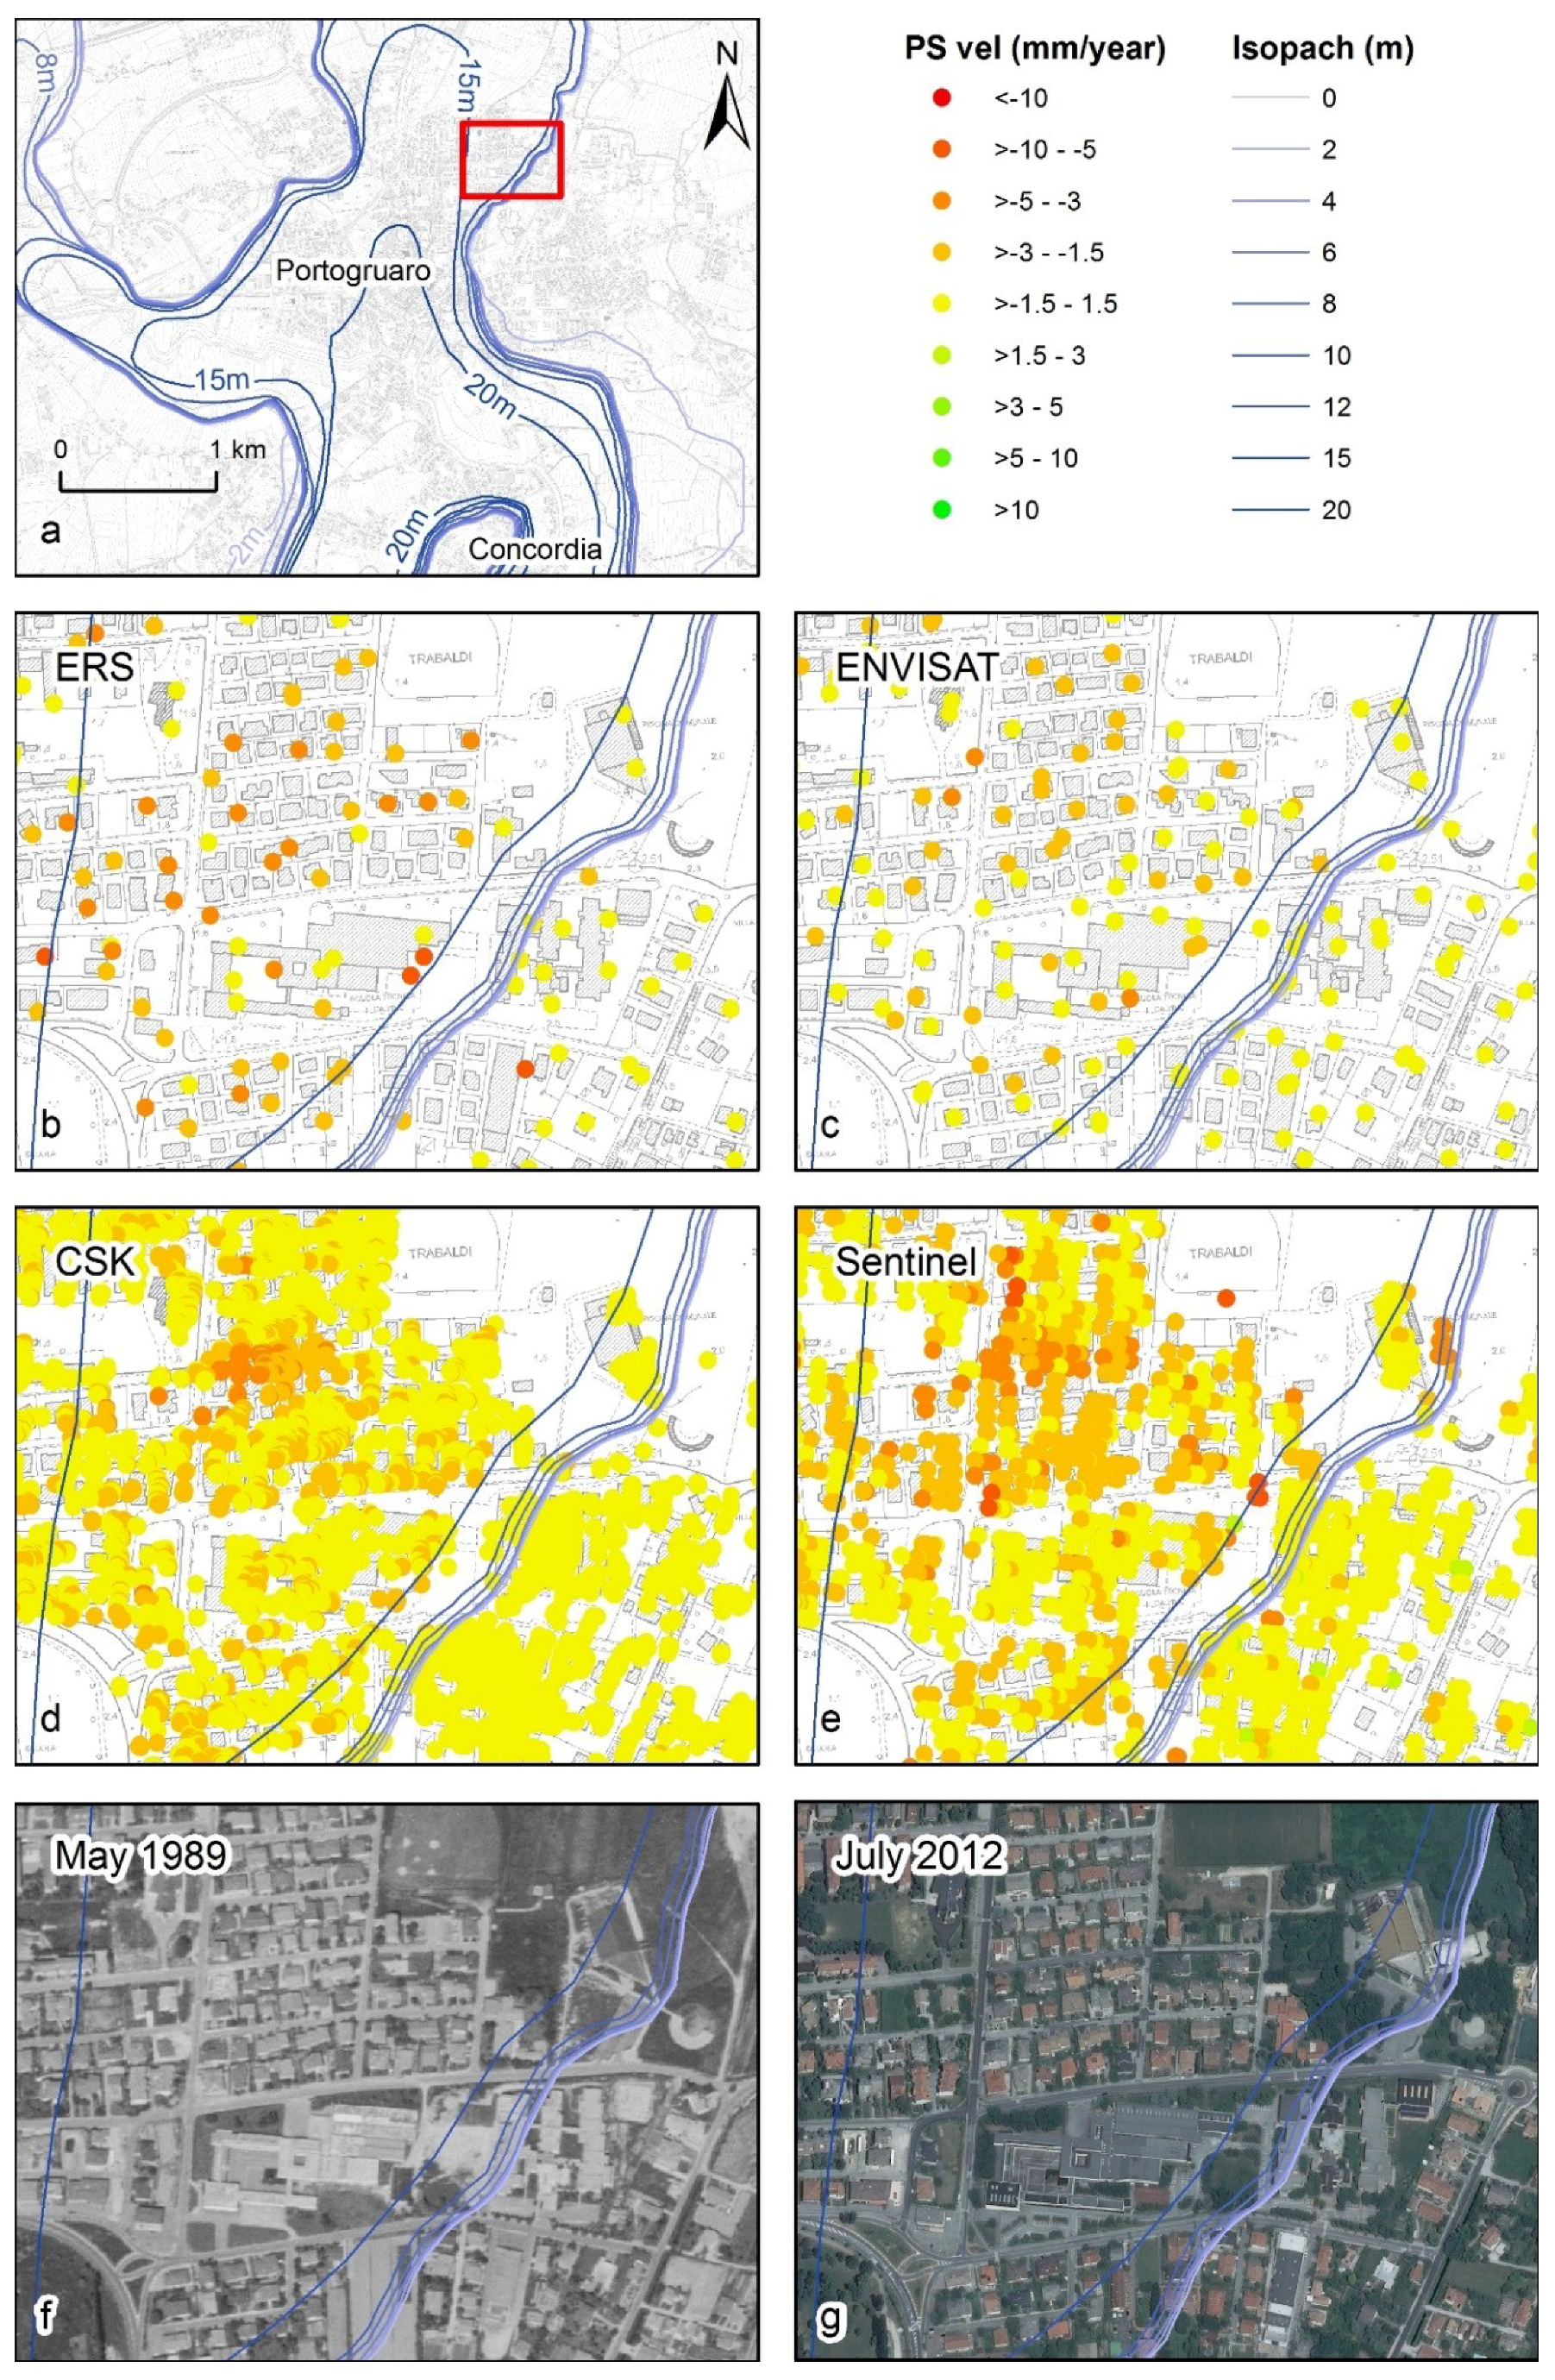
4. Results
Figure 4 reports the PS velocity maps derived by the PSI processing of the different SAR datasets with superimposed the isopach of the post-LGM sediments. Negative values (red) indicate an increase in the distance between satellites and PS measured in the LOS, a green color indicates a decrease in the LOS, and yellow colored PS indicate points supposed stables having a velocity between −1.5 and 1.5 mm/year. As mentioned in
Section 3, SAR data, acquired in descending orbit, have been considered, but we have also reported the results from the processing of ERS 1/2 data acquired in ascending mode to detect whether horizontal components of the displacement are present. As the distribution and the values of velocity are very similar in the two maps, it can be inferred that the displacement is mainly vertical and indicates the subsidence of the area. This evidence was confirmed by the estimation of E-W and the vertical components, combining ERS ascending and descending PS LOS velocities (
Figure 4a,b) through Equations (1) and (2) (
Figure 5). A slightly horizontal component is present in few isolated pixels (
Figure 5a), probably as a consequence of the deformation being related to buildings that can react in different ways to vertical displacements.
Figure 5b shows that the rate of displacement is mainly vertical, with an increment of about 8.7%, compared to those measured along the LOS, taking into account the incidence angle of ERS acquisitions (
Table 1) (see Equation (3)). In the case of ENVISAT, COSMO-SKyMed and Sentinel-1 acquisitions, the expected increment is about 8.7%, 19% and 25%, respectively.
PS density, as expected, increases from the oldest to the more recent interferometric data and with the resolution of SAR images: 61 PS/km2(ERS), 102 PS/km2(ENVISAT), 4765 PS/km2(COSMO-SkyMED) and 1266 PS/km2(Sentinel). This could be explained by considering the higher resolution of COSMO-SKyMed data with respect to all other datasets, the shorter revisiting time, and the small orbital tube of Sentinel-1 acquisitions, which reduced decorrelation effects. To get an acceptable density of PSI points in all four datasets, in the case of ERS and ENVISAT, the final results were filtered using a PS coherence >=0.6, while in the other two cases a coherence >=0.75.
As it can be seen in
Figure 4, most of the negative values in the velocity fell inside the post-LGM incision in the entire observation period. The measured maximum velocities reach −10 mm/year, few and isolated PS showed positive values, which considered errors in the processing and were excluded from the results. The theoretical precisions of the measured deformation velocities are equal to 0.35 mm/year and 0.42 mm/year for ERS ascending and descending datasets, and 0.38 for the Envisat descending datasets. The velocity precisions are even better for Sentinel-1 and COSMO-SkyMed datasets, 0.28 mm/year and 0.25 mm/year respectively.
The relationship between the different displacement rates and the spatial distribution of surficial deposits is clearly evidenced in
Figure 6, where a velocity map of the study area was created interpolating both ascending and descending ERS interferometric data by using the IDW method. Inside the post-LGM incision LOS velocities vary from −1 up to −10 mm/year, while outside the area can be considered stable with velocities ranging from −0.9 to +1 mm/year. Velocity cross sections through the post-LGM incision (
Figure 6b–g) show the different displacement rates between Holocene deposits filling the incision and LGM deposits forming the external plain in different sectors. The sections clearly identify the border of the incision marked by a sudden increase in the velocity, but the rate of displacement can change both into the same section and in the different sectors. These variations can be related to the edification of new buildings during the observation period, which in most of cases represents the triggering factor of the ground displacement. Thus, the different velocities can be explained taking into account the time when soils have been overloaded, as will be better discussed in the next section. Velocity sections D-D’ and F-F’ (
Figure 6e,g) are of particular interest because they show the effectiveness of PSI technique in geological and geomorphological mapping. Section D-D’ shows that, by assessing the subsidence rate, it is possible to identify the limits of the post-LGM incision and also the presence of the remnants of the alluvial terrace existing in correspondence of the ancient city of Concordia Sagittaria, which was built on the fully consolidated sediments of the LGM alluvial plain. In fact, the velocities range from −1 to 0.0 mm/year at the margin of the cross section and in correspondence of this isolated terrace. Also in section F-F’, it is possible to identify the margins of the post-LGM incision, which are marked by the sudden variation in the subsidence rate. In this case, the decrease of ground displacement rate recorded almost at the center of the profile (around 1500 m) is not related to the presence of a buried remnant of the LGM plain, but to the artificial embankment existing along the Lemene River. These anthropogenic structures were built during the 19th century and, probably, this rather long period led to an almost complete consolidation of the subsoil, limiting the on-going subsidence.
Comparing the PS velocity maps of
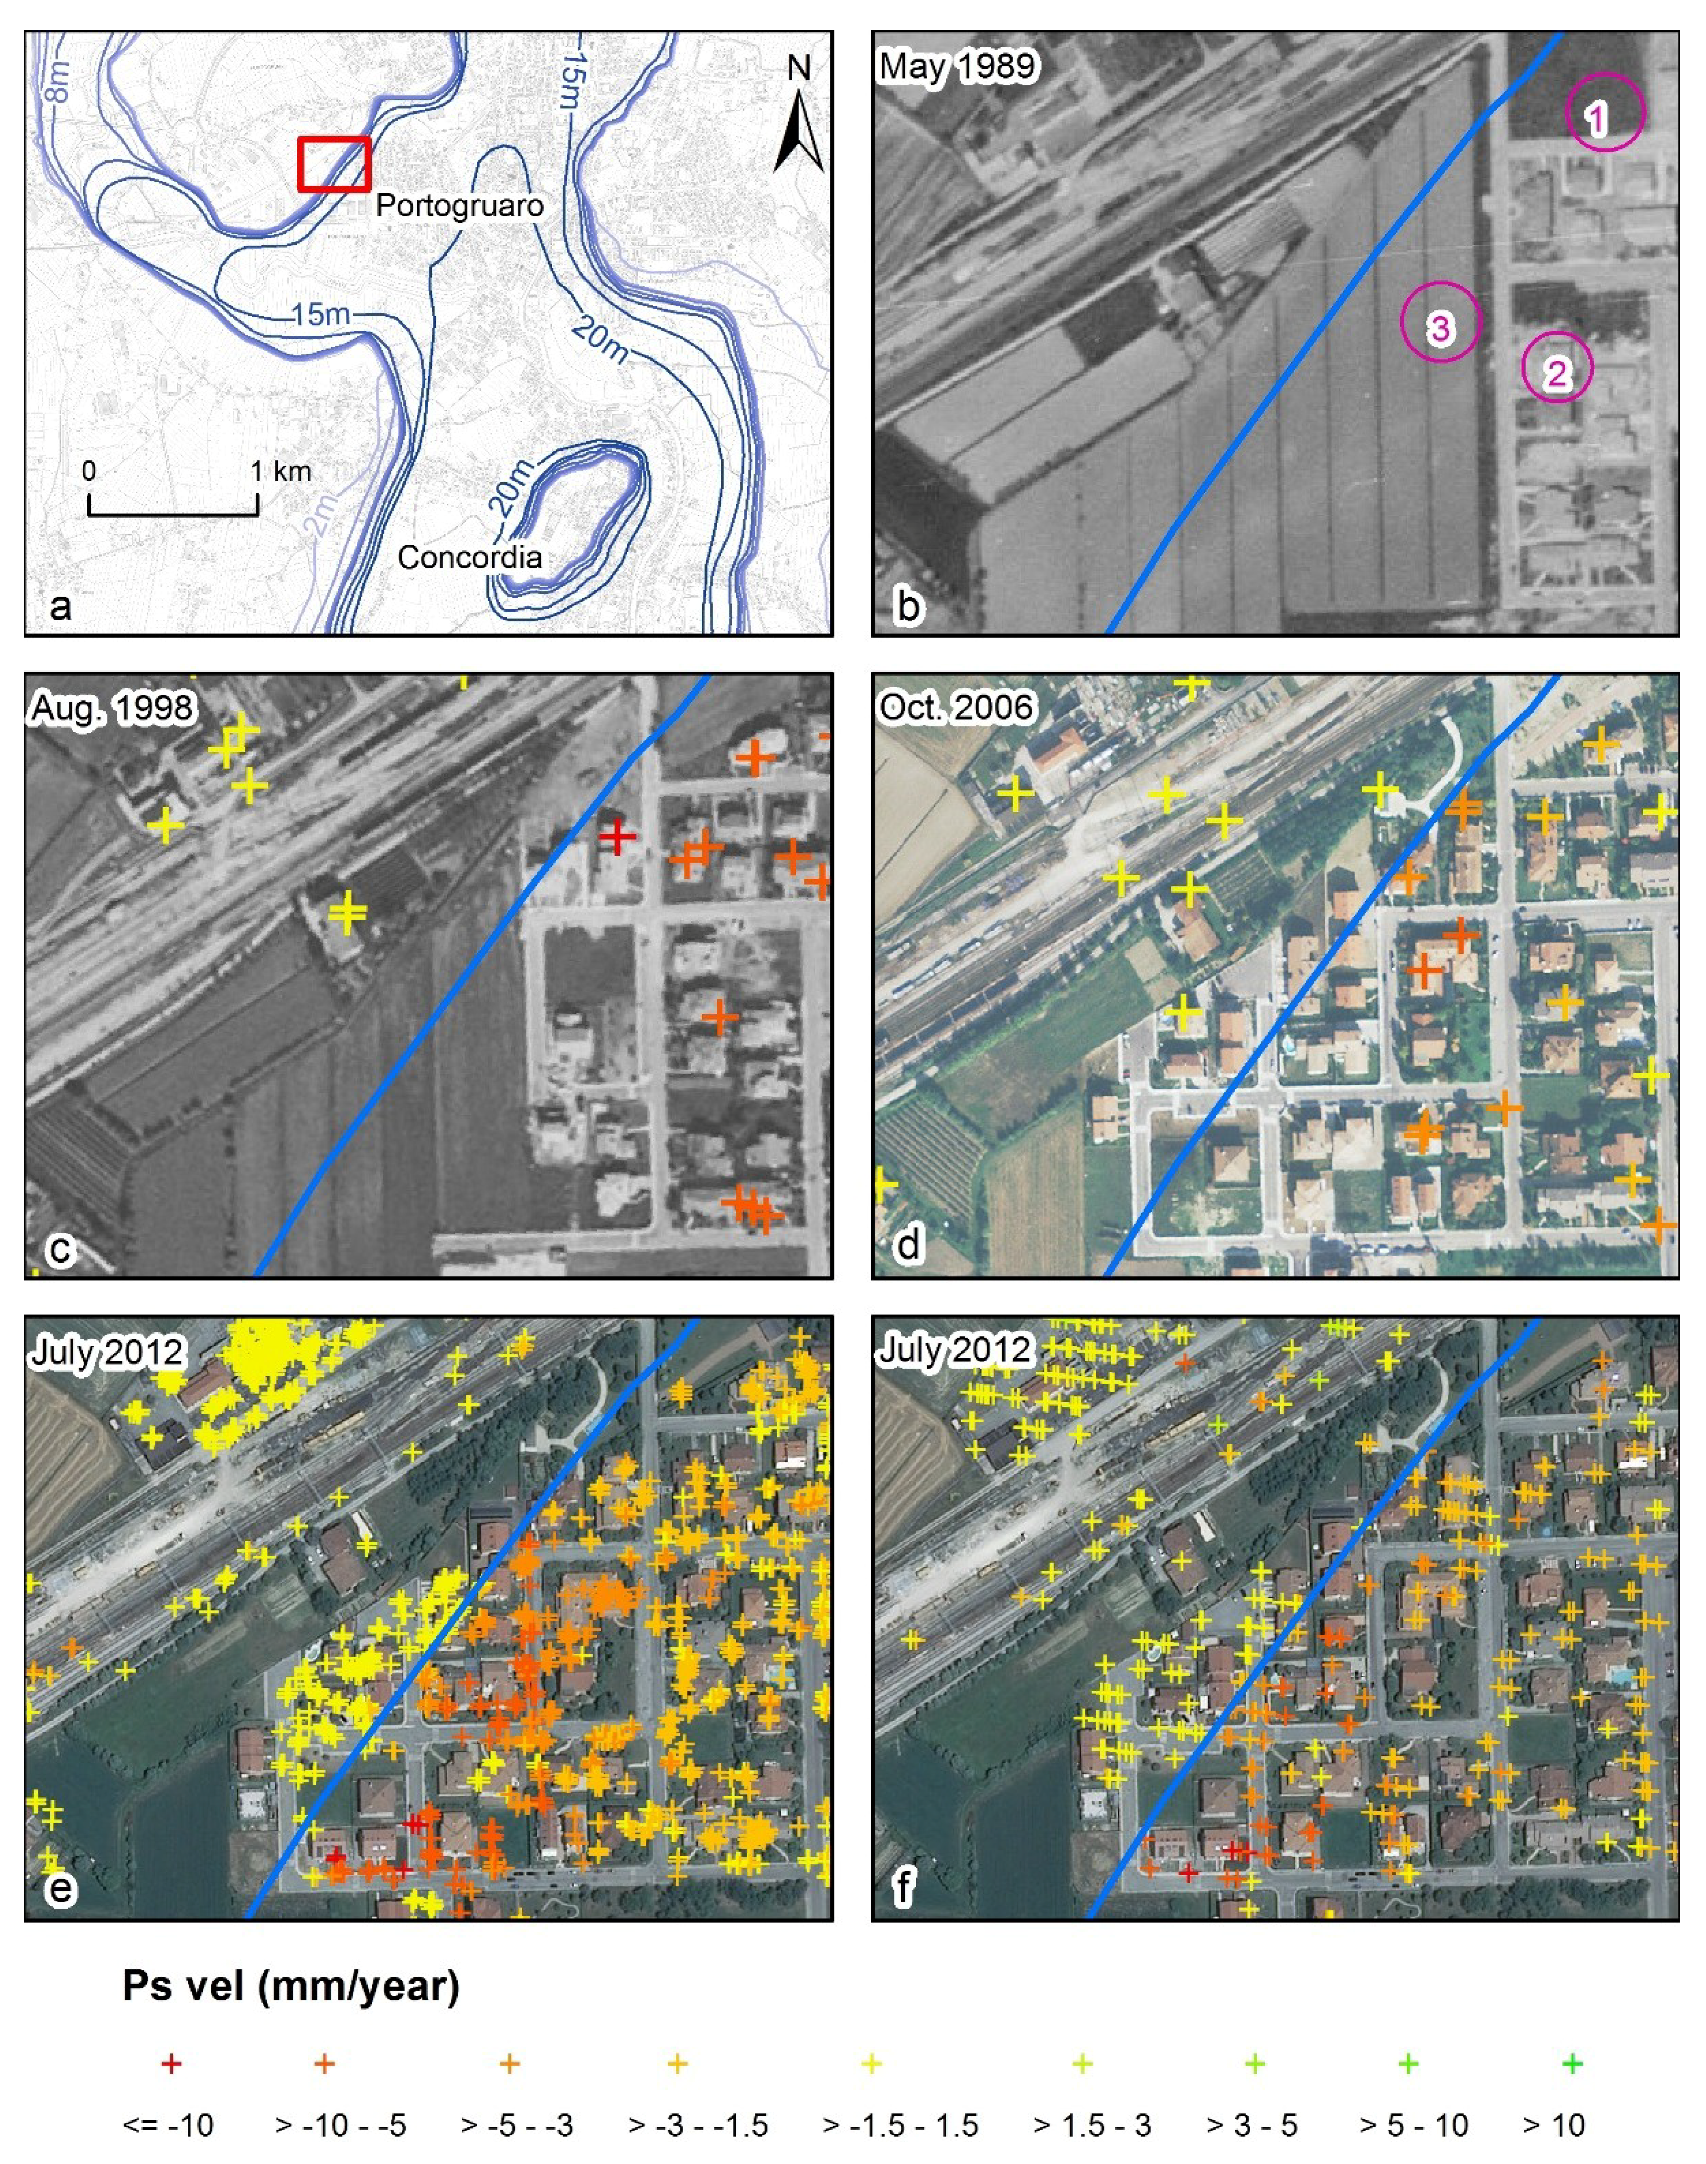
Figure 4, it is possible to note that the subsidence rate of the sectors inside the post-LGM incision decreases over time. This evidence can be better observed considering the area included in the red square of
Figure 7a, located slightly west of the historical center of Portogruaro town. From 1989 to 2012 this sector has undergone intense urbanization with the construction of new residential buildings (mainly mono-familiar houses with two floors and detached houses). PS velocity maps, superimposed on the land cover changes in the observation period, show that all the houses built inside the incision are affected by subsidence, while those located outside it are stable (
Figure 7c–f). The sharp difference in the subsidence rate showed by all interferometric datasets allows high accuracy detection of the border post-LGM incision.
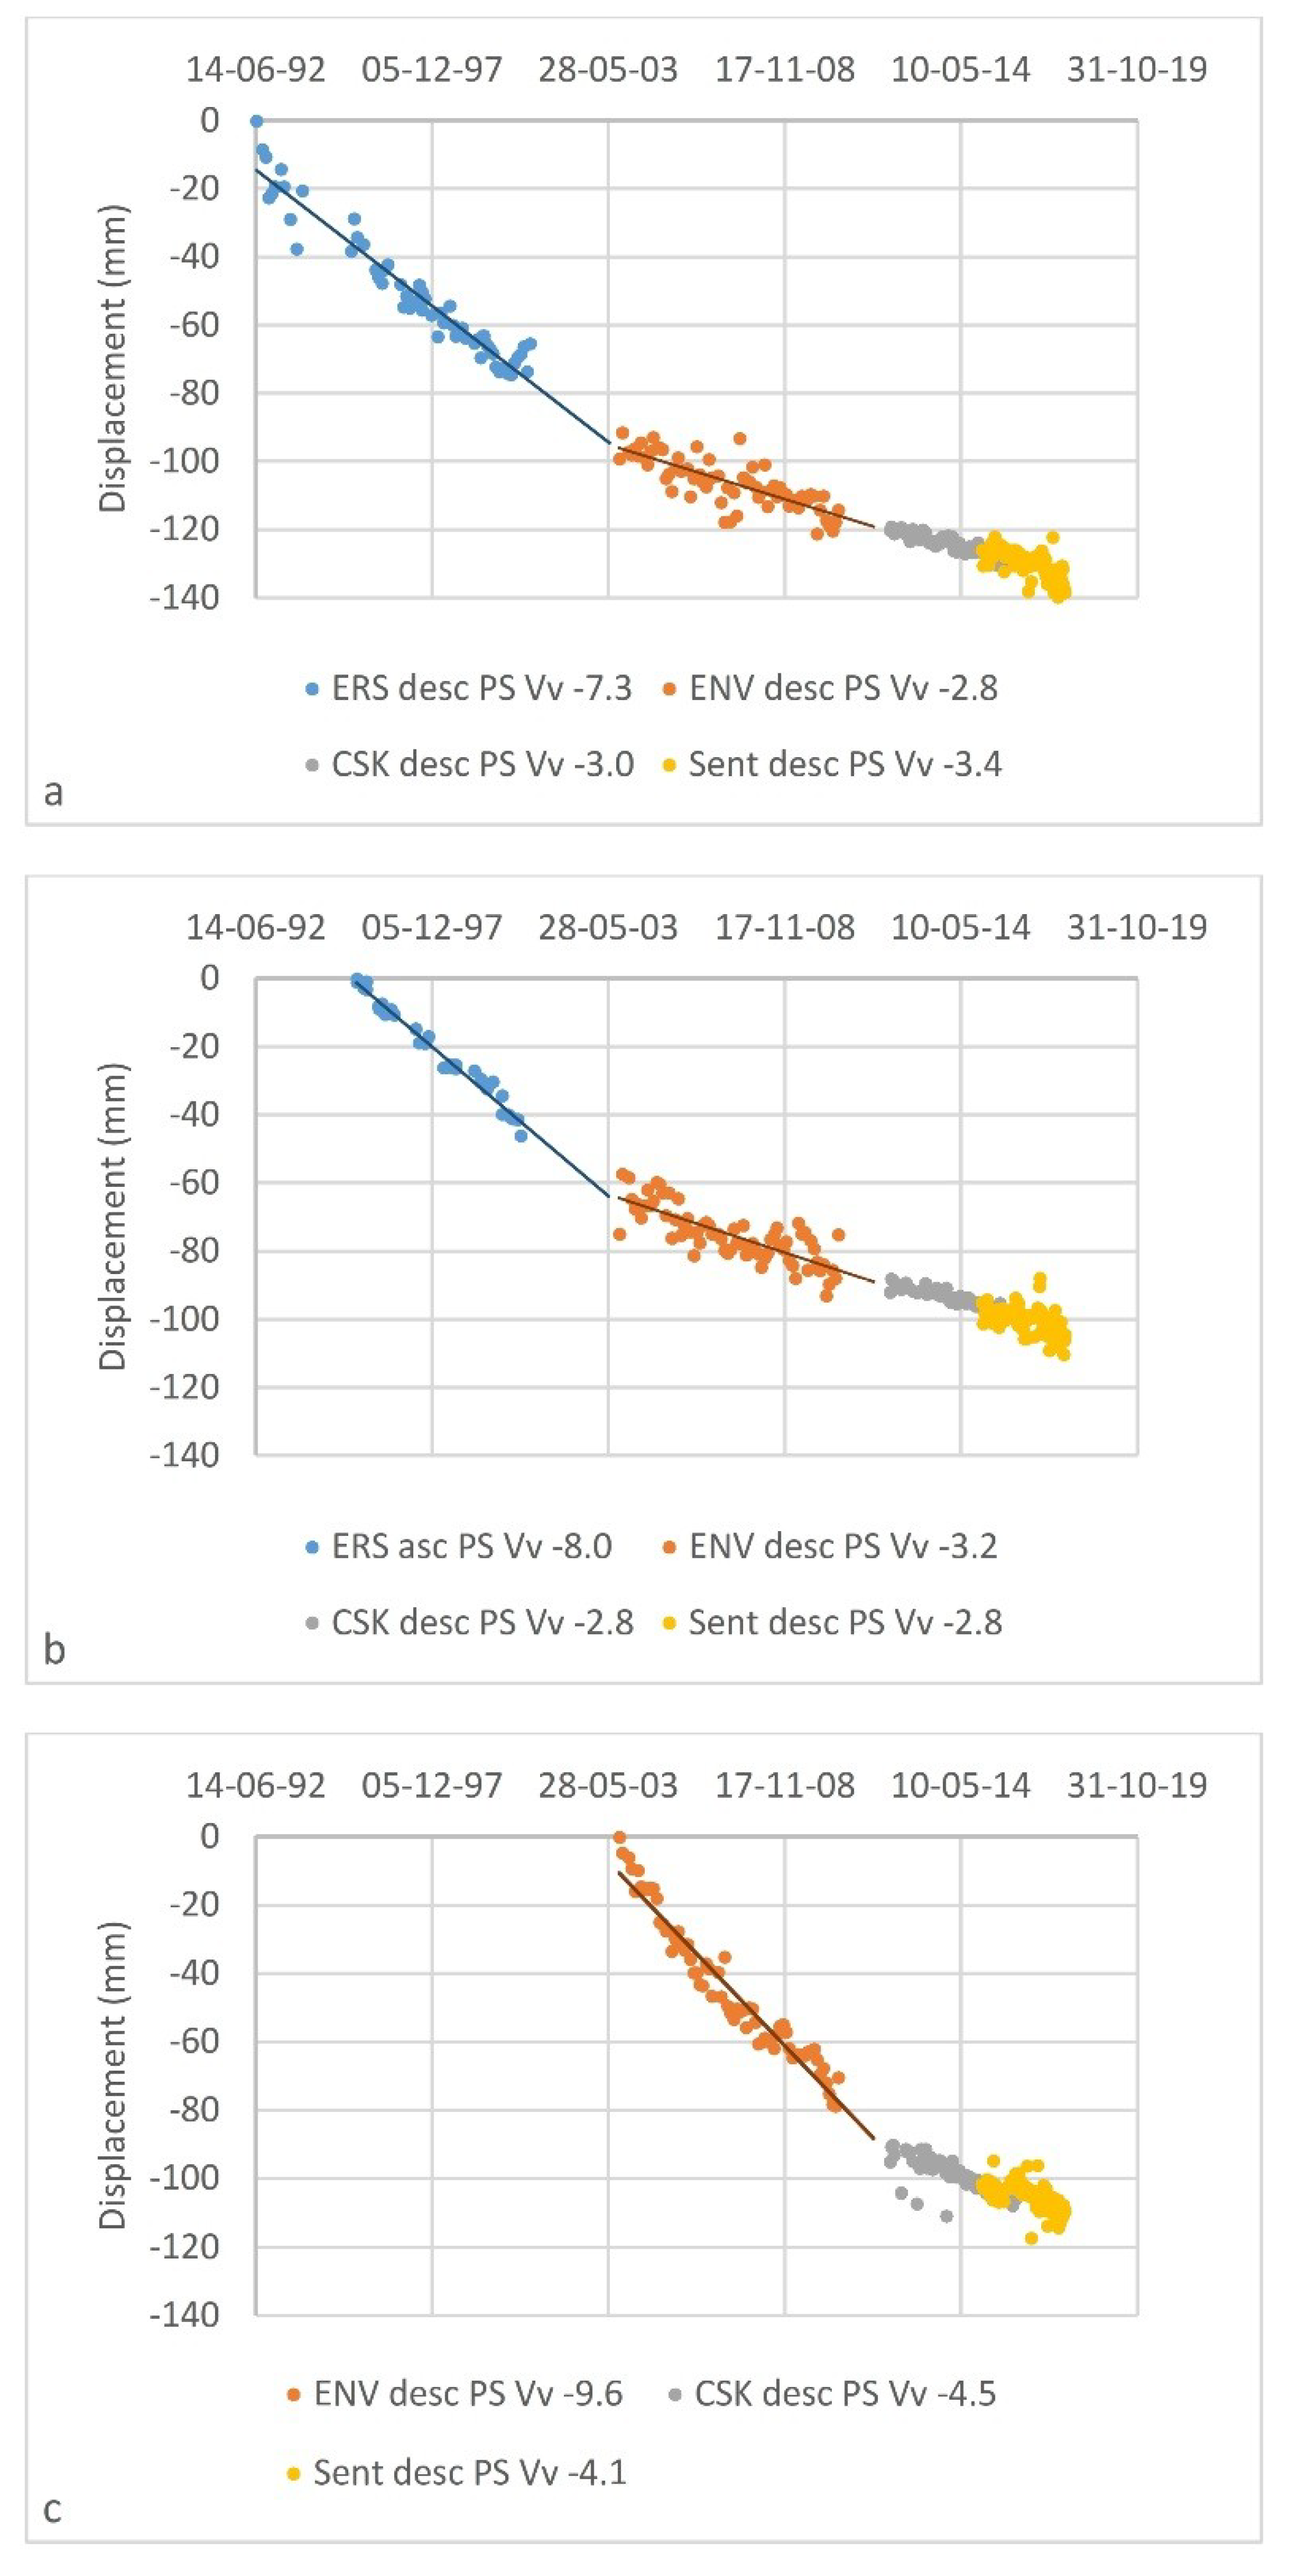
By observing a single new building, it can be noted that the rate of subsidence decreases over time. This is the case of the house indicated with the purple circle #1 in in
Figure 7b. In the aerial view taken in May 1989, it is not present, but it was built in the time span between May 1989 (
Figure 7c) and June 1992 (date of the first ERS SAR acquisition in descending mode). In fact, it is present in the aerial view from August 1998, but it has been identified as a PS, which means that it is included in all the SAR images acquired by ERS satellites, otherwise it could not be recognized as a PS. Immediately after construction, the house was affected by a vertical deformation rate of −7.3 mm/year and a total vertical displacement of about −75 mm measured by PSI processing of ERS SAR images in the period 1992–2000 (
Figure 8a); then, from 2003 to 2010, the velocity decreased to −2.8 mm/year as measured by ENVISAT SAR data processing (
Figure 7d and
Figure 8a). Finally, from 2012 the subsidence is still ongoing with a rate between −3.0 and −3.4 mm/year, which was measured by processing COSMO and Sentinel SAR images (
Figure 7e–f and
Figure 8a). A similar behavior can be observed in the case of the house indicated by the purple circle #2 in
Figure 7b, which was built between May 1989 and January 1995 (date of the first ERS SAR acquisition in ascending mode). After the construction it was affected by a vertical displacement with a rate of −8.0 mm/year, measured through the processing of ERS images (
Figure 7c and
Figure 8b), while during the ENVISAT period the rate decreased to −3.2 mm/year (
Figure 7d and
Figure 8b) and, finally, from February 2012 to the present, the velocity measured by COSMO and Sentinel interferometric data is −2.8 mm/year (
Figure 7e–f and
Figure 8b). Hence, also in this case, subsidence is still ongoing. The last case relating to the house is indicated by the purple circle #3 in
Figure 7b, which was built between August 1998 and February 2003 (first ENVISAT acquisition in descending mode). In fact, it is not present in the 1998 aerial view (
Figure 7c), but it was detected by ENVISAT SAR sensor. In this case, the monitoring starts by processing ENVISAT acquisitions, which shows a vertical displacement rate of −9.6 mm/year (
Figure 8c), then the rate decreased to −4.5 and −4.1 mm/year, measured by the processing of COSMO, and Sentinel SAR data, respectively (
Figure 8c).
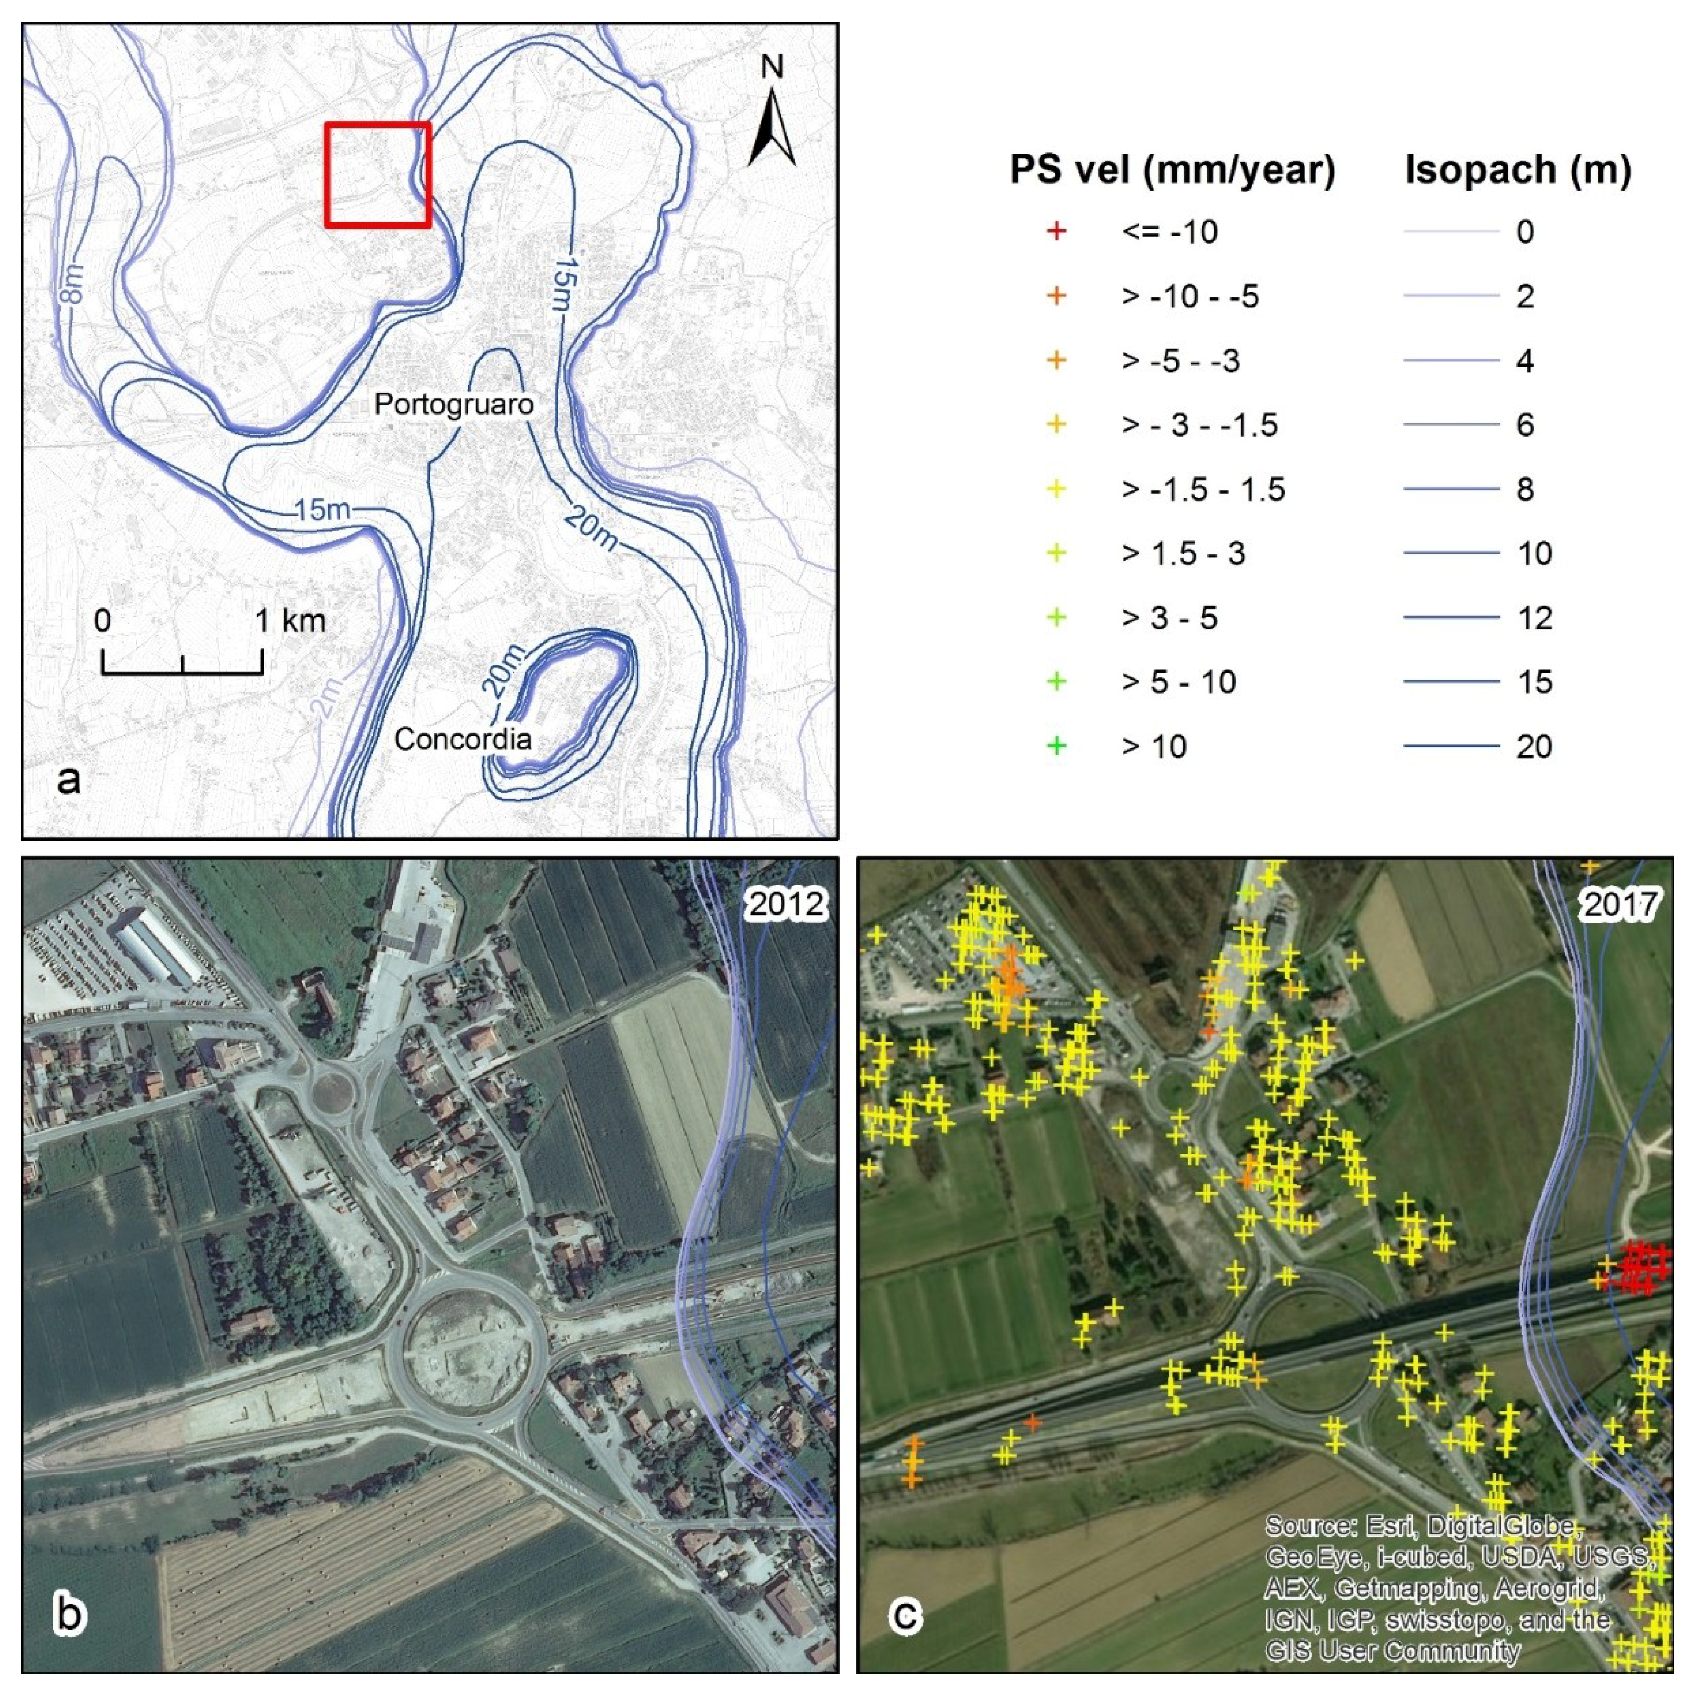
The different behavior of sediments inside and outside the post-LGM fluvial incision can be clearly observed in the area included in the red square of
Figure 9a. In this area a new overpass was built between 2012 (
Figure 9b) and December 2014 (first Sentinel-1 acquisition). During the period between December 2014–July 2017, the east ramp of the overpass was affected by a displacement rate of about −12 mm/year, as measured through the PSI processing of Sentinel-1 SAR data (
Figure 9c), while the west ramp has shown a lower rate (about 3.5 mm/year), which reflect the different geotechnical behavior between LGM and post-LGM deposits, locating the limit of the incision.
Further interesting results are outlined in
Figure 10a, regarding a sector located slightly east of the historical center of Portogruaro. Also in this case, the limit of post-LGM fluvial incision can be easily identified as it is marked by the different displacement rates between past and recent deposits in all the interferometric datasets (
Figure 10b–e). But the behavior of this sector is very different from the other subsiding areas because the PS velocities do not decrease over time. Taking into account all the PS inside the incision with a velocity < −1.5 mm/year, a mean displacement rate of −3.5, −2.6, −2.7, and 3.1 mm/year have been obtained by ERS, ENVISAT, COSMO, and Sentinel SAR data processing, respectively. These estimated velocities are not related to the load induced by the construction of new structures and infrastructures, indeed the land cover did not change during the observation period, as can be seen comparing
Figure 10f,g.
5. Discussion
The obtained results clearly show that interferometric data can help identify the border of post-LGM fluvial incision, due to the different rates of displacement between the LGM deposits of the ancient alluvial plain and younger incised valley fill. As it has been illustrated in the results section, recent deposits are affected by a rate of displacement up to −10 mm/year, while deposits of LGM plain can be considered stable. By combining ERS ascending and descending interferometric data, it can be seen that displacements are mainly vertical (
Figure 5). This is a high favorable condition using PSI technique which may present some difficulties in evaluating the horizontal components of the movement, especially in the North-South direction.
In order to use interferometric techniques as a tool for geological and geomorphological mapping, it is essential to consider SAR data from different sensors covering a time span as long as possible. In our study area, ERS data are the best information to identify the presence of recent sediments (
Figure 4a–b and
Figure 6), but also the other datasets helped to better delineate the shape of the post-LGM fluvial incision. In fact, ENVISAT, COSMO, and Sentinel interferometric data have shown sectors affected by subsidence in different periods, and sectors compared to ERS (
Figure 4c–e). This is linked to the mechanism of ground displacement in the study area, which is mainly related to the construction of structures and infrastructures. Furthermore, such elements are essential in using PSI techniques, because they are one of the best reflectors of the incident RADAR signal and can be recognized as permanent scatterers in the processing.
Interferometric data from the different datasets allows monitoring the temporal evolution of subsidence and exploring the causes. The edification of new buildings induces a load in the soils triggering the clay deposit compaction (consolidation process [
63,
64]), with a rate of vertical displacement of up to −10 mm/year during the primary step, then the rate decreases to −4 mm/year and −3 mm/year in the secondary step (
Figure 8). This behavior, which is similar to the one seen [
65] in the city of Rome, has been clearly observed in urbanization occurring at the border of the incision in
Figure 7. Here the consolidation process that is caused by the construction of new buildings can be entirely monitored through interferometry. Further important information from this study, is that the consolidation of the sediments filling the incision can last more than 25 years, in fact all the cases indicated in
Figure 8 are still ongoing. This is a very important finding that suggests the possible use of interferometry to observe the consolidation process at the site scale, helping better define the mechanical behavior of soil, overpassing the limits of laboratory and in situ tests, which are performed on small samples, at specific points, and cannot take into account the variability of site conditions. Of course, laboratory and in situ tests remain mandatory for the evaluation of geo-mechanical properties of soils in the design of structures and infrastructures.
The above mentioned mechanism of subsidence limits the use of interferometry in the recognition of geological architecture of subsoil in the study area, because it depends on the development of new structures and infrastructures, it can then be applied only in urban areas and cannot provide information in scarcely urbanized sectors. Thus it is very difficult to evaluate the natural subsidence caused by the consolidation under lithostatic load, and, consequently, it seems to limit the use of interferometry in geological and geomorphological surveys. But this issue could be addressed considering L-band SAR data, which are more penetrating than C- and X-band, and are affected by a lower loss of coherence in forest and vegetated areas. These advantages have been recently shown by [
17], evaluating ground displacements in the south sector of the Venetian-Friulian Plain by processing ALOS-PALSAR SAR data. Unfortunately, this kind of data was not available for our research. However, geological and geomorphological mapping is difficult in areas where the anthropic action has obliterated surficial evidences. These results show the potential of interferometric data in this new application field.
The mechanism of subsidence in our study area can also explain the good performance of ERS datasets in the identification of post-LGM incision, despite the lower PS density compared to other datasets. This area experienced a great urban expansion at the end of the 20th century. New urban settlements triggered the consolidation of post-LGM deposits and became the optimal target for the ERS acquisitions, which started at the beginning of the 1990s. In the following periods, urbanization was quite limited to new residential areas at the border of the main historical centers of Portogruaro and Concordia Sagittaria, and to the maintenance and improvement of the road network; such elements have been effectively detected and monitored by the ENVISAT, COSMO-SKY-Med and Sentinel-1 SAR sensors. Our case study shows that the use of interferometric data in geological and geomorphological surveys slightly depend on the characteristics of SAR data. The band and satellite revisiting time could influence the density of PSI points, but indeed do not limit the potential in defining the evolution of urbanization and the geological features of the area under investigation.
Certainly, the different rates of subsidence of pre- and post-LGM deposits are related to their geotechnical properties, in particular the degree of compressibility and permeability. In most cases the subsidence is linked to the loading of soft soils, but the are some exceptions as the area shown in
Figure 10, where, although no land cover changes occurred in the last 30 years, ground displacements have been measured by all interferometric datasets. A similar situation has been observed in some localized sectors of the historical centers of Portogruaro and Concordia Sagittaria. According to the geological setting, the tectonic subsidence going on in the study area has a regional pattern and, between Tagliamento and Livenza rivers, it has an average rate of 0.4 mm/year. Thus, this long-term deformative process affects the whole study area and could not explain the differential vertical settlements characterizing the areas over the incised filled valley. This setting may mean the groundwater exploitation is a major cause of the differential subsidence.
From a hydrogeological point of view, in the study area, ten overlapping aquifers between 10 and about 500 m depth, have been recognized, and are composed of coarse deposits interbedded by clayey and silty layers [
66,
67]. The first aquifer is located between 10 and 25 m and is semi-confined, while the remaining are confined. A phreatic aquifer is present in the first ten meters, the water level is 2 m deep on average, and it has a seasonal fluctuation of about 1.5 m that is controlled by a pumping system to ensure groundwater does not reach the ground surface, which in some sectors has an elevation under the sea level. This shallow aquifer is recharged mainly by rainfall and the two rivers present in the area (Lemene and Reghene rivers). The most exploited aquifers by a number of water wells present in the area are the deepest ones, but quantitative data of exploitation are not available [
67]. Then, it is not easy to evaluate the relationships between subsidence and groundwater exploitation. However, considering the ground displacements mapped in
Figure 6, and their pattern, which perfectly matches the planform of the incised valley, it is evident that down lift movements are led by a surficial motivation. The depletion of deep aquifers can generate a large-scale subsidence, which could not induce a differential down lift in the very shallow deposits. Thus, the exploitation should also affect the surficial aquifers and, in particular, the unconfined one or that between 10–30 m, triggering the compaction of soft sub-soils with low displacement rates, due to the low permeability of the deposits [
60,
64].
6. Conclusions
In this paper we tested the use of multi-temporal differential interferometric synthetic aperture radar techniques as a tool for geological and geomorphological mapping, especially in urban areas where surficial evidences are often obliterated by the development of structures and infrastructures. To this end, the urbanized sector of the municipalities of Portogruaro and Concordia Sagittaria towns, located in the Venetian-Friulian Plain between Tagliamento and Piave rivers, has been considered, because its geological and geomorphological setting was already quite well known.
Interferometric data derived by permanent scatterers InSAR processing of SAR data acquired by ERS 1/2, ENVISAT, COSMO SKY-Med, and Sentinel-1 missions from 1992 to 2017, have been considered to evaluate the subsidence rate of the territory. Measuring the ground displacement rate allowed the identification, with high accuracy, the borders of a post-last glacial maximum incision filled by recent, unconsolidated lagoon and alluvial deposits, which are characterized by a subsidence rate much higher than the surrounding Pleistocene deposits of the external plain.
By monitoring the evolution of ground displacements inside the incision for a long period, the causes of the subsidence could be explored. The consolidation process, caused by the loading of post-LGM sediments after the construction of new buildings, and the development and maintenance of the road network, are the main causes of vertical movements. A primary consolidation step, with velocities of up to −10 mm/year, followed by a secondary step, with velocities about −3–−4 mm/year, have been observed. In most of the cases, this is the mechanism of the subsidence, but in some sectors, where urban settlement changes have not been observed in the last 30 years, ground displacements seem to be related to the exploitation of the shallow phreatic aquifer. The ability to monitor the behavior of soils under loading for a long time, suggests that interferometry can be also used for the geo-mechanical characterization at the site scale, which represent a challenging use of the technique.
The obtained results show that DInSAR techniques can be effectively applied in geological and geomorphological surveys, mapping elongated features, with a length of kilometers and a width that is several hundreds of meters. Using these methods depends on the physical and mechanical properties of deposits and on the geological processes acting in the area under investigation. Processing SAR data, that is acquired by sensors with different wavelengths, covering a period of time as long as possible, is recommended.
Future research should regard the attempt to use interferometric techniques in geological and geomorphological mapping of scarce urbanized areas and the numerical simulation of physical phenomena occurring after the loading of soils and/or the exploitation of groundwater. To overcome the limits of interferometry, due to spatial and temporal de-correlations, the performance of different DInSAR techniques that make an accurate choice of processing parameters, could be tested; also the use of L-band SAR data could be considered. To validate the ex-post assumptions about the possible causes of subsidence, a hydro-mechanical numerical modelling that reconstructs the ground displacement pattern measured by interferometry should be performed on the basis of previous geotechnical and hydrogeological data, new geognostic and laboratory tests, and data on the water level changes of the shallow phreatic aquifer.


