Distributed Scatterer InSAR Reveals Surface Motion of the Ancient Chaoshan Residence Cluster in the Lianjiang Plain, China


Abstract

1. Introduction
2. Study Area and Data
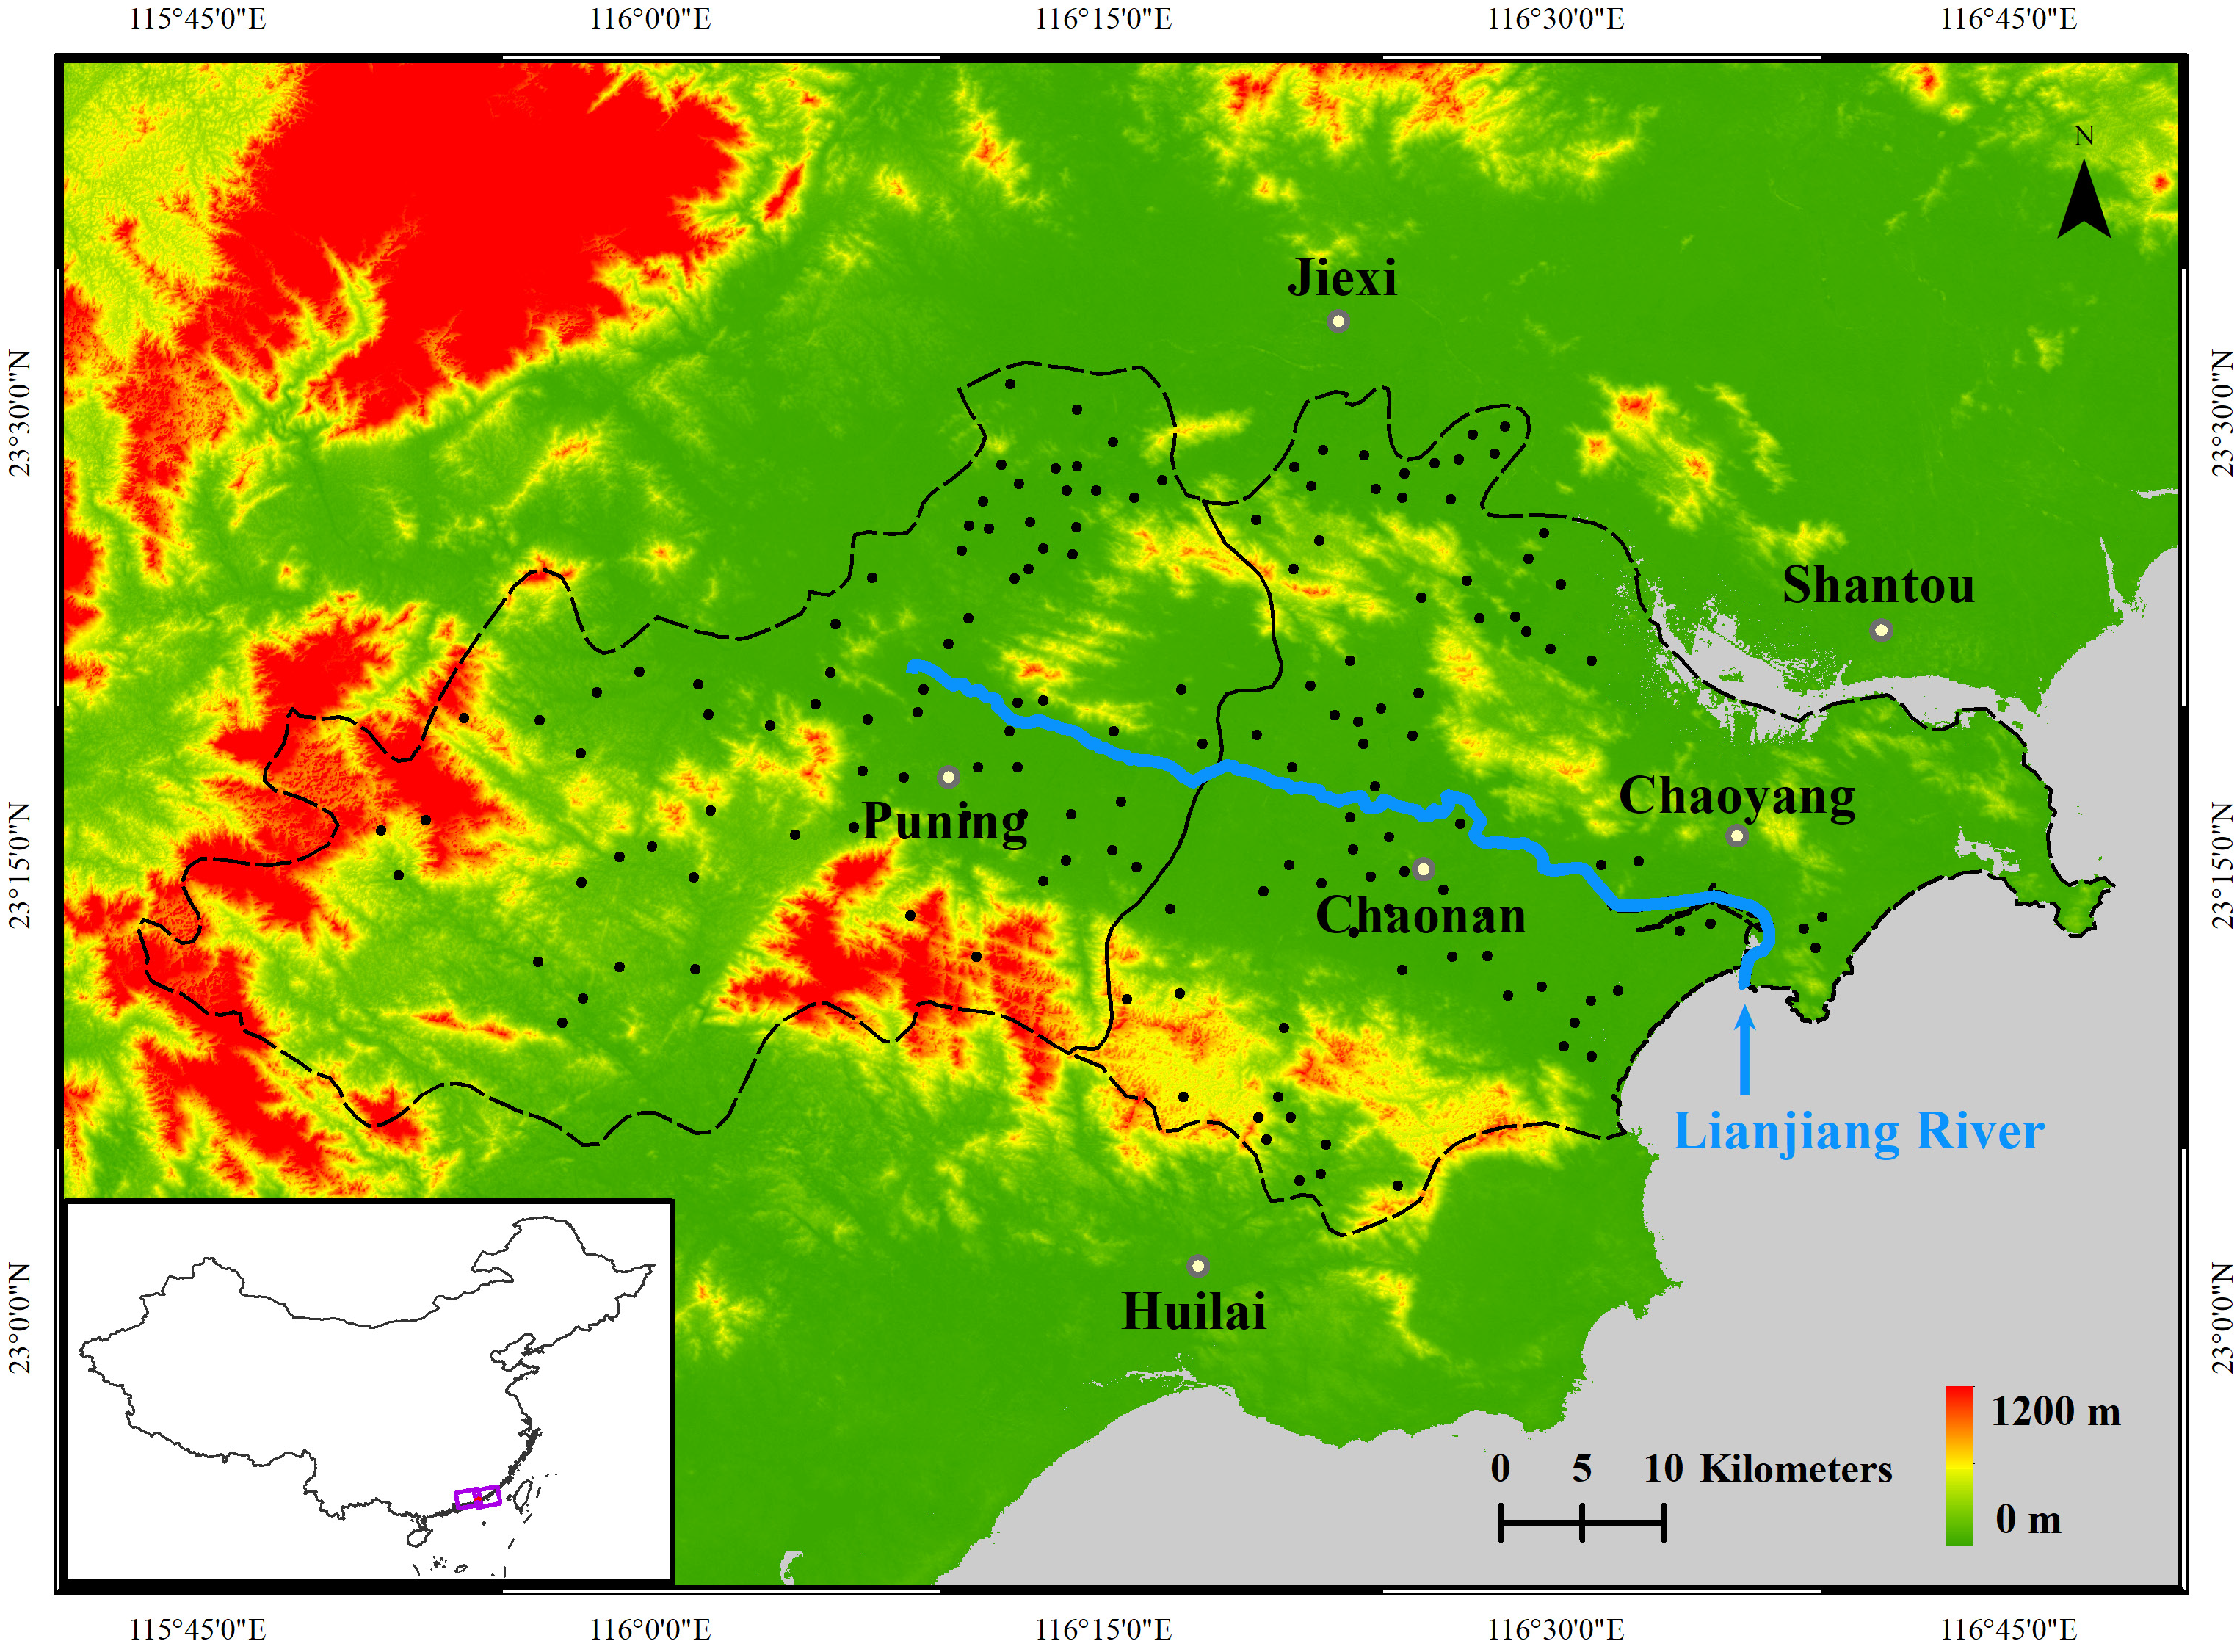
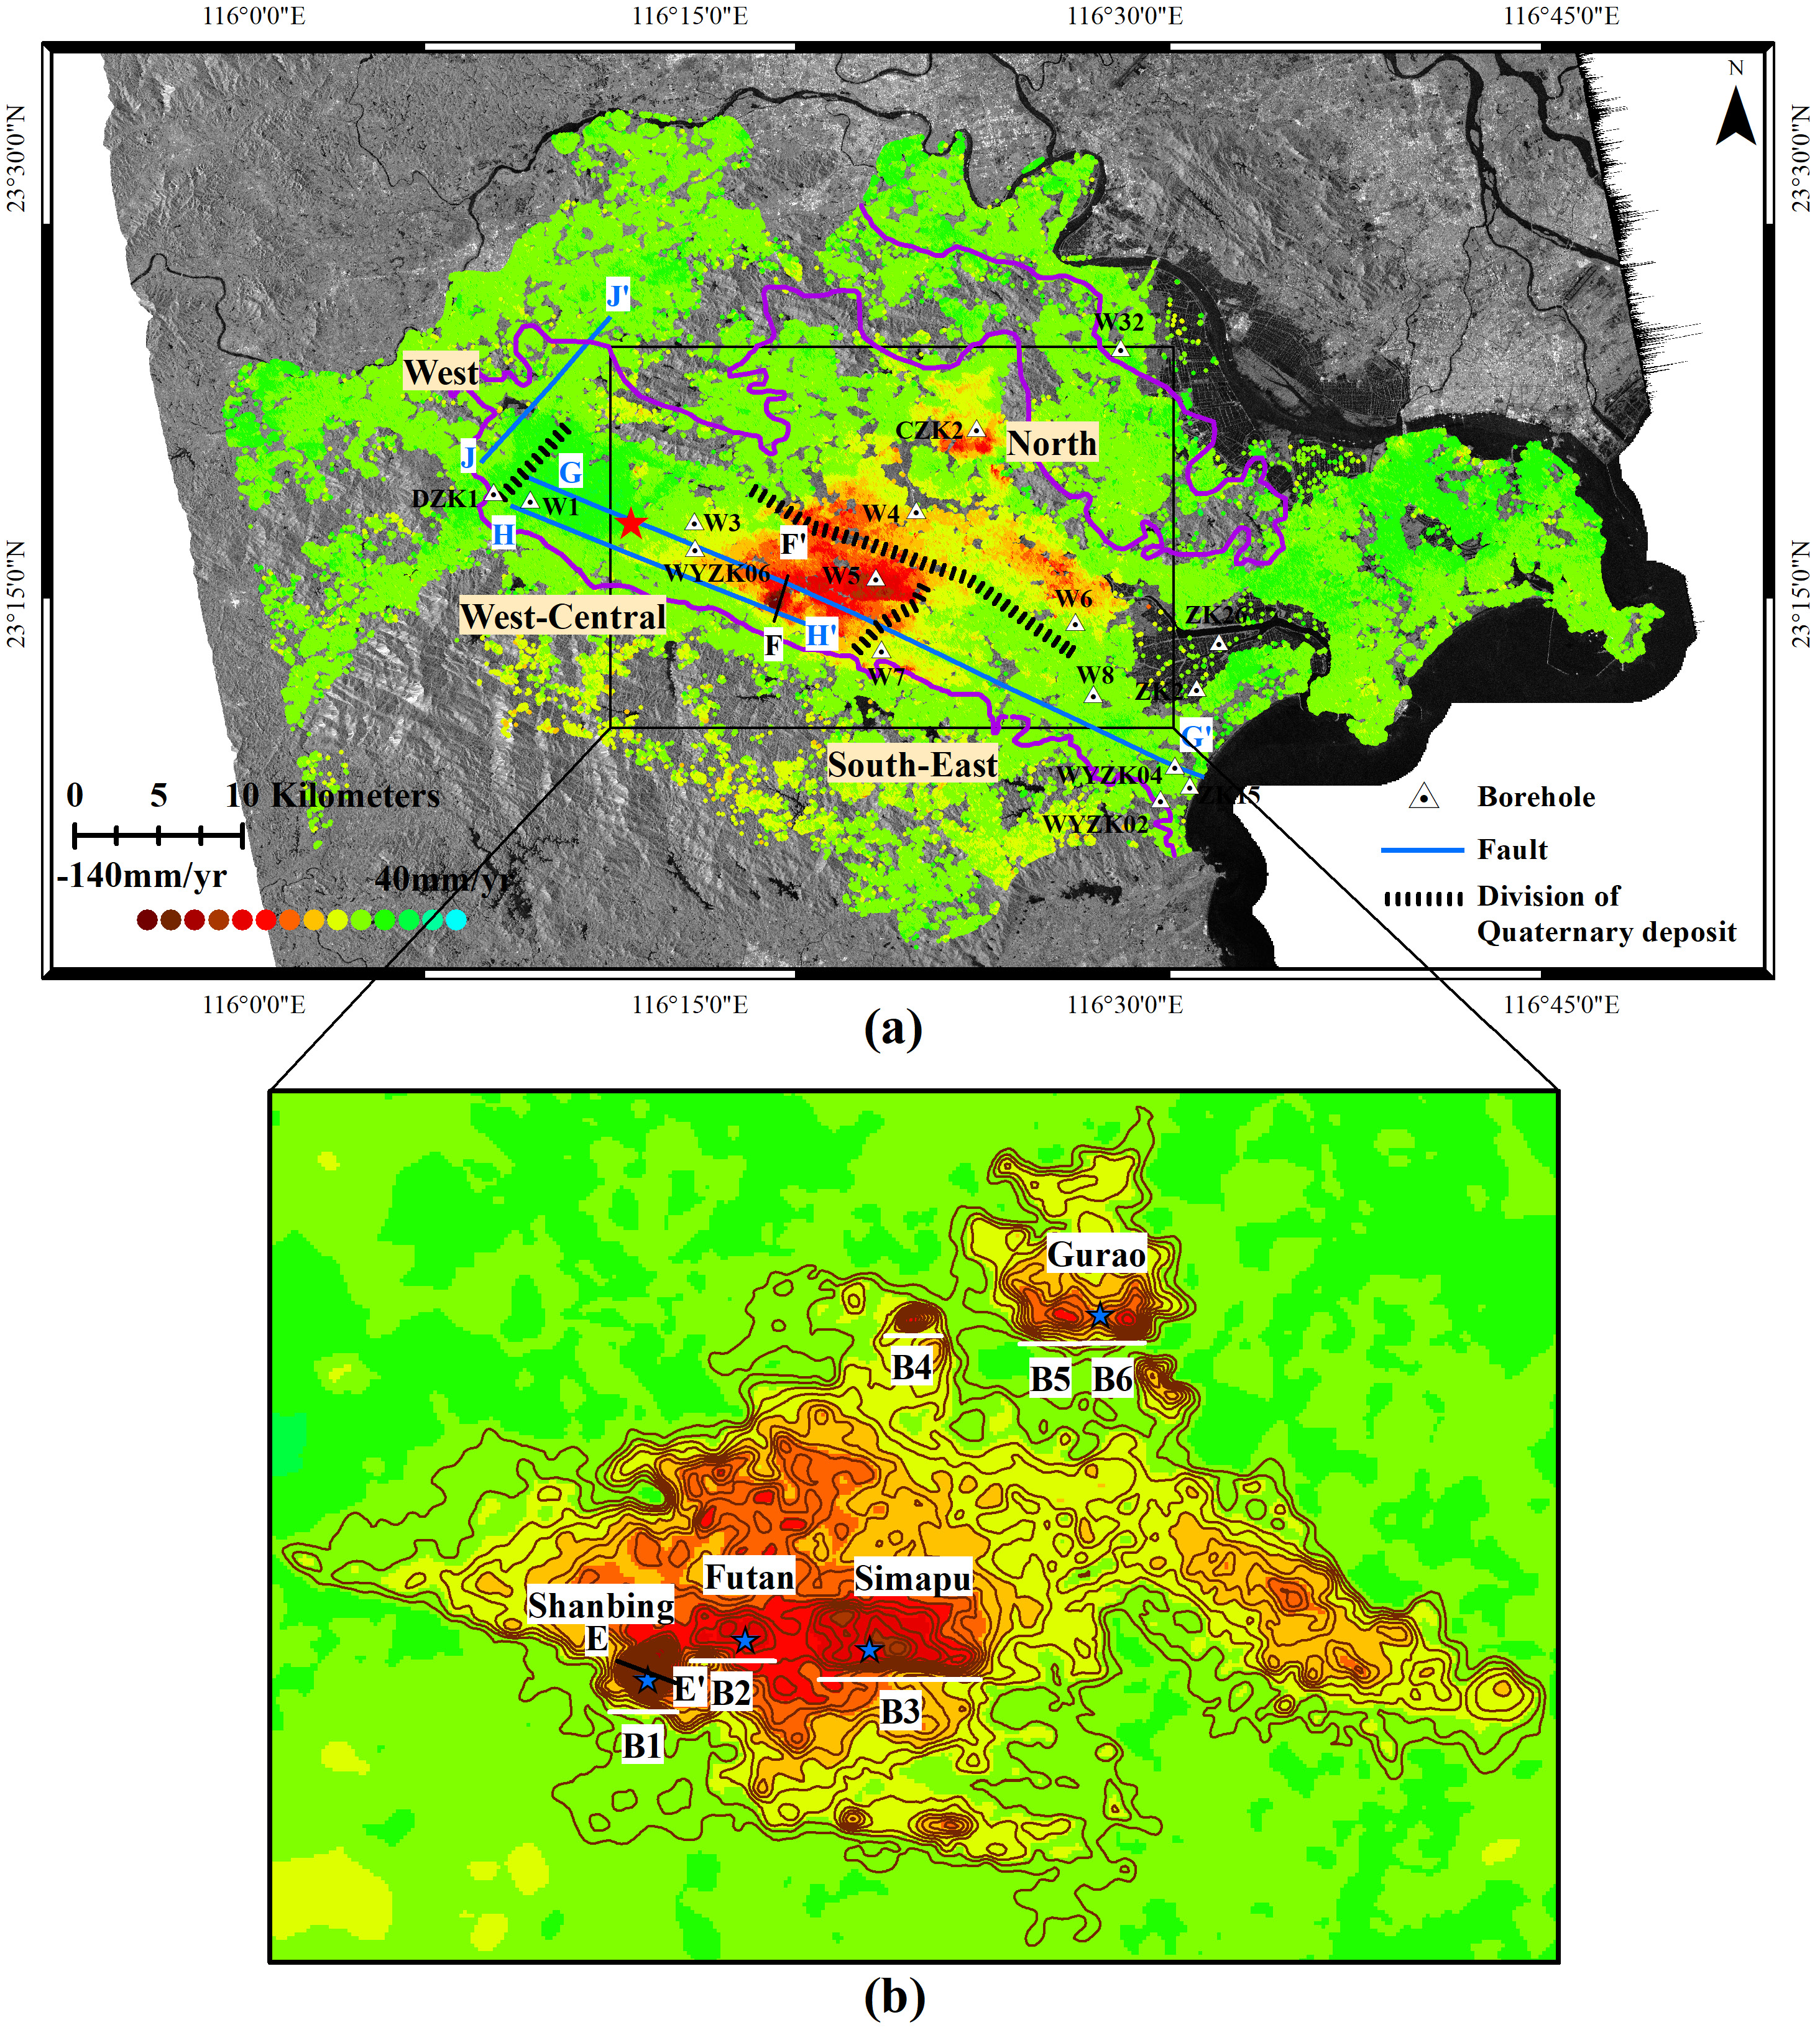
2.1. Study Area
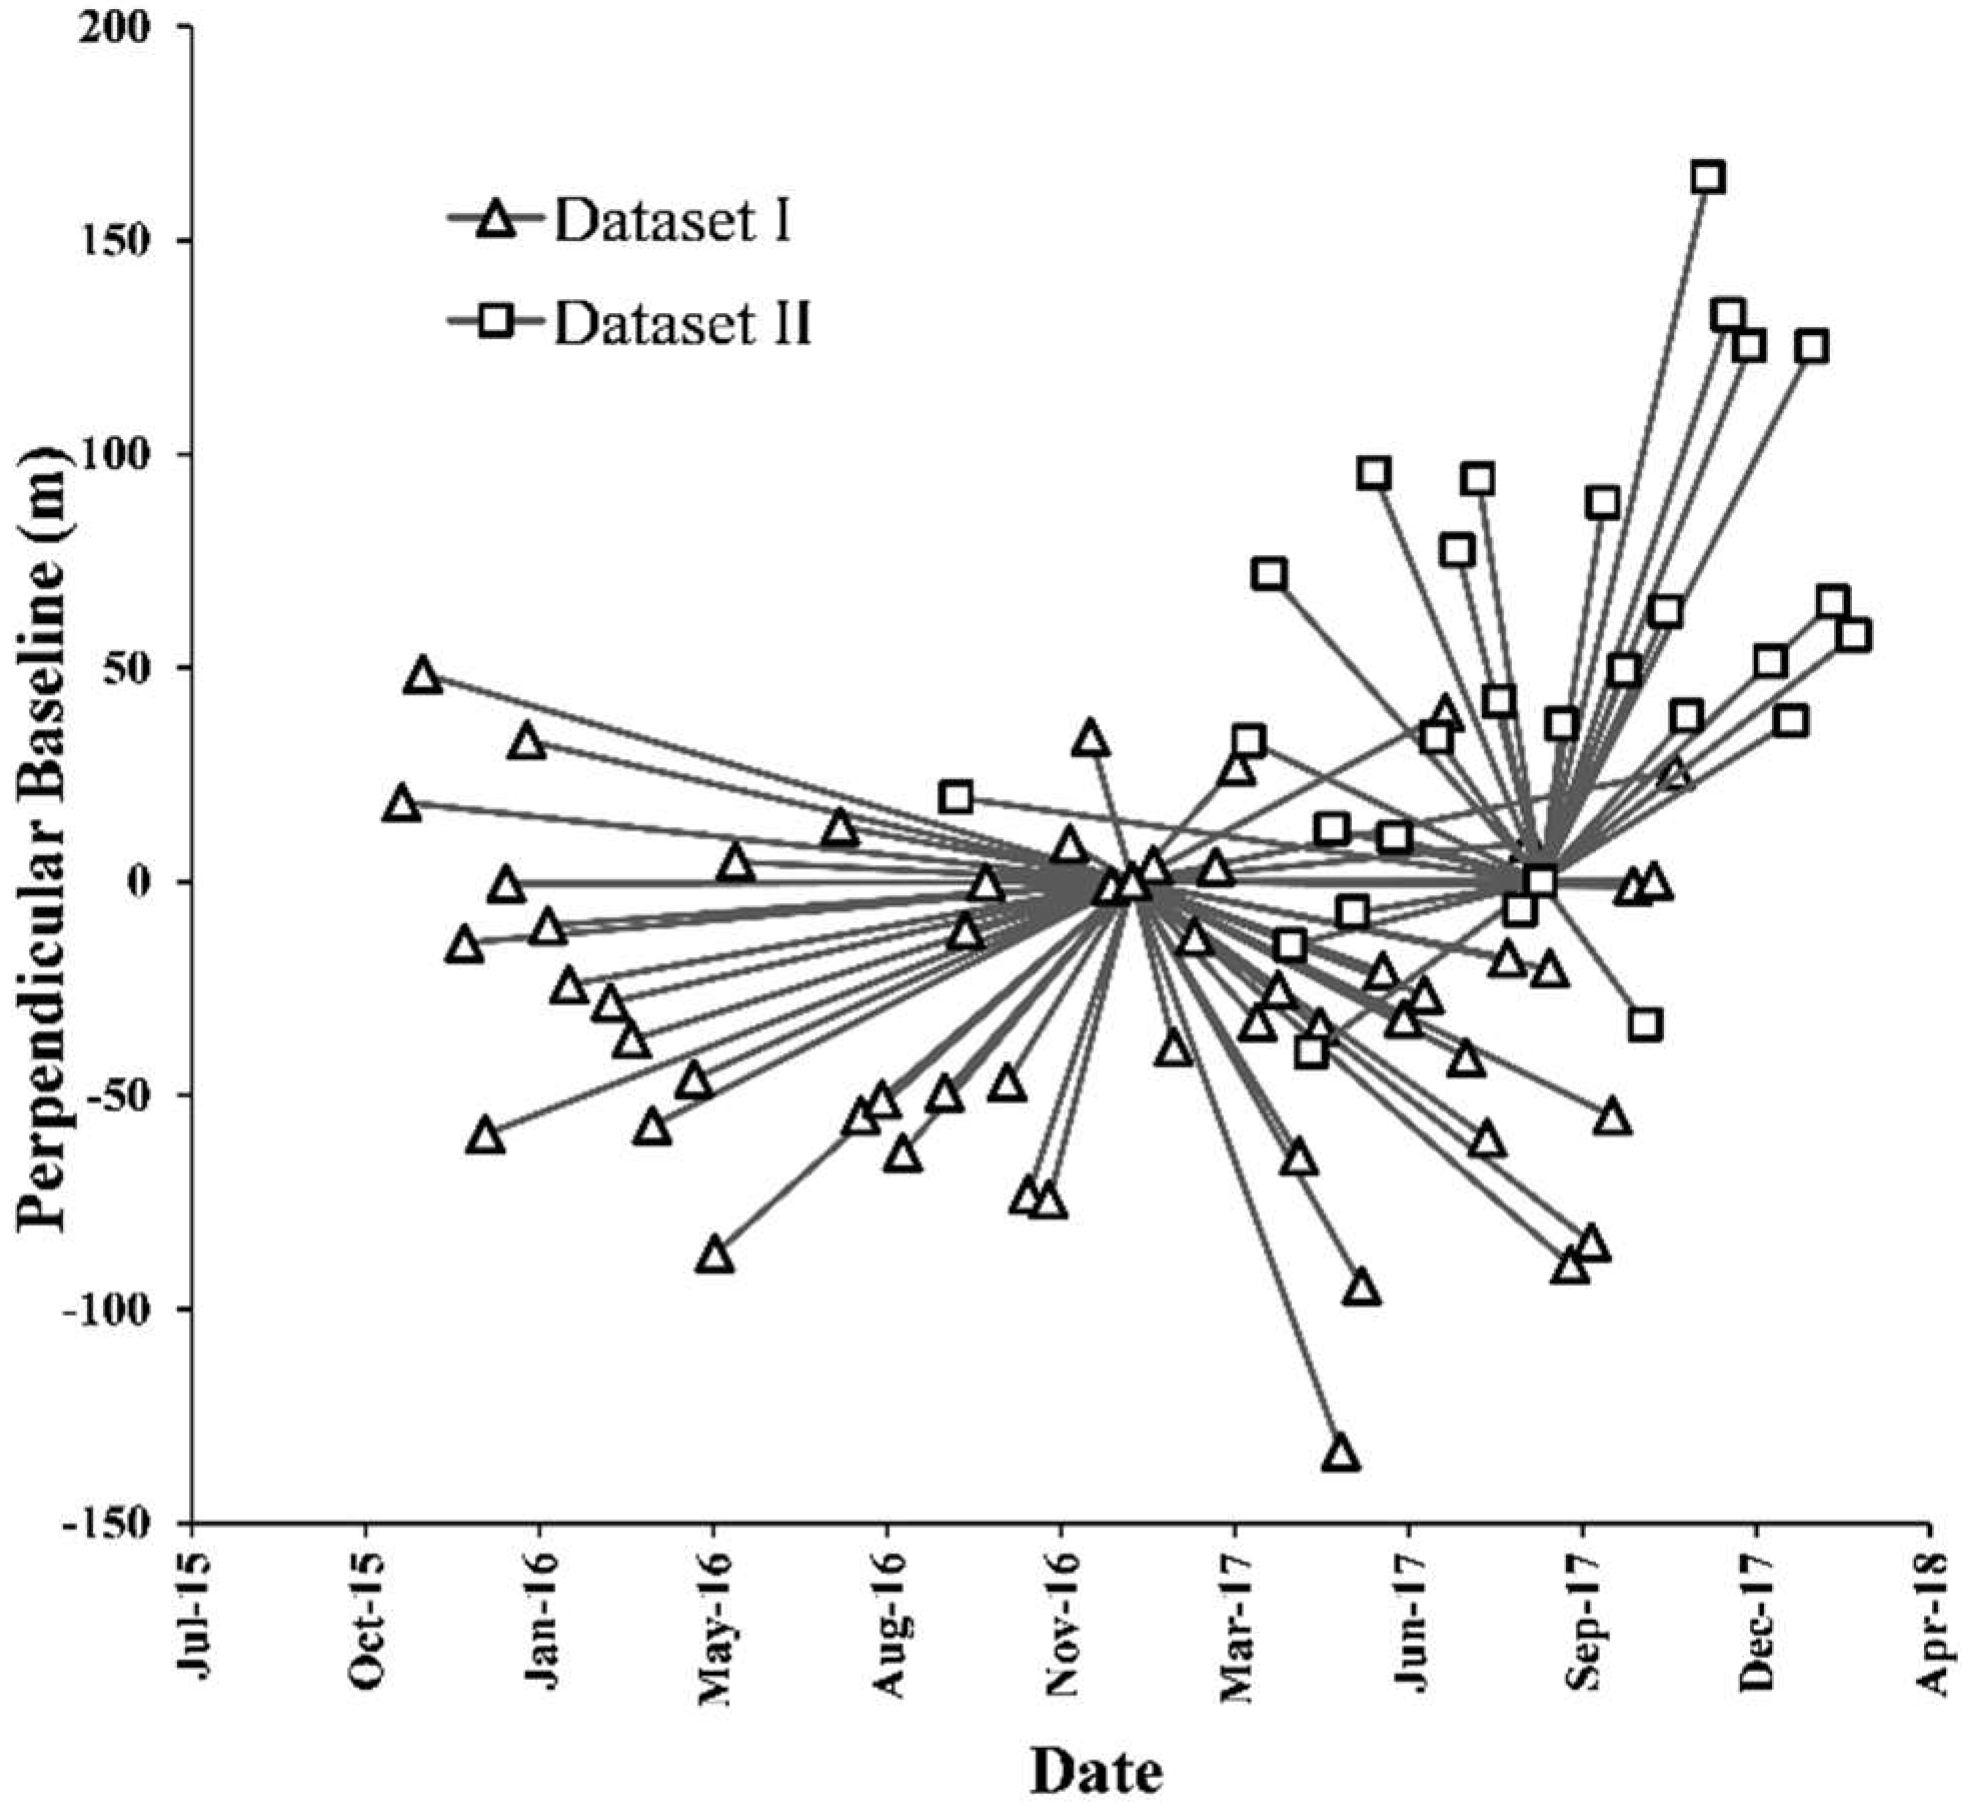
2.2. Data
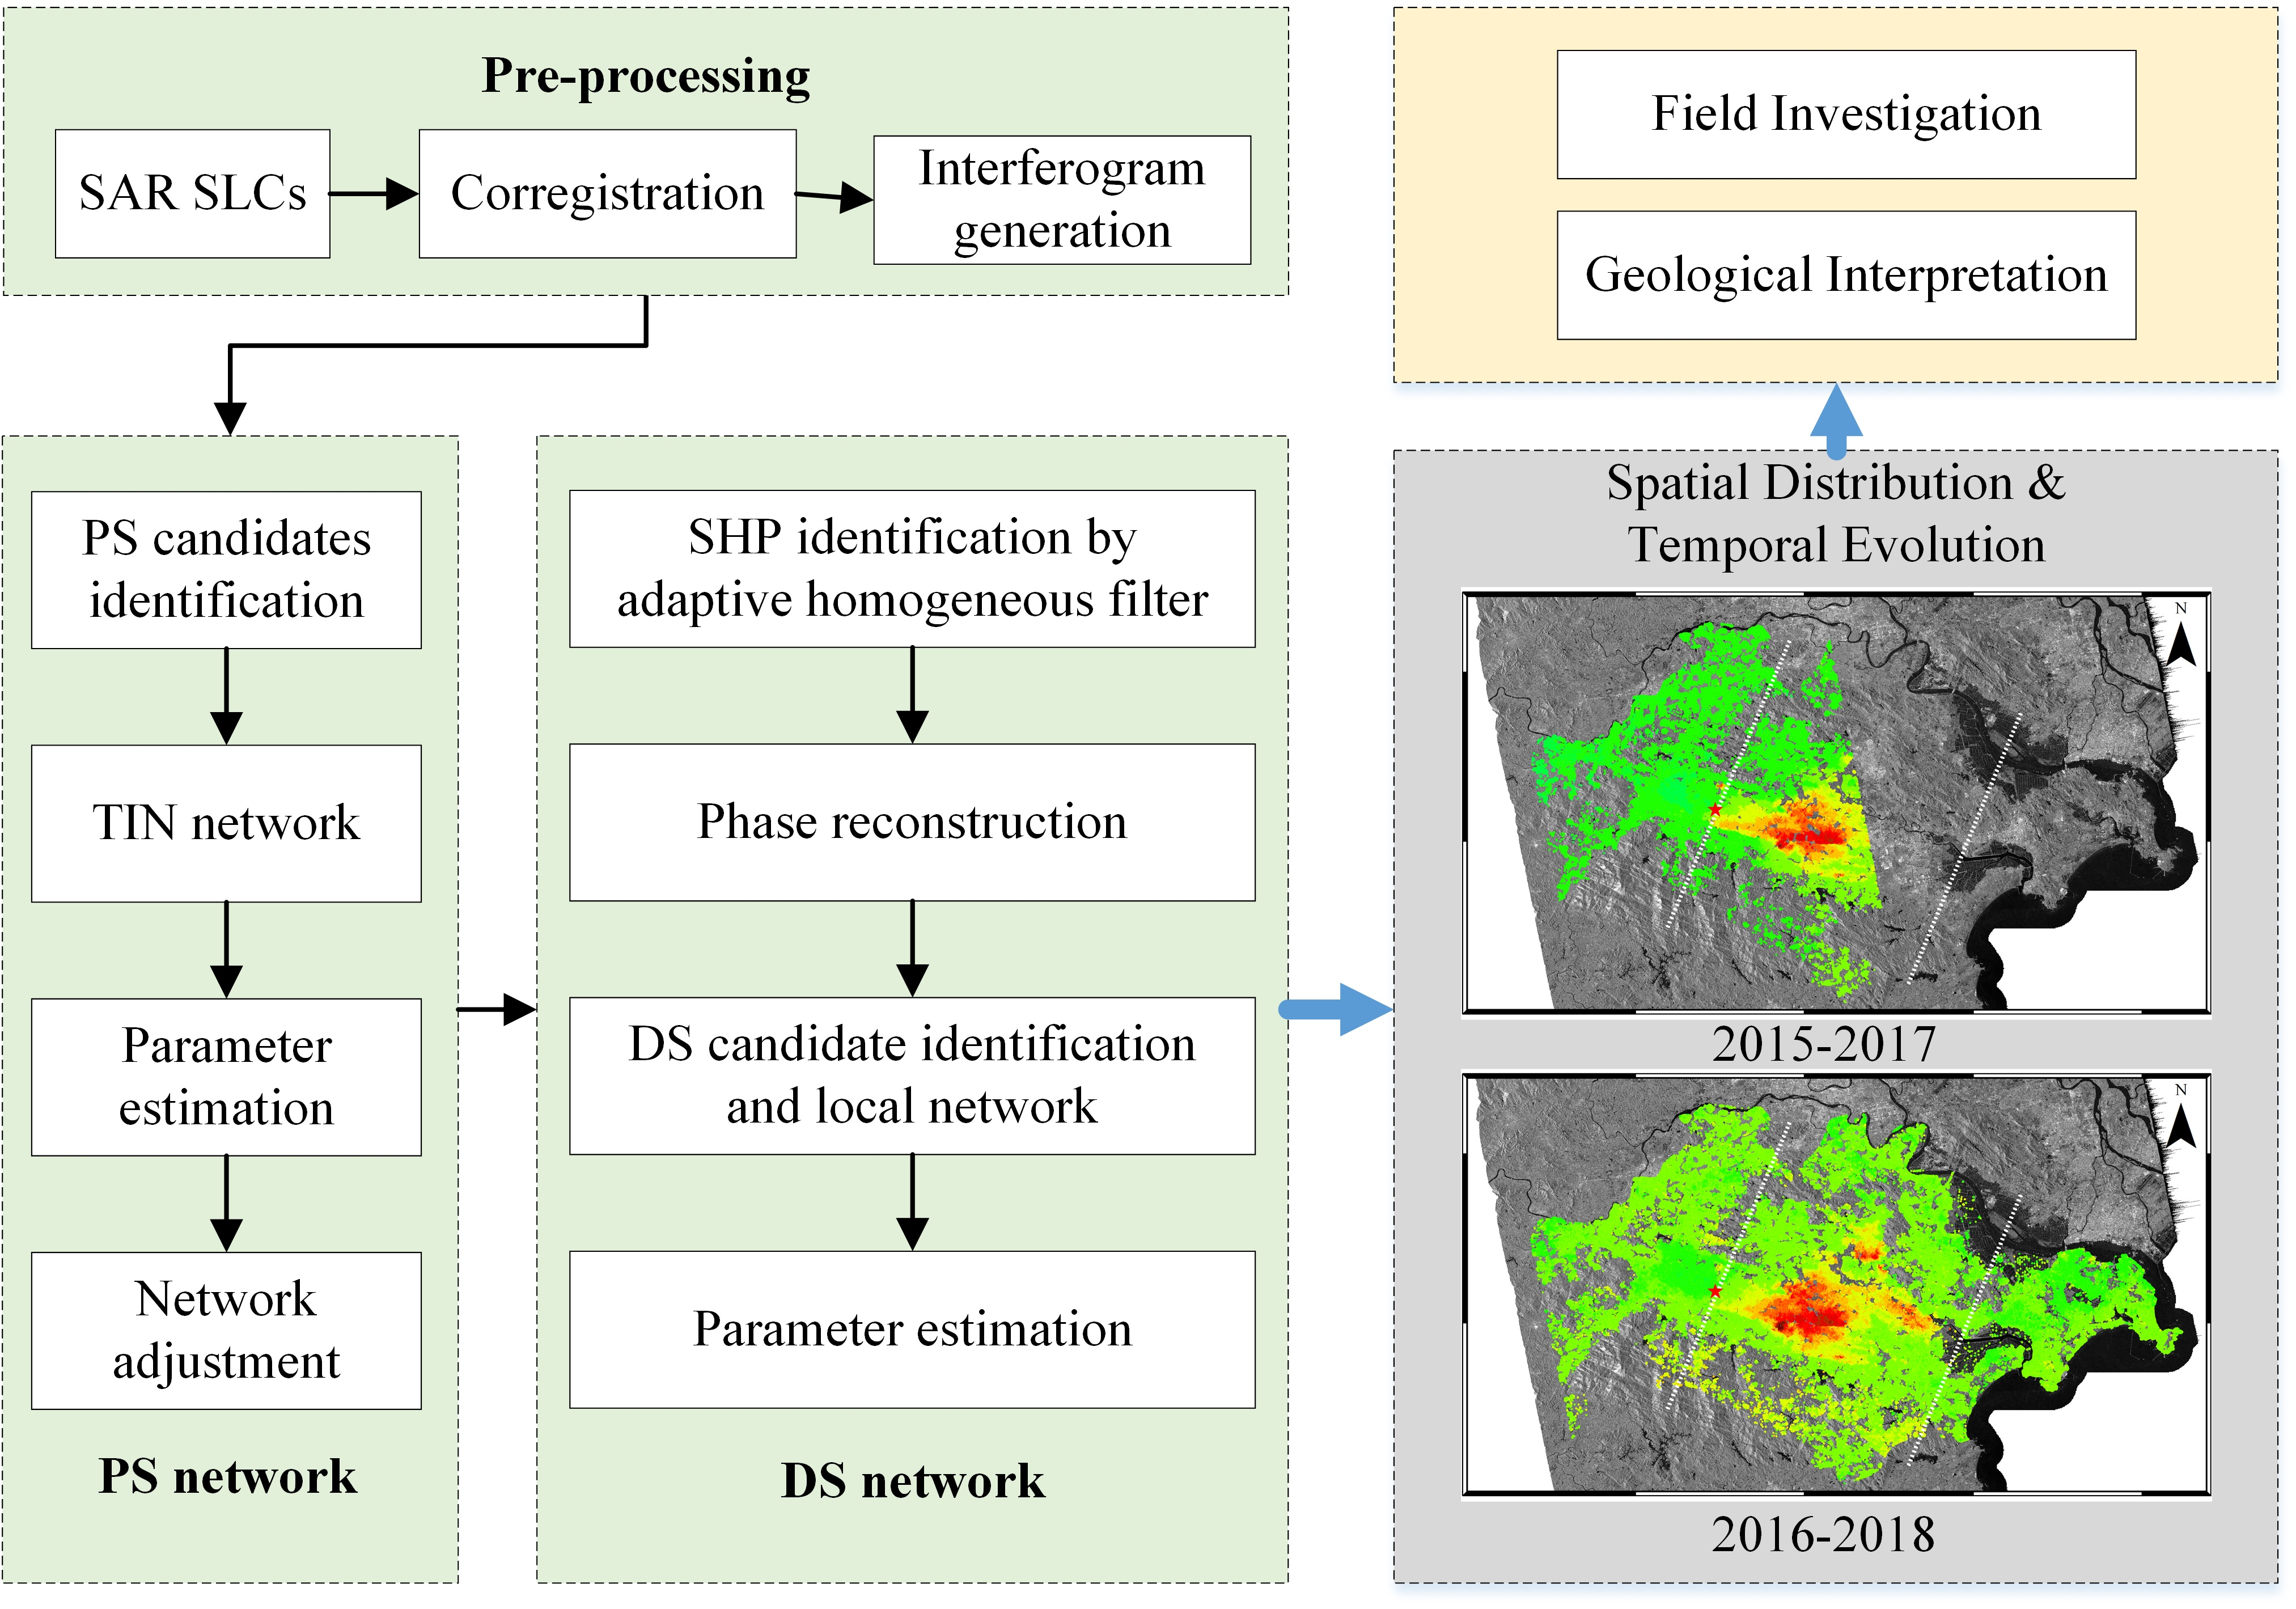
3. Methodology
3.1. PS Approach
3.2. DS Approach
3.3. Vertical Deformation Retrieval
4. Results and Discussion
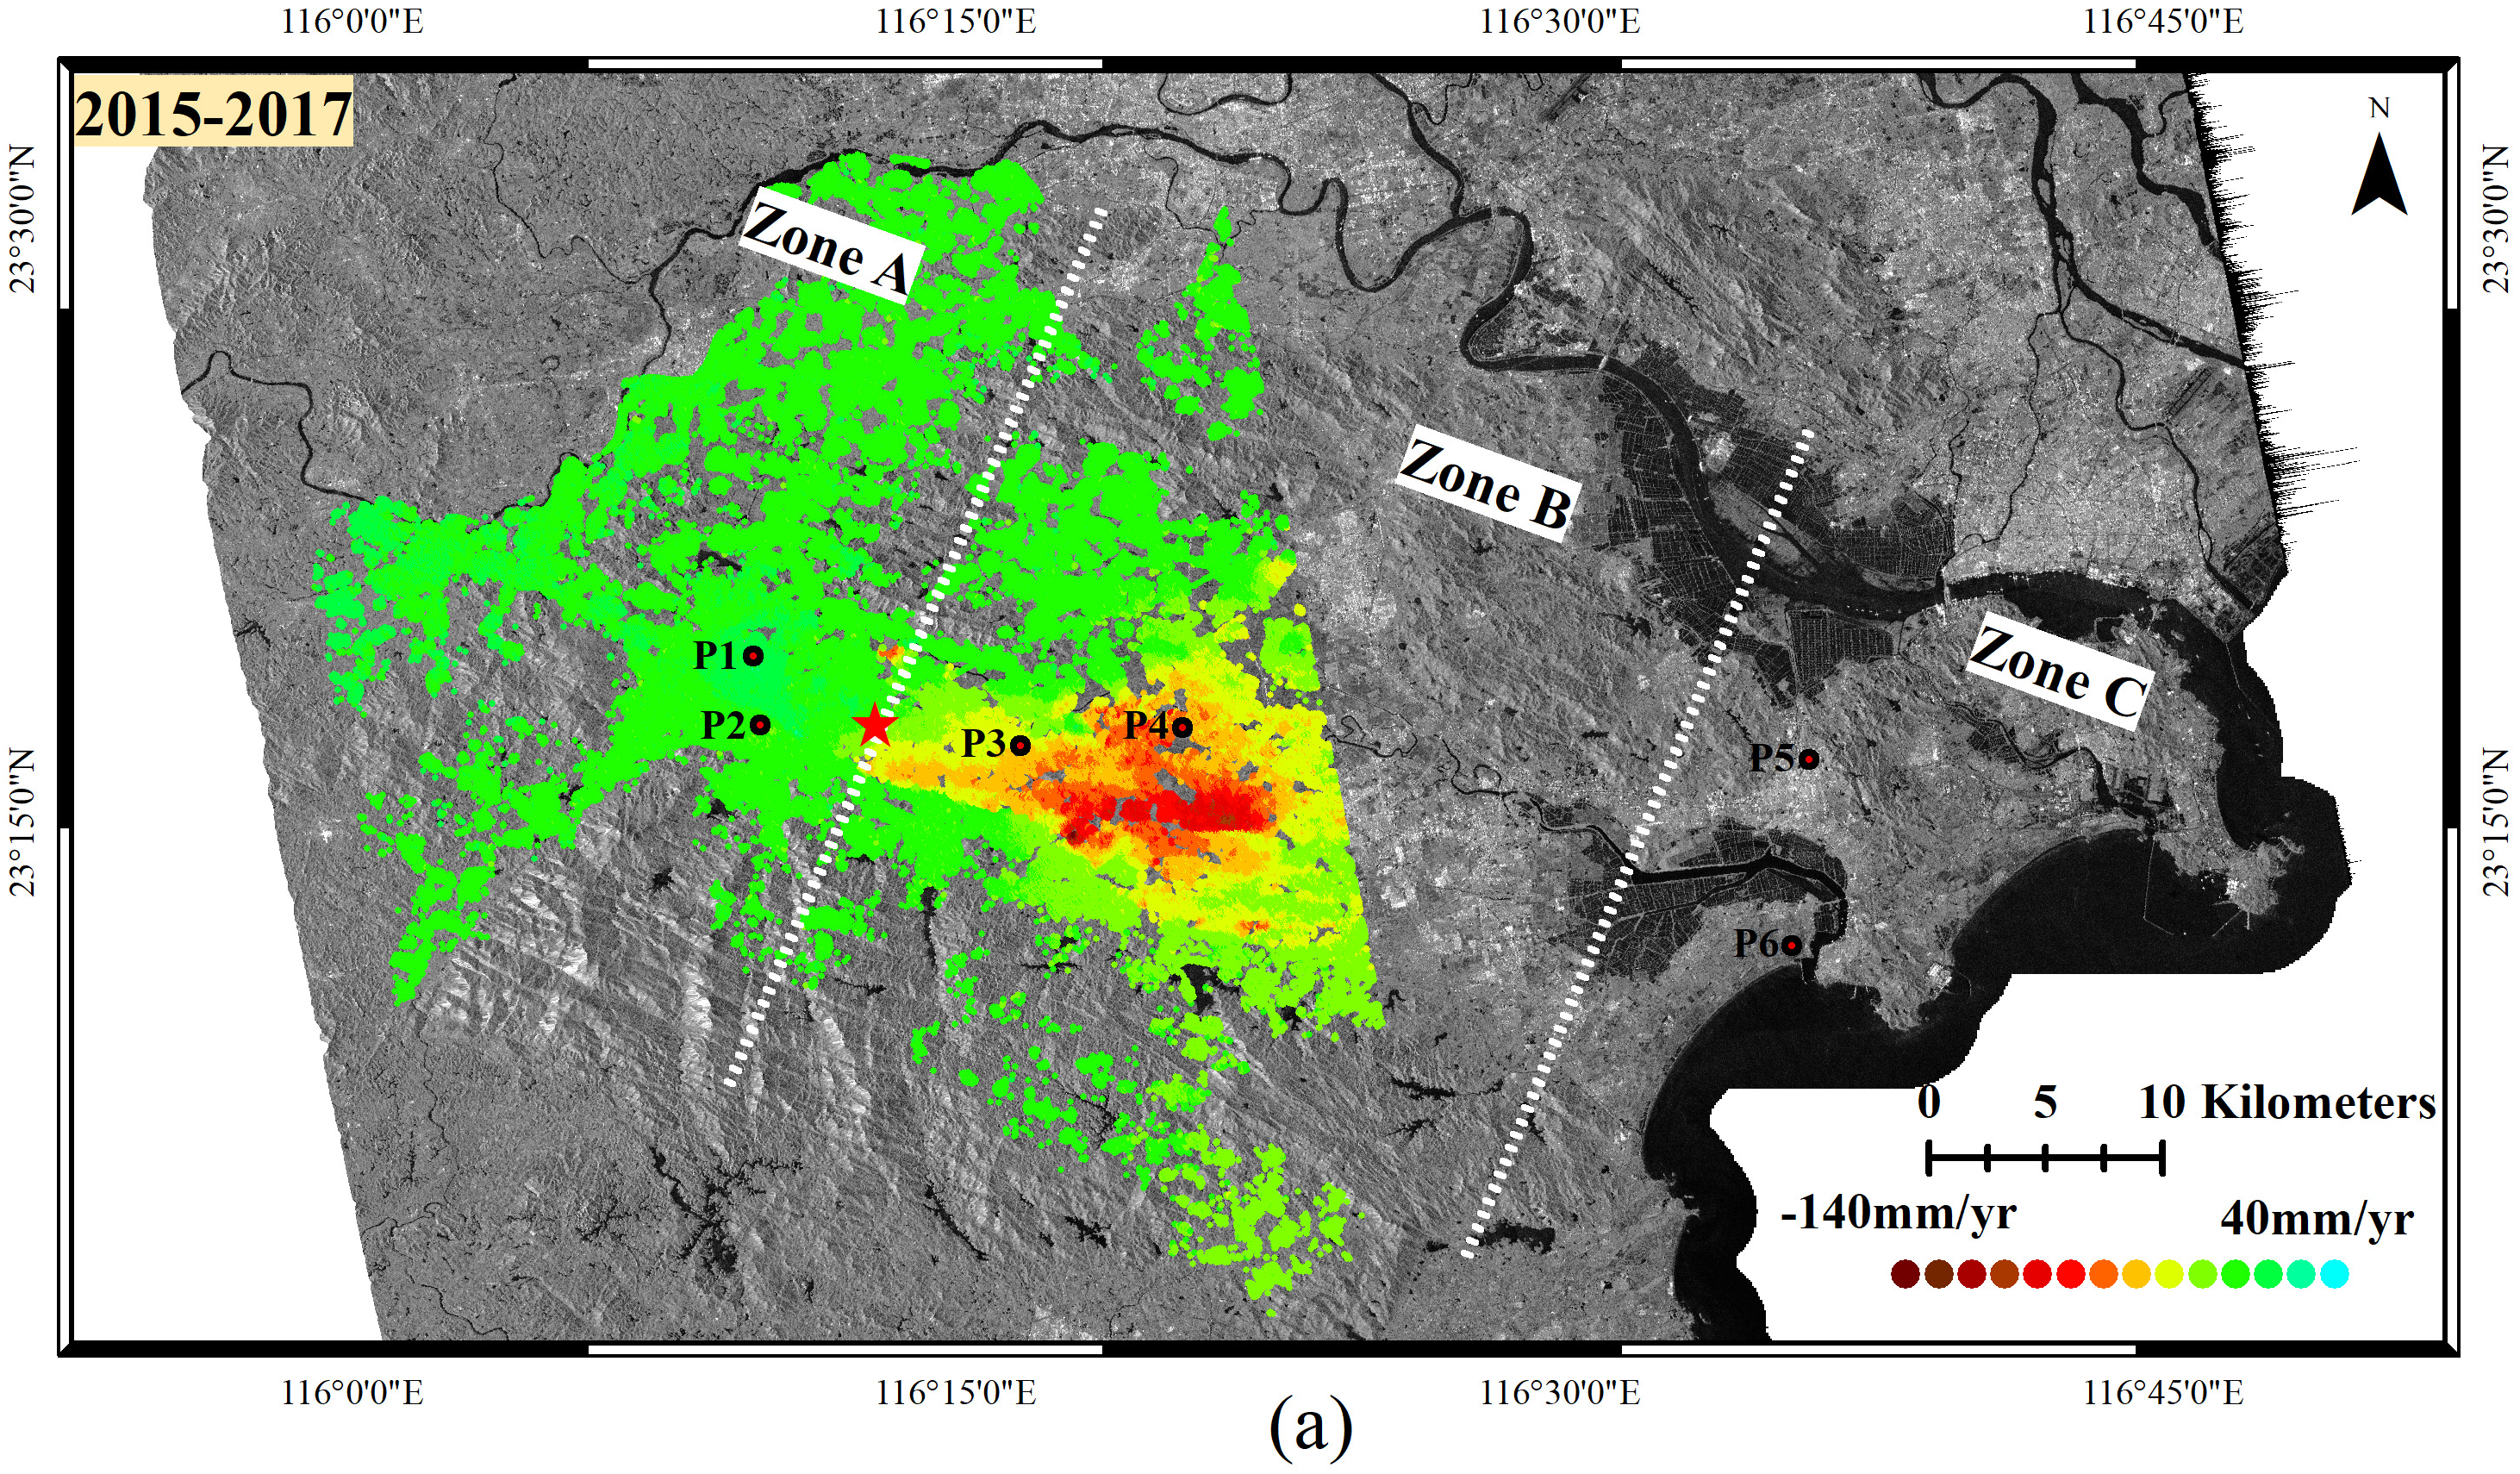
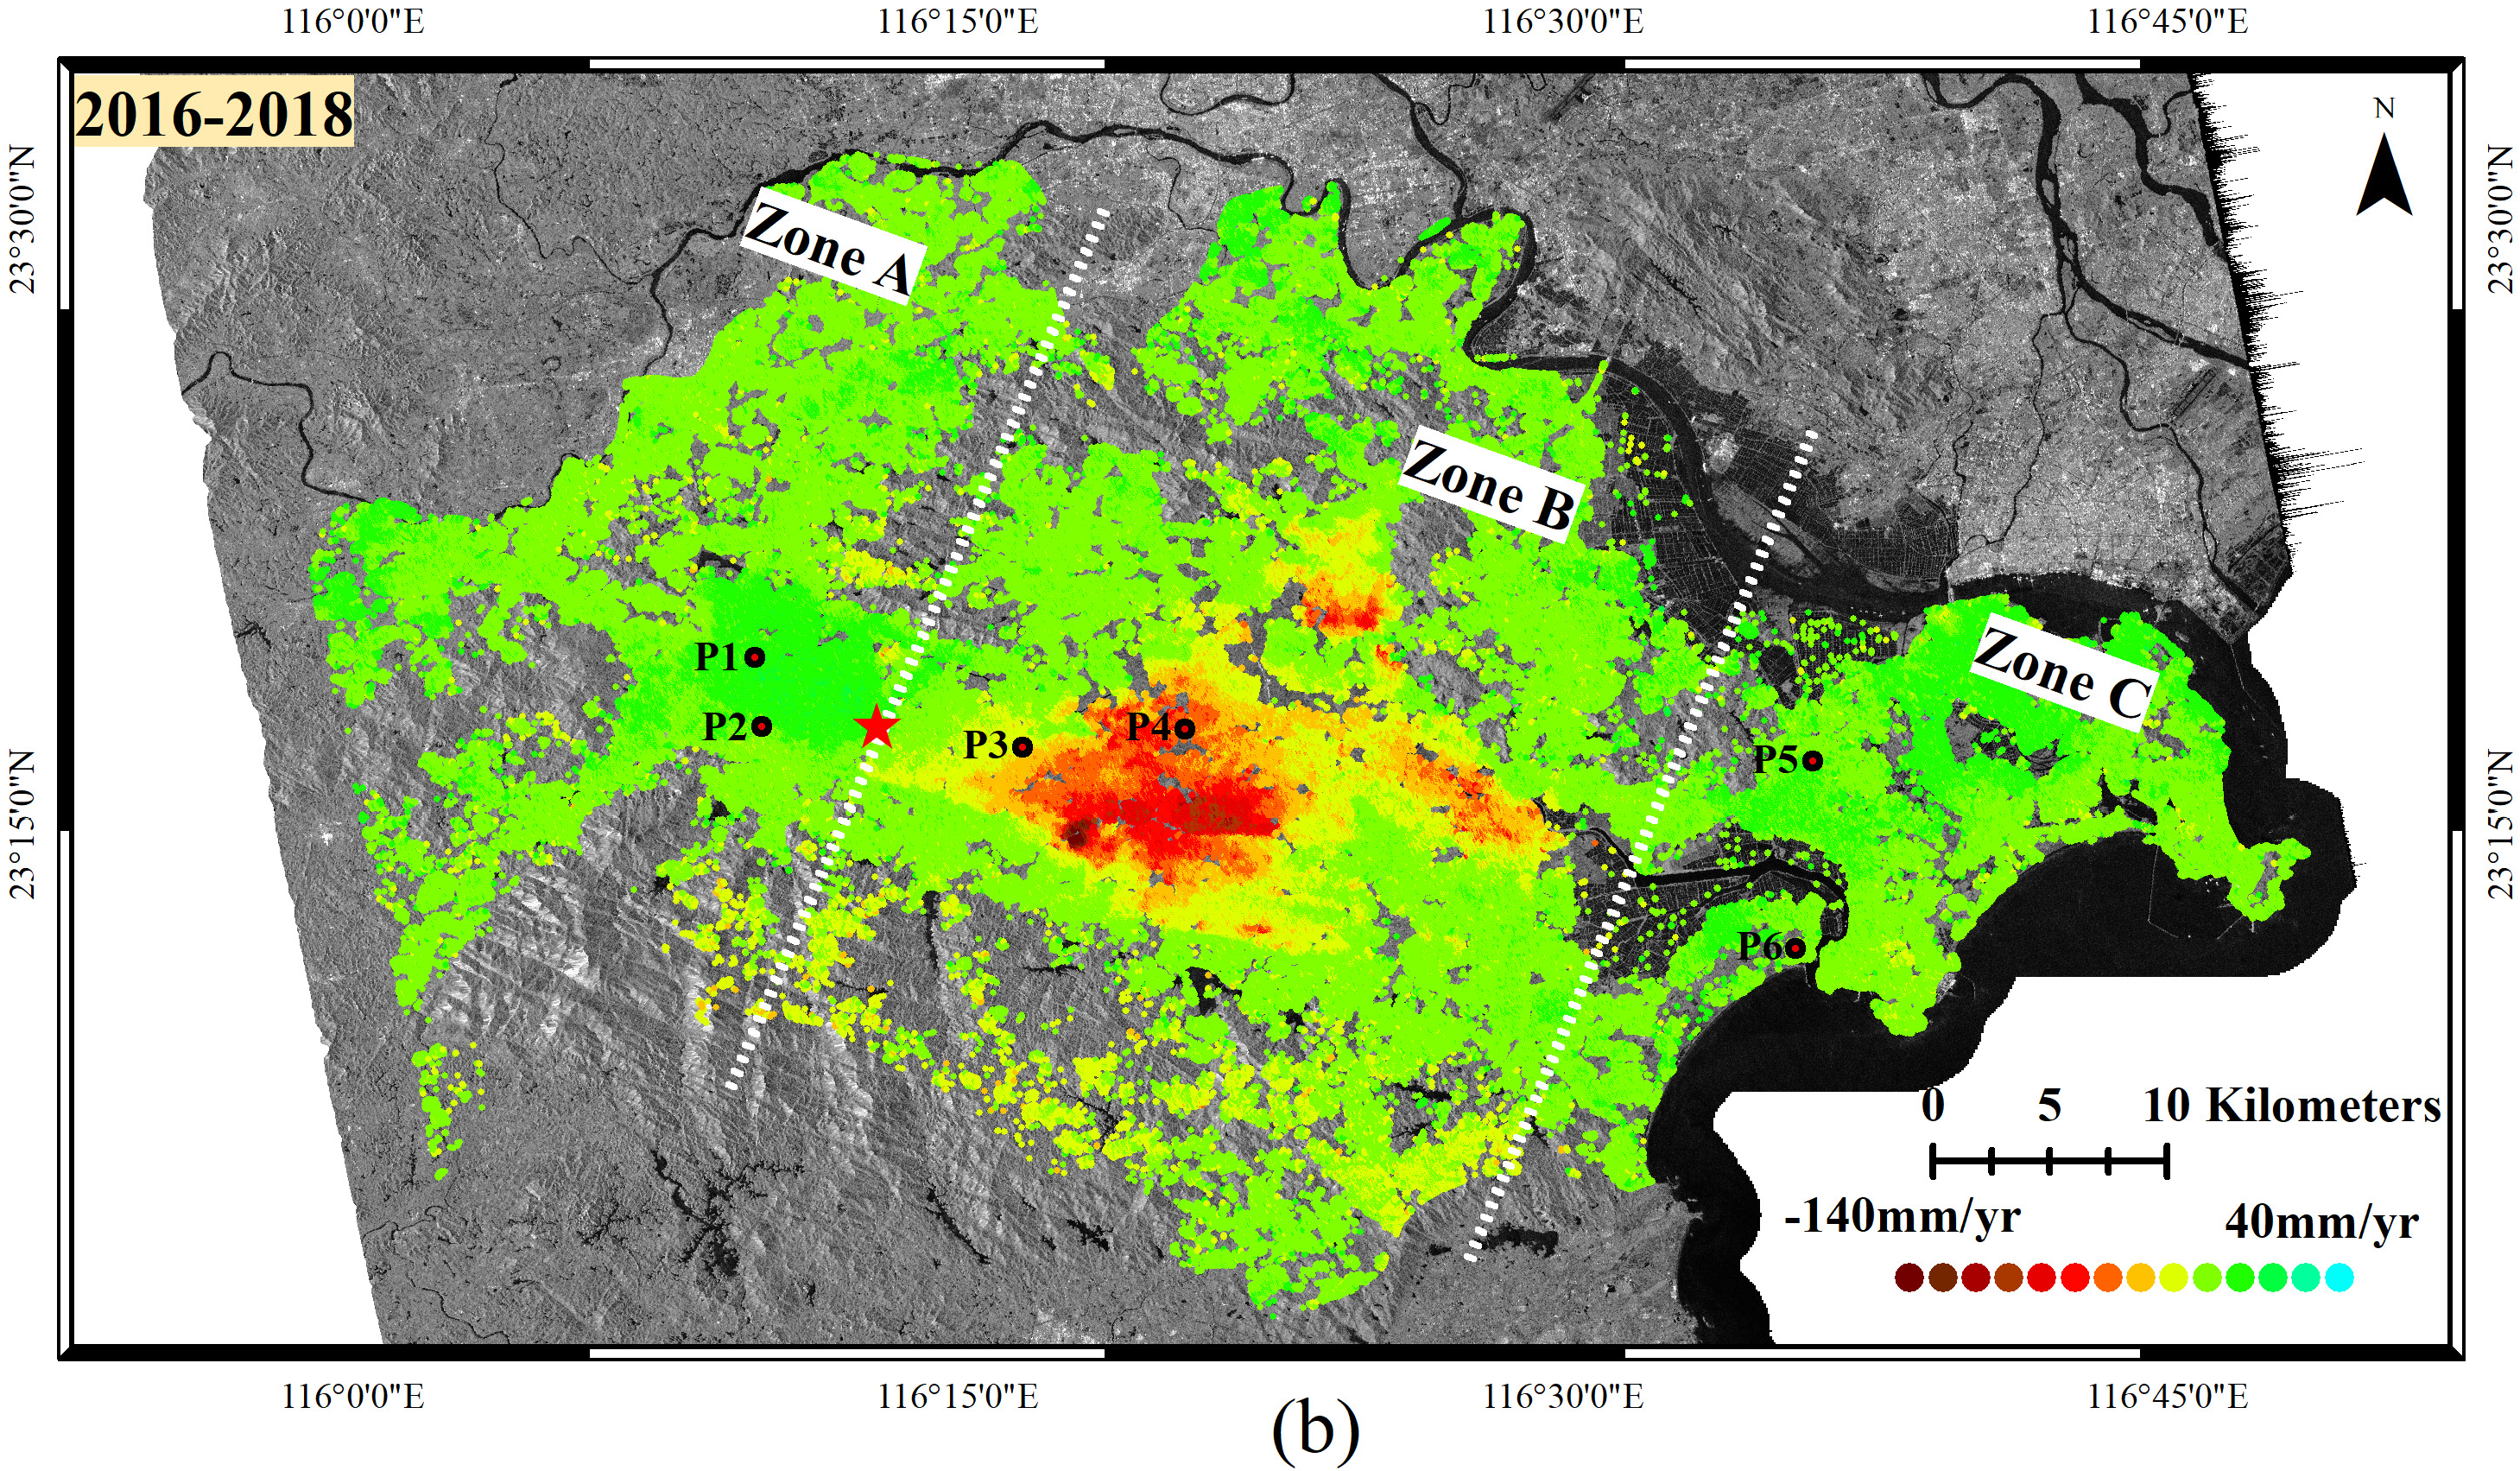
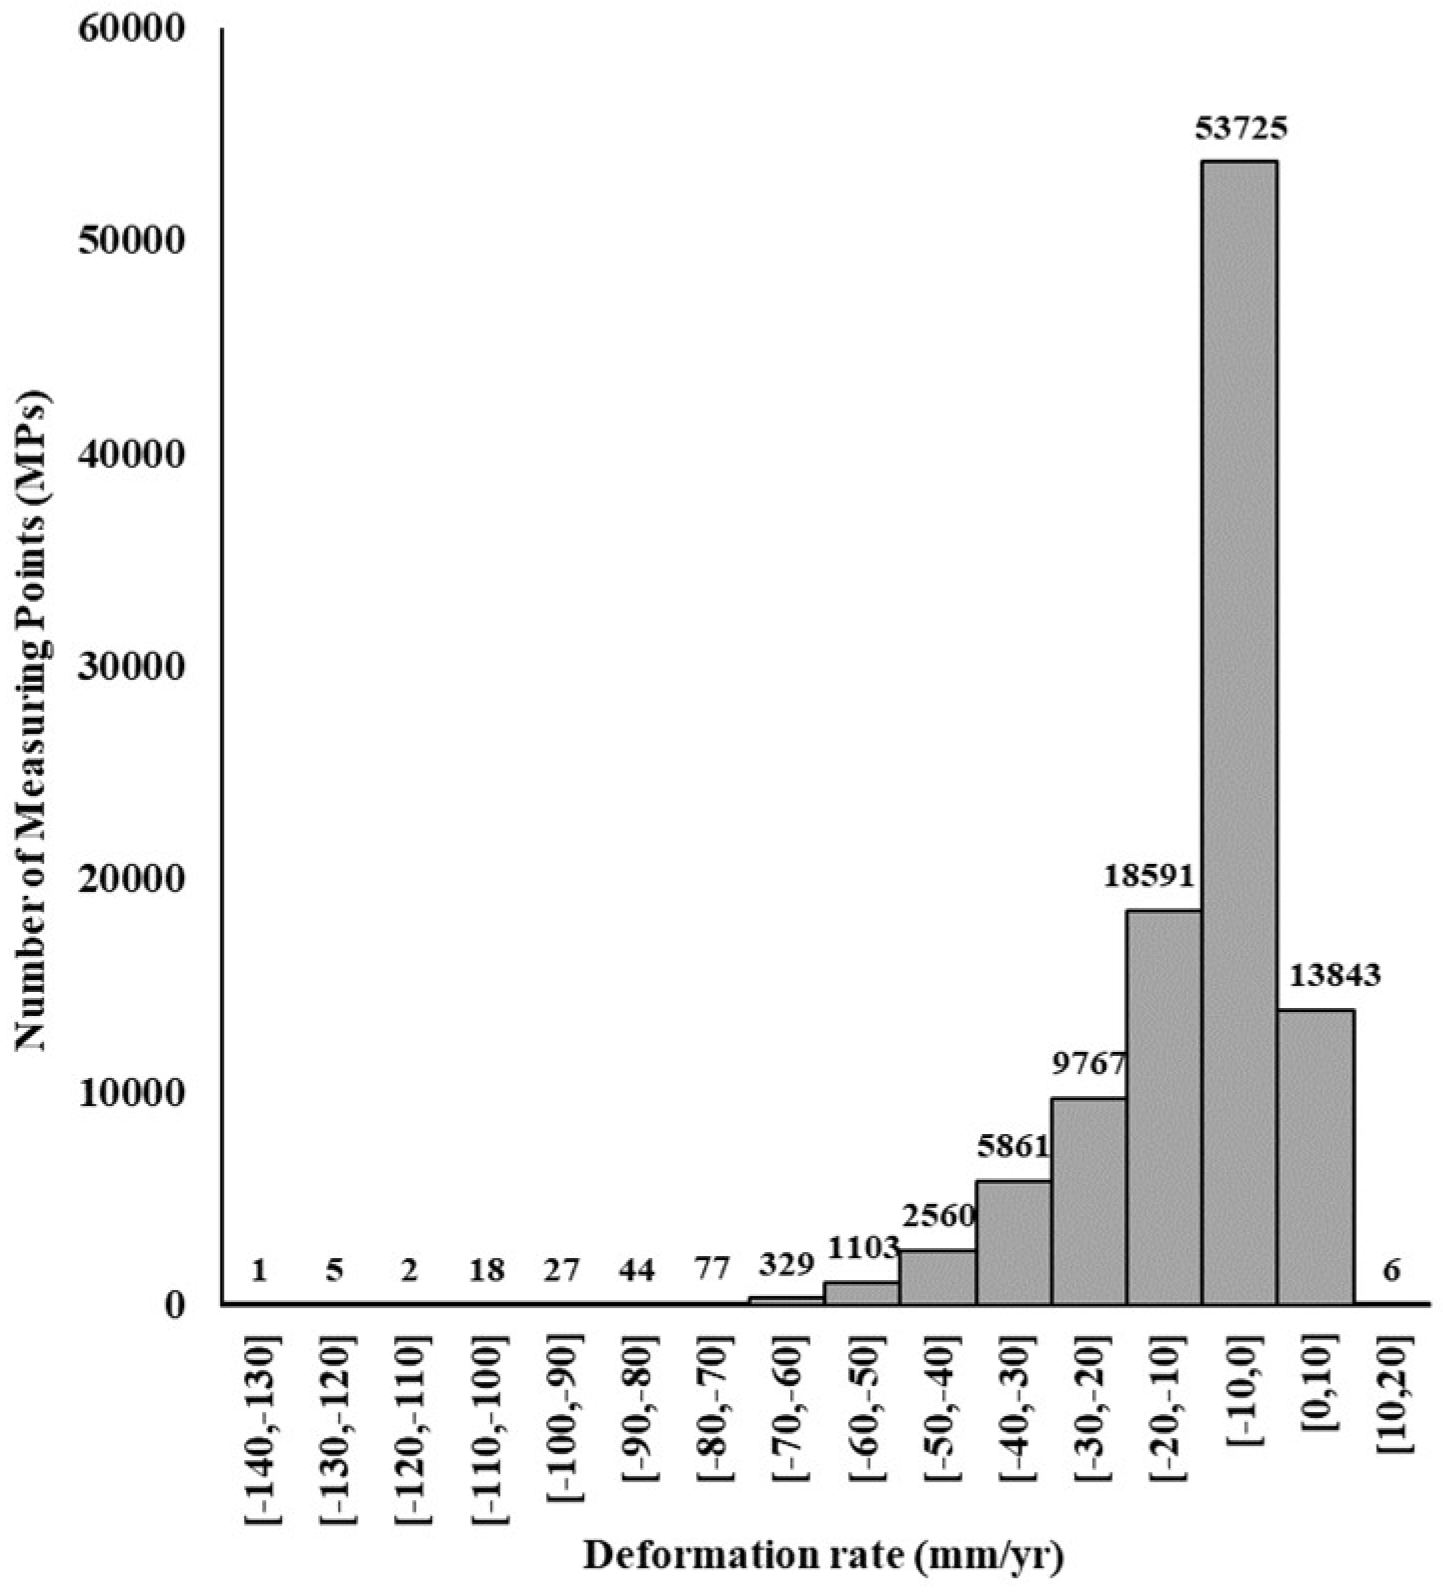
4.1. InSAR-Derived Deformation Rate
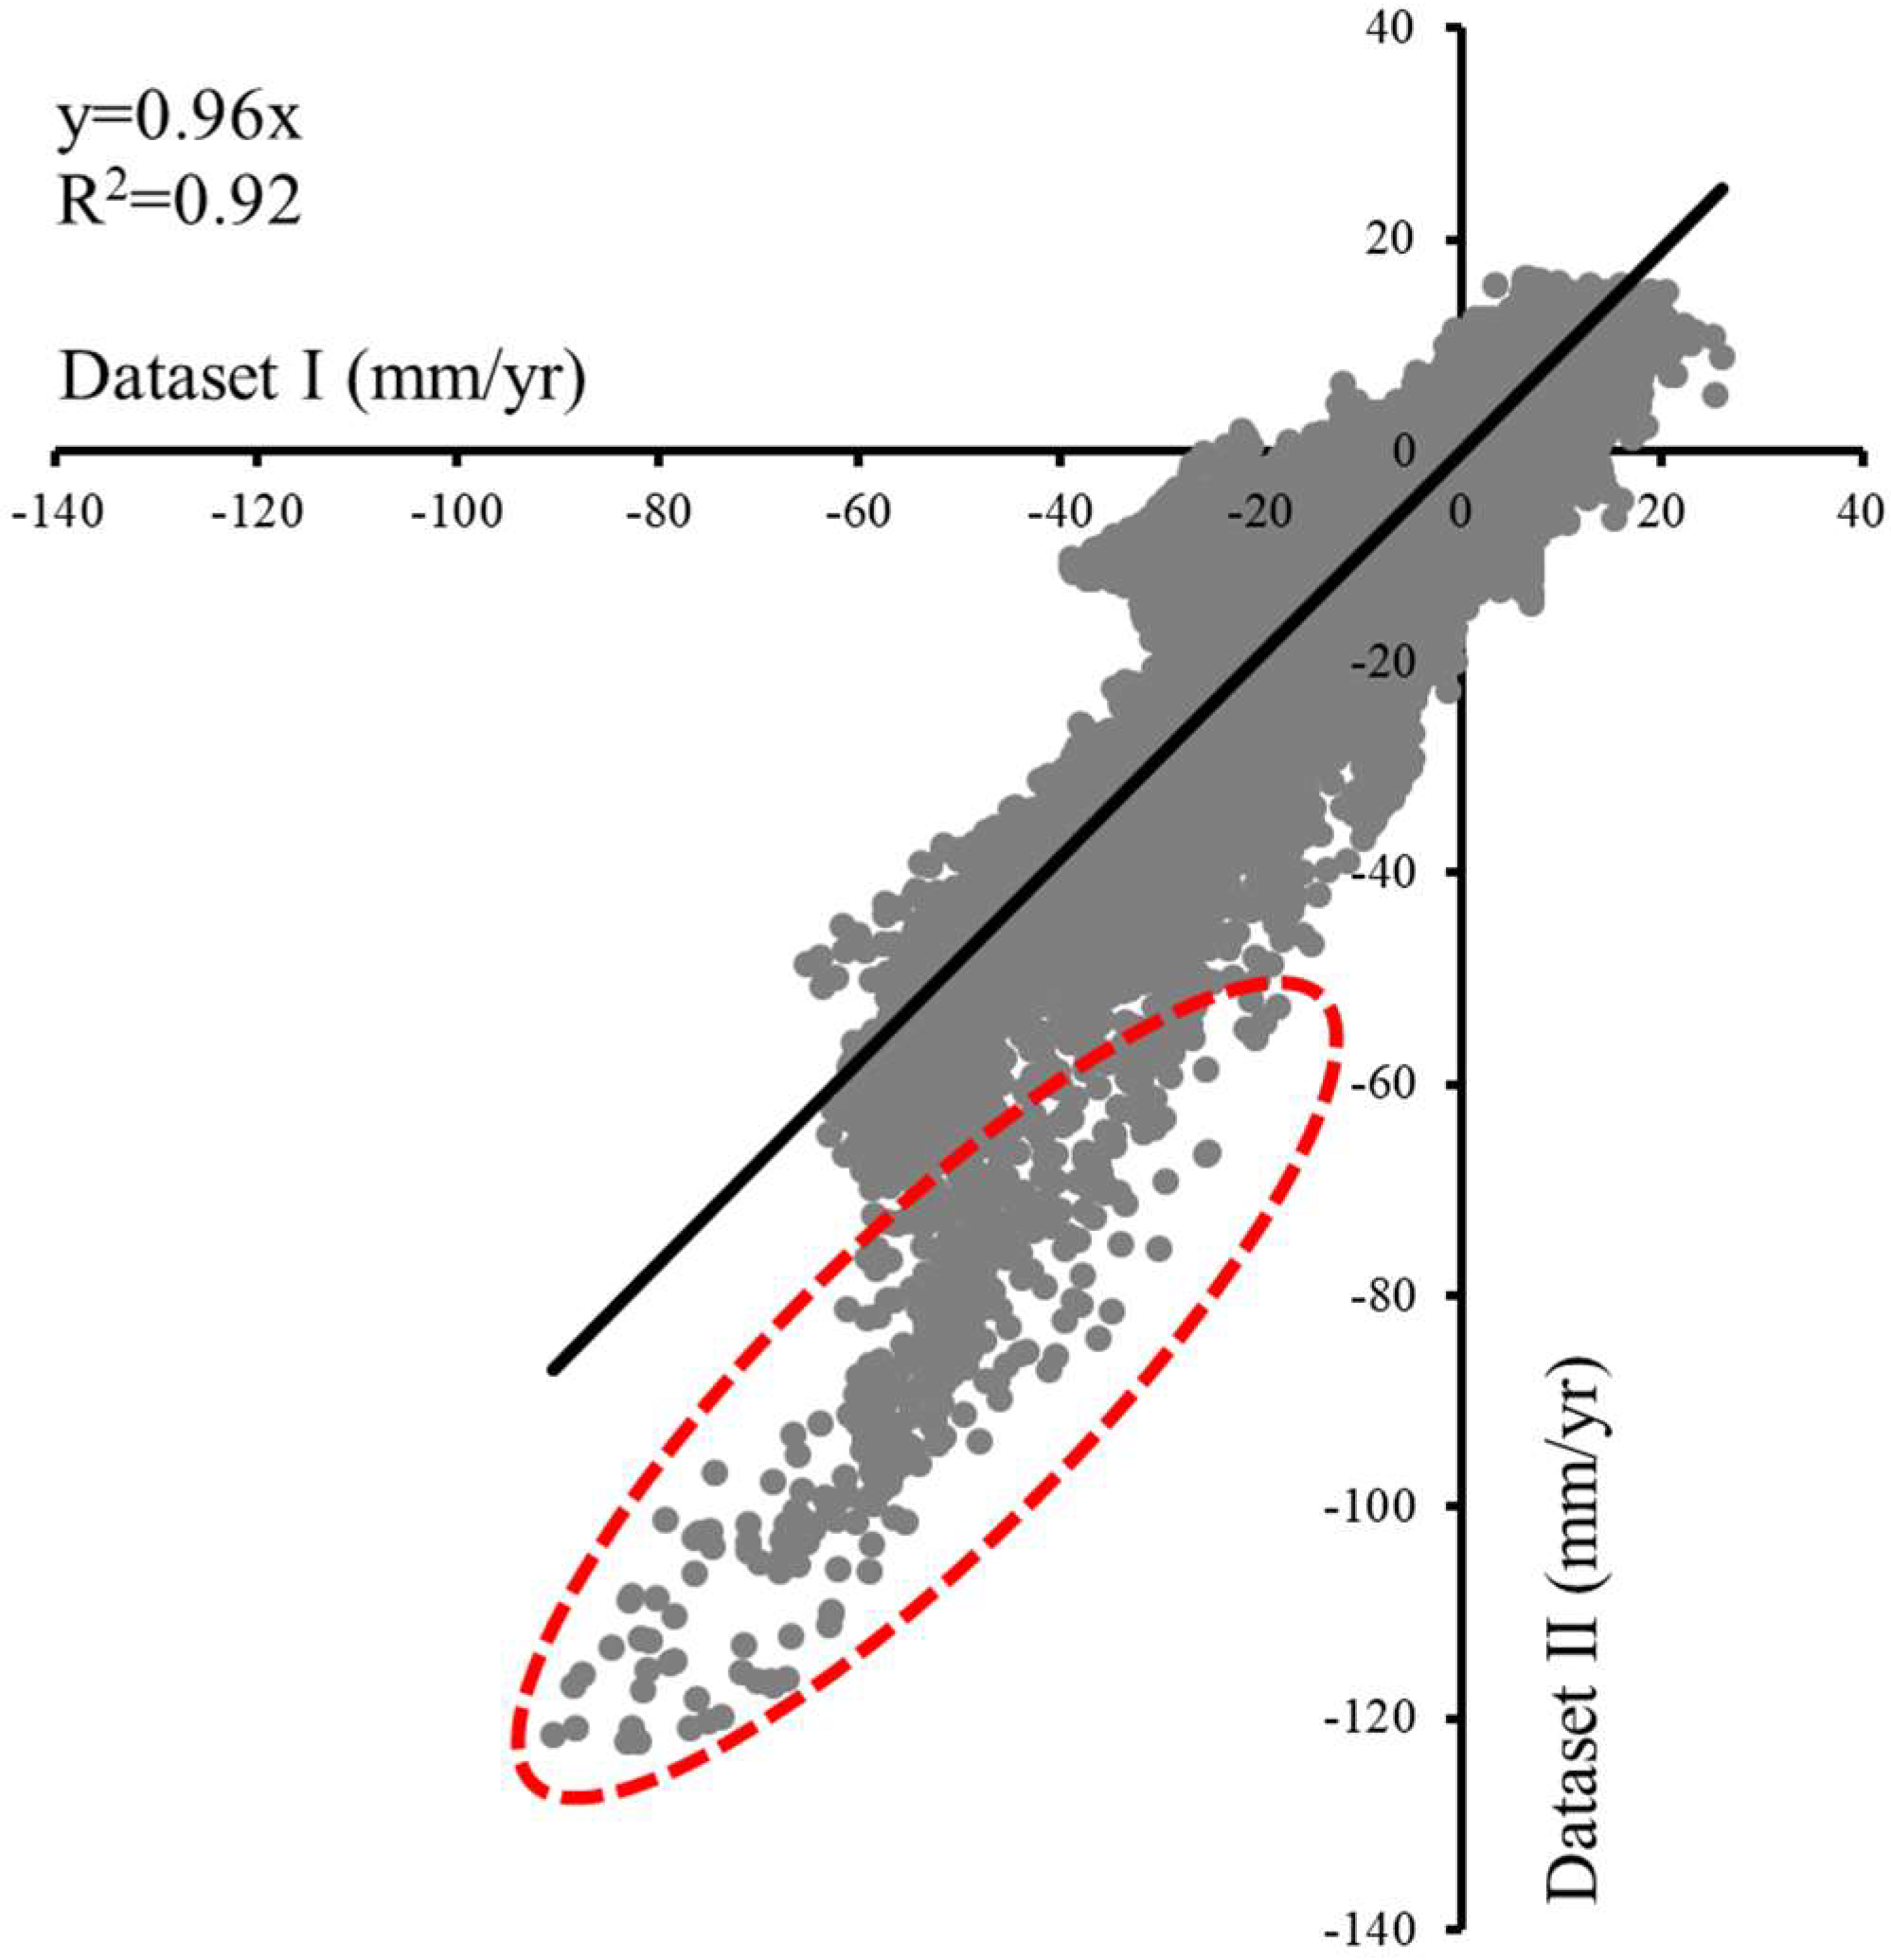
4.2. Consistency Evaluation
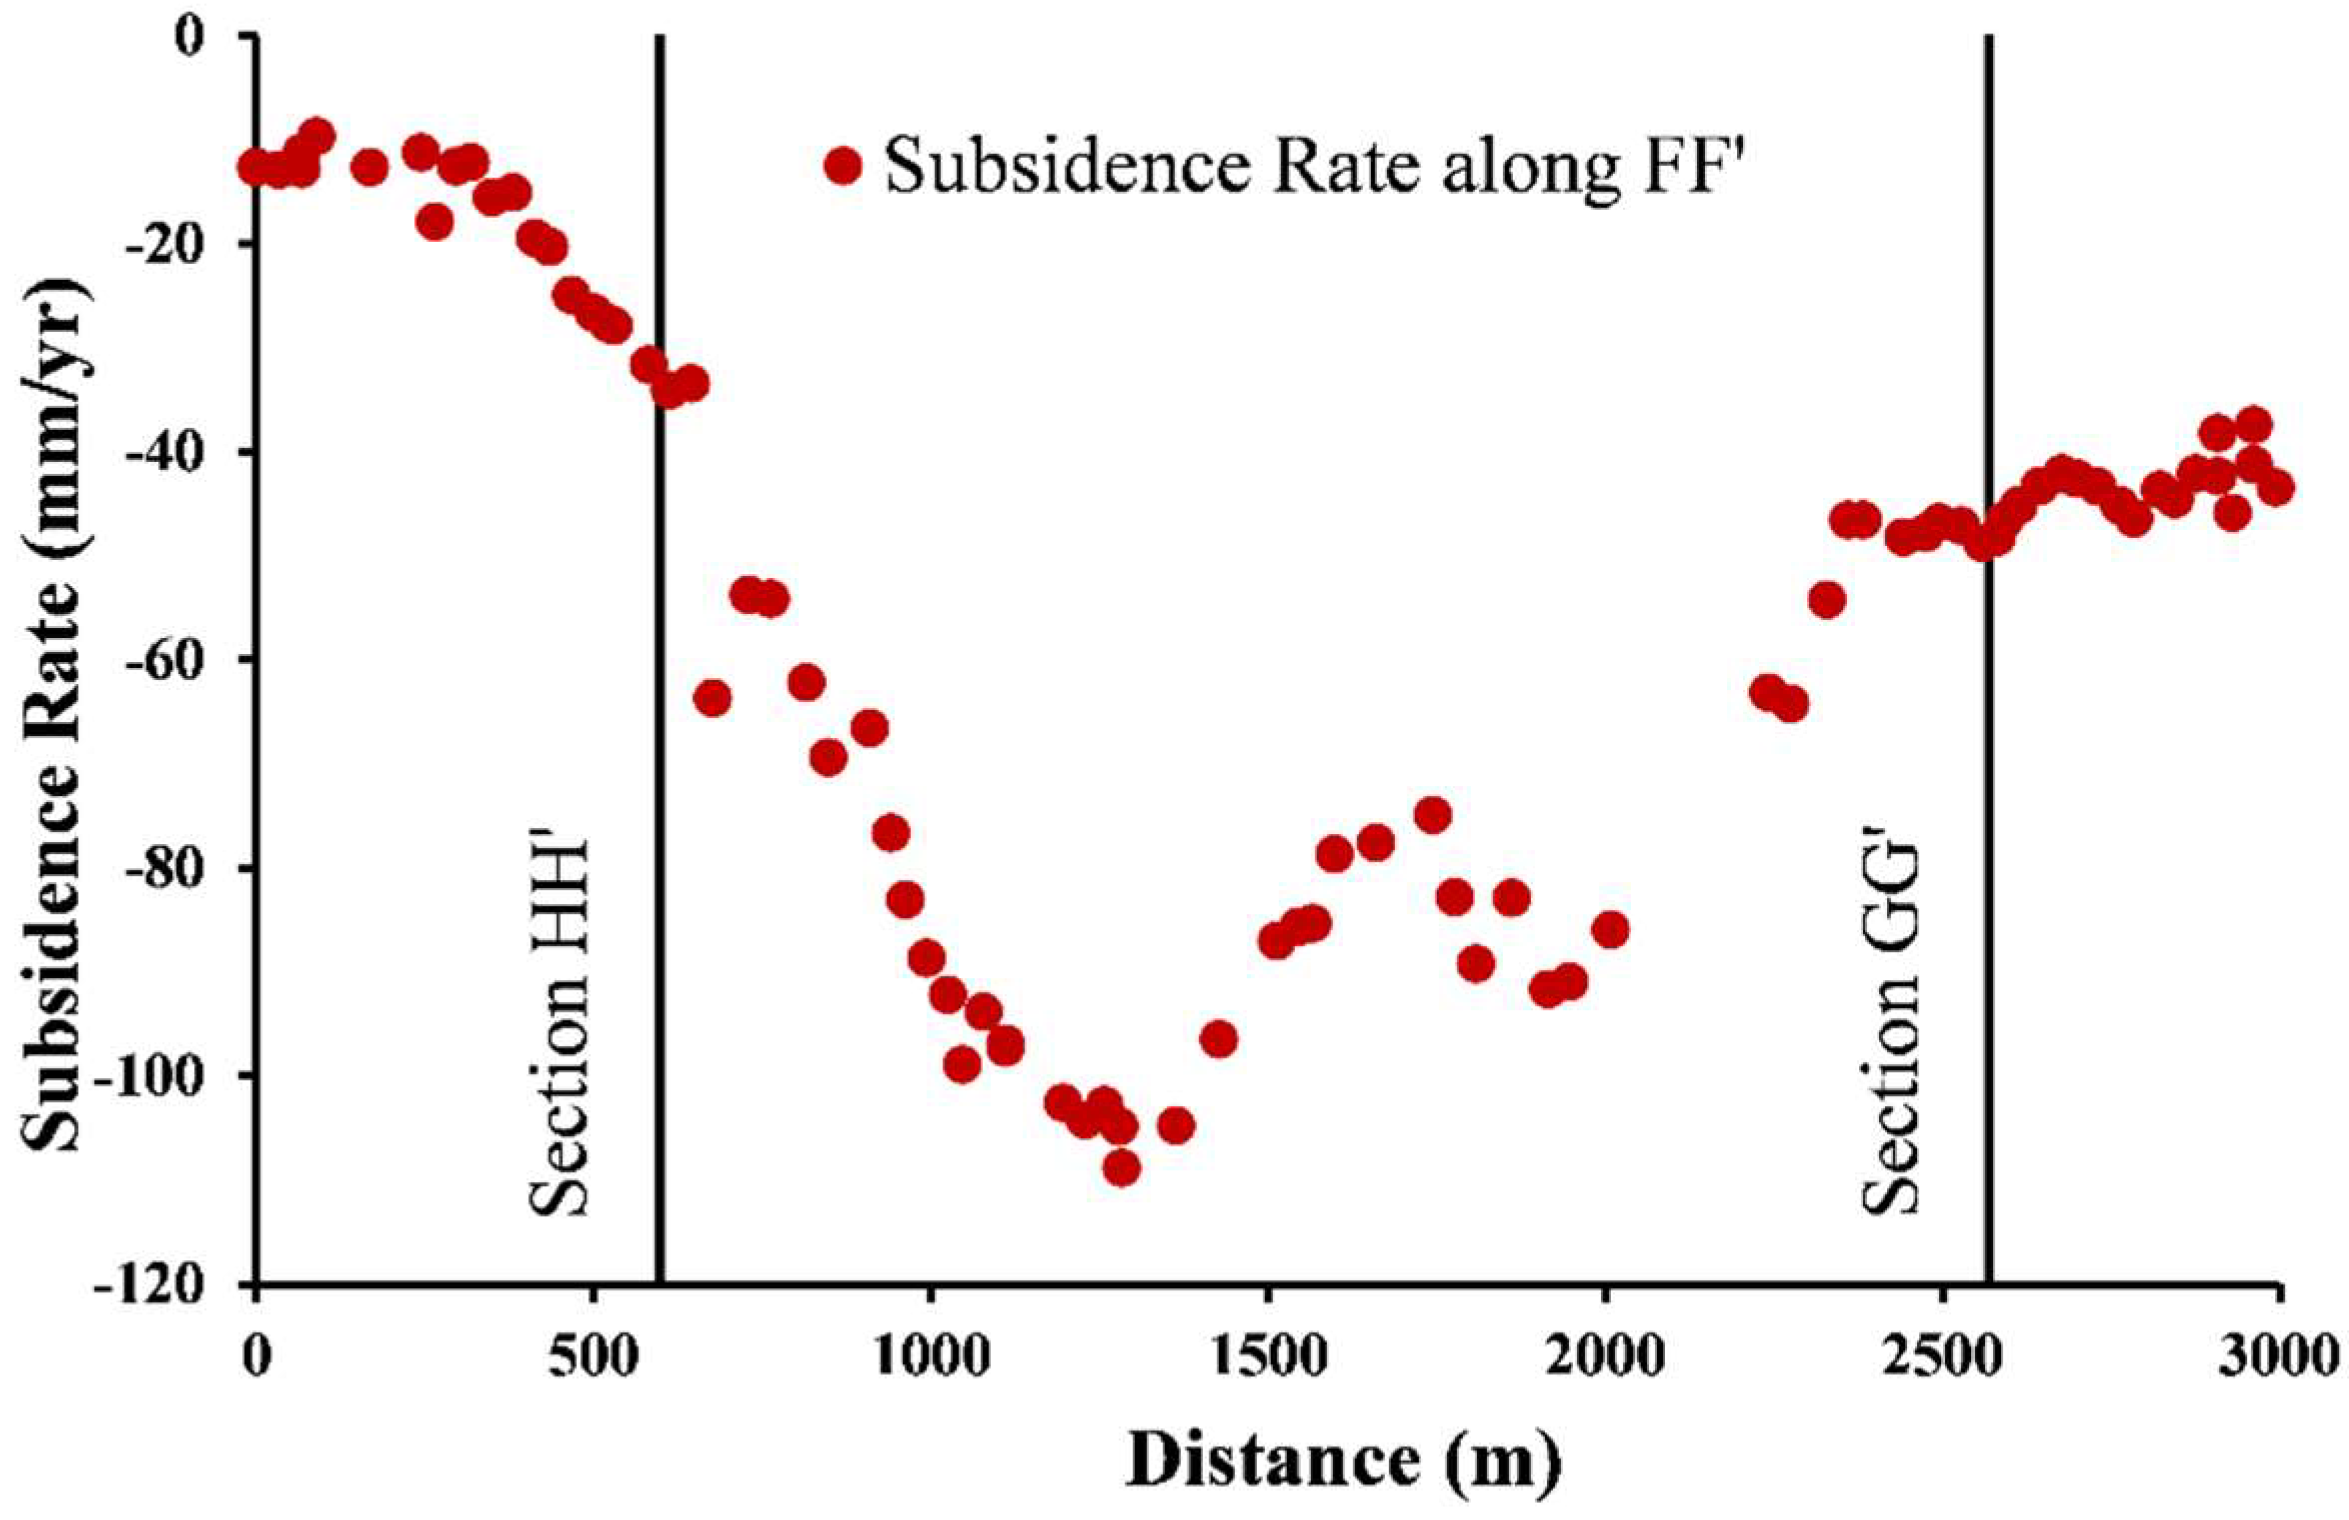
4.3. Spatial Pattern of Ground Subsidence
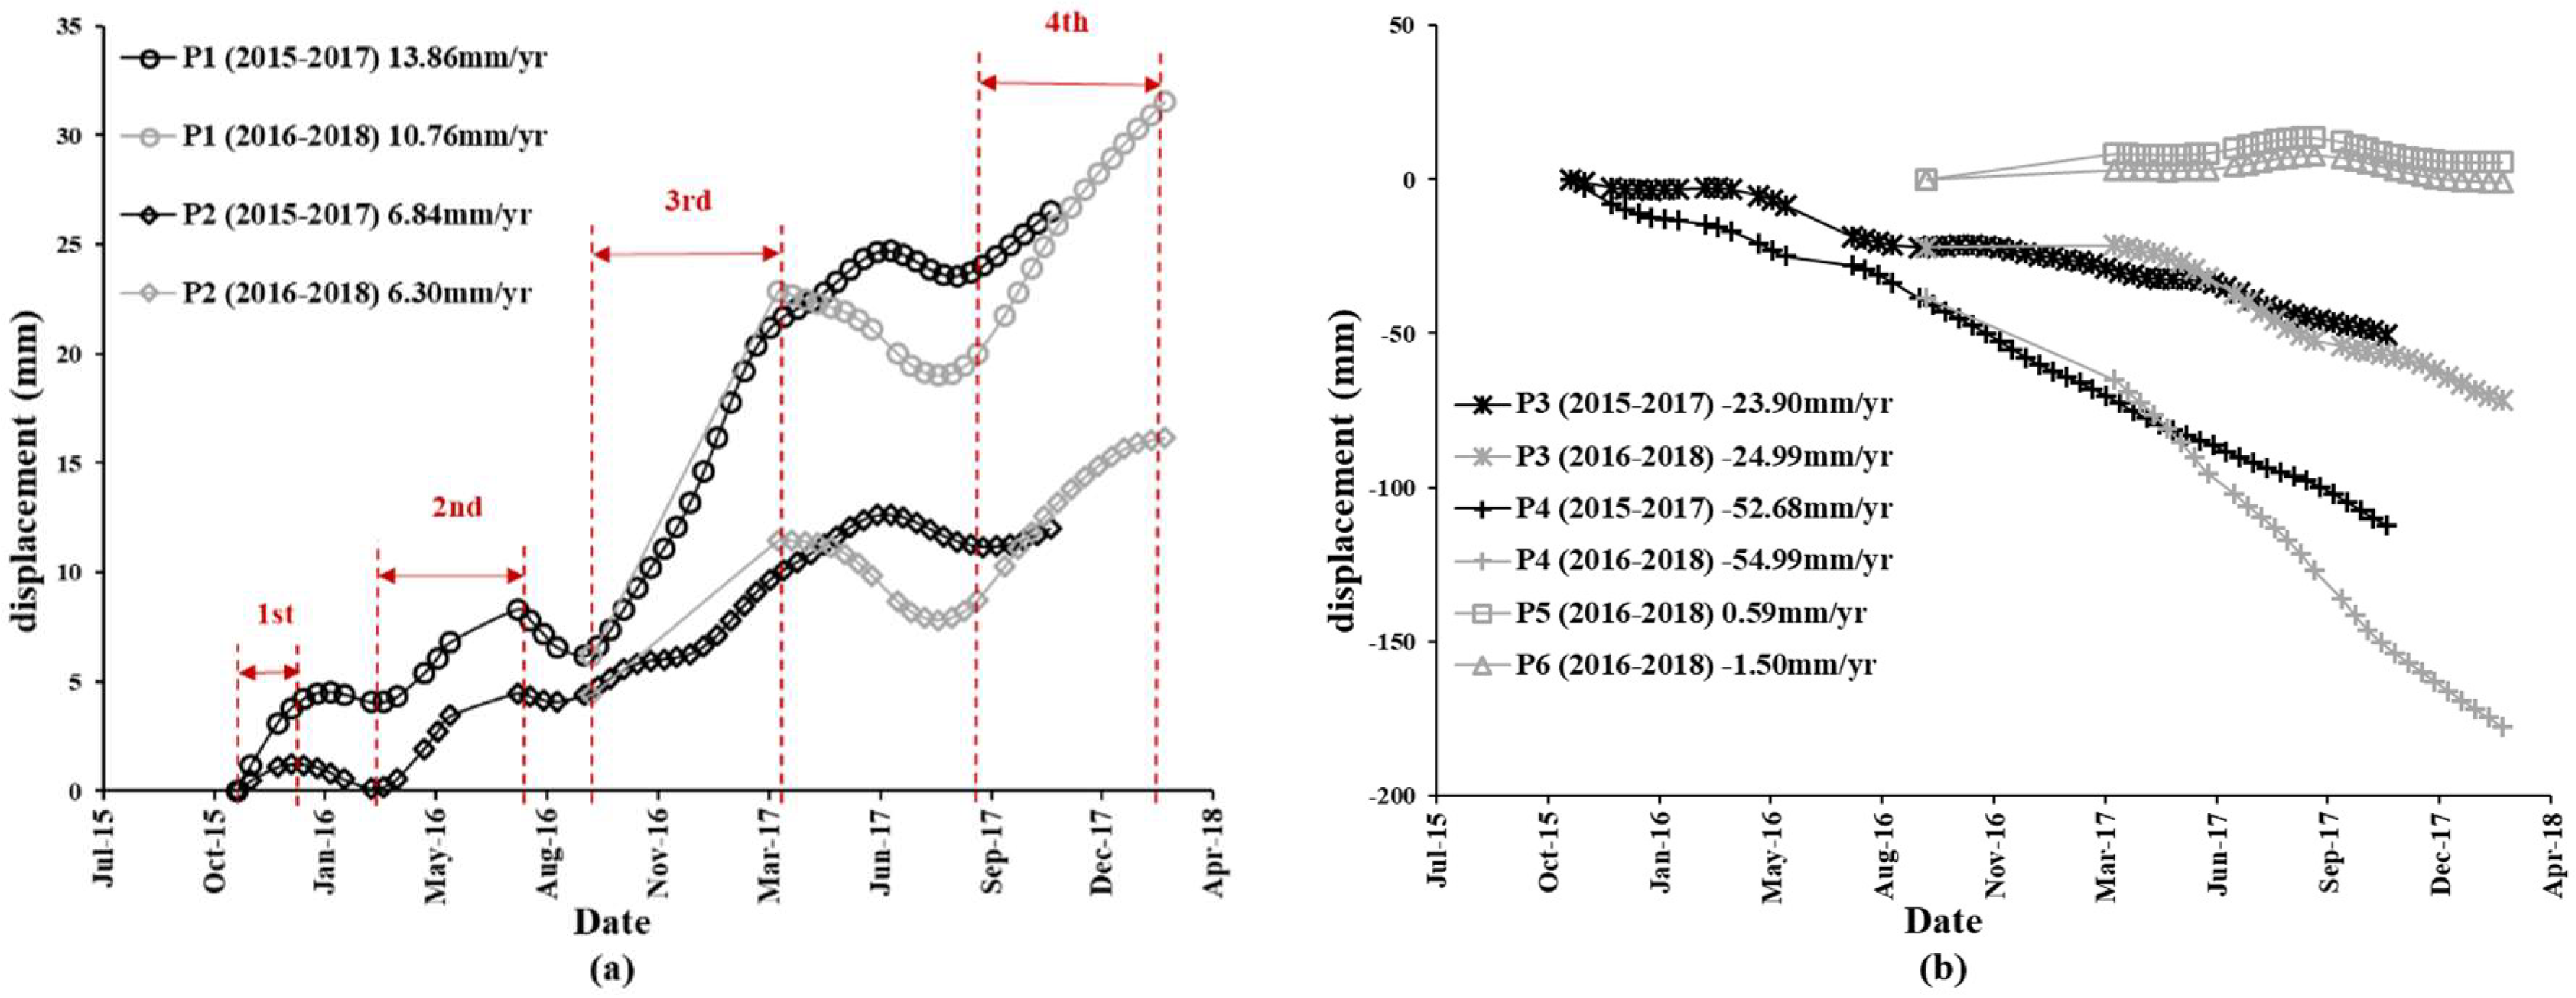
4.4. Temporal Evolution of Surface Motion Changes
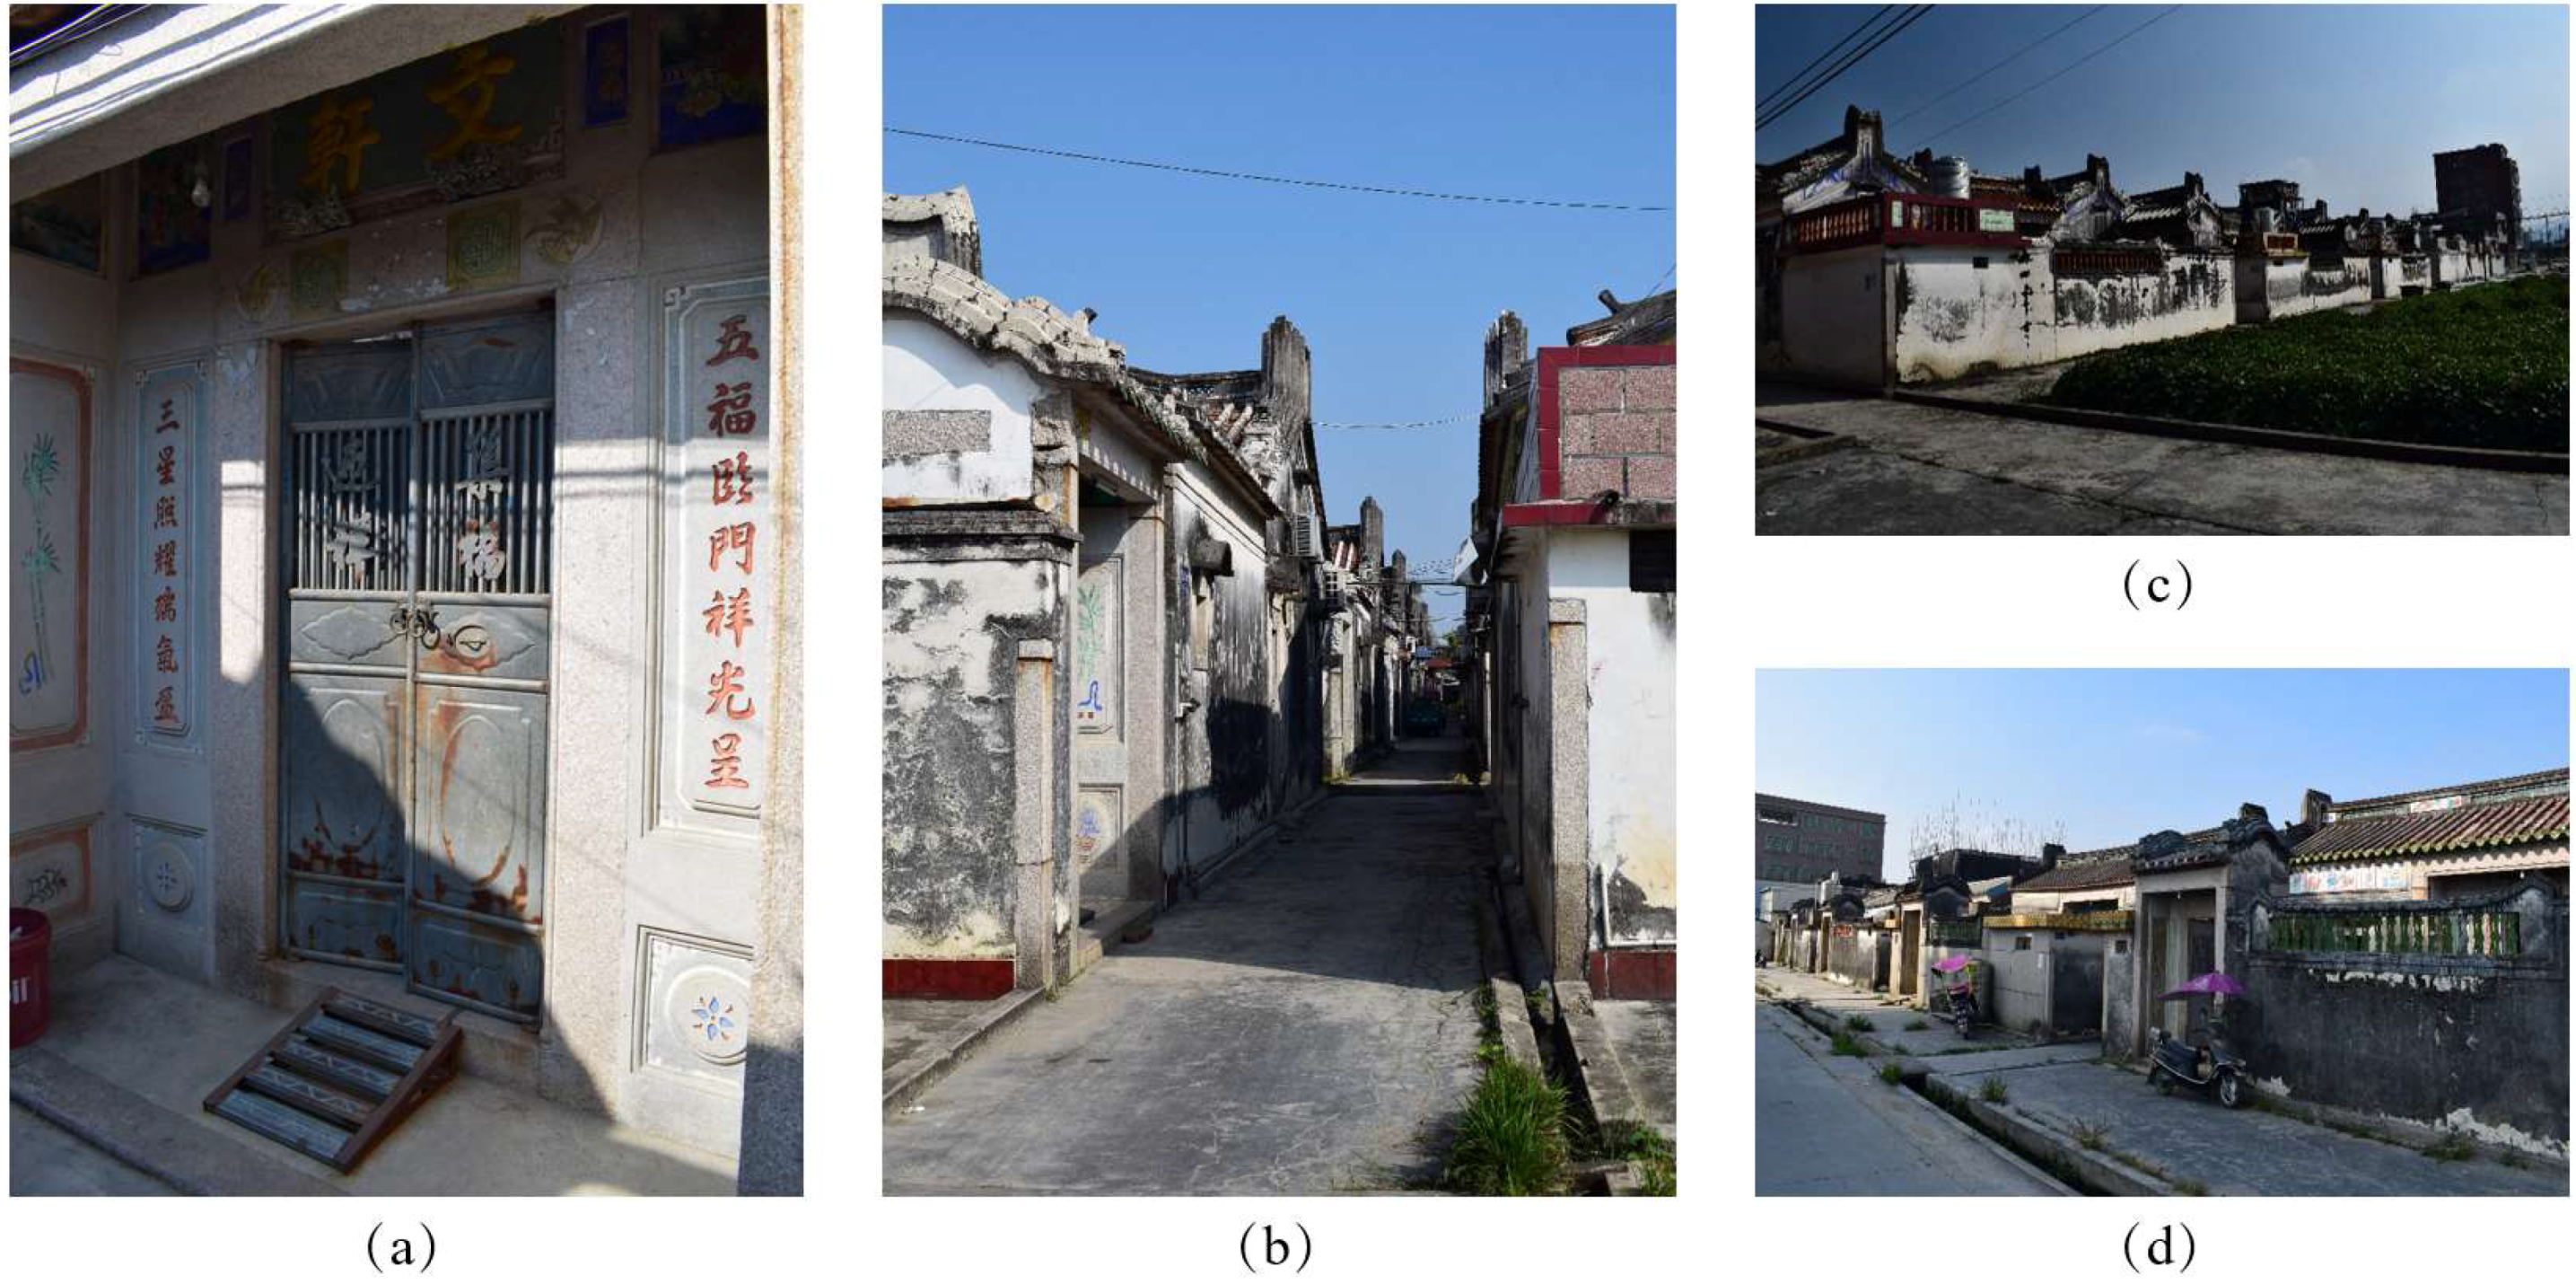
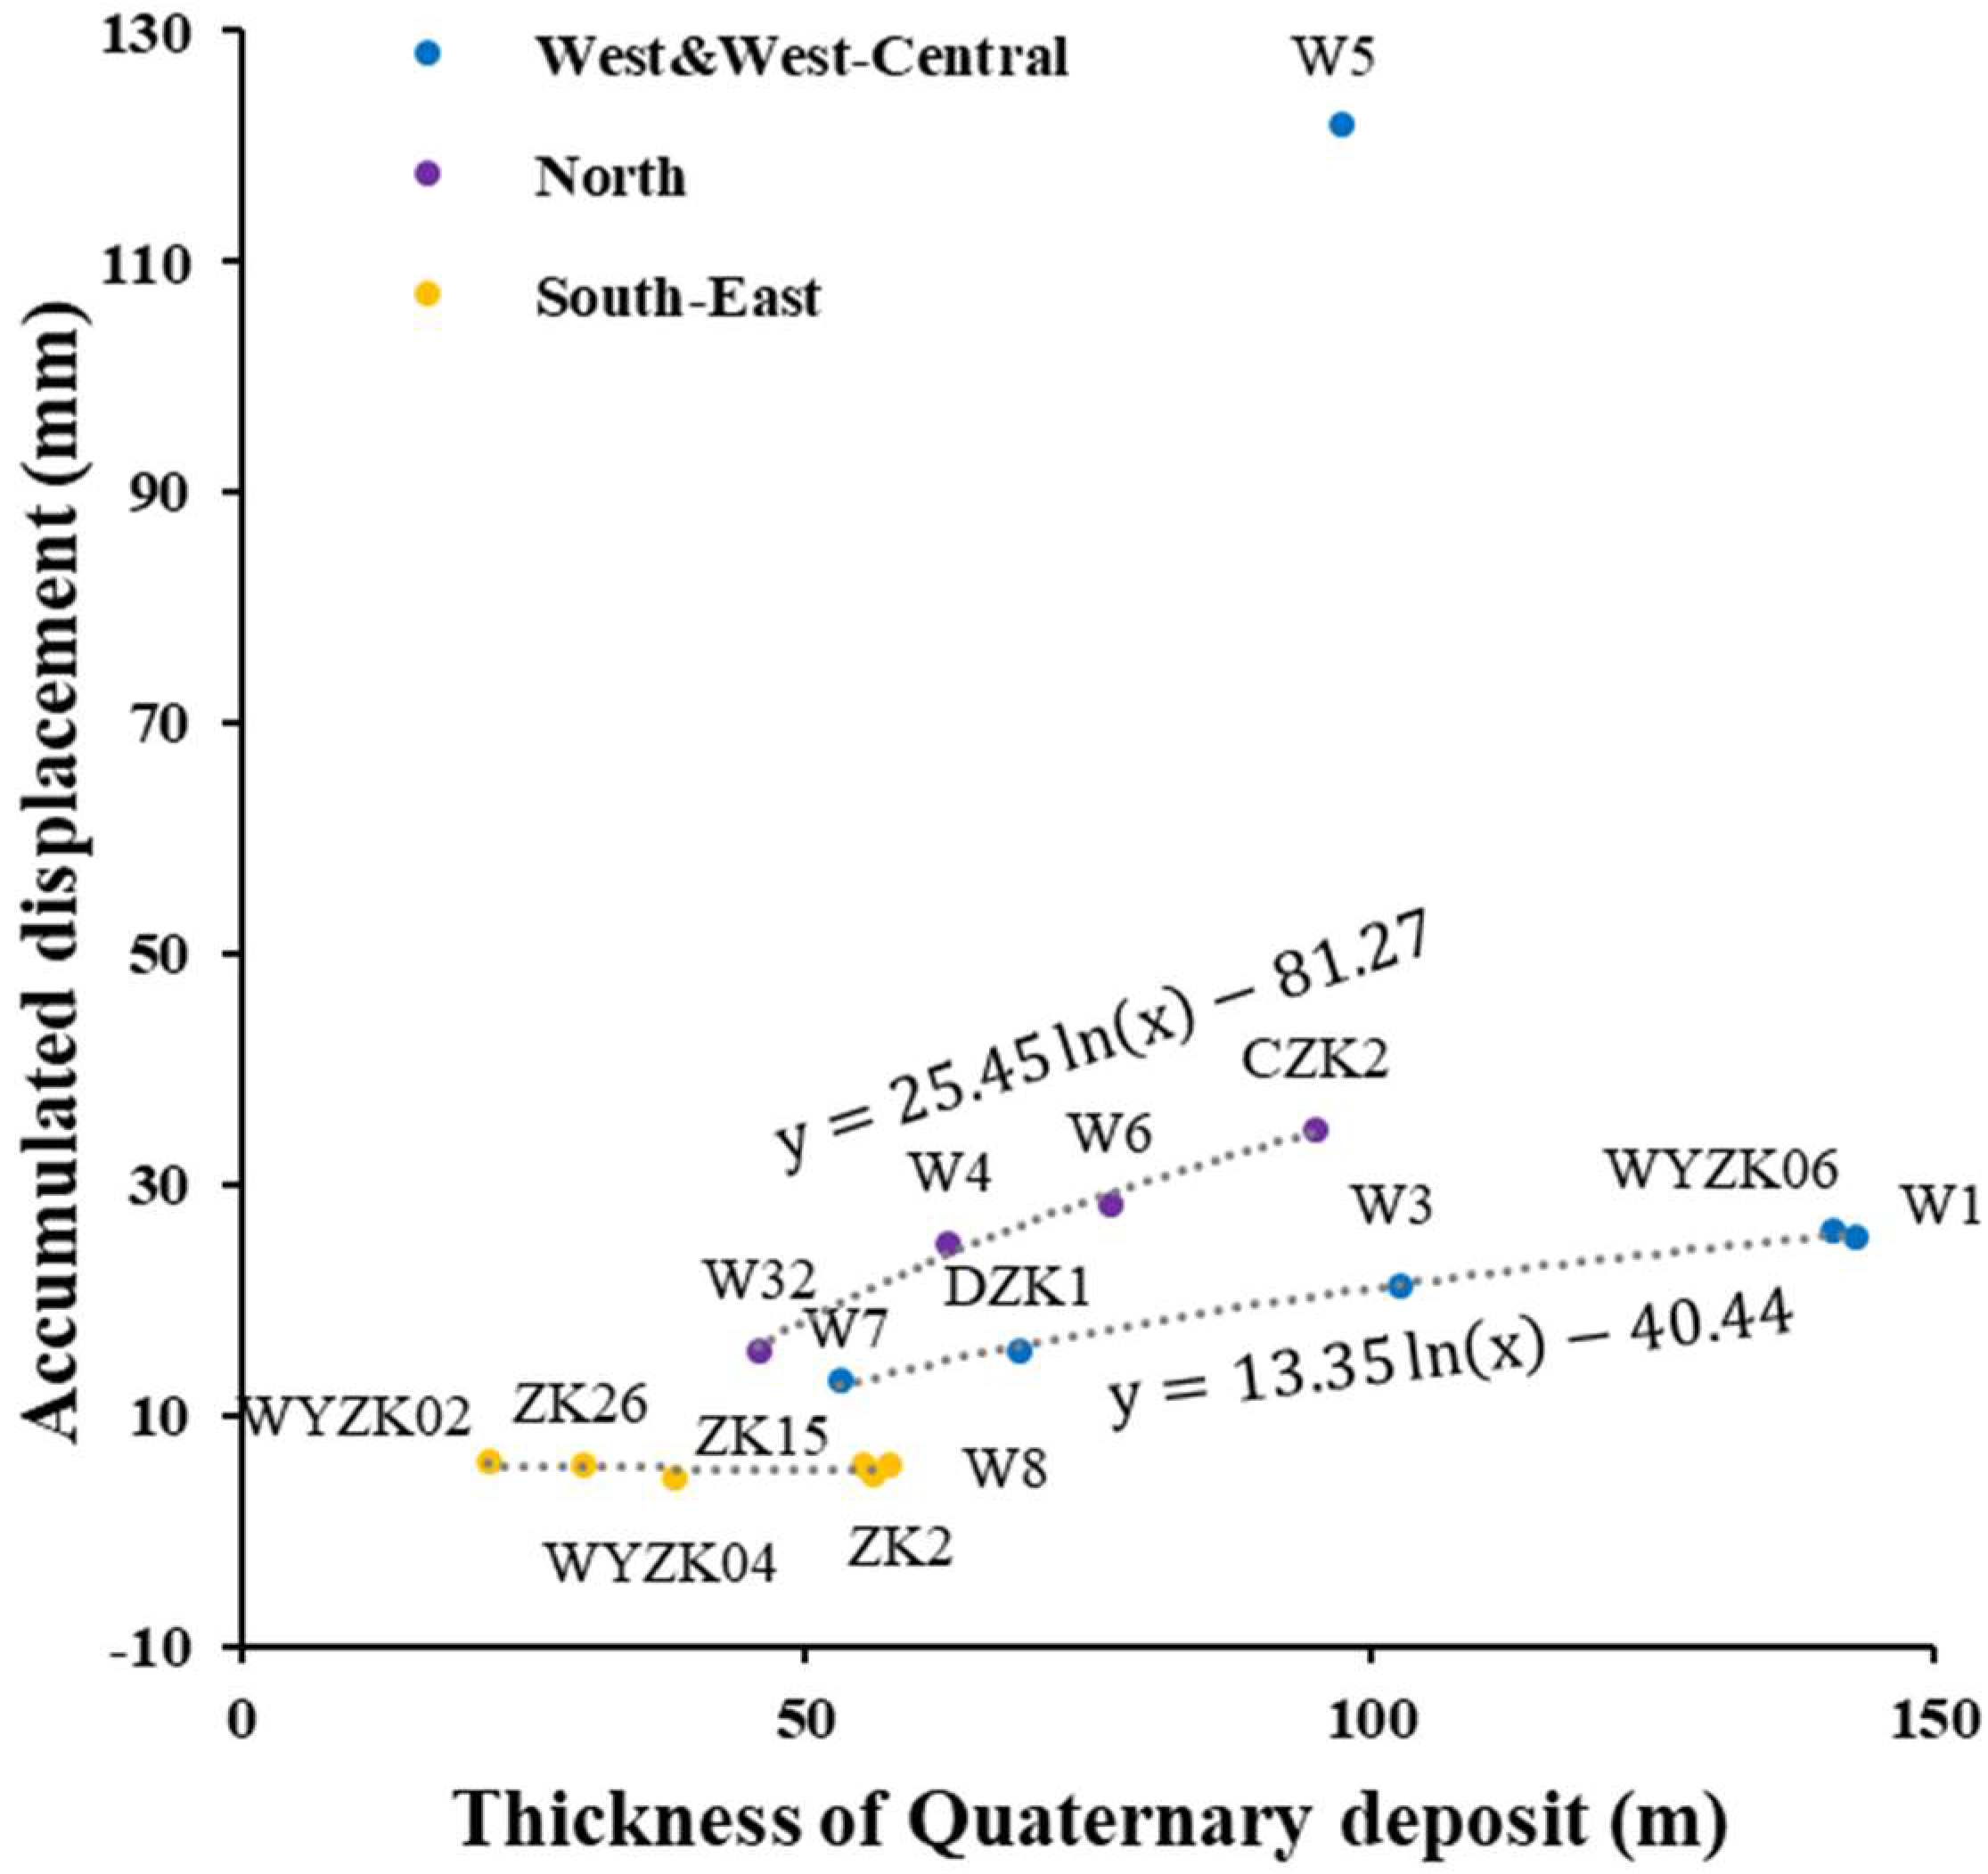
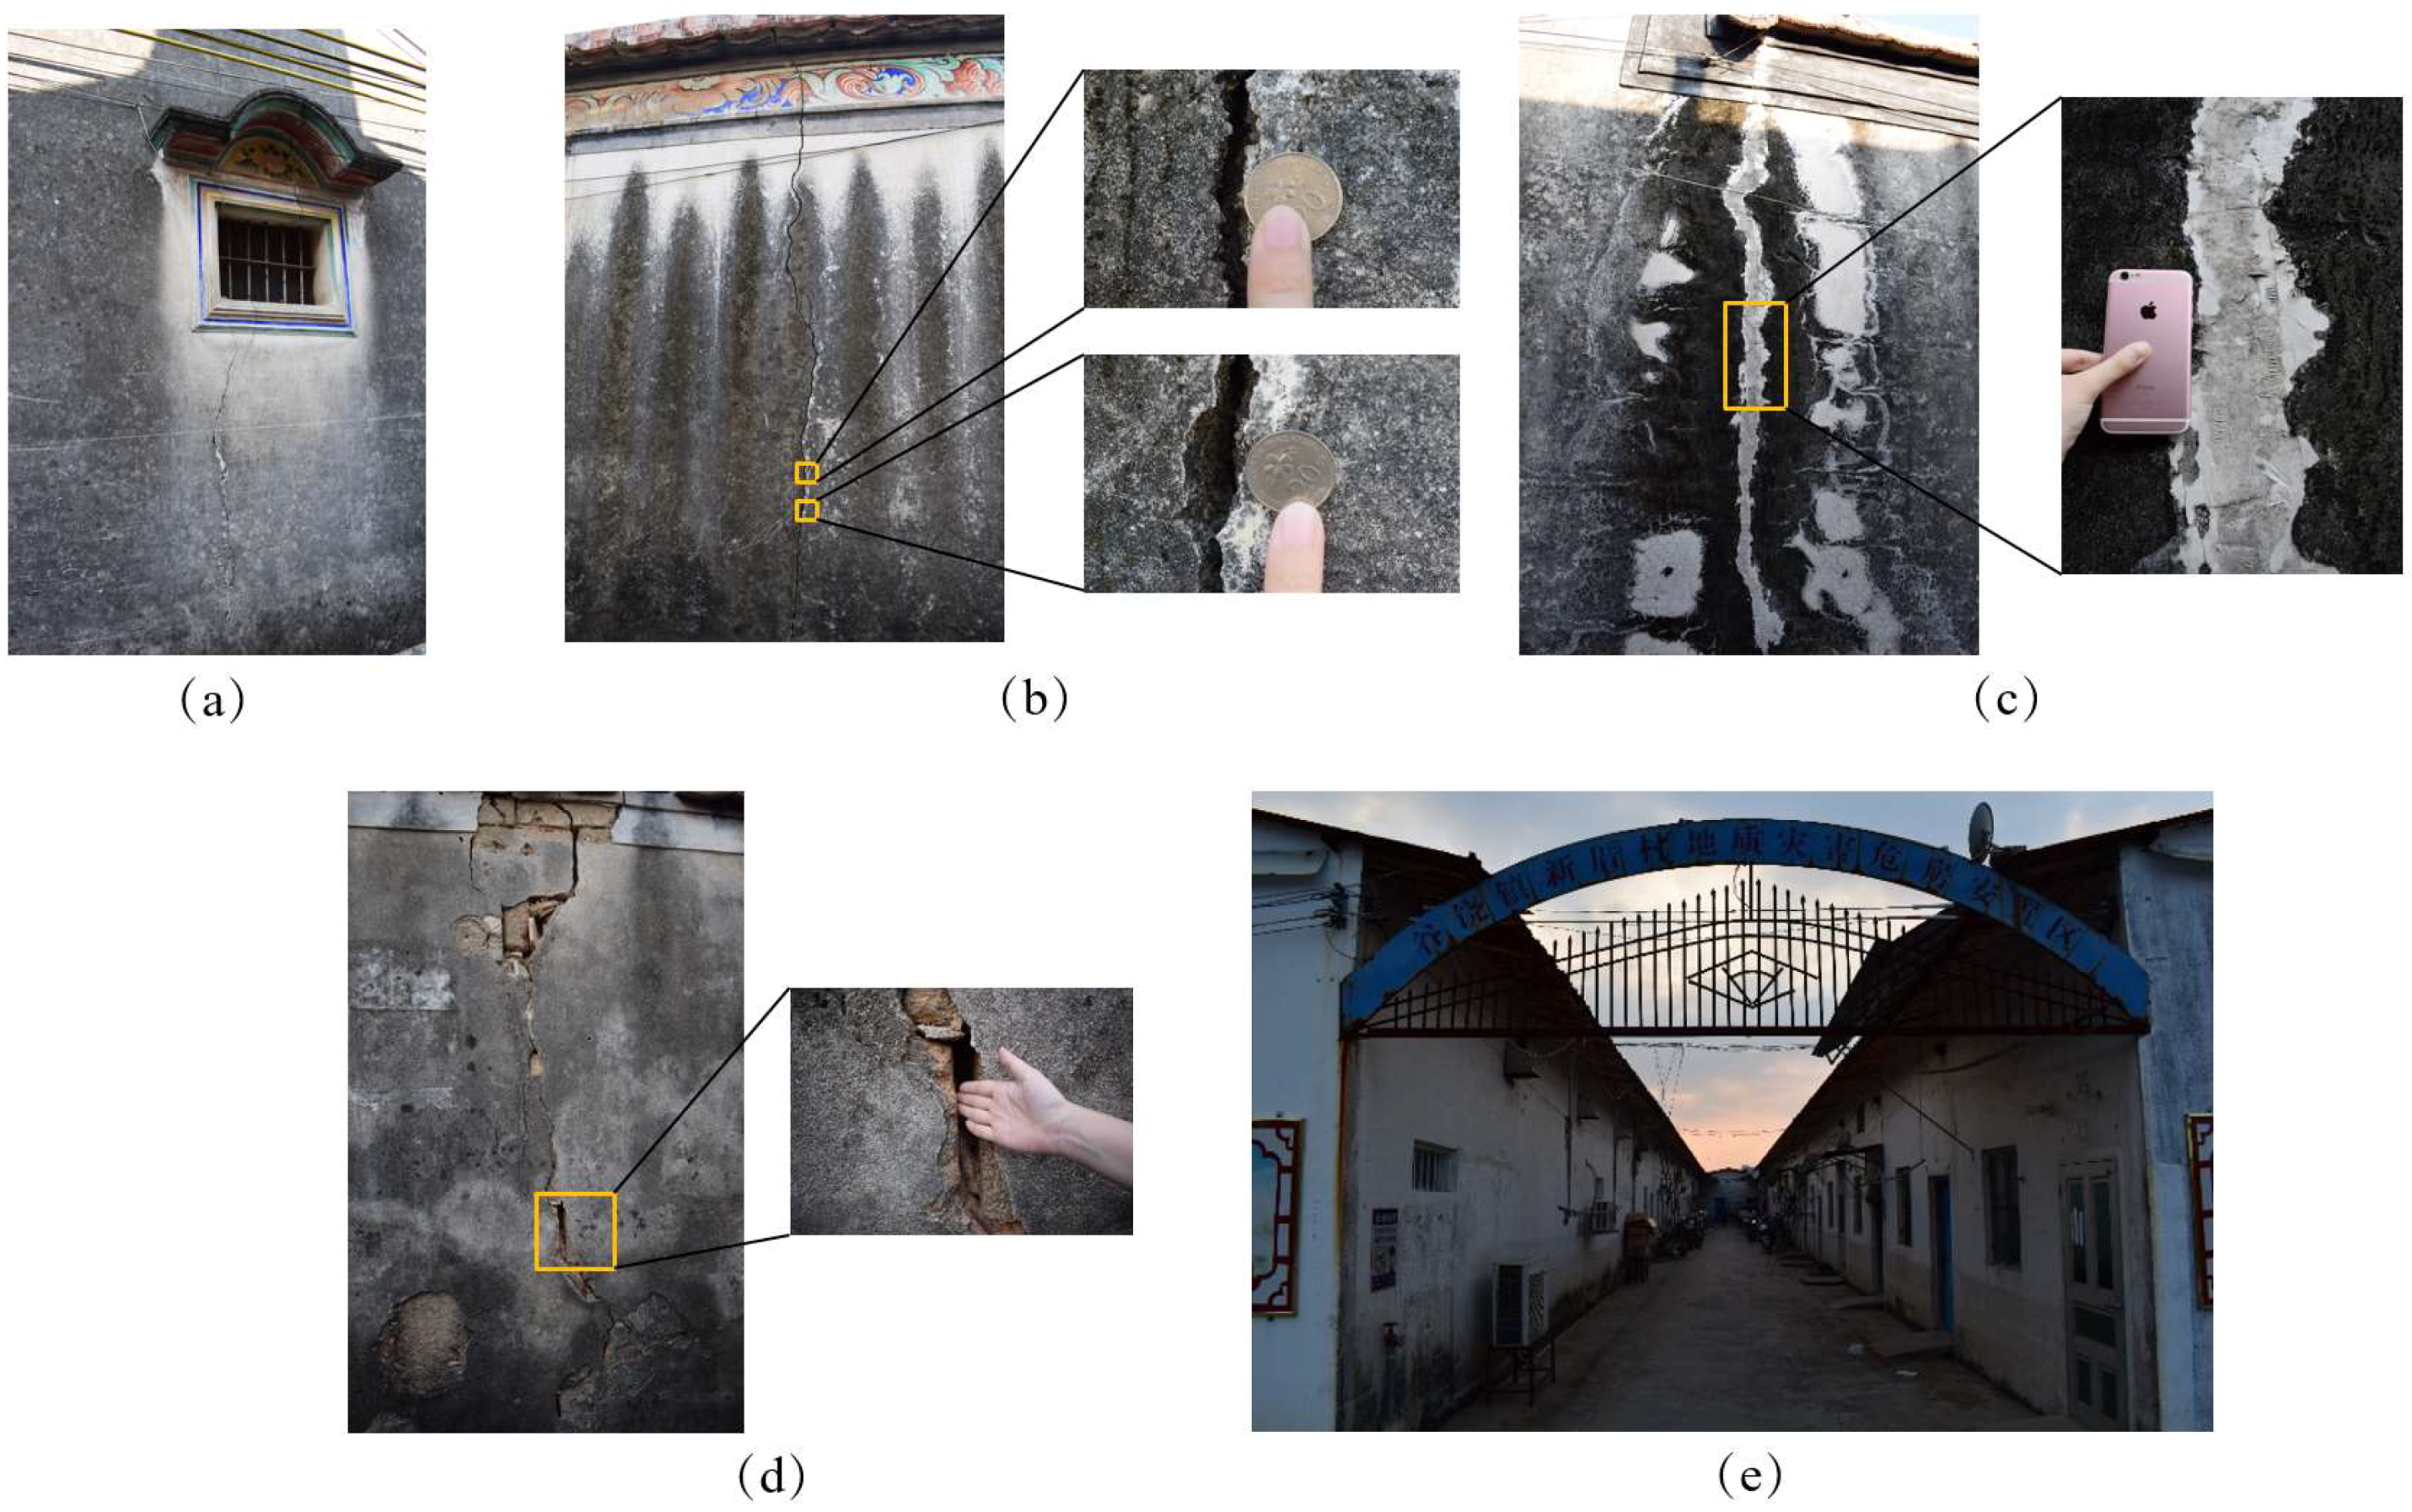
4.5. Consequences of Subsidence
5. Conclusions
Author Contributions
Funding
Acknowledgments
Conflicts of Interest
References
- Lin, Z. Study on the coordinated development of population, economy and nature in Guangdong. Econ. Trade 2016, 17, 99. (In Chinese) [Google Scholar]
- Zhang, M. Puning implemented two water improvements to solve the problem of drinking water in rural areas. China Water Resour. 2003, 7, 40–41. (In Chinese) [Google Scholar]
- Huang, H. Puning: Illegal sewage has been reduced, and the water quality of Lianjiang River has been better. Environment 2017, 8, 31–33. (In Chinese) [Google Scholar]
- Ferretti, A.; Prati, C.; Rocca, F. Permanent scatterers in SAR interferometry. IEEE Trans. Geosci. Remote Sens. 2001, 39, 8–20. [Google Scholar] [CrossRef]
- Zebker, H.; Shankar, P.; Hooper, A. InSAR Remote Sensing over Decorrelating Terrains: Persistent Scattering Methods. In Proceedings of the 2007 IEEE Radar Conference, Boston, MA, USA, 17–20 April 2007; pp. 717–722. [Google Scholar] [CrossRef]
- Berardino, P.; Fornaro, G.; Lanari, R.; Sansosti, E. A new algorithm for surface deformation monitoring based on small baseline differential SAR interferograms. IEEE Trans. Geosci. Remote Sens. 2002, 40, 2375–2383. [Google Scholar] [CrossRef]
- Lanari, R.; Mora Sacristan, Ó.; Manunta, M.; Mallorquí Franquet, J.J.; Berardino, P.; Sansoti, E. A small baseline DIFSAR approach for investigating deformations on full resolution SAR interferograms. IEEE Trans. Geosci. Remote Sens. 2004, 42, 1377–1386. [Google Scholar] [CrossRef]
- Ferretti, A.; Fumagalli, A.; Novali, F.; Prati, C.; Rocca, F.; Rucci, A. A new algorithm for processing interferometric data-stacks: SqueeSAR. IEEE Trans. Geosci. Remote Sens. 2011, 49, 3460–3470. [Google Scholar] [CrossRef]
- Bürgmann, R.; Hilley, G.; Ferretti, A.; Novali, F. Resolving vertical tectonics in the San Francisco Bay Area from permanent scatterer InSAR and GPS analysis. Geology 2006, 34, 221–224. [Google Scholar] [CrossRef]
- Törnqvist, T.E.; Wallace, D.J.; Storms, J.E.; Wallinga, J.; Van Dam, R.L.; Blaauw, M.; Derksen, M.S.; Klerks, C.J.; Meijneken, C.; Snijders, E.M. Mississippi Delta subsidence primarily caused by compaction of Holocene strata. Nat. Geosci. 2008, 1, 173. [Google Scholar] [CrossRef]
- Cabral-Cano, E.; Dixon, T.H.; Miralles-Wilhelm, F.; Díaz-Molina, O.; Sánchez-Zamora, O.; Carande, R.E. Space geodetic imaging of rapid ground subsidence in Mexico City. Geol. Soc. Am. Bull. 2008, 120, 1556–1566. [Google Scholar] [CrossRef]
- Teatini, P.; Tosi, L.; Strozzi, T. Quantitative evidence that compaction of Holocene sediments drives the present land subsidence of the Po Delta, Italy. J. Geophys. Res. Solid Earth 2011, 116. [Google Scholar] [CrossRef]
- Aly, M.H.; Klein, A.G.; Zebker, H.A.; Giardino, J.R. Land subsidence in the Nile Delta of Egypt observed by persistent scatterer interferometry. Remote Sens. Lett. 2012, 3, 621–630. [Google Scholar] [CrossRef]
- Chaussard, E.; Amelung, F.; Abidin, H.; Hong, S.-H. Sinking cities in Indonesia: ALOS PALSAR detects rapid subsidence due to groundwater and gas extraction. Remote Sens. Environ. 2013, 128, 150–161. [Google Scholar] [CrossRef]
- Higgins, S.A.; Overeem, I.; Steckler, M.S.; Syvitski, J.P.; Seeber, L.; Akhter, S.H. InSAR measurements of compaction and subsidence in the Ganges-Brahmaputra Delta, Bangladesh. J. Geophys. Res. Earth Surf. 2014, 119, 1768–1781. [Google Scholar] [CrossRef]
- Minderhoud, P.; Erkens, G.; Pham, V.; Bui, V.T.; Erban, L.; Kooi, H.; Stouthamer, E. Impacts of 25 years of groundwater extraction on subsidence in the Mekong delta, Vietnam. Environ. Res. Lett. 2017, 12, 064006. [Google Scholar] [CrossRef]
- Du, Z.; Ge, L.; Li, X.; Ng, A.H.-M. Subsidence monitoring over the Southern Coalfield, Australia using both L-Band and C-Band SAR time series analysis. Remote Sens. 2016, 8, 543. [Google Scholar] [CrossRef]
- Chen, M.; Tomás, R.; Li, Z.; Motagh, M.; Li, T.; Hu, L.; Gong, H.; Li, X.; Yu, J.; Gong, X. Imaging land subsidence induced by groundwater extraction in Beijing (China) using satellite radar interferometry. Remote Sens. 2016, 8, 468. [Google Scholar] [CrossRef]
- Jiang, Y.; Liao, M.; Wang, H.; Zhang, L.; Balz, T. Deformation monitoring and analysis of the geological environment of Pudong international airport with persistent scatterer SAR interferometry. Remote Sens. 2016, 8, 1021. [Google Scholar] [CrossRef]
- Yang, M.; Yang, T.; Zhang, L.; Lin, J.; Qin, X.; Liao, M. Spatio-Temporal Characterization of a Reclamation Settlement in the Shanghai Coastal Area with Time Series Analyses of X-, C-, and L-Band SAR Datasets. Remote Sens. 2018, 10, 329. [Google Scholar] [CrossRef]
- Jiang, L.; Lin, H.; Cheng, S. Monitoring and assessing reclamation settlement in coastal areas with advanced InSAR techniques: Macao city (China) case study. Int. J. Remote Sens. 2011, 32, 3565–3588. [Google Scholar] [CrossRef]
- Chen, F.; Wu, Y.; Zhang, Y.; Parcharidis, I.; Ma, P.; Xiao, R.; Xu, J.; Zhou, W.; Tang, P.; Foumelis, M. Surface motion and structural instability monitoring of ming dynasty city walls by two-step tomo-psinsar approach in Nanjing city, China. Remote Sens. 2017, 9, 371. [Google Scholar] [CrossRef]
- Tang, P.; Chen, F.; Zhu, X.; Zhou, W. Monitoring cultural heritage sites with advanced multi-temporal InSAR technique: The case study of the Summer Palace. Remote Sens. 2016, 8, 432. [Google Scholar] [CrossRef]
- Tapete, D.; Fanti, R.; Cecchi, R.; Petrangeli, P.; Casagli, N. Satellite radar interferometry for monitoring and early-stage warning of structural instability in archaeological sites. J. Geophys. Eng. 2012, 9, S10. [Google Scholar] [CrossRef]
- Yi, S.; Liang, C. Geological Hazards and Prevention in Guangdong; Science Press: Beijing, China, 2010. (In Chinese) [Google Scholar]
- Cai, Y.; Chen, J.; Zhong, L.; Wang, L. Water pollution in Lianjiang River Basin and countermeasures for prevention and control. Pearl River 2003, 6, 47–50. (In Chinese) [Google Scholar]
- Mo, W. Researching of Traditional Villages and Houses of Chaoshan area Basing on the Cultural Geography. Master’s Thesis, South China University of Technology, Guangzhou, China, 2017. (In Chinese). [Google Scholar]
- Hanssen, R.F. Radar Interferometry: Data Interpretation and Error Analysis; Springer Science & Business Media: Berlin, Germany, 2001; Volume 2. [Google Scholar]
- Ma, P.; Lin, H. Robust detection of single and double persistent scatterers in urban built environments. IEEE Trans. Geosci. Remote Sens. 2016, 54, 2124–2139. [Google Scholar] [CrossRef]
- Stephens, M.A. Use of the Kolmogorov-Smirnov, Cramér-Von Mises and related statistics without extensive tables. J. R. Stat. Soc. Ser. B 1970, 115–122. [Google Scholar] [CrossRef]
- Costello, J.; de Geus, A.; Goering, R.; Hanover, A.; Rhines, W.; Smith, G. Panel: The Eda Year in Review: Ceo’s, the Press, and users. IEEE Trans. Microw. Theory Tech. 1994, 42, 1750–1758. [Google Scholar]
- Kvam, P.H.; Vidakovic, B. Nonparametric Statistics with Applications to Science and Engineering; John Wiley & Sons: Hoboken, NJ, USA, 2007; Volume 653. [Google Scholar]
- Guarnieri, A.M.; Tebaldini, S. On the exploitation of target statistics for SAR interferometry applications. IEEE Trans. Geosci. Remote Sens. 2008, 46, 3436–3443. [Google Scholar] [CrossRef]
- Bell, J.W.; Amelung, F.; Ferretti, A.; Bianchi, M.; Novali, F. Permanent scatterer InSAR reveals seasonal and long-term aquifer-system response to groundwater pumping and artificial recharge. Water Resour. Res. 2008, 44. [Google Scholar] [CrossRef]
- Sina News. Cracking and Collapse of Houses in Some Towns of Guangdong Province Due to Groundwater Pumping. Available online: http://news.sina.com.cn/c/2015-04-28/100031770323.shtml (accessed on 9 January 2019). (In Chinese).
- Chen, X. Consolidation effect of soft soil in interactive marine and terrestrial deposit. Chin. J. Geotech. Eng. 2011, 33, 520. (In Chinese) [Google Scholar]
- Song, Y.; Chen, W.; Pan, H.; Zhang, Z.; He, Z.; Cheng, X.; Zeng, Q.; Yu, Y.; Zhang, J. Geological age of Quaternary series in Lianjiang Plain. J. Jilin Univ. 2012, 42, 154–161. (In Chinese) [Google Scholar]
- Sun, J.; Xu, H.; Wu, P.; Wu, Y.; Qiu, X.; Zhan, W. Late Quaternary sedimentological characteristics and sedimentary environment evolution in sea area between Nan’ao and Chenghai, eastern Guangdong. J. Trop. Oceanogr. 2007, 26, 30–36. (In Chinese) [Google Scholar]
- Chaussard, E.; Wdowinski, S.; Cabral-Cano, E.; Amelung, F. Land subsidence in central Mexico detected by ALOS InSAR time-series. Remote Sens. Environ. 2014, 140, 94–106. [Google Scholar] [CrossRef]
- Ding, X.; Chen, Y.; Wang, Y. The relationship between fracture activity and earhquake in Quanzhou-Santou seismic belt since late Pleistocene. Taiwan Strait 1983, 2, 009. (In Chinese) [Google Scholar]
- Amelung, F.; Galloway, D.L.; Bell, J.W.; Zebker, H.A.; Laczniak, R.J. Sensing the ups and downs of Las Vegas: InSAR reveals structural control of land subsidence and aquifer-system deformation. Geology 1999, 27, 483–486. [Google Scholar] [CrossRef]
- Ferretti, A.; Novali, F.; Bürgmann, R.; Hilley, G.; Prati, C. InSAR permanent scatterer analysis reveals ups and downs in San Francisco Bay area. Eos Trans. Am. Geophys. Union 2004, 85, 317–324. [Google Scholar] [CrossRef]


| Product Type: Single Look Complex (SLC) | Absolute Orbit: 14885 | ||||||||
| Mode: IW | Path/Frame: 113/68 | ||||||||
| Polarization: VV | Incidence Angle: 43.94° | ||||||||
| No. | Date | Time | No. | Date | Time | No. | Date | Time | |
| 1 | 20151113 | 10:25:02 | 19 | 20160920 | 10:25:09 | 37 | 20170424 | 10:25:21 | |
| 2 | 20151125 | 10:25:02 | 20 | 20161002 | 10:25:09 | 38 | 20170506 | 10:25:22 | |
| 3 | 20151219 | 10:25:01 | 21 | 20161014 | 10:25:09 | 39 | 20170518 | 10:25:22 | |
| 4 | 20151231 | 10:25:01 | 22 | 20161026 | 10:25:09 | 40 | 20170530 | 10:25:23 | |
| 5 | 20160112 | 10:25:00 | 23 | 20161107 | 10:25:09 | 41 | 20160611 | 10:25:24 | |
| 6 | 20160124 | 10:25:00 | 24 | 20161119 | 10:25:09 | 42 | 20170623 | 10:25:24 | |
| 7 | 20160205 | 10:25:00 | 25 | 20161201 | 10:25:09 | 43 | 20170705 | 10:25:25 | |
| 8 | 20160217 | 10:25:00 | 26 | 20161213 | 10:25:08 | 44 | 20170717 | 10:25:26 | |
| 9 | 20160312 | 10:25:00 | 27 | 20161225 | 10:25:08 | 45 | 20170729 | 10:25:26 | |
| 10 | 20160324 | 10:25:00 | 28 | 20170106 | 10:25:06 | 46 | 20170810 | 10:25:27 | |
| 11 | 20160405 | 10:25:01 | 29 | 20170118 | 10:25:06 | 47 | 20170822 | 10:25:27 | |
| 12 | 20160429 | 10:25:02 | 30 | 20170130 | 10:25:06 | 48 | 20170903 | 10:25:28 | |
| 13 | 20160511 | 10:25:02 | 31 | 20170211 | 10:25:06 | 49 | 20170915 | 10:25:28 | |
| 14 | 20160523 | 10:25:03 | 32 | 20170223 | 10:25:05 | 50 | 20170927 | 10:25:29 | |
| 15 | 20160722 | 10:25:06 | 33 | 20170307 | 10:25:05 | 51 | 20171009 | 10:25:29 | |
| 16 | 20160803 | 10:25:07 | 34 | 20170319 | 10:25:19 | 52 | 20171021 | 10:25:29 | |
| 17 | 20160815 | 10:25:08 | 35 | 20170331 | 10:25:20 | 53 | 20171102 | 10:25:29 | |
| 18 | 20160827 | 10:25:08 | 36 | 20170412 | 10:25:20 | 54 | 20171114 | 10:25:29 | |
| Product Type: Single Look Complex (SLC) | Absolute Orbit: 14987 | ||||||||
| Mode: IW | Path/Frame: 40/69 | ||||||||
| Polarization: VV | Incidence Angle: 34.03° | ||||||||
| No. | Date | Time | No. | Date | Time | No. | Date | Time | |
| 1 | 20160927 | 10:17:10 | 11 | 20170712 | 10:17:14 | 21 | 20171121 | 10:17:15 | |
| 2 | 20170314 | 10:17:09 | 12 | 20170724 | 10:17:12 | 22 | 20171203 | 10:17:15 | |
| 3 | 20170326 | 10:17:09 | 13 | 20170805 | 10:17:13 | 23 | 20171215 | 10:17:14 | |
| 4 | 20170407 | 10:17:09 | 14 | 20170817 | 10:17:14 | 24 | 20171227 | 10:17:14 | |
| 5 | 20170419 | 10:17:10 | 15 | 20170829 | 10:17:14 | 25 | 20180108 | 10:17:13 | |
| 6 | 20170501 | 10:17:10 | 16 | 20170910 | 10:17:15 | 26 | 20180120 | 10:17:13 | |
| 7 | 20170513 | 10:17:11 | 17 | 20171004 | 10:17:15 | 27 | 20180201 | 10:17:12 | |
| 8 | 20170525 | 10:17:11 | 18 | 20171016 | 10:17:15 | 28 | 20180213 | 10:17:12 | |
| 9 | 20170606 | 10:17:12 | 19 | 20171028 | 10:17:16 | 29 | 20180225 | 10:17:12 | |
| 10 | 20170630 | 10:17:14 | 20 | 20171109 | 10:17:15 | --- | --- | --- | |
| Dataset | Method | Number of MPs | Density of MPs (MPs/km2) | Min Value (mm/year) | Max Value (mm/year) | Mean Value (mm/year) |
|---|---|---|---|---|---|---|
| I | PS | 88,748 | 58.66 | −139.9 | 37.8 | −3.1 |
| I | DS | 469,625 | 310.39 | −133.7 | 38.1 | −2.0 |
| II | PS | 143,351 | 58.20 | −133.3 | 15.8 | −8.04 |
| II | DS | 854,004 | 346.73 | −132.3 | 19.8 | −8.37 |
| Extent | West | West-Central | South-East | North | |
|---|---|---|---|---|---|
| Lithology | Layer④ | clay | clay | clay | fine sand |
| silt | silt | silt | clay | ||
| medium coarse sand | sandy clay | medium coarse sand | silt | ||
| gravel-bearing medium-coarse sand | gravel-bearing medium-coarse sand | gravel-bearing medium-coarse sand | |||
| Layer③ | clay | clay | clay | clay | |
| Sandy clay | piebald clay | medium coarse sand | medium coarse sand | ||
| gravel-bearing medium-coarse sand | gravel-bearing medium-coarse sand | gravel-bearing medium-coarse sand | gravel-bearing medium-coarse sand | ||
| sandy clay | silt | fine sand | |||
| fine sand | piebald clay | ||||
| sandy clay | |||||
| Layer② | —— | piebald clay | —— | —— | |
| medium-coarse sand | |||||
| clay | |||||
| gravel-bearing medium-coarse sand | |||||
| Layer① | granite | granite | granite | granite | |
| Thickness of Quaternary series | 69 m | >140 m | 30–50 m | >95 m | |
© 2019 by the authors. Licensee MDPI, Basel, Switzerland. This article is an open access article distributed under the terms and conditions of the Creative Commons Attribution (CC BY) license (http://creativecommons.org/licenses/by/4.0/).
Share and Cite
Liu, Y.; Ma, P.; Lin, H.; Wang, W.; Shi, G. Distributed Scatterer InSAR Reveals Surface Motion of the Ancient Chaoshan Residence Cluster in the Lianjiang Plain, China. Remote Sens. 2019, 11, 166. https://doi.org/10.3390/rs11020166
Liu Y, Ma P, Lin H, Wang W, Shi G. Distributed Scatterer InSAR Reveals Surface Motion of the Ancient Chaoshan Residence Cluster in the Lianjiang Plain, China. Remote Sensing. 2019; 11(2):166. https://doi.org/10.3390/rs11020166
Chicago/Turabian StyleLiu, Yuzhou, Peifeng Ma, Hui Lin, Weixi Wang, and Guoqiang Shi. 2019. "Distributed Scatterer InSAR Reveals Surface Motion of the Ancient Chaoshan Residence Cluster in the Lianjiang Plain, China" Remote Sensing 11, no. 2: 166. https://doi.org/10.3390/rs11020166
APA StyleLiu, Y., Ma, P., Lin, H., Wang, W., & Shi, G. (2019). Distributed Scatterer InSAR Reveals Surface Motion of the Ancient Chaoshan Residence Cluster in the Lianjiang Plain, China. Remote Sensing, 11(2), 166. https://doi.org/10.3390/rs11020166