Article

Impacts of AOD Correction and Spatial Scale on the Correlation between High-Resolution AOD from Gaofen-1 Satellite and In Situ PM2.5 Measurements in Shenzhen City, China

1
Key Laboratory for Urban Habitat Environmental Science and Technology, School of Urban Planning and Design, Peking University, Shenzhen 518055, China
2
Laboratory for Earth Surface Processes, Ministry of Education, College of Urban and Environmental Sciences, Peking University, Beijing 100871, China
3
Department of Environmental Science and Engineering, Fudan University, Shanghai 200433, China
4
School of Geosciences, University of Edinburgh, Edinburgh EH9 3FF, UK
*
Author to whom correspondence should be addressed.
Remote Sens. 2019, 11(19), 2223; https://doi.org/10.3390/rs11192223
Submission received: 4 June 2019 / Revised: 10 September 2019 / Accepted: 13 September 2019 / Published: 24 September 2019

Abstract

:
Satellite-derived aerosol optical depth (AOD) is widely used to estimate surface PM2.5 concentrations. Most AOD products have relatively low spatial resolutions (i.e., ≥1 km). Consequently, insufficient research exists on the relationship between high-resolution (i.e., <1 km) AOD and PM2.5 concentrations. Taking Shenzhen City, China as the study area, we derived AOD at the 16-m spatial resolution for the period 2015–2017 based on Gaofen-1 (GF-1) satellite images and the Dark Target (DT) algorithm. Then, we extracted AOD at spatial scales ranging from 40 m to 5000 m and applied vertical and humidity corrections. We analyzed the correlation between AOD and PM2.5 concentrations, and the impacts of AOD correction and spatial scale on the correlation. It was found that the DT-derived GF-1 AOD at different spatial scales had statistically significant correlations with surface PM2.5 concentrations, and the AOD corrections strengthened the correlations. The correlation coefficients (R) between AOD at different spatial scales and PM2.5 concentrations were 0.234–0.329 and 0.340–0.423 before and after AOD corrections, respectively. In spring, summer, autumn, and winter, PM2.5 concentrations had the best correlations with humidity-corrected AOD, uncorrected AOD, vertical and humidity-corrected AOD, and uncorrected AOD, respectively, indicating a distinct seasonal variation of the aerosol characteristics. At spatial scales of 1–5 km, AOD at finer spatial scales generally had higher correlations with PM2.5 concentrations. However, at spatial scales <1 km, the correlations fluctuated irregularly, which could be attributed to scale mismatches between AOD and PM2.5 measurements. Thus, 1 km appears to be the optimum spatial scale for DT-derived AOD to maximize the correlation with PM2.5 concentrations. It is also recommended to aggregate very high-resolution DT-derived AOD to an appropriate medium resolution (e.g., 1 km) before matching them with in situ PM2.5 measurements in regional air pollution studies.

Graphical Abstract

1. Introduction

Fine particulate matter, or more specifically, particulate matter with an aerodynamic equivalent diameter less than 2.5 µm (PM2.5), is a key air pollutant. PM2.5 is associated with numerous adverse effects on people’s health, such as respiratory diseases [1], cardiovascular diseases [2,3], and increased mortality from lung cancer [4,5]. PM2.5 pollution also can lead to visibility degradation [6] and reduction in agricultural production [7]. Moreover, it can affect the urban ecosystem significantly because of its influences on the nutrient balance and acidity of soil [8,9], radiation balance [10,11], and ground temperature [12], etc. Therefore, there is widespread concern in academia and society about PM2.5 pollution. China is among the countries that suffer the severest PM2.5 pollution. In 2010, the deaths of approximately 1.2 million residents in the country were related to PM2.5 pollution [13]. To improve air quality, China has adopted a series of PM2.5 prevention and control measures in recent years. For example, air monitoring stations have been established in all 338 prefecture-level cities in China, providing real-time PM2.5 measurement data. However, the spatial distribution of the stations is nonuniform, and the spatial coverage is limited. To address this limitation, aerosol optical depth (AOD) derived from satellite remote sensing is widely used to estimate regional surface PM2.5 concentrations and atmospheric pollution conditions [14,15].
AOD is defined as the integral of the extinction coefficient of the atmospheric medium in the vertical direction, and describes the light attenuation by the aerosols. As one of the main AOD retrieving algorithms [16], the Dark Target (DT) algorithm was designed to retrieve AOD over densely vegetated areas directly from satellite imagery [17]. The DT algorithm has been applied to remotely-sensed data from the MODerate resolution Imaging Spectroradiometer (MODIS) sensors on board the Terra and Aqua satellites and the Visible Infrared Imaging Radiometer Suite (VIIRS) sensor on board the Suomi National Polar-orbiting Partnership satellite, so as to generate AOD products having various spatial resolutions (10, 3, and 1 km for MODIS [18,19,20,21], 6 and 0.75 km for VIIRS [22,23]). The AOD products have been widely used in aerosol and PM2.5 studies [24,25,26], among which many have found that AOD with a higher spatial resolution can achieve a higher correlation with AErosol RObotic NETwork (AERONET) measurements [27,28] and particle concentrations [29,30,31,32]. However, due to the relatively coarse resolutions (i.e., at kilometer scales) of these AOD products, it is still unclear whether the AOD–PM2.5 correlation can be further improved by adopting even higher resolution AOD data.
The DT algorithm has also been successfully applied to satellites that provide sub-kilometer resolution data, such as Systeme Probatoire d’Observation dela Tarre (SPOT) [33], China-Brazil Earth Resources Satellite-02B [34], Huanjing-1 [35], Gaofen-1 (GF-1) [36], and Landsat-8 [37]. Studies on the relationship between finer-resolution AOD data and PM2.5 concentrations can be beneficial for analyzing the relationship between sub-kilometer urban landscape pattern and air pollution [38], locating main PM2.5 emission sources [39,40], and building microscale PM2.5 estimation models in urban areas [41]. However, studies on the correlation between these fine-resolution AOD data and surface PM2.5 concentrations are limited, as is research on how the finer spatial scales of AOD influence the correlation between AOD and PM2.5 concentrations. Such studies can be conducted using the AOD data derived from GF-1, because GF-1 not only provides 16-m high-resolution images, but also has a four-day repetition cycle (without camera swinging), which is a higher temporal resolution than that of many other high-resolution satellites such as SPOT (26 days) and Landsat (16 days).
The correlation between AOD and PM2.5 concentrations is subject to changes in the atmospheric boundary layer height and the relative humidity. Using the synchronous aerosol scale height and relative humidity data, vertical and humidity corrections can be applied to AOD data to achieve better correlations between corrected AOD and PM2.5 concentrations [42,43]. However, owing to the differences in aerosol characteristics between different regions and phases, there is no universally optimal AOD correction strategy [44].
The present study chose Shenzhen City, China as the study area, and used the DT algorithm to retrieve local AOD data from the GF-1 satellite at 16-m spatial resolution from 2015 to 2017. Vertical and humidity corrections were applied to the retrieved AOD. The correlations between AOD and in situ PM2.5 measurements were analyzed at different AOD spatial scales. The study mainly focused on the following two scientific questions: (1) How well correlated were the GF-1 AOD retrieved by the DT algorithm and the in situ measured PM2.5 concentrations in Shenzhen City, and which correction method (if either) was more suitable to improve the correlation? And (2) Did the spatial scale of GF-1 AOD data influence their correlation with PM2.5 concentrations?
The rest of the paper is organized as follows. The study area, materials, and methods are introduced in Section 2. The results of the impacts of AOD correction and spatial scale on the AOD–PM2.5 correlation in this area are presented in Section 3. The underlying causes of the impacts and the limitations of this study are further analyzed and discussed in Section 4. Finally, the main conclusions arising from the results are given in Section 5.

2. Study Area, Materials, and Methods
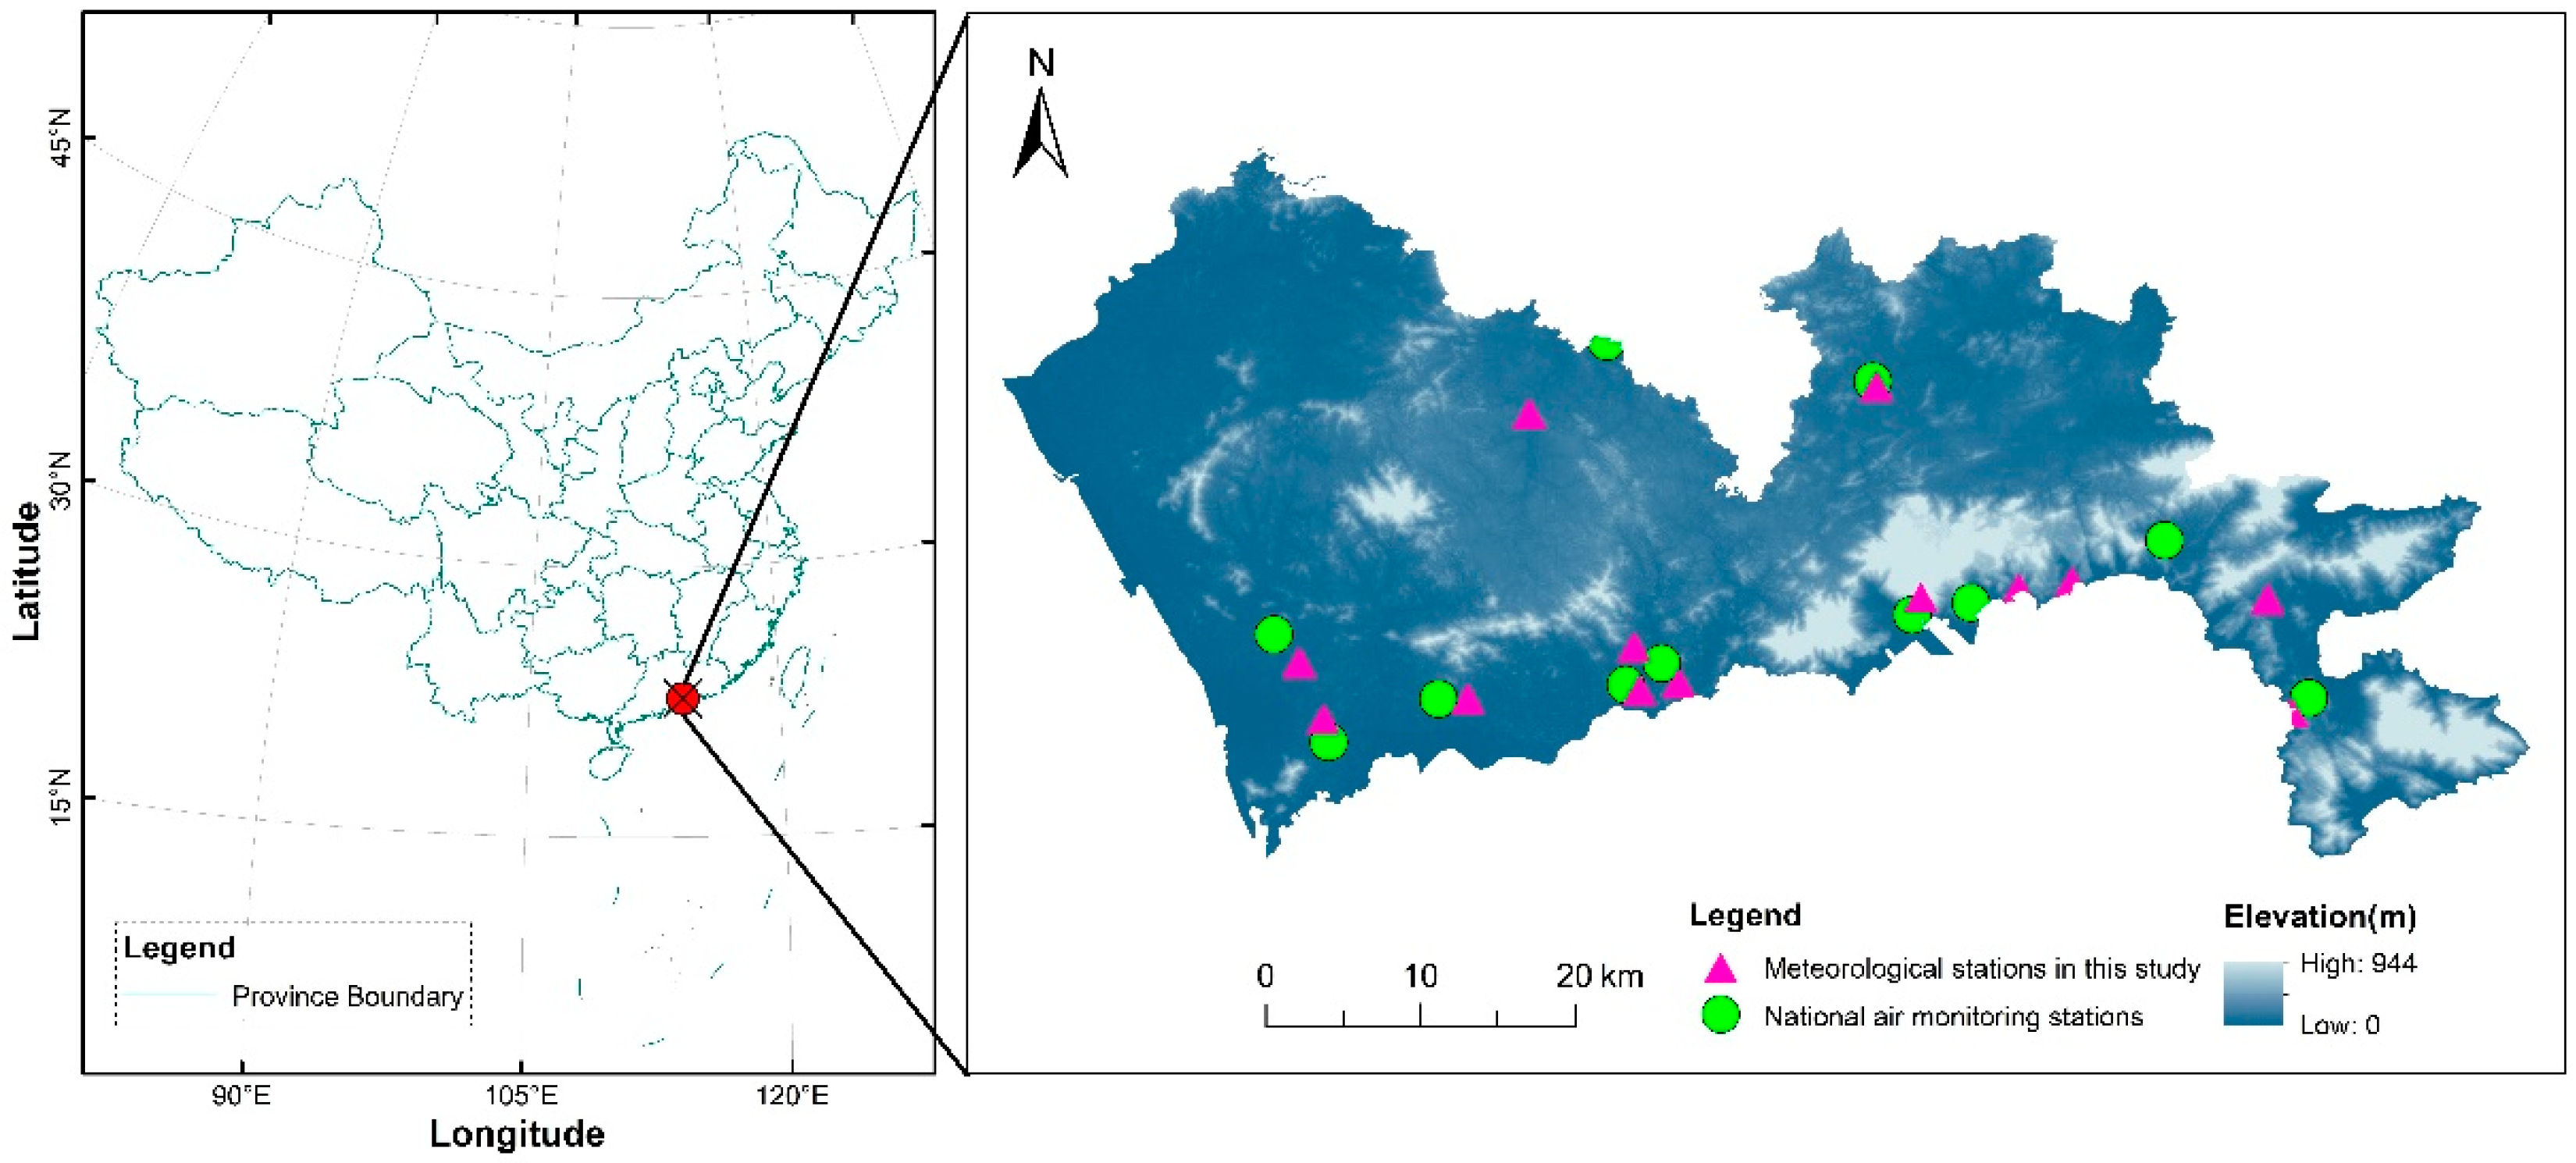
2.1. Study Area

Shenzhen City, China, was chosen as the study area. It has a land area of 1997 km2 and is located in the subtropical monsoon climate zone in southern China. More specifically, Shenzhen City is in the south of the Pearl River Delta (PRD), immediately north of Hong Kong, and is one of the most prosperous Chinese cities. We chose Shenzhen as the study area for the following three reasons. Firstly, Shenzhen City has the largest population density in mainland China (6234 people per km2 in 2017). Previous researches have shown that increased PM2.5 concentrations are associated with the increased likelihood of both outpatient and inpatient visits in Shenzhen’s hospitals [45]. Therefore, the control of PM2.5 pollution in Shenzhen City is particularly important, both because of its effects on human health and the number of people affected. Secondly, there are 11 national air monitoring stations in Shenzhen City; however, most of the stations are located in low-pollution areas such as parks and schools (Table S1). Data from these monitoring stations are thus unrepresentative of the overall PM2.5 pollution in the whole city. Thirdly, there have been few reported studies on the AOD–PM2.5 correlation in Shenzhen City, or on the impacts of AOD corrections either in Shenzhen City or on the GF-1 AOD retrieval in the subtropical monsoon climate zone generally.

2.2. Materials

2.2.1. Remote Sensing Data from the GF-1 Satellite

GF-1 is a Chinese high-resolution remote sensing satellite that was launched and put into use in 2013. It is configured with a four 16-m multi-spectral wide field view (WFV) camera sets. There are four bands on WFV imagers: blue (0.45–0.52 μm), green (0.52–0.59 μm), red (0.63–0.69 μm), and near infrared (0.77–0.89 μm). The WFV data collected in Shenzhen City from 2015 to 2017 on days with little cloud cover (<5%) were used, which were downloaded from www.rscloudmart.com. The radiometric calibration data and the mean solar exoatmospheric irradiances for each band were obtained from China’s Centre for Resources Satellite Data and Application (http://www.cresda.com/). A total of 25 qualified GF-1 images were obtained for the study period (Table S2).

2.2.2. In Situ PM2.5 Measurement Data

PM2.5 concentration data of the 11 national air monitoring stations in Shenzhen City were obtained from the website of the China National Environmental Monitoring Center (http://106.37.208.233:20035/). The mass of particulate matter is automatically measured by the “Tapered Element Oscillating Microbalance” or “β-ray” methods in the stations and uploaded to the website. GF-1 passes Shenzhen City between 11:00 and 12:00 local time (03:00–04:00 UTC). Therefore, the mean value of in situ measured PM2.5 concentrations between 11:00 and 12:00 local time on satellite passing dates were used to match the satellite derived AOD data. Some GF-1 images did not include all 11 air monitoring stations in Shenzhen City. A total of 253 in situ PM2.5 measurement data were used for analyzing the correlation with GF-1 AOD.

2.2.3. Meteorological Station Data

Station-observed relative humidity data for correcting AOD data were obtained from the website of the Shenzhen Meteorological Bureau (http://www.szmb.gov.cn/). These data were obtained from 13 meteorological stations nearest to the air monitoring stations. Two additional meteorological stations were selected (compared to the number of air monitoring stations) because some of the meteorological stations lacked humidity data in some periods. The relative humidity data records closest to the imaging time of GF-1 were used. Figure 1 shows the locations of air monitoring stations and meteorological stations in this study in Shenzhen City.

2.2.4. Planet Boundary Layer Height Data

Planet boundary layer height (PBLH) data for AOD vertical correction were obtained from the Goddard Earth Observing System Forward Processing model (http://geoschemdata.computecanada.ca/) of the United States government’s National Aeronautics and Space Administration. These data have a spatial resolution of 0.25° × 0.3125° in China and a temporal resolution of 1 h. The PBLH dataset at 11:30 local time on the acquisition days of GF-1 images was extracted, and the mean PBLH across Shenzhen City at those times was calculated.

2.2.5. Terra MODIS 3-km DT AOD Data

We obtained the Terra MODIS 3-km Dark Target (DT) AOD products (MOD04_3K) from the Goddard Space Flight Center (https://ladsweb.modaps.eosdis.nasa.gov/). We extracted the AOD at 550 nm over land with the quality assurance flag equaling three (i.e., QA = 3) on the acquisition days of GF-1 images in Shenzhen City. The MOD04_3K data were used for the comparison and validation of GF-1 AOD.

2.3. Methods

2.3.1. GF-1 AOD Retrieval and Validation

Due to the low albedo of dense vegetation measured in the red and blue spectral bands [16], the corresponding pixels are called dark pixels, to which the DT algorithm is applicable. For the surface albedo of the dark pixels, linear relationships exist between the red (and blue) bands and the short-wave infrared (SWIR) band [46]; furthermore, the SWIR radiation is hardly affected by aerosols. Using this linear relationship, the DT algorithm removes the contribution of surface albedo from the apparent albedo of red and blue bands to obtain the aerosol characteristics. Shenzhen City has high vegetation and forest coverage (e.g., 50.1% and 40.9% in 2016, respectively), and the forests are mainly evergreen and broad-leaved, indicating the feasibility of using the DT algorithm to retrieve AOD over vegetated areas throughout the year.
Regardless of the absence of the SWIR band on GF-1 images, AOD retrieval can still be accomplished using the linear relationship between the surface albedo of red and blue bands. We employed a modified DT algorithm applicable to satellites without the SWIR band, which was described in previously published studies [34,36,47]. In this study, we used the “6S model” [48] to perform the AOD retrieval. Due to the lack of AERONET observation sites in the study area, the MOD04_3K AOD product were used to validate our retrievals. First of all, we aggregated the GF-1 AOD into 3-km grids that contained valid MOD04_3K AOD data. Then, we calculated the correlations between the aggregated GF-1 AOD and the matched MOD04_3K AOD for each date that had both types of AOD data and for the whole study period [36].

2.3.2. Extraction of AOD at Different Spatial Scales

We built buffers with radii in 20-m increments ranging from 40 to 5000 m around the 11 national air monitoring stations. We obtained the uncorrected AOD (O_AOD) value for each buffer by averaging the valid AOD values of all enclosed dark pixels within the buffer [29]. Different buffer sizes corresponded to different spatial scales at which the AOD was analyzed. For example, AOD at the 40-m spatial scale were obtained by averaging the AOD values of the dark pixels within 40-m buffers around the stations. When the spatial scale was too small, the dark pixels around some stations were insufficient in number or difficult to recognize. As a result, the corresponding AOD data could not be extracted and were omitted.

2.3.3. Vertical and Humidity Corrections of AOD

AOD is the integral of light extinction by aerosols in the atmospheric column above the Earth’s surface, reflecting the aerosol characteristics within the atmospheric column. However, PM2.5 concentrations are measured at the ground surface. To obtain the near-surface extinction properties of aerosols, the traditional method assumes that the aerosol is uniformly distributed throughout the height of the atmospheric boundary layer (PBLH), and therefore, the near-surface extinction coefficient ( k a , 0 ) can be obtained using Equation (1) [42,43,44]:
k a , 0 = O _ A O D P B L H
The measured PM2.5 concentration is the mass concentration of dry particulate matter. However, the aerosol is hygroscopic, and its extinction coefficient increases as the relative humidity increases [49]. Thus, the purpose of humidity correction is to eliminate the influence of aerosol’s hygroscopicity on AOD values. The increase of the extinction coefficient is determined by the growth factor f ( R H ) , which is represented as following:
f ( R H ) = ( 1 R H 100 ) g
where RH is the relative humidity and g is an empirical coefficient. Consistent with previous studies [50,51], g = 1 was adopted in this study. Hence, the “dry” AOD (AOD*) after eliminating the hygroscopic effect can be obtained using Equation (3):
A O D * = O _ A O D f ( R H )
When both vertical and humidity corrections are performed on AOD, the “dry” near-surface extinction coefficient ( k a , 0 * ) can be obtained using Equation (4):
k a , 0 * = O _ A O D P B L H · f ( R H )

3. Results

3.1. Descriptive Statistics

The statistical descriptions of the PM2.5 concentrations, PBLH, and relative humidity data used in the study are shown in Table 1. To explore the seasonal characteristics of the data, in addition to the analysis of the full dataset, we also split the data into four seasonal groups according to their acquisition time, i.e., spring (March–May), summer (June–August), autumn (September–November) and winter (December–February), and calculated the corresponding statistics. To better reveal the distribution of the data, kurtosis and skewness were computed in addition to the mean and standard deviation (S.D.).
During the study period, the PM2.5 concentrations in the winter were significantly (p < 0.0001) higher than those in spring, summer, and autumn. Besides, the winter PM2.5 concentrations showed high right-skewness and kurtosis, suggesting a number of extremely high values in the dataset. PBLH also showed distinct characteristics of seasonal variation, with the highest mean value and the smallest standard deviation in summer, and the lowest mean value and the largest standard deviation in winter. During the study period, the relative humidity in Shenzhen City was higher in summer and autumn with lower standard deviations, compared with those in winter and spring.

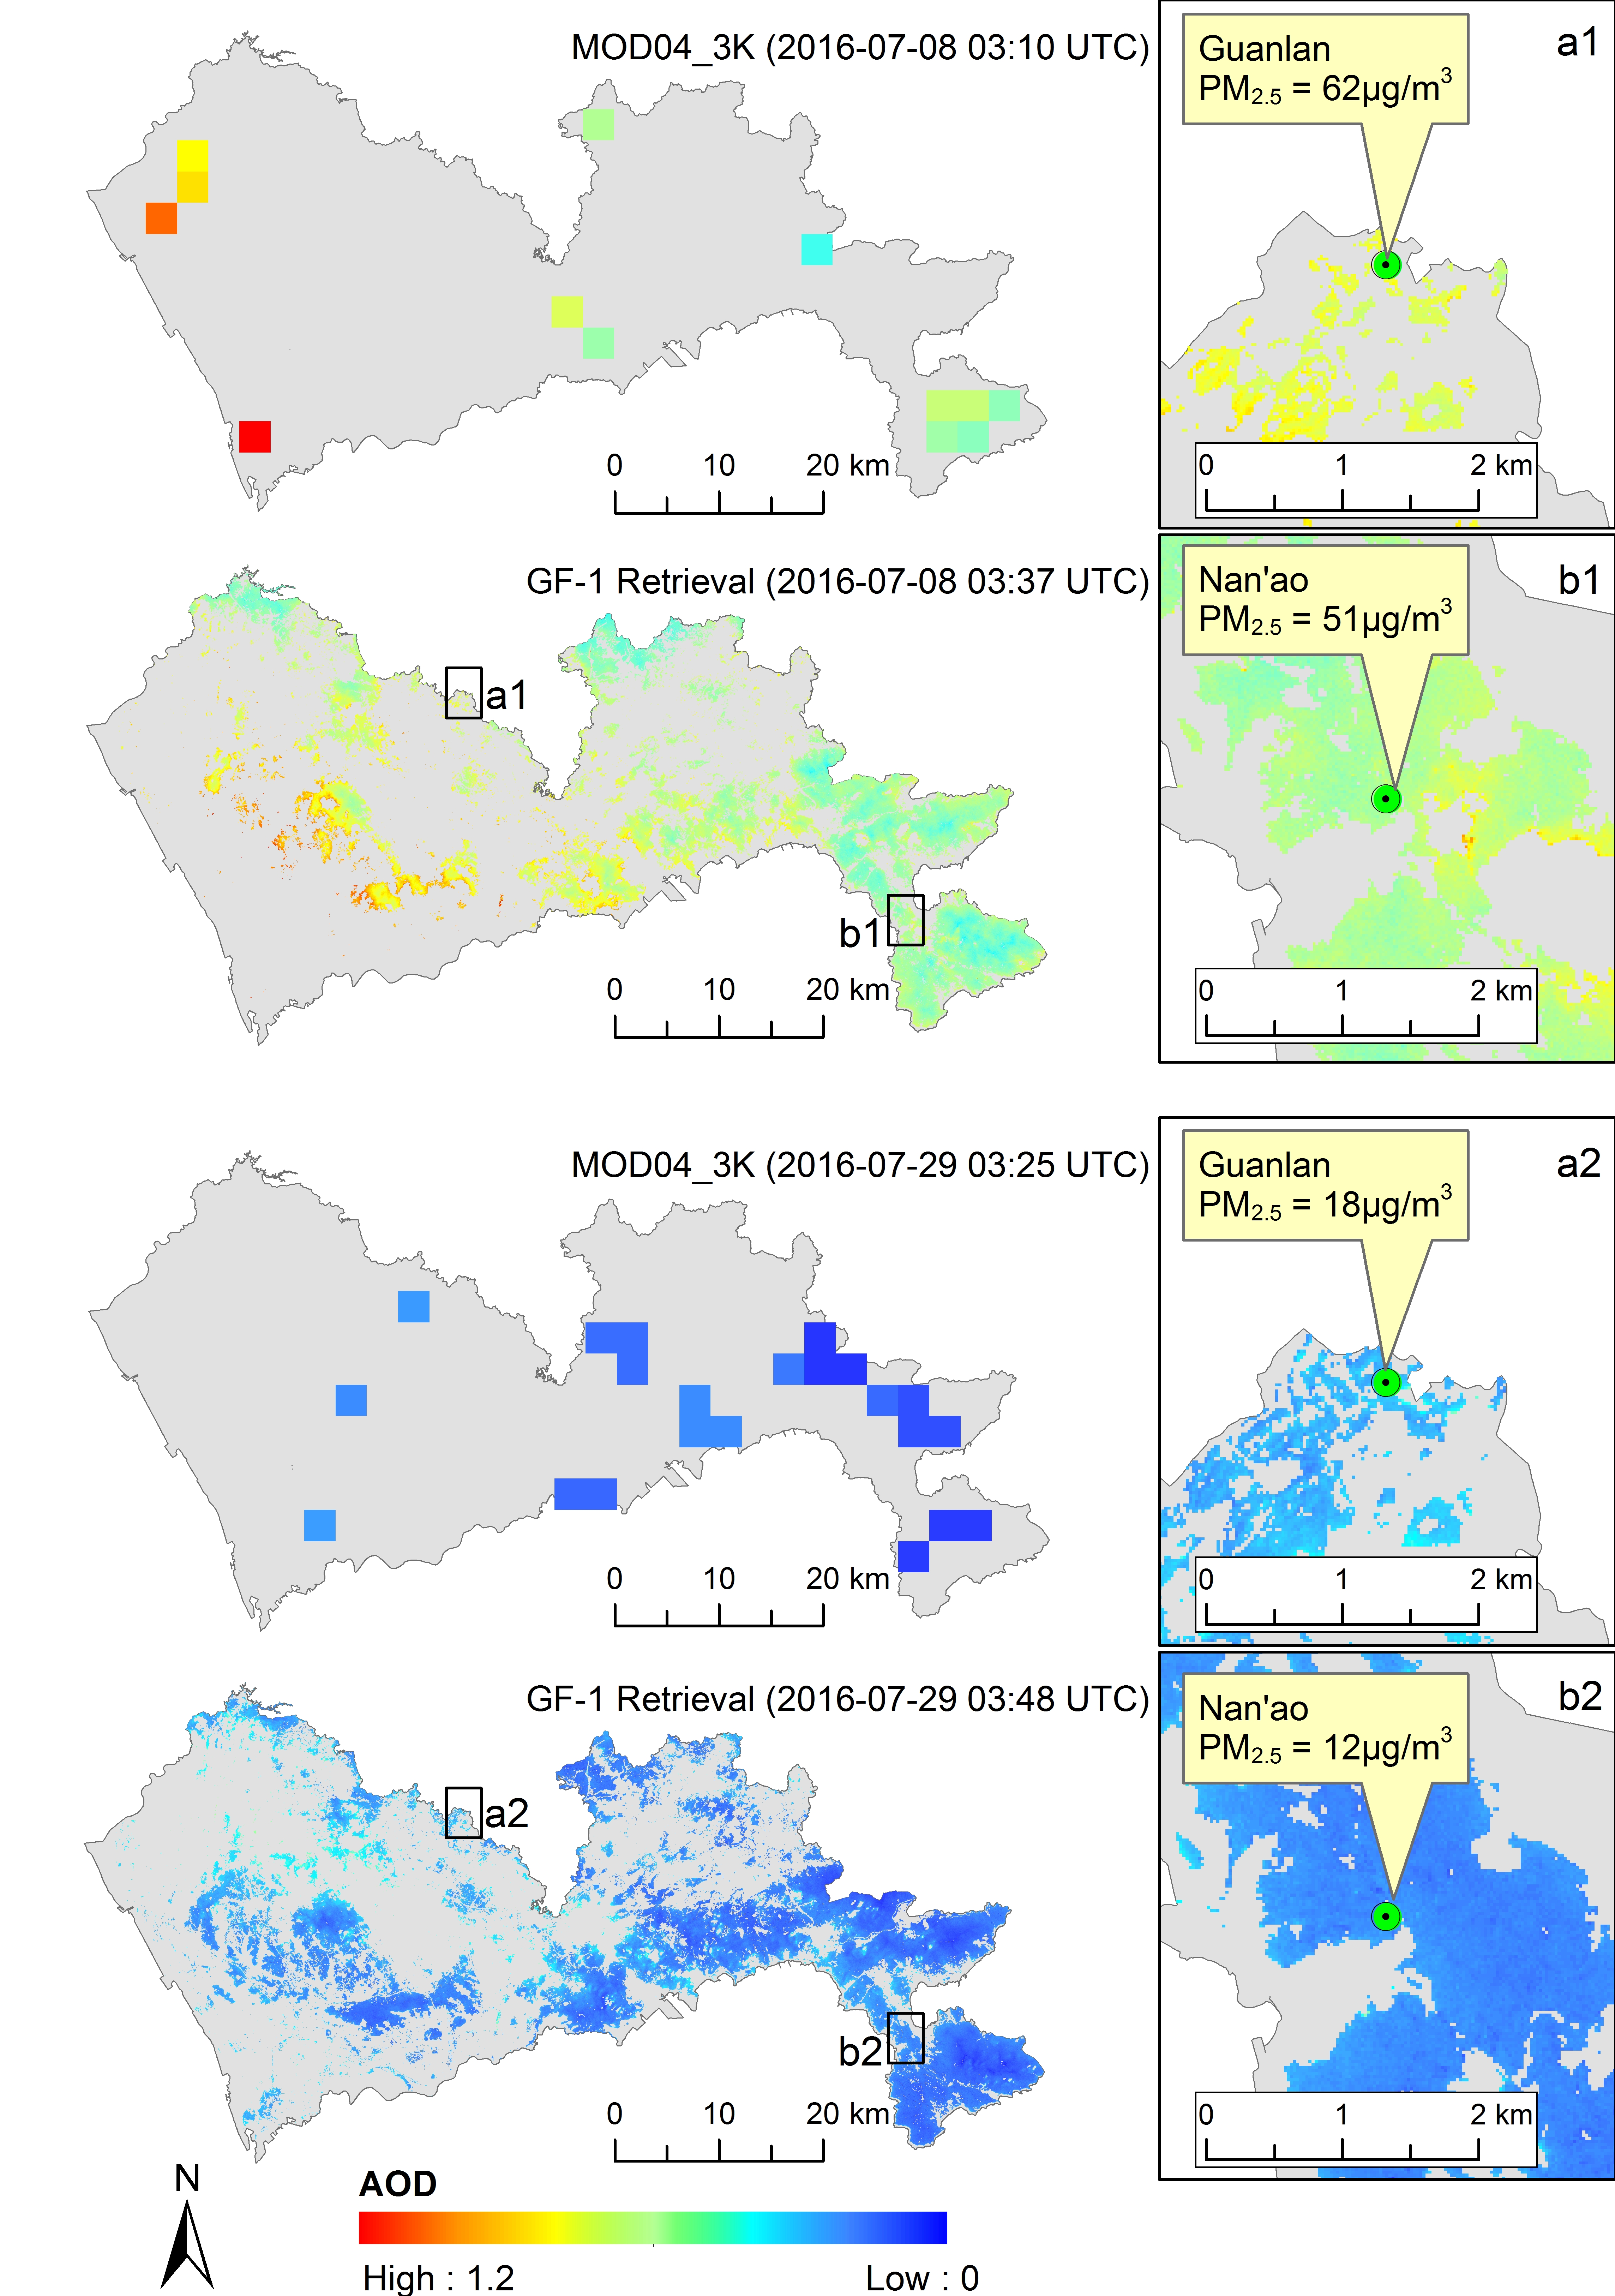
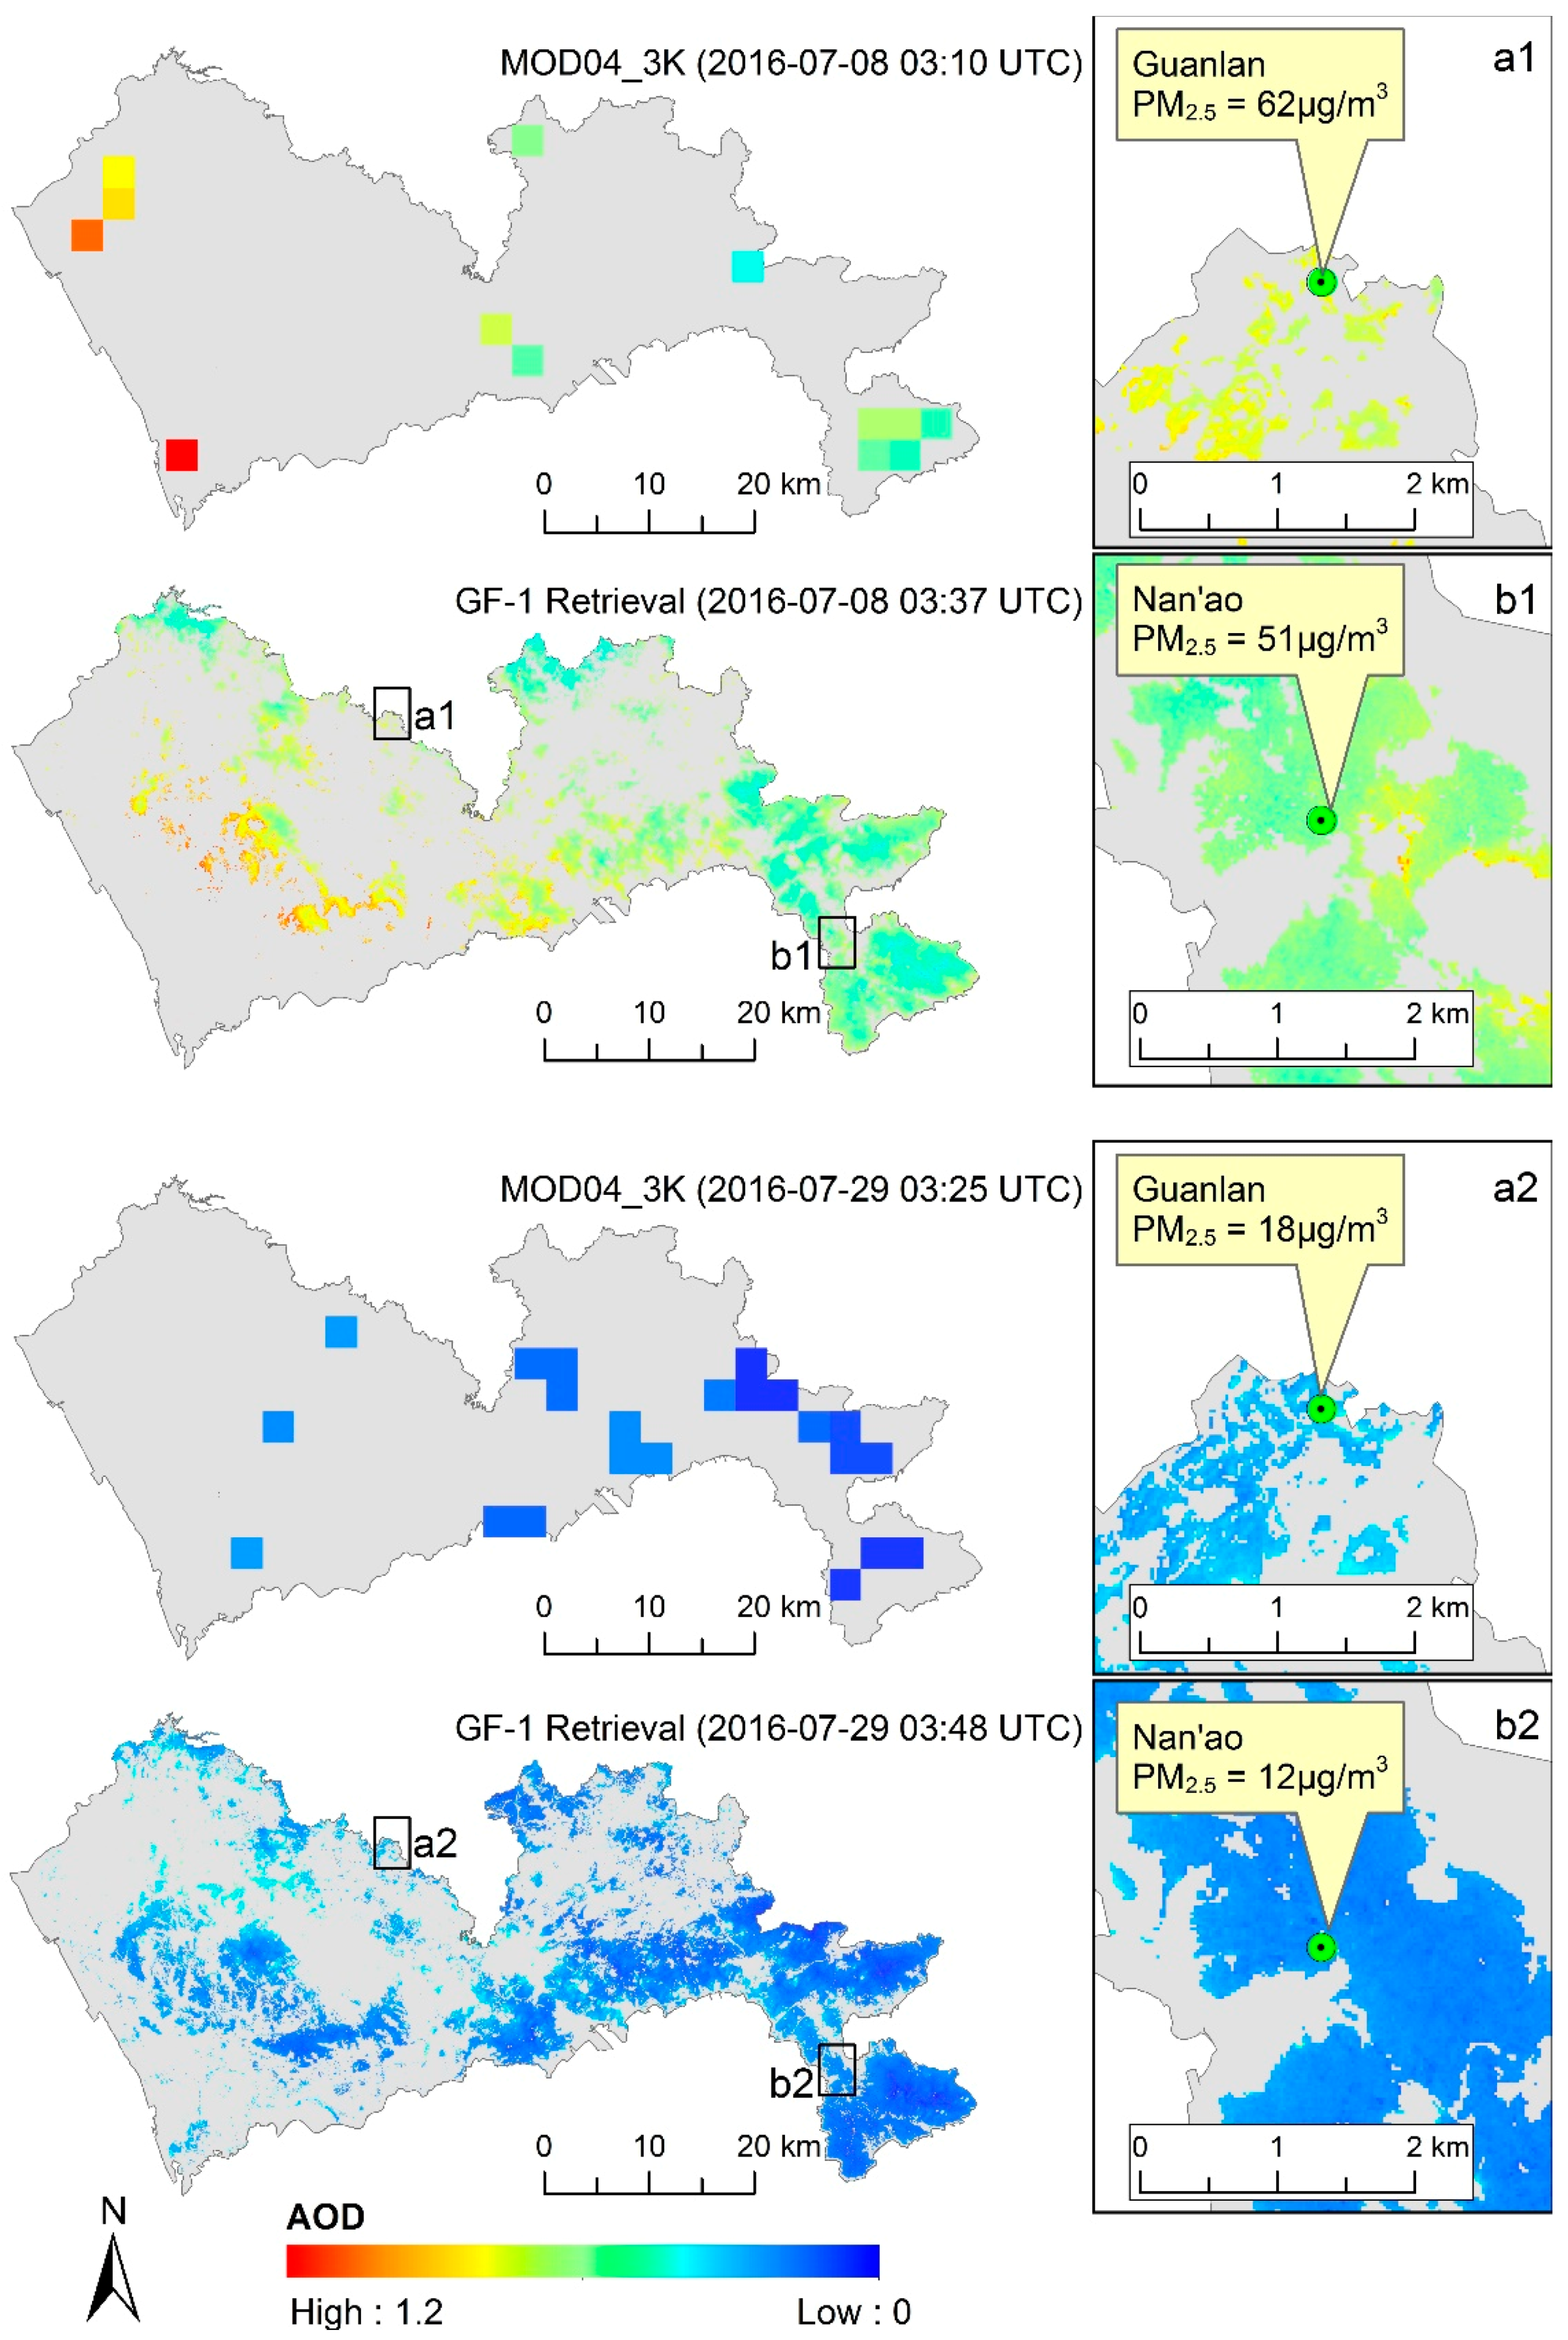
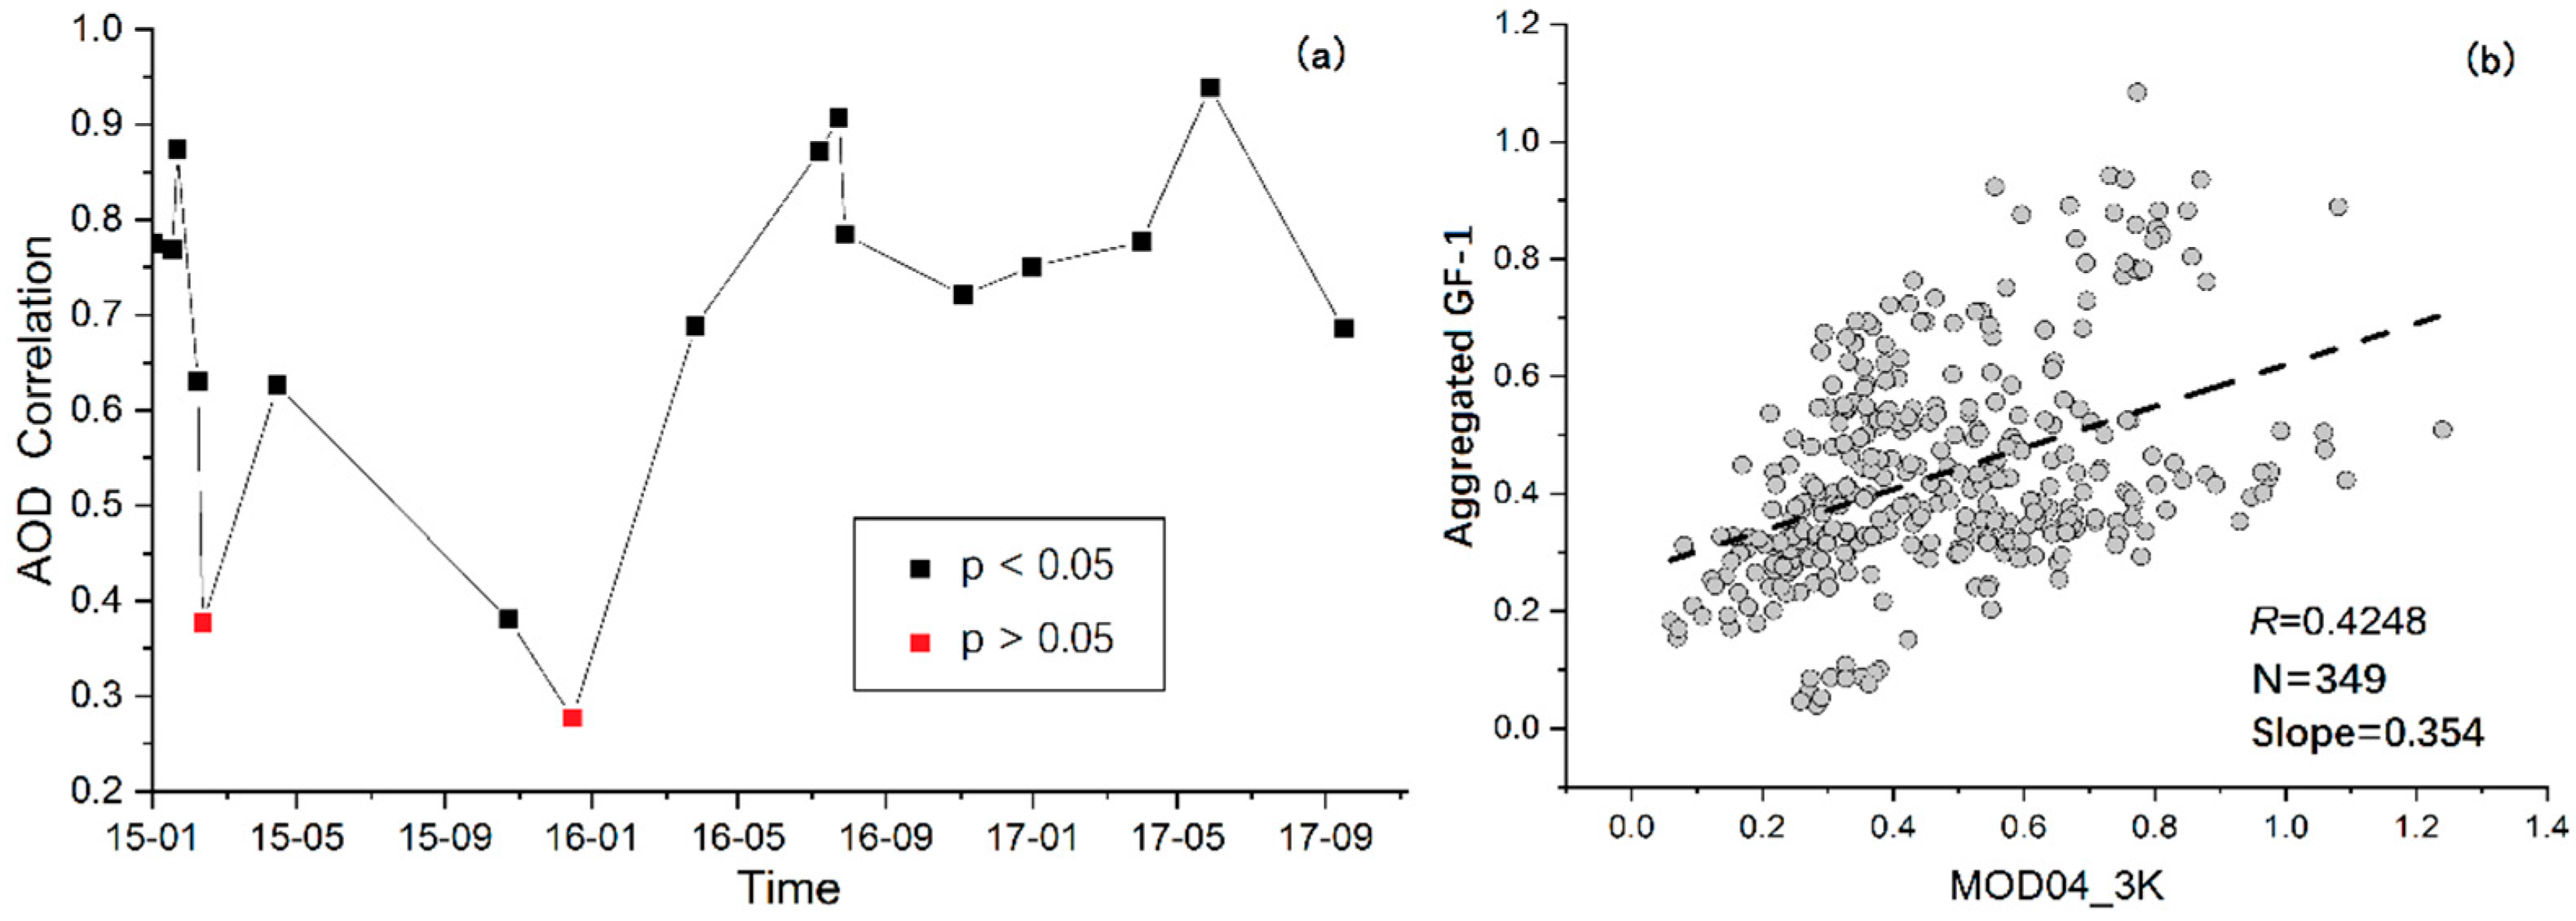
3.2. Retrieved and Validated GF-1 AOD

Figure 2 illustrates two of the GF-1 AOD retrieval results, representing the typical aerosol patterns in Shenzhen City on a polluted day (8 July 2016, average PM2.5 = 56 μg/m3) and on an unpolluted day (29 July 2016, average PM2.5 = 15 μg/m3). The MOD04_3K AOD on these dates is shown for comparison. The comparison can be conducted because they have a similar satellite passing time (around 03:00 UTC), and they are obtained using the same retrieving algorithm (i.e., DT) used in this study. In the right-hand panels are enlarged images of the GF-1 AOD around two air monitoring stations. Neither the derived GF-1 AOD nor the MOD04_3K AOD product could adequately represent areas with sparse vegetation due to the limitation of the DT algorithm.
Figure 2 shows that only a limited number of 3-km grids in Shenzhen City had valid MOD04_3K AOD values. Conversely, the GF-1 AOD derived in this study had high spatial resolution and represented more areas of Shenzhen City than the MOD04_3K AOD product. The GF-1 AOD values were higher in the north and west of the city, both of which were mainly built-up areas with denser population and more industry and traffic than other areas of Shenzhen City. Corresponding to the higher aerosol loading, high PM2.5 concentrations were also observed in these areas. For example, at Guanlan, an air monitoring station in the north of the city, the measured PM2.5 concentrations were 62 μg/m3 on 8 July 2016 (Figure 2(a1)) and 18 μg/m3 on 29 July 2016 (Figure 2(a2)), respectively 11% and 20% higher than the city’s average. The GF-1 AOD values were lower in the southeastern coastal areas and the Dapeng Peninsula, where mountainous and forest areas with low intensity of human activities and few air pollution sources are located. Corresponding to the lower aerosol loading, the PM2.5 concentrations were also relatively low in these areas. At Nan’ao, an air monitoring station located in the Dapeng Peninsula, the measured PM2.5 concentrations were 51 μg/m3 (Figure 2(b1), 8 July 2016) and 12 μg/m3 (Figure 2(b2), 29 July 2016), which were 9% and 20%, respectively, lower than the city’s average.
The higher spatial coverage than MODIS 3-km AOD and the ability to map the inner-city variation of aerosols show the potential of GF-1 AOD in city-scale aerosol studies. However, compared with MODIS AOD products, the temporal resolution of GF-1 AOD is relatively limited. It is not only due to the longer revisit period of the GF-1 satellite than the Terra and Aqua (MODIS) satellites, but also because the images are often degraded on acquisition days on account of the high cloud coverage in coastal areas such as Shenzhen City.
Figure 3 shows the validation results of the GF-1 AOD retrievals using the MOD04_3K AOD in the study area as benchmarks. For each single validation date, the aggregated GF-1 AOD had positive correlation with the MOD04_3K AOD, and for most dates, the correlation was strong and statistically significant (R > 0.6, p < 0.05). However, on some dates, the correlation was relatively weak. Besides the errors in the AOD retrievals, the limited coverage of MOD04_3K AOD for validation might also account for the low correlation. The overall correlation coefficient between aggregated GF-1 AOD and MOD04_3KAOD was 0.4248, indicating that the GF-1 AOD retrievals were moderately acceptable in accuracy, but can be further improved. Nevertheless, we believe that the derived GF-1 AOD were reliable for the PM2.5 study as described in subsequent sections.

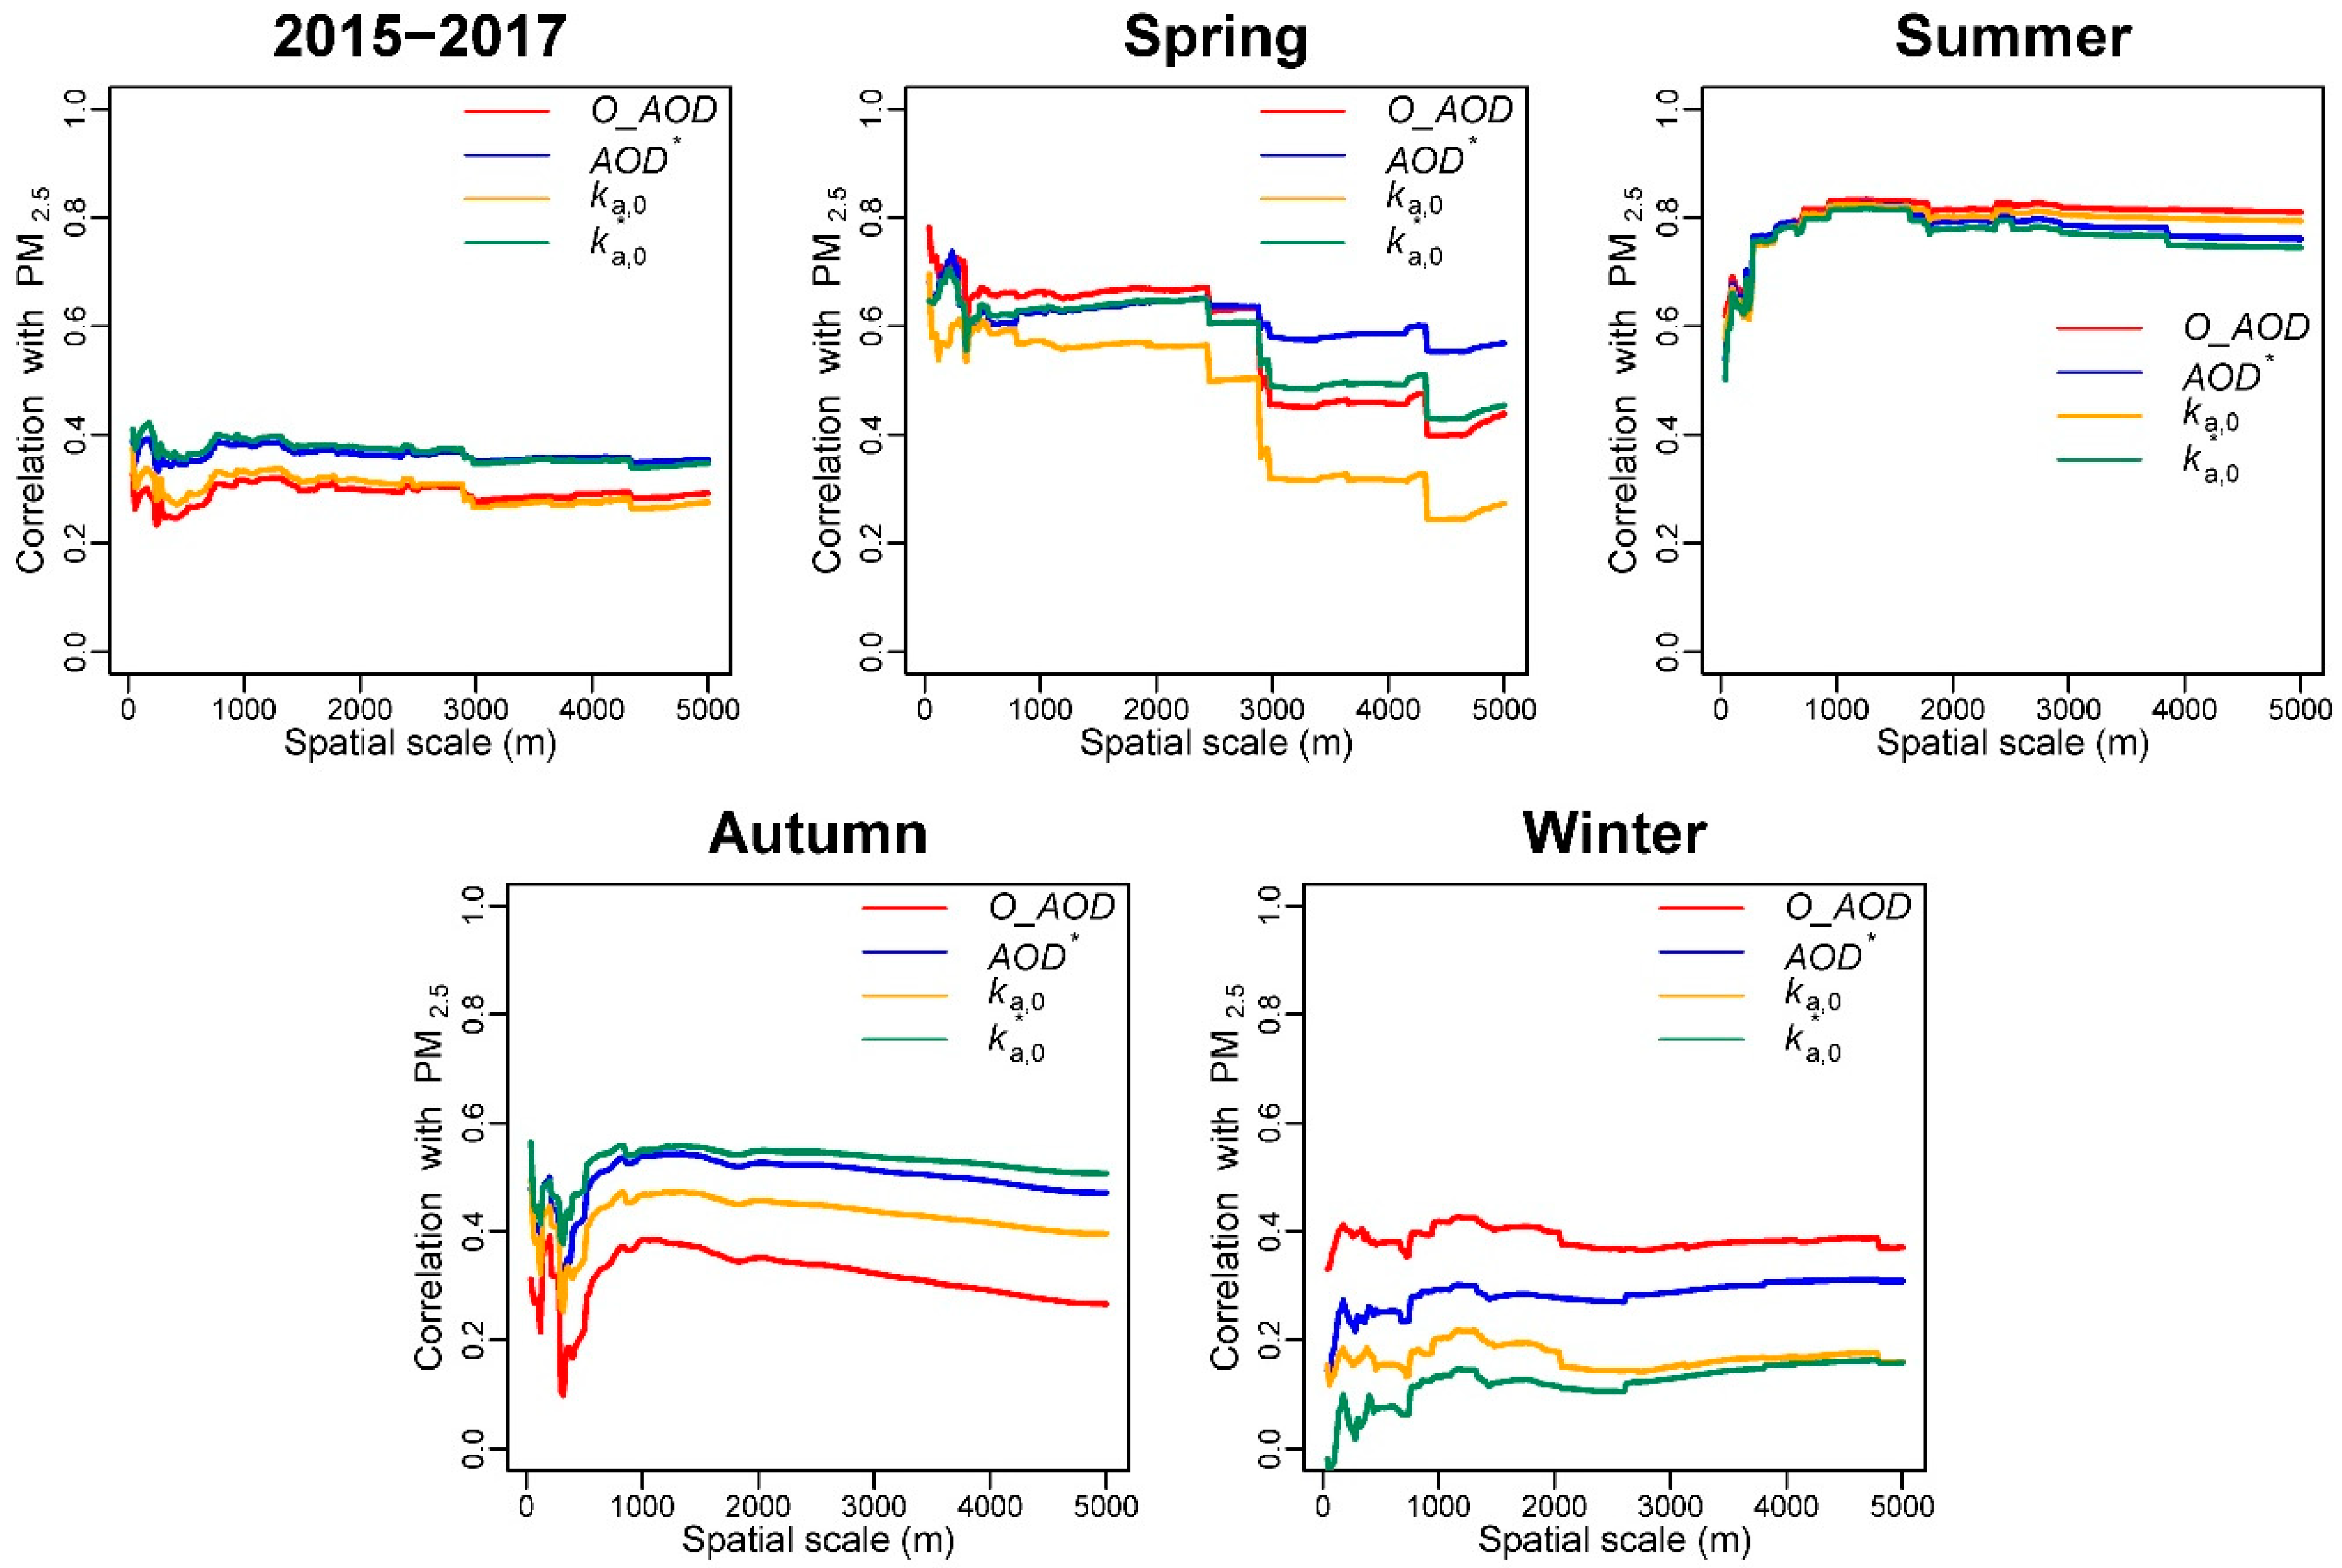
3.3. Pearson Correlation between GF-1 AOD and PM2.5 Concentrations

Table 2 shows several descriptive statistics of the Pearson correlations between in situ measured PM2.5 concentrations and the corresponding GF-1 AOD values before and after corrections at different spatial scales. Before corrections, there were statistically significant correlations between AOD at different spatial scales and PM2.5 concentrations, with Pearson’s correlation coefficient R ranging between 0.234–0.329. The vertical correction slightly increased the mean R by 0.005. The humidity correction increased the mean R by 0.07, and achieved a much better correction effect on GF-1 AOD in Shenzhen City than the vertical correction. After both corrections, the mean R reached 0.367, and the highest R increased to 0.423, which was a remarkable improvement over the correlations between uncorrected AOD and PM2.5 concentrations (mean R = 0.292, highest R = 0.329). Table 2 also indicates that the impact of AOD spatial scales on AOD–PM2.5 correlations is comparable to that of AOD corrections. For example, R between O_AOD and PM2.5 ranged from 0.234 to 0.329 at different spatial scales, while the mean R ranged from 0.292 to 0.367 for uncorrected/corrected AOD. Therefore, besides AOD corrections, it is also of importance to pay attention to the proper spatial scale of AOD in PM2.5 studies based on high-resolution AOD.
Figure 4 illustrates how AOD–PM2.5 correlation varied at different spatial scales and with different AOD correction methods. The seasonal characteristics of aerosol may influence the correction effects, so the data were further split into seasonal groups for analysis. Since the number of dark pixels in buffers did not increase proportionally with the increase of the spatial scales, some leaps were apparent in the relationships, as are obvious in Figure 4. Therefore, we focused more on the overall trends and general regularities than on absolute changes.
For the annual dataset, narrowing the spatial scale of AOD from 5 km to approximately 1 km improved the AOD–PM2.5 correlations. However, continuing to narrow the spatial scale from 1 km to finer scales did not improve the correlation further, because the smaller spatial scales caused fluctuations in AOD–PM2.5 correlations that degraded the overall relationship. In terms of the impacts of AOD correction, the humidity correction was more effective than the vertical correction at all scales.
In spring, at spatial scales of AOD <1 km, the correlations fluctuated significantly as scales changed. When the spatial scale ranged from 1 to 3 km, the correlation coefficients between PM2.5 concentrations and O_AOD, AOD* and k a , 0 * were not much different, and were all higher than that between PM2.5 concentrations and k a , 0 . At coarser spatial scales (>3 km), the correlation between AOD and PM2.5 concentrations decreased, and the correlation coefficients followed the order AOD* > k a , 0 * > O_AOD > k a , 0 .
In summer, neither vertical nor humidity corrections had a significant effect on the correlation between AOD and PM2.5 concentrations. At a spatial scale of 40 m, all the correlation coefficients were approximately 0.5. As the spatial scale increased, the correlation coefficients increased rapidly, reaching the highest (>0.8) at the approximately 1-km spatial scale. As the spatial scale continued to increase beyond 1 km, the correlation coefficients slowly decreased.
In autumn, both vertical and humidity corrections improved the correlation effectively, and the correlations reached their maxima at a spatial scale of approximately 1 km. In addition, the effect of the humidity correction was relatively larger compared to that of the vertical correction. Correlations fluctuated irregularly at scales less than 1 km.
In winter, the correlation coefficients between uncorrected or corrected AOD and PM2.5 concentrations were relatively low, and both the vertical correction and humidity correction reduced the correlations. The uncorrected AOD and PM2.5 were best correlated at the spatial scale of approximately 1 km. The irregular fluctuations of correlations at scales less than 1 km were also observed in this season.
In summary, AOD corrections (humidity and vertical) and spatial scale both had impacts on the relationship between DT-derived GF-1 AOD and surface PM2.5 concentrations. In spring, summer, autumn, and winter, the best correlations with PM2.5 concentrations were achieved using humidity-corrected AOD, uncorrected AOD, vertical and humidity-corrected AOD, and uncorrected AOD, respectively. When the spatial scale of GF-1 AOD narrowed from 5 km (or from 3 km in winter) to approximately 1 km (or to 2 km in spring), the correlation between AOD and PM2.5 concentrations generally increased. However, further narrowing the spatial scales to less than 1 km stopped the improving trend in correlations and prompted irregular fluctuations of the correlations except in summer, when the correlations decreased quickly.
Table 3 shows how the mean Pearson correlation (R), its standard deviation, and its coefficient of variation (C.V.) varied at different ranges of AOD spatial scales. The correlation between AOD at 40–1000 m scales and PM2.5 concentrations was slightly lower than that of AOD at 1–2 km scales. The standard deviations and coefficients of variation of R at spatial scales <1 km were higher than those at any other range of scales. The results shown in Figure 4 and Table 3 suggest that AOD with smaller spatial scales do not always lead to better correlation with in situ PM2.5 measurements. The spatial scale threshold of approximately 1 km may imply an optimum analysis scale to establish spatially AOD–PM2.5 correspondences.

4. Discussion

4.1. AOD Correction Effect on Correlations between AOD and PM2.5 Concentrations

In Section 3, the DT-derived GF-1 AOD data for Shenzhen City were presented, as were their correlations with in situ measured PM2.5 concentrations before and after the humidity and vertical corrections. These results are compared in Table S3 with those from previous similar studies conducted in Shenzhen or surrounding areas. The DT-derived GF-1 AOD in this study exhibited similar correlations with PM2.5 concentrations, as in the previous studies that used MODIS AOD. The correlations were not strong, although they were statistically significant, which might be due to the instability of aerosols in subtropical monsoon coastal zones, as well as the complexity of aerosol composition in urban areas.
The humidity correction of GF-1 AOD can improve its correlation with annual PM2.5 concentrations more effectively than the vertical correction in Shenzhen City (Table 2). The fact that Shenzhen City is located in the subtropical climate zone may account for this difference. The temperature in this area at sunny noon (the imaging time of GF-1) is fairly high across the whole year, leading to high PBLH values with relatively small variation. The data presented in Table 1 support the inference, showing a sizeable difference between the coefficient of variation for PBLH (17.2%) and that for relative humidity (28.0%). Therefore, performing humidity correction on AOD in Shenzhen City achieves better effects than the vertical correction.
In summer, uncorrected AOD has a strong correlation with PM2.5 concentrations, indicating that the light extinction in the summer atmosphere may be mainly contributed by PM2.5 near the ground surface. This finding agrees with that of Yang et al. [52], who measured PM2.5 concentrations and the extinction coefficients in the PRD region in summer. The high temperature of summer noon in Shenzhen City limits the variation of PBLH among different days (these data exhibited a coefficient of variation of merely 4.4% in this study). Moreover, because of the southeast monsoon in summer, most of the pollutants in Shenzhen City are diffused rapidly, and as a result, the pollutants are not uniformly distributed in the atmospheric boundary layer. Therefore, the vertical correction in this season had little effect on the correlation between AOD and PM2.5 concentrations [44]. The main components causing the increase of the extinction coefficient by moisture absorption in aerosols in Shenzhen City are ammonium sulfate and ammonium nitrate [53]. However, Huang et al. [54] found that due to the monsoon and sea salt aerosol, the concentrations of sulfate and nitrate in PM2.5 in Shenzhen’s atmosphere are lower in summer than that in other seasons. This can be an important reason why performing humidity correction failed to improve the correlation in summer.
In autumn, the prevailing wind direction in Shenzhen City gradually changes from the southeast to the northeast. Since Shenzhen City is located in the southern part of the PRD urban agglomeration, regional transportation affected PM2.5 pollution, destabilizing the composition and characteristics of PM2.5 and reducing the correlation between the uncorrected AOD and PM2.5. However, pollutant transportation results in more PM2.5 concentrations at some height within the atmospheric boundary layer rather than just on the surface, and the gradual decrease in temperature increases the variation of PBLH (coefficient of variation is 11.3%). Thus, the vertical correction of Shenzhen’s AOD in autumn achieves better correlations with PM2.5 concentrations. Zheng et al. [55] pointed out that 91.4% of SO2 in the PRD region originated from power plants and industrial emissions, and 87.2% of NOx came from power plants and motor vehicle emissions. The northeast monsoon in autumn brings these anthropogenic pollutants into Shenzhen City, and increases the concentrations of sulfate and nitrate in the atmosphere [54]. Observations in Hong Kong also indicate that the region has the highest concentration of ammonium sulfate in autumn, which is derived from the PRD region in the upwind direction [56]. Therefore, improved AOD–PM2.5 correlations can be achieved by performing humidity correction on autumn AOD in Shenzhen.
The aerosols in spring and autumn have similar composition and characteristics due to the transition of the monsoon direction in Shenzhen City. Therefore, the humidity correction of AOD in spring can also improve the correlation between AOD and PM2.5 concentrations. However, the vertical correction failed to achieve improved correlation (Figure 4). The descriptive statistics presented in Table 1 show that the PBLH data in spring are left-skewed, suggesting that there are a few extremely small values, but the data distribution is massively concentrated in relatively high values. Thus, the poor effect of vertical correction in spring may have been because most of the springtime images in this study were captured on days when the temperature was close to that of summer. Consequently, the PBLH was fairly high for most retrieving days, and the variation of PBLH in spring was very limited.
In winter, Shenzhen City is completely dominated by the prevailing northeast wind, so the regional transportation of pollutants from the northern PRD or even further north influences the atmosphere of Shenzhen City more significantly than that in other seasons. In this situation, an “elevated aerosol layer” separated from the surface aerosol can appear [44], causing pollutants to be unevenly distributed in the atmospheric boundary layer. Moreover, the proportion of pollutants derived from regional transportation is large in winter in Shenzhen City [54], so the “elevated aerosol layer” can contribute more to the AOD than surface PM2.5 concentrations. These may be the reasons why the AOD–PM2.5 correlation was weak in winter, and the vertical correction of AOD did not have much effect. Yao et al. [53] found that organic matter has the highest contribution to the extinction coefficient in winter in Shenzhen City. However, the extinction by organic matter does not change much with humidity, which might be one of the reasons that AOD humidity correction had little effect on correlation improvement in winter.
In conclusion, the effects of performing humidity and vertical corrections on a full-year AOD dataset are helpful, but this benefit is not always observed when corrections are applied to seasonal AOD datasets, with corrections being effective only in spring and autumn in Shenzhen City. This difference suggests a strong seasonal variation of the aerosol characteristics in Shenzhen City because of the regional pollution pattern and the monsoon climate of the city. As a result, the vertical and humidity corrections are conducive to the improvement of correlations between full-year AOD and PM2.5 concentrations by disposing of the seasonal variation of aerosol characteristics, but they have weak or even no effect during specific seasons, because the variation of aerosol characteristics within seasons are relatively small.

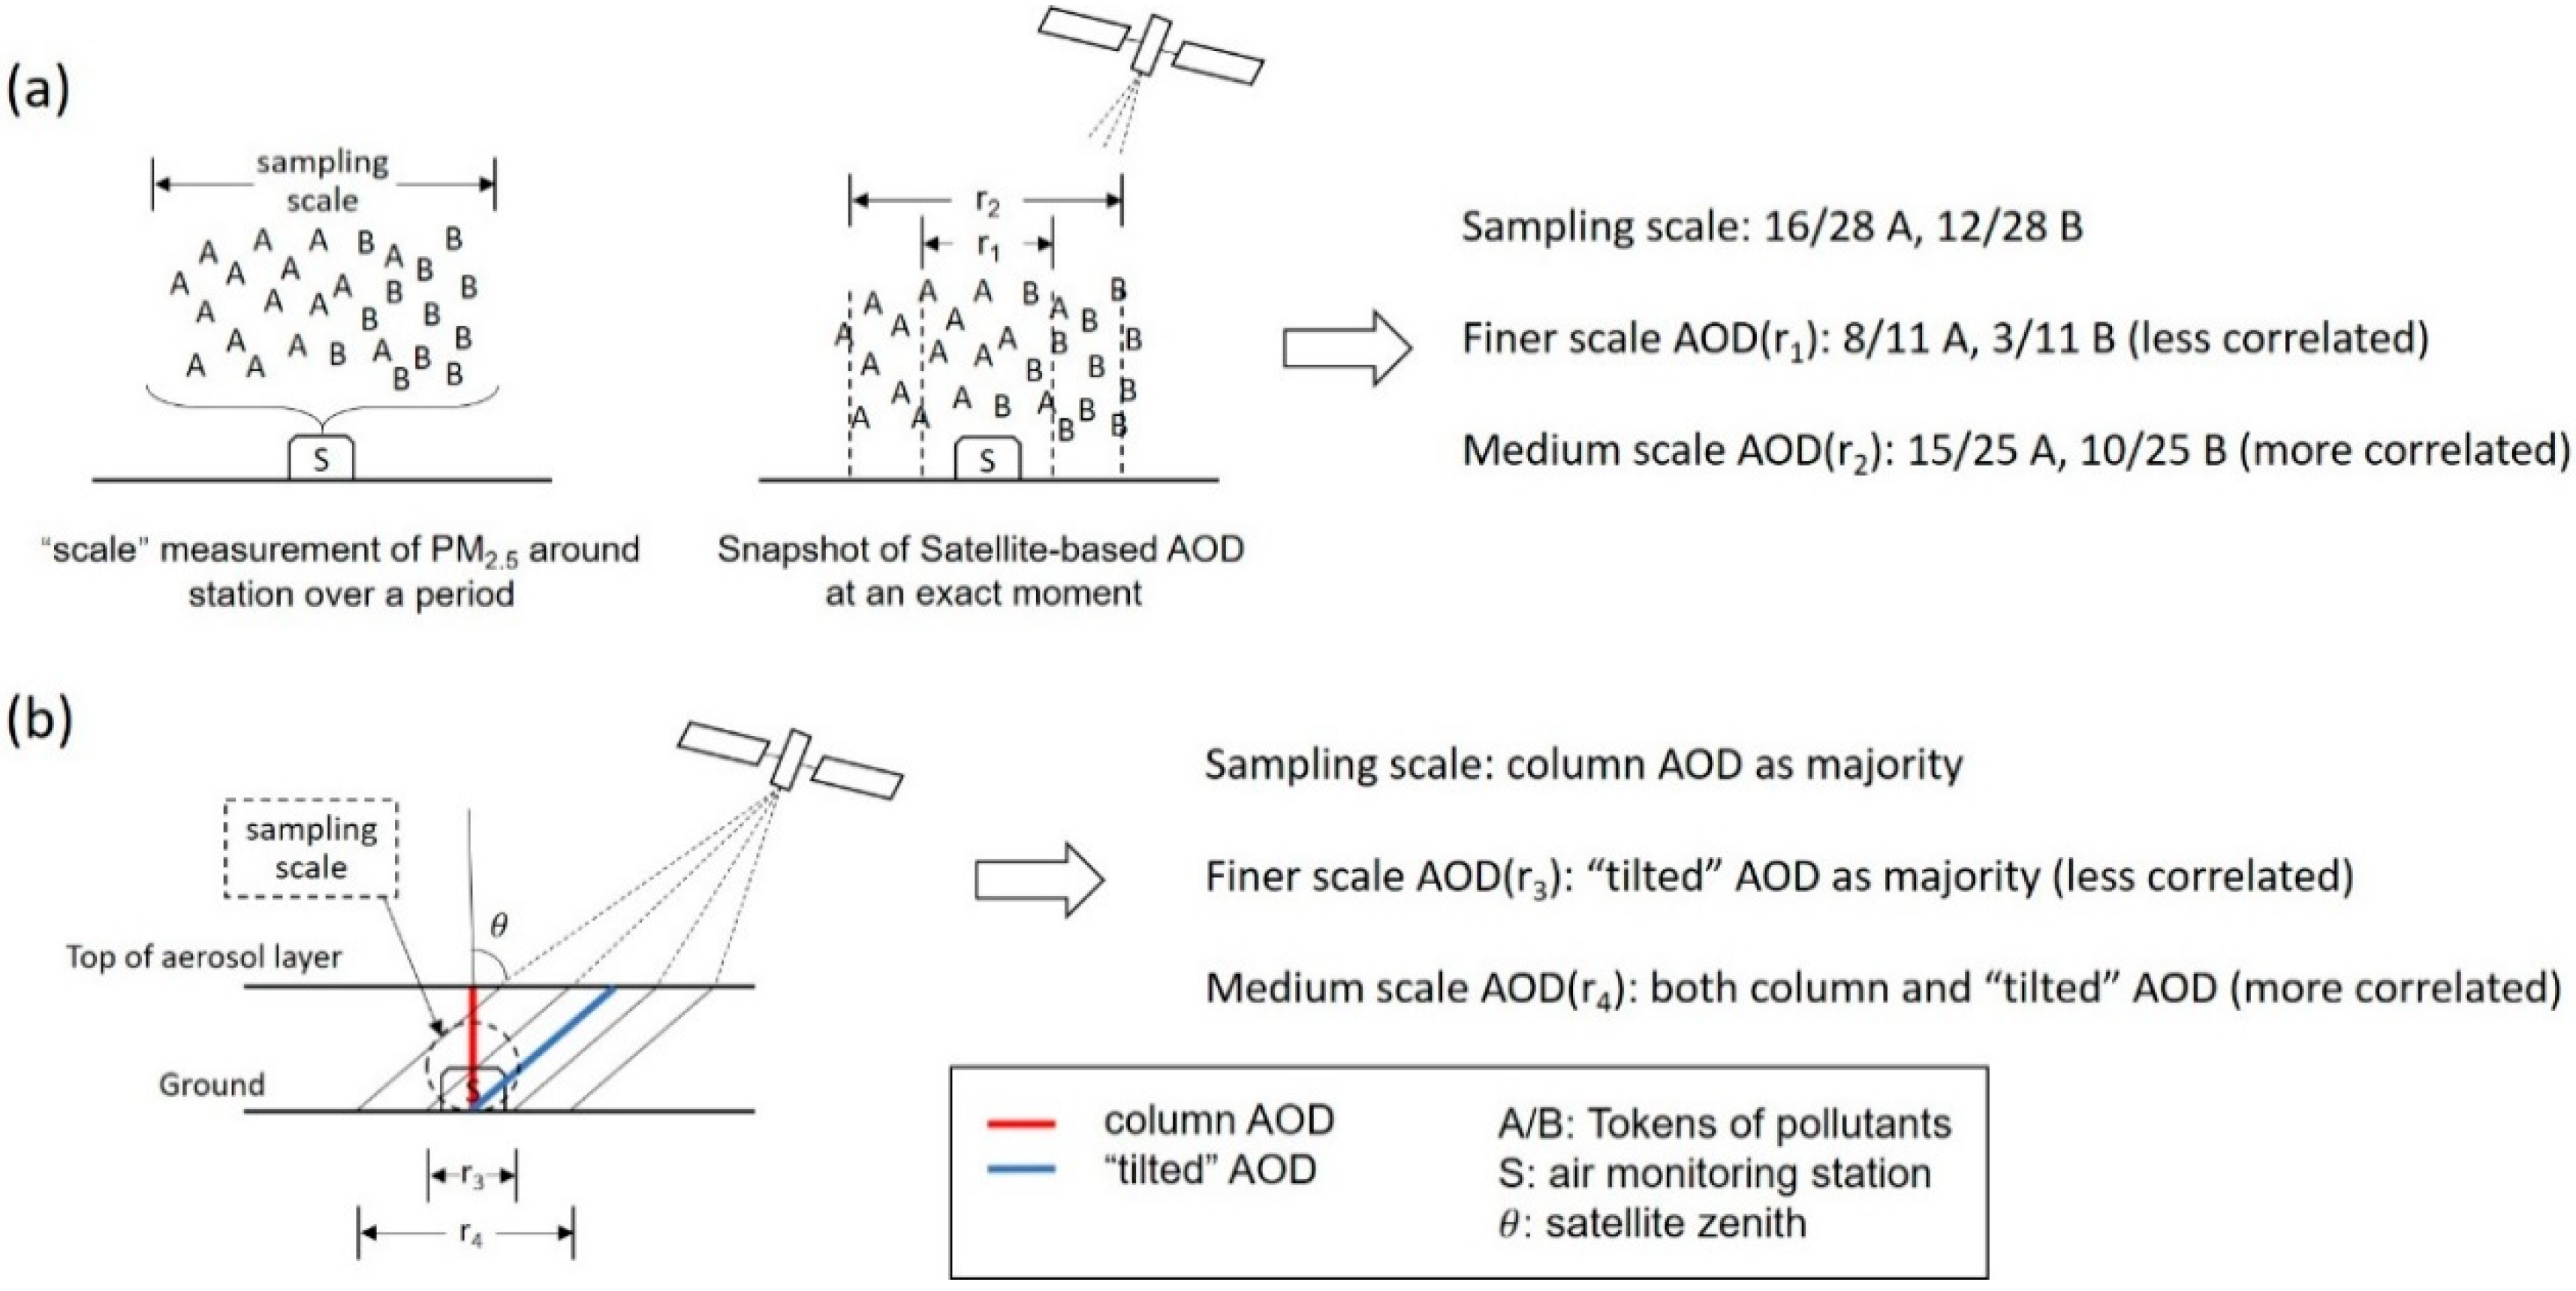
4.2. Spatial Scale Effect on Correlations between AOD and PM2.5 Concentrations

Figure 4 and Table 3 show that when the spatial scale of AOD is coarse (>1 km), the correlation between AOD and PM2.5 concentrations increases as the AOD spatial scale narrows. This is consistent with the results of several previous studies using MODIS AOD products with different spatial resolutions [29,31,57] or AOD extracted in different buffer sizes [58], suggesting that the high-resolution AOD can be better correlated with PM2.5 concentrations than low-resolution AOD under specific circumstances. Conventionally, PM2.5 monitoring data are regarded as “point” measurements [15], so a smaller spatial scale of AOD is helpful for accurately matching AOD with the air monitoring stations [57] and achieving better correspondences.
However, our results also show that when the spatial scale of AOD narrows to less than 1 km, the correlation between AOD and PM2.5 concentrations does not improve further, but instead shows large irregular fluctuations. This result is in contrast with the conclusion of Mei et al. [31], who expected the correlation would continue increasing with AOD resolution increasing to higher than 1 km. In the case of tiny spatial scales, we believe that the “point” measurement theory of PM2.5 concentrations may become invalid, and the “scale” measurement of PM2.5 concentrations takes effect. In details, the “scale” PM2.5 measurement means that although an air monitoring station is represented as a static point on a map, the PM2.5 concentration it measures actually has a certain spatial scale (albeit small). Therefore, the “scale” PM2.5 measurement will be best correlated with AOD that is measured at the corresponding spatial scale. When the spatial scale of AOD is too fine (or too coarse), a spatial scale mismatch appears between the two measurements, which jeopardizes the correlation.
The scale mismatch between AOD and PM2.5 concentrations at tiny spatial scales may be caused by two effects. Firstly, it is the influence of aerosol transportation. Hoff and Christopher [15] and Li et al. [59] considered the movement of aerosol as an important factor when they investigated the proper window size for AOD to match in situ AOD or PM2.5 measurements. Therefore, it can be reasonably speculated that in case of the continuous monitoring and aerosol transportation, the value of in situ PM2.5 measurements should be not only a temporal average, but also a spatial average at a certain scale. For example, we can consider the analysis of a minimal case as described in Figure 5a, in which two types of particulate pollutants (A and B) exist in the vicinity of the monitoring station (the actual situation could be more complicated). Since the pollutants continuously move and disperse during the monitoring period, not only is the pollutant A directly above the monitoring station sampled, but also the surrounding pollutant B is sampled as well. Thus, the PM2.5 concentration of the air monitoring station is determined by the spatial average of both pollutants within a certain range. Meanwhile, the remotely sensed and derived AOD only reflects the instantaneous aerosol distribution, because the satellite image is a snapshot at an exact moment. Therefore, the derived AOD at a medium spatial scale (r2) can better reflect the spatial average characteristics of pollutants than at a very tiny spatial scale (r1), resulting in a higher correlation with in situ PM2.5 measurements.
Secondly, the satellite zenith angle results in a derived AOD that is actually determined from a “tilted” integral of light extinction, which may not accurately capture the aerosol characteristics near the monitoring station. As shown in Figure 5b, the satellite does not acquire an image directly above the station. Therefore, the derived AOD is not completely the vertical integral of light extinction, but rather is a “tilted” AOD determination. When the spatial scale of derived AOD is too fine (r3), the “tilted” AOD reflects only a small proportion of the aerosol’s extinction properties at the sampling scale. However, at an appropriately coarser spatial scale (r4), more information of the aerosol’s extinction properties above the monitoring station can still be included in the “tilted” AOD, resulting in a better correlation between AOD and in situ PM2.5 measurements.
Other systematic or random factors (e.g., the lower signal-to-noise ratio of AOD retrieval at high resolution [18,60], the errors in geographical corrections) may also affect the correlation at different spatial scales, but an in-depth examination and verification of these factors are beyond the scope of this study. In summary, increasing the spatial resolution of AOD can increase its correlation with PM2.5 concentrations only at some scales. When AOD has a very high spatial resolution, it becomes more difficult to match AOD with in situ PM2.5 measurements at similar spatial scales. Therefore, although GF-1 has a high spatial resolution, directly using its AOD retrieval results to match PM2.5 measurements is not recommended. Instead, GF-1 AOD users should aggregate the AOD resolution to approximately 1 km before analyzing AOD–PM2.5 correspondences in Shenzhen City and surrounding areas, as the 1-km spatial scale appears to be an optimum AOD scale in this region.

4.3. Limitations and Future Research Directions

Several limitations of this study should be noticed. Firstly, the number of GF-1 satellite images used was relatively small. The limited number of images, further restricted by the temporal resolution, may impose some negative influence on the results. This limitation is also widely seen in other AOD researches based on satellites with high spatial but low temporal resolutions such as Landsat-8 and Sentinel-2 [59,61,62]. Although GF-1 has a medium-length repetition cycle of four days, which is shorter than that of Landsat-8 (16 days) and Sentinel-2 (10 days), it may be still insufficient for regions that experience frequent cloudy conditions or rainy weather such as Shenzhen City. It is noteworthy that the GF-6 satellite has been successfully launched and will form an operation network with GF-1; thus, the availability of suitable imagery is expected to improve in the near future. Secondly, our results are based on the GF-1 AOD derived solely from the DT algorithm. When retrieving high-resolution AOD in urban areas with complex land covers, the accuracy of the DT algorithm may be restricted [60]. Therefore, the correlations between PM2.5 concentrations and high-resolution AOD derived from other algorithms (e.g., the Dark Blue algorithm) should be further investigated in future research. Finally, although it is found that the correlation between DT-derived AOD and PM2.5 concentration has a spatial scale effect and the 1-km AOD scale is the optimum in Shenzhen City, it is not explored for the factors that determine the best spatial scale of DT-derived AOD, which should be paid attentions in future research.

5. Conclusions

High-resolution GF-1 AOD were retrieved using the DT algorithm and were validated using the MOD04_3K AOD product (R = 0.4248). AOD extracted at different spatial scales using different sizes of buffers ranging from 40 to 5000 m had statistically significant correlations with in situ PM2.5 measurements in Shenzhen City, China, indicating that DT-derived GF-1 AOD can be applied in the remotely sensed monitoring of atmospheric quality at city scale. Performing humidity and vertical corrections on GF-1 AOD can improve its correlation with PM2.5 concentrations, but the correction effects vary seasonally, as they are affected by the seasonal variation of aerosol characteristics in Shenzhen City. Narrowing the spatial scale of DT-derived GF-1 AOD can increase its correlation with PM2.5 concentrations up to a certain threshold (approximately 1-km scale for Shenzhen City in this study), after which further narrowing the AOD spatial scale does not produce obvious improvements in correlation, but instead induces irregular fluctuations. The effect may be attributed to the difficulty in accurately matching the DT-derived AOD at tiny scales and the “scale” PM2.5 measurements. Very high-resolution DT-derived AOD data should be aggregated to an appropriate medium resolution before matching them with in situ PM2.5 measurements. Further research is needed to determine if 1 km is universally the appropriate spatial scale of DT-derived AOD, or whether the threshold is affected by regional social or ecological factors.

Supplementary Materials

The following are available online at https://www.mdpi.com/2072-4292/11/19/2223/s1, Table S1: Location of 11 national air monitoring stations in Shenzhen City and their land-use types; Table S2: GF-1 WFV images of Shenzhen City used in this study; Table S3: Results comparison of similar studies in the same or neighboring areas.

Author Contributions

Conceptualization: J.W. and J.L.; Methodology, J.W. and L.Z.; Software, J.L.; Writing—Original Draft Preparation, J.L.; Writing—Review & Editing, F.Y. and J.P.; Supervision, J.W.; Funding Acquisition, J.P.

Funding

This study was funded by the Shenzhen Science and Technology Innovation Commission (JCYJ20170412150910443).

Acknowledgments

The anonymous reviewers are thanked for their constructive comments and suggestions. Thiri Shwesin Aung (post-doctoral researcher, Peking University) is thanked for helping improve the language. Zhao Feng (Master candidate, Peking University) is thanked for helping proofread the manuscript.

Conflicts of Interest

The authors declare no conflict of interest.

References

  1. Chow, J.C.; Watson, J.G.; Mauderly, J.L.; Costa, D.L.; Wyzga, R.E.; Vedal, S.; Hidy, G.M.; Altshuler, S.L.; Marrack, D.; Heuss, J.M.; et al. Health effects of fine particulate air pollution: Lines that connect. J. Air Waste Manag. Assoc. 2006, 56, 1368–1380. [Google Scholar] [CrossRef] [PubMed]
  2. Brook, R.D.; Rajagopalan, S.; Pope, C.A.I.; Brook, J.R.; Bhatnagar, A.; Diez-Roux, A.V.; Holguin, F.; Hong, Y.; Luepker, R.V.; Mittleman, M.A.; et al. Particulate Matter Air Pollution and Cardiovascular Disease an Update to the Scientific Statement from the American Heart Association. Circulation 2010, 121, 2331–2378. [Google Scholar] [CrossRef] [PubMed]
  3. Pope, C.A.; Turner, M.C.; Burnett, R.T.; Jerrett, M.; Gapstur, S.M.; Diver, W.R.; Krewski, D.; Brook, R.D. Relationships Between Fine Particulate Air Pollution, Cardiometabolic Disorders, and Cardiovascular Mortality. Circ. Res. 2015, 116, 108–258. [Google Scholar] [CrossRef] [PubMed]
  4. Pope, C.A.; Burnett, R.T.; Thun, M.J.; Calle, E.E.; Krewski, D.; Ito, K.; Thurston, G.D. Lung cancer, cardiopulmonary mortality, and long-term exposure to fine particulate air pollution. JAMA 2002, 287, 1132–1141. [Google Scholar] [CrossRef] [PubMed]
  5. Turner, M.C.; Krewski, D.; Pope, C.A.I.; Chen, Y.; Gapstur, S.M.; Thun, M.J. Long-Term Ambient Fine Particulate Matter Air Pollution and Lung Cancer in a Large Cohort of Never-Smokers. Am. J. Resp. Crit. Care Med. 2011, 184, 1374–1381. [Google Scholar] [CrossRef]
  6. Tao, J.; Ho, K.; Chen, L.; Zhu, L.; Han, J.; Xu, Z. Effect of chemical composition of PM2.5 on visibility in Guangzhou, China, 2007 spring. Particuology 2009, 7, 68–75. [Google Scholar] [CrossRef]
  7. Zhou, L.; Chen, X.; Tian, X. The impact of fine particulate matter (PM2.5) on China’s agricultural production from 2001 to 2010. J. Clean. Prod. 2018, 178, 133–141. [Google Scholar] [CrossRef]
  8. Yun, H.; Yi, S.; Kim, Y.P. Dry deposition fluxes of ambient particulate heavy metals in a small city, Korea. Atmos. Environ. 2002, 36, 5449–5458. [Google Scholar] [CrossRef]
  9. Odabasi, M.; Bagiroz, H.O. Sulfate dry deposition fluxes and overall deposition velocities measured with a surrogate surface. Sci. Total Environ. 2002, 297, 193–201. [Google Scholar] [CrossRef]
  10. Wu, H.; Wang, T.; Riemer, N.; Chen, P.; Li, M.; Li, S. Urban heat island impacted by fine particles in Nanjing, China. Sci. Rep. 2017, 7. [Google Scholar] [CrossRef]
  11. Haywood, J.; Boucher, O. Estimates of the direct and indirect radiative forcing due to tropospheric aerosols: A review. Rev. Geophys. 2000, 38, 513–543. [Google Scholar] [CrossRef]
  12. Amanollahi, J.; Tzanis, C.; Abdullah, A.M.; Ramli, M.F.; Pirasteh, S. Development of the models to estimate particulate matter from thermal infrared band of Landsat Enhanced Thematic Mapper. Int. J. Environ. Sci. Technol. 2013, 10, 1245–1254. [Google Scholar] [CrossRef] [Green Version]
  13. Lim, S.S.; Vos, T.; Flaxman, A.D.; Danaei, G.; Shibuya, K.; Adair-Rohani, H.; Amann, M.; Anderson, H.R.; Andrews, K.G.; Aryee, M.; et al. A comparative risk assessment of burden of disease and injury attributable to 67 risk factors and risk factor clusters in 21 regions, 1990–2010: A systematic analysis for the Global Burden of Disease Study 2010. Lancet 2012, 380, 2224–2260. [Google Scholar] [CrossRef]
  14. Al-Saadi, J.; Szykman, J.; Pierce, R.B.; Kittaka, C.; Neil, D.; Chu, D.A.; Remer, L.; Gumley, L.; Prins, E.; Weinstock, L.; et al. Improving national air quality forecasts with satellite aerosol observations. Bull. Am. Meteorol. Soc. 2005, 86, 1249–1264. [Google Scholar] [CrossRef]
  15. Hoff, R.M.; Christopher, S.A. Remote Sensing of Particulate Pollution from Space: Have We Reached the Promised Land? J Air Waste Manag. Assoc. 2009, 59, 645–675. [Google Scholar] [CrossRef] [PubMed]
  16. Kaufman, Y.J.; Sendra, C. Algorithm for automatic atmospheric corrections to visible and near-IR satellite imagery. Int. J. Remote Sens. 2007, 9, 1357–1381. [Google Scholar] [CrossRef]
  17. Liang, S.; Fallah-Adl, H.; Kalluri, S.; Jájá, J.; Kaufman, Y.J.; Townshend, J.R.G. An operational atmospheric correction algorithm for Landsat Thematic Mapper imagery over the land. J. Geophys. Res. 1997, 102, 17173–17186. [Google Scholar] [CrossRef]
  18. Levy, R.C.; Mattoo, S.; Munchak, L.A.; Remer, L.A.; Sayer, A.M.; Patadia, F.; Hsu, N.C. The Collection 6 MODIS aerosol products over land and ocean. Atmos. Meas. Technol. 2013, 6, 2989–3034. [Google Scholar] [CrossRef] [Green Version]
  19. Levy, R.C.; Remer, L.A.; Kleidman, R.G.; Mattoo, S. Global evaluation of the Collection 5 MODIS dark-target aerosol products over land. Atmos. Chem. Phys. 2010, 10, 10399–10420. [Google Scholar] [CrossRef] [Green Version]
  20. Remer, L.A.; Mattoo, S.; Levy, R.C.; Munchak, L.A. MODIS 3 km aerosol product: Algorithm and global perspective. Atmos. Meas. Technol. 2013, 6, 1829–1844. [Google Scholar] [CrossRef]
  21. Lyapustin, A.; Wang, Y.; Laszlo, I.; Kahn, R.; Korkin, S.; Remer, L.; Levy, R.; Reid, J.S. Multiangle implementation of atmospheric correction (MAIAC): 2. Aerosol algorithm. J. Geophys. Res. 2011, 116. [Google Scholar] [CrossRef]
  22. Wei, J.; Sun, L.; Huang, B.; Bilal, M.; Zhang, Z.; Wang, L. Verification, improvement and application of aerosol optical depths in China Part I: Inter-Comparison of NPP-VIIRS and Aqua-MODIS. Atmos. Environ. 2018, 175, 221–233. [Google Scholar] [CrossRef]
  23. Wang, W.; Mao, F.; Pan, Z.; Du, L.; Gong, W. Validation of VIIRS AOD through a Comparison with a Sun Photometer and MODIS AODs over Wuhan. Remote Sens. 2017, 9, 403. [Google Scholar] [CrossRef]
  24. Song, Z.; Fu, D.; Zhang, X.; Han, X.; Song, J.; Zhang, J.; Wang, J.; Xia, X. MODIS AOD sampling rate and its effect on PM2.5 estimation in North China. Atmos. Environ. 2019, 209, 14–22. [Google Scholar] [CrossRef]
  25. Yao, F.; Si, M.; Li, W.; Wu, J. A multidimensional comparison between MODIS and VIIRS AOD in estimating ground-level PM2.5 concentrations over a heavily polluted region in China. Sci. Total Environ. 2018, 618, 819–828. [Google Scholar] [CrossRef]
  26. Liang, F.; Xiao, Q.; Wang, Y.; Lyapustin, A.; Li, G.; Gu, D.; Pan, X.; Liu, Y. MAIAC-based long-term spatiotemporal trends of PM2.5 in Beijing, China. Sci. Total Environ. 2018, 616, 1589–1598. [Google Scholar] [CrossRef]
  27. Sever, L.; Alpert, P.; Lyapustin, A.; Wang, Y.; Chudnovsky, A. An example of aerosol pattern variability over bright surface using high resolution MODIS MAIAC: The eastern and western areas of the Dead Sea and environs. Atmos. Environ. 2017, 165, 359–369. [Google Scholar] [CrossRef]
  28. Mei, L.; Xue, Y.; Xu, H.; Guang, J.; Li, Y.; Wang, Y.; Ai, J.; Jiang, S.; He, X. Validation and analysis of aerosol optical thickness retrieval over land. Int. J. Remote Sens. 2012, 33, 781–803. [Google Scholar] [CrossRef]
  29. Chudnovsky, A.A.; Kostinski, A.; Lyapustin, A.; Koutrakis, P. Spatial scales of pollution from variable resolution satellite imaging. Environ. Pollut. 2013, 172, 131–138. [Google Scholar] [CrossRef]
  30. Emili, E.; Lyapustin, A.; Wang, Y.; Popp, C.; Korkin, S.; Zebisch, M.; Wunderle, S.; Petitta, M. High spatial resolution aerosol retrieval with MAIAC: Application to mountain regions. J. Geophys. Res. 2011, 116. [Google Scholar] [CrossRef] [Green Version]
  31. Mei, L.; Strandgren, J.; Rozanov, V.; Vountas, M.; Burrows, J.P.; Wang, Y. A study of the impact of spatial resolution on the estimation of particle matter concentration from the aerosol optical depth retrieved from satellite observations. Int. J. Remote Sens. 2019, 40, 7084–7112. [Google Scholar] [CrossRef]
  32. Strandgren, J.; Mei, L.; Vountas, M.; Burrows, J.P.; Lyapustin, A.; Wang, Y. Study of satellite retrieved aerosol optical depth spatial resolution effect on particulate matter concentration prediction. Atmos. Chem. Phys. Discuss. 2014, 14, 25869–25899. [Google Scholar] [CrossRef] [Green Version]
  33. Liu, C.H.; Chen, A.J.; Liu, G.R. An image-Based retrieval algorithm of aerosol characteristics and surface reflectance for satellite images. Int. J. Remote Sens. 1996, 17, 3477–3500. [Google Scholar] [CrossRef]
  34. Wang, Z.; Chen, L.; Hui, G.; Gao, H. Modified DDV method of aerosol optical depth inversion over land surfaces from CBERS02B. J. Remote Sens. 2009, 13, 1053–1066. [Google Scholar] [CrossRef]
  35. Wang, Z.; Yang, S.; Zeng, Q.; Wang, Y. Retrieval of aerosol optical depth for Chongqing using the HJ-1 satellite data. J. Meteorol. Res. 2017, 31, 586–596. [Google Scholar] [CrossRef]
  36. Bao, F.; Gu, X.; Cheng, T.; Wang, Y.; Guo, H.; Chen, H.; Wei, X.; Xiang, K.; Li, Y. High-Spatial-Resolution Aerosol Optical Properties Retrieval Algorithm Using Chinese High-Resolution Earth Observation Satellite I. IEEE Trans. Geosci. Remote 2016, 54, 5544–5552. [Google Scholar] [CrossRef]
  37. Ou, Y.; Chen, F.; Zhao, W.; Yan, X.; Zhang, Q. Landsat 8-Based inversion methods for aerosol optical depths in the Beijing area. Atmos. Pollut. Res. 2017, 8, 267–274. [Google Scholar] [CrossRef]
  38. Wu, J.; Xie, W.; Li, W.; Li, J. Effects of Urban Landscape Pattern on PM2.5 Pollution—A Beijing Case Study. PLoS ONE 2015, 10, 142449. [Google Scholar] [CrossRef]
  39. Zhang, T.; Zhu, Z.; Gong, W.; Zhu, Z.; Sun, K.; Wang, L.; Huang, Y.; Mao, F.; Shen, H.; Li, Z.; et al. Estimation of ultrahigh resolution PM2.5 concentrations in urban areas using 160 m Gaofen-1 AOD retrievals. Remote Sens. Environ. 2018, 216, 91–104. [Google Scholar] [CrossRef]
  40. Tang, C.; Coull, B.A.; Schwartz, J.; Lyapustin, A.I.; Di, Q.; Koutrakis, P. Developing particle emission inventories using remote sensing (PEIRS). J. Air Waste Manag. Assoc. 2017, 67, 53–63. [Google Scholar] [CrossRef]
  41. Shi, Y.; Ho, H.C.; Xu, Y.; Ng, E. Improving satellite aerosol optical Depth-PM2.5 correlations using land use regression with microscale geographic predictors in a high-Density urban context. Atmos. Environ. 2018, 190, 23–34. [Google Scholar] [CrossRef]
  42. Koelemeijer, R.B.A.; Homan, C.D.; Matthijsen, J. Comparison of spatial and temporal variations of aerosol optical thickness and particulate matter over Europe. Atmos. Environ. 2006, 40, 5304–5315. [Google Scholar] [CrossRef]
  43. Wang, Z.; Chen, L.; Tao, J.; Zhang, Y.; Su, L. Satellite-Based estimation of regional particulate matter (PM) in Beijing using vertical-and-RH correcting method. Remote Sens. Environ. 2010, 114, 50–63. [Google Scholar] [CrossRef]
  44. Gong, W.; Huang, Y.; Zhang, T.; Zhu, Z.; Ji, Y.; Xiang, H. Impact and Suggestion of Column-to-Surface Vertical Correction Scheme on the Relationship between Satellite AOD and Ground-Level PM2.5 in China. Remote Sens. 2017, 9, 1038. [Google Scholar] [CrossRef]
  45. Liu, Y.; Chen, S.; Xu, J.; Liu, X.; Wu, Y.; Zhou, L.; Cheng, J.; Ma, H.; Zheng, J.; Lin, D.; et al. The Association between Air Pollution and Outpatient and Inpatient Visits in Shenzhen, China. Int. J. Environ. Res. Public Health 2018, 15, 178. [Google Scholar] [CrossRef] [PubMed]
  46. Kaufman, Y.J.; Wald, A.E.; Remer, L.A.; Gao, B.C.; Li, R.R.; Flynn, L. The MODIS 2.1-mu m channel—Correlation with visible reflectance for use in remote sensing of aerosol. IEEE Trans. Geosci. Remote 1997, 35, 1286–1298. [Google Scholar] [CrossRef]
  47. Zhang, L.; Xu, S.; Wang, L.; Cai, K.; Ge, Q. Retrieval and Validation of Aerosol Optical Depth by using the GF-1 Remote Sensing Data. IOP Conf. Ser. 2017, 68, 12001. [Google Scholar] [CrossRef] [Green Version]
  48. Vermote, E.F.; Tanre, D.; Deuze, J.L.; Herman, M.; Morcette, J.J. Second Simulation of the Satellite Signal in the Solar Spectrum, 6S: An overview. IEEE Trans. Geosci. Remote 1997, 35, 675–686. [Google Scholar] [CrossRef]
  49. Veefkind, J.P.; van der Hage, J.C.H.; Ten Brink, H.M. Nephelometer derived and directly measured aerosol optical depth of the atmospheric boundary layer. Atmos. Res. 1996, 41, 217–228. [Google Scholar] [CrossRef]
  50. Chen, Q.; Yuan, Y.; Huang, X.; Jiang, Y.; Tan, H. Estimation of surface-level PM2.5 concentration using aerosol optical thickness through aerosol type analysis method. Atmos. Environ. 2017, 159, 26–33. [Google Scholar] [CrossRef]
  51. Zheng, S.; Pozzer, A.; Cao, C.X.; Lelieveld, J. Long-term (2001–2012) concentrations of fine particulate matter (PM2.5) and the impact on human health in Beijing, China. Atmos. Chem. Phys. 2015, 15, 5715–5725. [Google Scholar] [CrossRef]
  52. Yang, Y.H.; Qu, Q.; Liu, S.X.; Li, X.; Zhong, P.Y.; Tau, J. Chemical Compositions in PM2.5 and Its Impact on Visibility in Summer in Pearl River Delta, China. Huanjing Kexue 2015, 36, 2758–2767, (In Chinese with English Abstract). [Google Scholar] [CrossRef]
  53. Yao, T.; Huang, X.; He, L.; Min, H.; Sun, T.; Lian, X.; Yun, L.; Zeng, L.; Zhang, Y. High time resolution observation and statistical analysis of atmospheric light extinction properties and the chemical speciation of fine particulates. Sci. China Chem. 2010, 53, 1801–1808. [Google Scholar] [CrossRef]
  54. Huang, X.; Yun, H.; Gong, Z.; Li, X.; He, L.; Zhang, Y.; Hu, M. Source apportionment and secondary organic aerosol estimation of PM2.5 in an urban atmosphere in China. Sci. China Earth Sci. 2014, 57, 1352–1362. [Google Scholar] [CrossRef]
  55. Zheng, J.; Zhang, L.; Che, W.; Zheng, Z.; Yin, S. A highly resolved temporal and spatial air pollutant emission inventory for the Pearl River Delta region, China and its uncertainty assessment. Atmos. Environ. 2009, 43, 5112–5122. [Google Scholar] [CrossRef]
  56. Louie, P.; Watson, J.; Chow, J.; Chen, A.; Sin, D.; Lau, A. Seasonal characteristics and regional transport of PM2.5 in Hong Kong. Atmos. Environ. 2005, 39, 1695–1710. [Google Scholar] [CrossRef]
  57. Chudnovsky, A.; Tang, C.; Lyapustin, A.; Wang, Y.; Schwartz, J.; Koutrakis, P. A critical assessment of high-resolution aerosol optical depth retrievals for fine particulate matter predictions. Atmos. Chem. Phys. 2013, 13, 10907–10917. [Google Scholar] [CrossRef] [Green Version]
  58. Ma, Z.; Liu, Y.; Zhao, Q.; Liu, M.; Zhou, Y.; Bi, J. Satellite-derived high resolution PM2.5 concentrations in Yangtze River Delta Region of China using improved linear mixed effects model. Atmos. Environ. 2016, 133, 156–164. [Google Scholar] [CrossRef]
  59. Li, Z.; Roy, D.P.; Zhang, H.K.; Vermote, E.F.; Huang, H. Evaluation of Landsat-8 and Sentinel-2A Aerosol Optical Depth Retrievals across Chinese Cities and Implications for Medium Spatial Resolution Urban Aerosol Monitoring. Remote Sens. 2019, 11, 122. [Google Scholar] [CrossRef]
  60. Munchak, L.A.; Levy, R.C.; Mattoo, S.; Remer, L.A.; Holben, B.N.; Schafer, J.S.; Hostetler, C.A.; Ferrare, R.A. MODIS 3 km aerosol product: Applications over land in an urban/suburban region. Atmos. Meas. Technol. 2013, 6, 1747–1759. [Google Scholar] [CrossRef]
  61. De Keukelaere, L.; Sterckx, S.; Adriaensen, S.; Knaeps, E.; Reusen, I.; Giardino, C.; Bresciani, M.; Hunter, P.; Neil, C.; Van der Zande, D.; et al. Atmospheric correction of Landsat-8/OLI and Sentinel-2/MSI data using iCOR algorithm: Validation for coastal and inland waters. Eur. J. Remote Sens. 2018, 51, 525–542. [Google Scholar] [CrossRef]
  62. Martins, V.; Barbosa, C.; de Carvalho, L.; Jorge, D.; Lobo, F.; Novo, E. Assessment of Atmospheric Correction Methods for Sentinel-2 MSI Images Applied to Amazon Floodplain Lakes. Remote Sens. 2017, 9, 322. [Google Scholar] [CrossRef]
Figure 1. Location of Shenzhen City, its air monitoring stations, and the meteorological stations in this study.
Remotesensing 11 02223 g001
Figure 2. Examples of the derived Gaofen-1 (GF-1) aerosol optical depth (AOD) in Shenzhen City compared with MOD04_3K AOD on two dates: 8 July 2016 (a polluted day) and 29 July 2016 (an unpolluted day). The grey areas are bright pixels without derived AOD data. Panels at the right are enlarged images of areas around two air monitoring stations.
Remotesensing 11 02223 g002
Figure 3. Correlation between the aggregated Gaofen-1 (GF-1) aerosol optical depth (AOD) and the MOD04_3K AOD: (a) only dates for which both types of AOD data were available, and (b) for the whole study period.
Remotesensing 11 02223 g003
Figure 4. Impact of spatial scales on annual and seasonal correlations between PM2.5 concentrations and GF-1 uncorrected aerosol optical depth (O_AOD), humidity-corrected AOD (AOD*), uncorrected and humidity-corrected near-surface extinction coefficients ( k a , 0 , and k a , 0 * ) in Shenzhen City, China from 2015 to 2017.
Remotesensing 11 02223 g004
Figure 5. Illustration of the scale mismatch in aerosol optical depth (AOD)–PM2.5 correlation caused by (a) the “scale” measurement of PM2.5 and the snapshot of satellite-based AOD; and (b) tilted imaging of a remote sensing satellite. The object sizes and scales in this figure are for illustrative purposes in this study only, and do not represent the realistic situation.
Remotesensing 11 02223 g005
Table 1. Descriptive statistics of PM2.5 concentrations, planetary boundary layer height (PBLH), and relative humidity (RH).
2015–2017 (N = 253)Spring (N = 47)Summer (N = 55)Autumn (N = 42)Winter (N = 109)
PM2.5 concentrations (μg/m3)mean4329323656
S.D.22.68.7723.911.122.0
kurtosis2.29−0.28−1.38−0.963.20
skewness1.03−0.800.580.011.41
PBLH (m)mean1032103611971036945
S.D.177.8133.052.64117.1195.3
kurtosis−0.77−0.64−1.34−1.71−1.30
skewness−0.62−0.71−0.40−0.150.02
RH (%)mean5048595744
S.D.14.012.87.026.2615.9
kurtosis−0.46−0.740.970.80−0.91
skewness−0.410.280.540.840.20
Table 2. Descriptive statistics of Pearson correlation coefficients (R) and correlation tests between GF-1 uncorrected aerosol optical depth (O_AOD) or humidity-corrected AOD (AOD*) and PM2.5 concentrations, together with the corresponding correlations with uncorrected and humidity-corrected near-surface extinction coefficients ( k a , 0 , and k a , 0 * ). AOD were determined at spatial scales ranging from 40 to 5000 m.
O_AOD k a , 0 A O D * k a , 0 *
Rmean0.2920.2970.3620.367
S.D.0.0160.0250.0110.018
minimum0.2340.2640.3340.340
maximum0.3290.3740.3920.423
p valuesmean2.18 × 10−45.76 × 10−56.61 × 10−62.80 × 10⁻⁶
minimum1.10 × 10−62.53 × 10−72.94 × 10−98.65 × 10⁻¹⁰
maximum1.03 × 10−22.93 × 10−36.29 × 10−42.16 × 10⁻⁴
Table 3. Comparison of mean Pearson correlation coefficients (R) between in situ PM2.5 measurements and GF-1 uncorrected aerosol optical depth (O_AOD), humidity-corrected AOD (AOD*), and the corresponding uncorrected and humidity-corrected near-surface extinction coefficients ( k a , 0 , and k a , 0 * ), and their standard deviations (S.D.) and coefficients of variation (C.V.), determined at different ranges of spatial scales.
Spatial Scales O_AOD k a , 0 A O D * k a , 0 *
40–1000 mmean0.2810.3090.3650.382
S.D.0.0260.0240.0180.020
C.V.9.25%7.77%4.93%5.23%
1020–2000 mmean0.3080.3240.3730.384
S.D.0.0080.0080.0070.007
C.V.2.60%2.47%1.88%1.82%
2020–3000 mmean0.2980.3060.3630.371
S.D.0.0070.0120.0040.007
C.V.2.34%3.92%1.10%1.88%
3020–4000 mmean0.2840.2730.3560.352
S.D.0.0040.0030.0020.002
C.V.1.41%1.10%0.56%0.57%
4020–5000 mmean0.2880.2720.3530.346
S.D.0.0040.0060.0030.005
C.V.1.39%2.21%0.85%1.45%

