Article

Ground-Based MAX-DOAS Observations of CHOCHO and HCHO in Beijing and Baoding, China

1
School of Earth and Space Sciences, University of Science and Technology of China, Hefei 230026, China
2
Key Lab of Environmental Optics & Technology, Anhui Institute of Optics and Fine Mechanics, Chinese Academy of Sciences, Hefei 230031, China
3
Center for Excellence in Regional Atmospheric Environment, Institute of Urban Environment, Chinese Academy of Sciences, Xiamen 361021, China
4
Anhui Province Key Laboratory of Polar Environment and Global Change, USTC, Hefei 230026, China
5
Institute of Environmental Sciences and Engineering, National University of Sciences and Technology, Islamabad 44000, Pakistan
6
School of Environmental science and Optoelectronic Technology, University of Science and Technology of China, Hefei 230026, China
*
Author to whom correspondence should be addressed.
Remote Sens. 2019, 11(13), 1524; https://doi.org/10.3390/rs11131524
Submission received: 18 April 2019 / Revised: 18 June 2019 / Accepted: 22 June 2019 / Published: 27 June 2019

Abstract

:
Glyoxal (CHOCHO) and formaldehyde (HCHO) trace gases were successfully retrieved from a multi-axis differential optical absorption spectroscopy (MAX-DOAS) system in Beijing (39.95°N, 116.32°E) and Baoding (39.15°N, 115.40°E), China. The measurements of these trace gases span the period from May 2017 to April 2018. Higher levels of trace gases were observed in Beijing most likely due to increased transport and industrial activities compared to Baoding. Different time scales were analyzed from seasonal to daily levels. Seasonal variation categorized by wintertime maximum and summertime minimum was observed for CHOCHO, while for HCHO maximum values were recorded during summer at both observation points. Variations in the diurnal cycle of trace gases were examined. The results are consistent with strong links to photo-oxidations of VOCs for HCHO production, whereas the CHOCHO diurnal variation can be related to anthropogenic effects in the evening. Weekends didn’t have any significant effect on both HCHO and CHOCHO. We investigated the temperature dependency of HCHO and CHOCHO. HCHO shows positive correlation with air temperature, which strengthened the argument that HCHO production is linked to photo-oxidation of VOCs. CHOCHO is anti-correlated with air temperature. This suggests that photolysis is a major sink for CHOCHO in Beijing and Baoding. We also investigated the relationship between CHOCHO and HCHO VCDs with enhanced vegetation index (EVI) data obtained from MODIS, which represents a direct relation with biogenic emissions. The positive correlations were observed among monthly mean HCHO VCDs and monthly mean EVI at both monitoring stations. The strong correlation of HCHO with EVI found, suggests that oxidation of isoprene and HCHO production is strongly related, while negative correlation was observed among CHOCHO VCDs and EVI.

1. Introduction

Rapid economic growth has resulted in increased emission levels of pollutants in China [1]. This includes trace gases which also play a crucial role in radiative forcing, climate change and atmospheric chemical processes [2]. Among these gases formaldehyde (HCHO) and glyoxal (CHOCHO) are of vital importance, because they can be used as indicators of volatile organic compounds (VOCs) oxidation In fact a family of VOCs oxidizes to give HCHO as a principle product [3]. Meanwhile, VOCs have been proven important in tropospheric chemistry [4]. The HCHO background in the atmosphere is a result of methane oxidation, however, HCHO can exhibit larger concentrations in the troposphere due to other VOCs. This is important because it is considered a human carcinogen pollutant [5] and can actually impair epithelial cells, [6] damaging the human health. There are two main sources of formaldehyde in the troposphere: primarily, incomplete combustion and secondarily, the photo-oxidation of VOCs. Formaldehyde is also released directly from biogenic sources like vegetation [7]. The lifetime of HCHO is in the order of a few hours. Both dry and wet deposition significantly contribute to the atmospheric removal of HCHO [8].
Like formaldehyde, the presence of glyoxal’s (CHOCHO) has been accredited to the oxidation of VOCs. Emissions from primary sources are predominantly small in comparison to the secondary formation as a consequence of (photo) chemical reactions. Polluted urban environments have high ambient concentrations of glyoxal, alongside areas where high biogenic activity leads to the emission of glyoxal [9,10,11]. In addition, numerous areas with high anthropogenic activities are also found to be hot spots for CHOCHO emissions. CHOCHO is also removed from the atmosphere by dry and wet deposition, by OH oxidation, and SOA (secondary organic aerosol). The short life span of glyoxal, in the order of few hours, renders it to be suitable for use as an indicator of VOC oxidation processes [9].
During the past decade, multi-axis differential optical absorption spectroscopy (MAX-DOAS) has become a commonly employed ground-based instrument to measure HCHO and CHOCHO among other key trace gases. The specific design of the MAX-DOAS instrument helps in the detection of scattered sunlight through different elevation angles. This feature is responsible for the provision of high sensitivity to trace gases [12]. The instrument can measure a wide range of trace gases including HCHO and CHOCHO. MAX-DOAS is commonly employed to have a ground-based measurement of these trace gases [6,13,14].
There have been fairly sparse studies to monitor HCHO and CHOCHO by using the MAX-DOAS instrument in China. Bearing in mind the significance of VOCs in the troposphere, and the part that HCHO and CHOCHO play as tracers of VOCs, further monitoring of HCHO and CHOCHO in megacities is still required.
The capital city of China, Beijing, is reportedly one of the most majorly polluted cities in the country. Rapid urbanization has significantly deteriorated its air quality. The air quality degradation because of the presence of pollutants, and the subsequent formation of particulate matter and tropospheric ozone is a consequence of the developments for a better lifestyle. On average, the city had seen around 50 polluted days in 1980 [15], compared to 2015, when around 50 days were observed to be of better air quality. One of the other highly polluted cities of China is Baoding. The city is located in Hebei province and is at a distance of about 150 km away from Beijing. Baoding houses about 10 million people, and has been regarded as one of China’s most polluted cities. There are fairly sparse studies reported for trace gas measurements in Baoding. To the best of the authors of this articles’ knowledge, long term ground-based observations of CHOCHO in China, for characterization of seasonal cycles and possible sources, is not reported in the literature.
Taking into consideration the aforementioned facts, it can be implied that Beijing and Baoding are considered to be the potential sites for the observation of pollutants like HCHO and CHOCHO. Moreover, the continuous air quality monitoring of the metropolitan cities holds enough potential to understand their footprints and sociology.
This study used year-round ground-based MAX-DOAS observations in order to record the column densities and report the temporal distributions of CHOCHO and HCHO in metropolitan cities, Beijing and Baoding. It is organized as follows: In Section 2 we describe the instruments and observational sites, as well as the DOAS methodology applied to them. Also, additional datasets used for comparisons and new assessments are referenced. Based on the described methods, the time series of concentrations for HCHO and CHOCHO obtained are shown in Section 3.1, which allowed us to perform specific assessments on seasonal, monthly, weekly and daily variations over the observational sites analyzed in Section 3.2, Section 3.3 and Section 3.4. We complement those analyses with a temperature dependence study and comparison with EVI data in Section 3.5 and Section 3.6. This is followed by a discussion of the results and our scientific conclusions.

2. Materials and Methods

2.1. Instrument

MAX-DOAS (multi-axis DOAS) is an instrument used for the observation of several trace gases based on DOAS (differential optical absorption spectroscopy) method. The device contains a spectrometer (Avaspec-UL2048L-USB2) with 300–460 nm of spectral range and 0.6 nm resolution. Principally, the instrument uses scattered sunlight as the main source of light, and spectral observations are made at different viewing angles to obtain information about species of concern [16]. The day-to-day measurements were automatically controlled by an in-built processor.

2.2. Observation Sites

(1) Beijing
The instrument was fixed on the top of the Chinese Academy of Meteorological Sciences (CAMS) building in Beijing. This building is located in the Haidian district of Beijing (39.95°N, 116.32°E), which is an area of 431 square km with a population of about 3.28 million. It lies towards the northwestern part of the urban core. The altitude of the Beijing site is about 56 m above sea level.
(2) Baoding
The second observation site was the environmental monitoring superstation in Baoding. This station is located in Gucheng town of Baoding city (39.15°N, 115.40°E). This station is about 118 km away from the CAMS in Beijing. The altitude of the Baoding site is about 23 m above sea level. Figure 1 shows location of both Beijing and Baoding monitoring stations.

2.3. DOAS Analysis

The MAX-DOAS instruments provide accurate tropospheric column retrievals of trace gases by performing several measurements at different elevation viewing angles (1°, 2°, 3°, 4°, 5°, 6°, 8°, 10°, 15°, 30° and 90°) for a fixed azimuth angle (145°), then using the zenith angle as a reference, the method minimizes the stratospheric contributions to the tropospheric column. The QDOAS software (version 2.109.4) developed by BIRA-IASB is used to analyze measured spectra. In a previous study [17] sensitivity tests performed to ascertain the best possible retrieval settings for HCHO and CHOCHO are described. The wavelength windows selected to perform the spectral fit, as well as the absorption cross-sections used by the DOAS fitting algorithm is described in Table 1. Additionally, wavelength was calibrated using high resolution solar spectrum [18]. Before the spectral analysis, the measured spectra was corrected using the offset and dark current spectra.
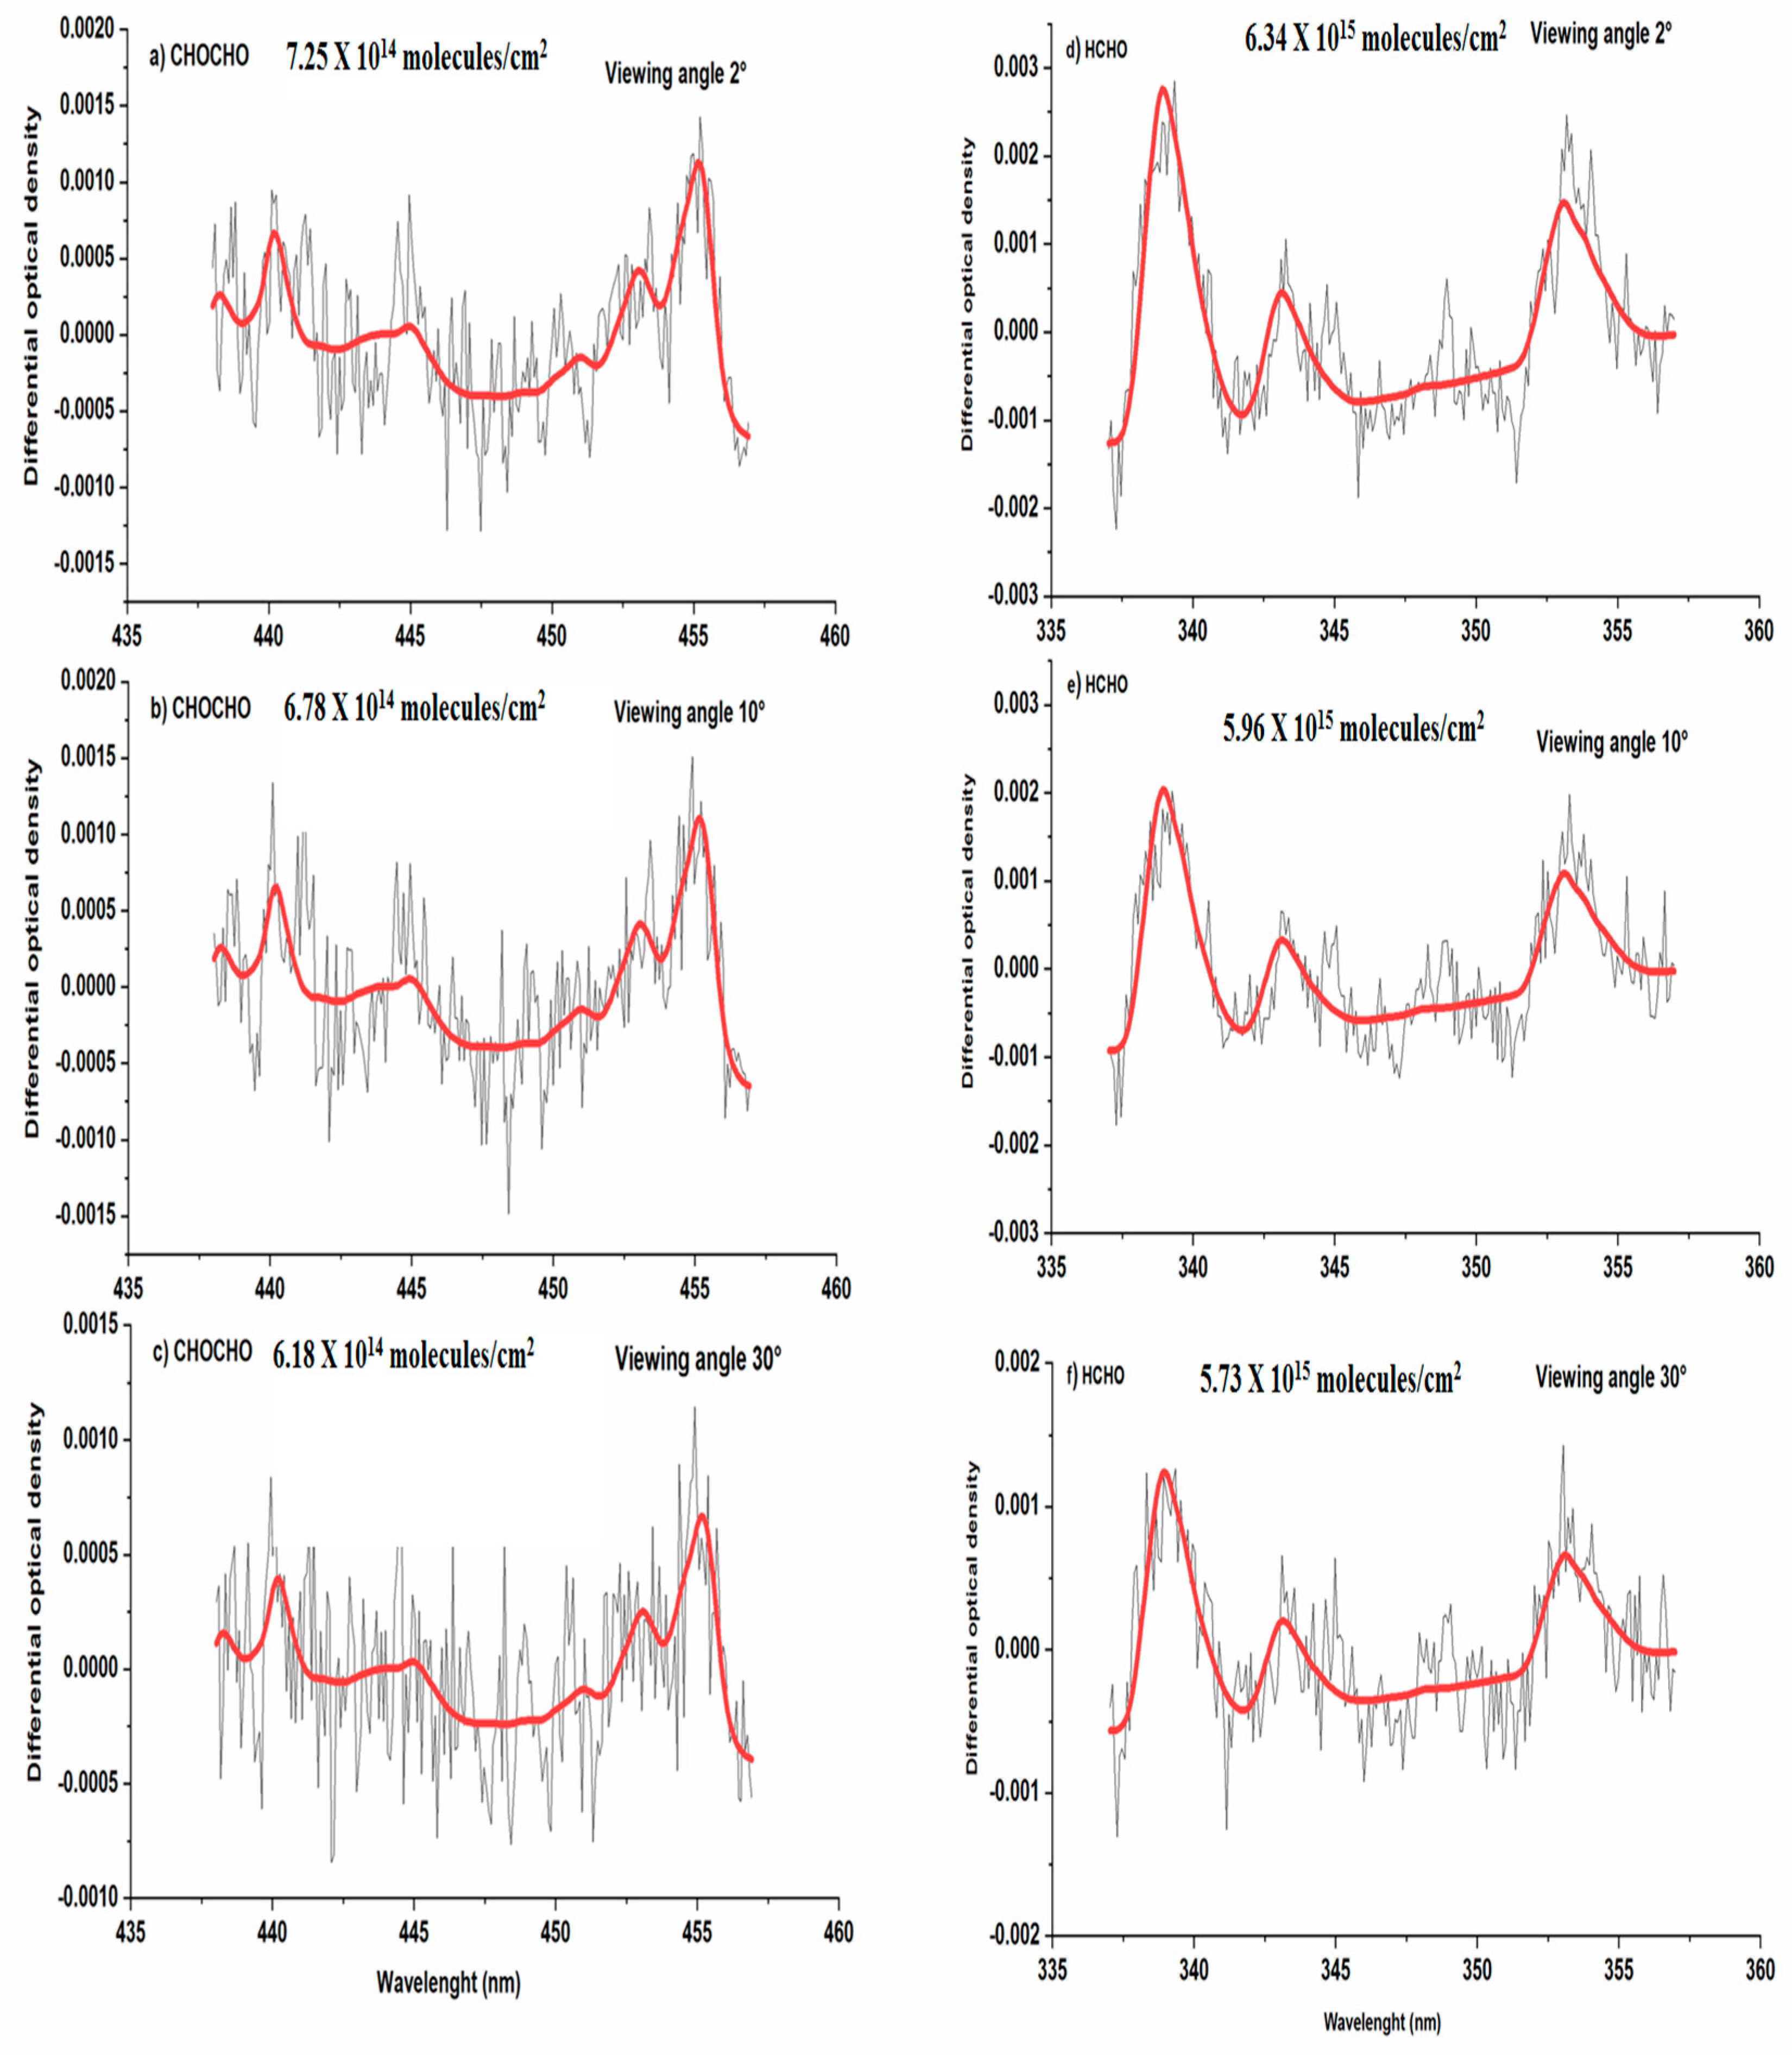
The spectrum at 90° was chosen as Fraunhofer reference spectrum for the fitting of the spectra recorded at different viewing angles in every scanning series. Thus, the outcomes obtained are differential slant column densities (dSCDs). To remove contribution from atmospheric scattering processes data with RMS higher than 0.002 and Solar zenith angle SZA higher than 75° were filtered out. The average instrument error for MAX-DOAS is usually represented by RMS. To illustrate the process, Figure 2 shows typical DOAS spectral fitting of the spectra obtained at different viewing angles of 2°, 10° and 30° on 28 June 2017 at Baoding station. The quality of the fit is relatively reduced at higher elevation angles. The dSCD value of trace gases decreases for higher elevation angles as shown in Figure 2. The fittings showed the obvious absorption structures and low residuals, this reveals that the spectral fitting is of good quality. In the case of the DOAS fit for CHOCHO, the wavelength interval, around 441 to 445 nm, showed relatively large difference between the smooth red line and the black line. The similar DOAS fit of CHOCHO with a relatively large difference between the smooth red line and the black line around 441 to 445 nm is reported in different studies [25].
To calculate the vertical column densities (VCDs) from dSCDs of atmospheric trace gases, differential air mass factors (dAMFs) are used [26].
V C D t r o p = d S C D α d A M F α
α is the elevation angle used for the corresponding observation.
Where dAMF is:
d A M F α = A M F α A M F 90 °
V C D t r o p = d S C D α A M F α A M F 90 °
AMF can be calculated using geometrical approximation approach [27].
A M F = 1 s i n ( α )
then Equation (3) becomes:
V C D t r o p = d S C D α 1 / s i n ( α ) 1

Error Estimation

The error is estimated for MAX-DOAS results by considering the following two different sources of error.
(1) DOAS fitting error
The DOAS fitting error to VCD error by using geometric approximation is derived as shown in the Equation (6).
V C D f i t t i n g   e r r o r = V C D e r r o r V C D = 2 ( d S C D 2 α 90 ° + d S C D 2 α = 90 ° ) 2 ( 1 s i n α 1 ) × V C D
The hourly average error for HCHO VCDs at Beijing and Baoding sites varies from 5% to 31% with an average around 18% throughout the observation period. Whereas, the hourly average error for CHOCHO VCDs varies from 10% to 40% with an average around 31% throughout the measurement time period.
(2) Systematic error for geometric approximation
The systematic error for AMF calculation by geometric approximation depends on layer height of aerosols and trace gases. The radiative transfer calculation of AMFs for HCHO VCDs is done by using SCIATRAN 2.2 RTM (radiative transfer model) to calculate more exact the HCHO VCDrtm.
The relative difference between VCDgeo and VCDrtm is considered as a systematic error [28]. This difference is calculated as shown in the following equation:
S y s t e m a t i c   E r r o r = V C D g e o V C D r t m V C D r t m
The relative difference explains the error due to geometric approximation which has limited validity. The systematic error becomes high when the aerosol load is large. The lowest systematic error is observed for 15° viewing angle. The hourly average systematic error of HCHO VCDs is 20%.
(3) Total errors
The two error sources discussed above are generally independent. Therefore, total error is calculated by summing all the error terms by Gaussian error propagation.
Error t o t a l =   ( D O A S   f i t t i n g   e r r o r ) 2 + ( S y s t e m a t i c   e r r o r ) 2
The total estimated error for HCHO VCDs is around 27%, whereas for CHOCHO VCDs the estimated error is 31%.

2.4. Ozone Monitoring Instrument Satellite Data

The ozone monitoring instrument (OMI) was launched in July 2004. Its spectrometer receives scattered and reflected light signals from earth’s atmosphere and surface. The wavelength range of OMI spans from 270 to 500 nm. In this study, we use USTC OMI tropospheric HCHO product. To generate the USTC OMI HCHO product, the HCHO dSCDs are retrieved from the OMI level 1B UV global radiance data (OML1BRUG) based on the DOAS method. The HCHO VCDs are calculated by using AMF based on the WRF-Chem chemistry transport model simulation results. The satellite observations include the monthly OMI tropospheric HCHO columns for the year 2017, selected for pixels within +- 0.5 latitude/longitude rectangular areas around the observation sites at Beijing and Baoding stations. The data with cloud fraction above 0.4 was filtered.
While for CHOCHO, we used Alvarado et al.’s [29] monthly data from an OMI satellite for the year 2007 over Beijing.

2.5. Ancillary Data

EVI: MODIS vegetation index products give spatial and temporal comparisons of vegetation cover. The level-3 monthly gridded enhanced vegetation index (EVI) derived from the moderate resolution imaging spectrometer (MODIS) was used to support the analysis. The spatial resolution of EVI data is 0.05° × 0.05°.
The EVI data were obtained from (https://giovanni.gsfc.nasa.gov/giovanni/).
Temperature: The surface temperature data for Beijing and Baoding was used for analysis. The daily mean temperature for both observation sites was obtained from NOAA’s National Centers for Environmental Information (NCEI) (https://www.ncdc.noaa.gov/).

3. Results

3.1. Time Series of HCHO and CHOCHO

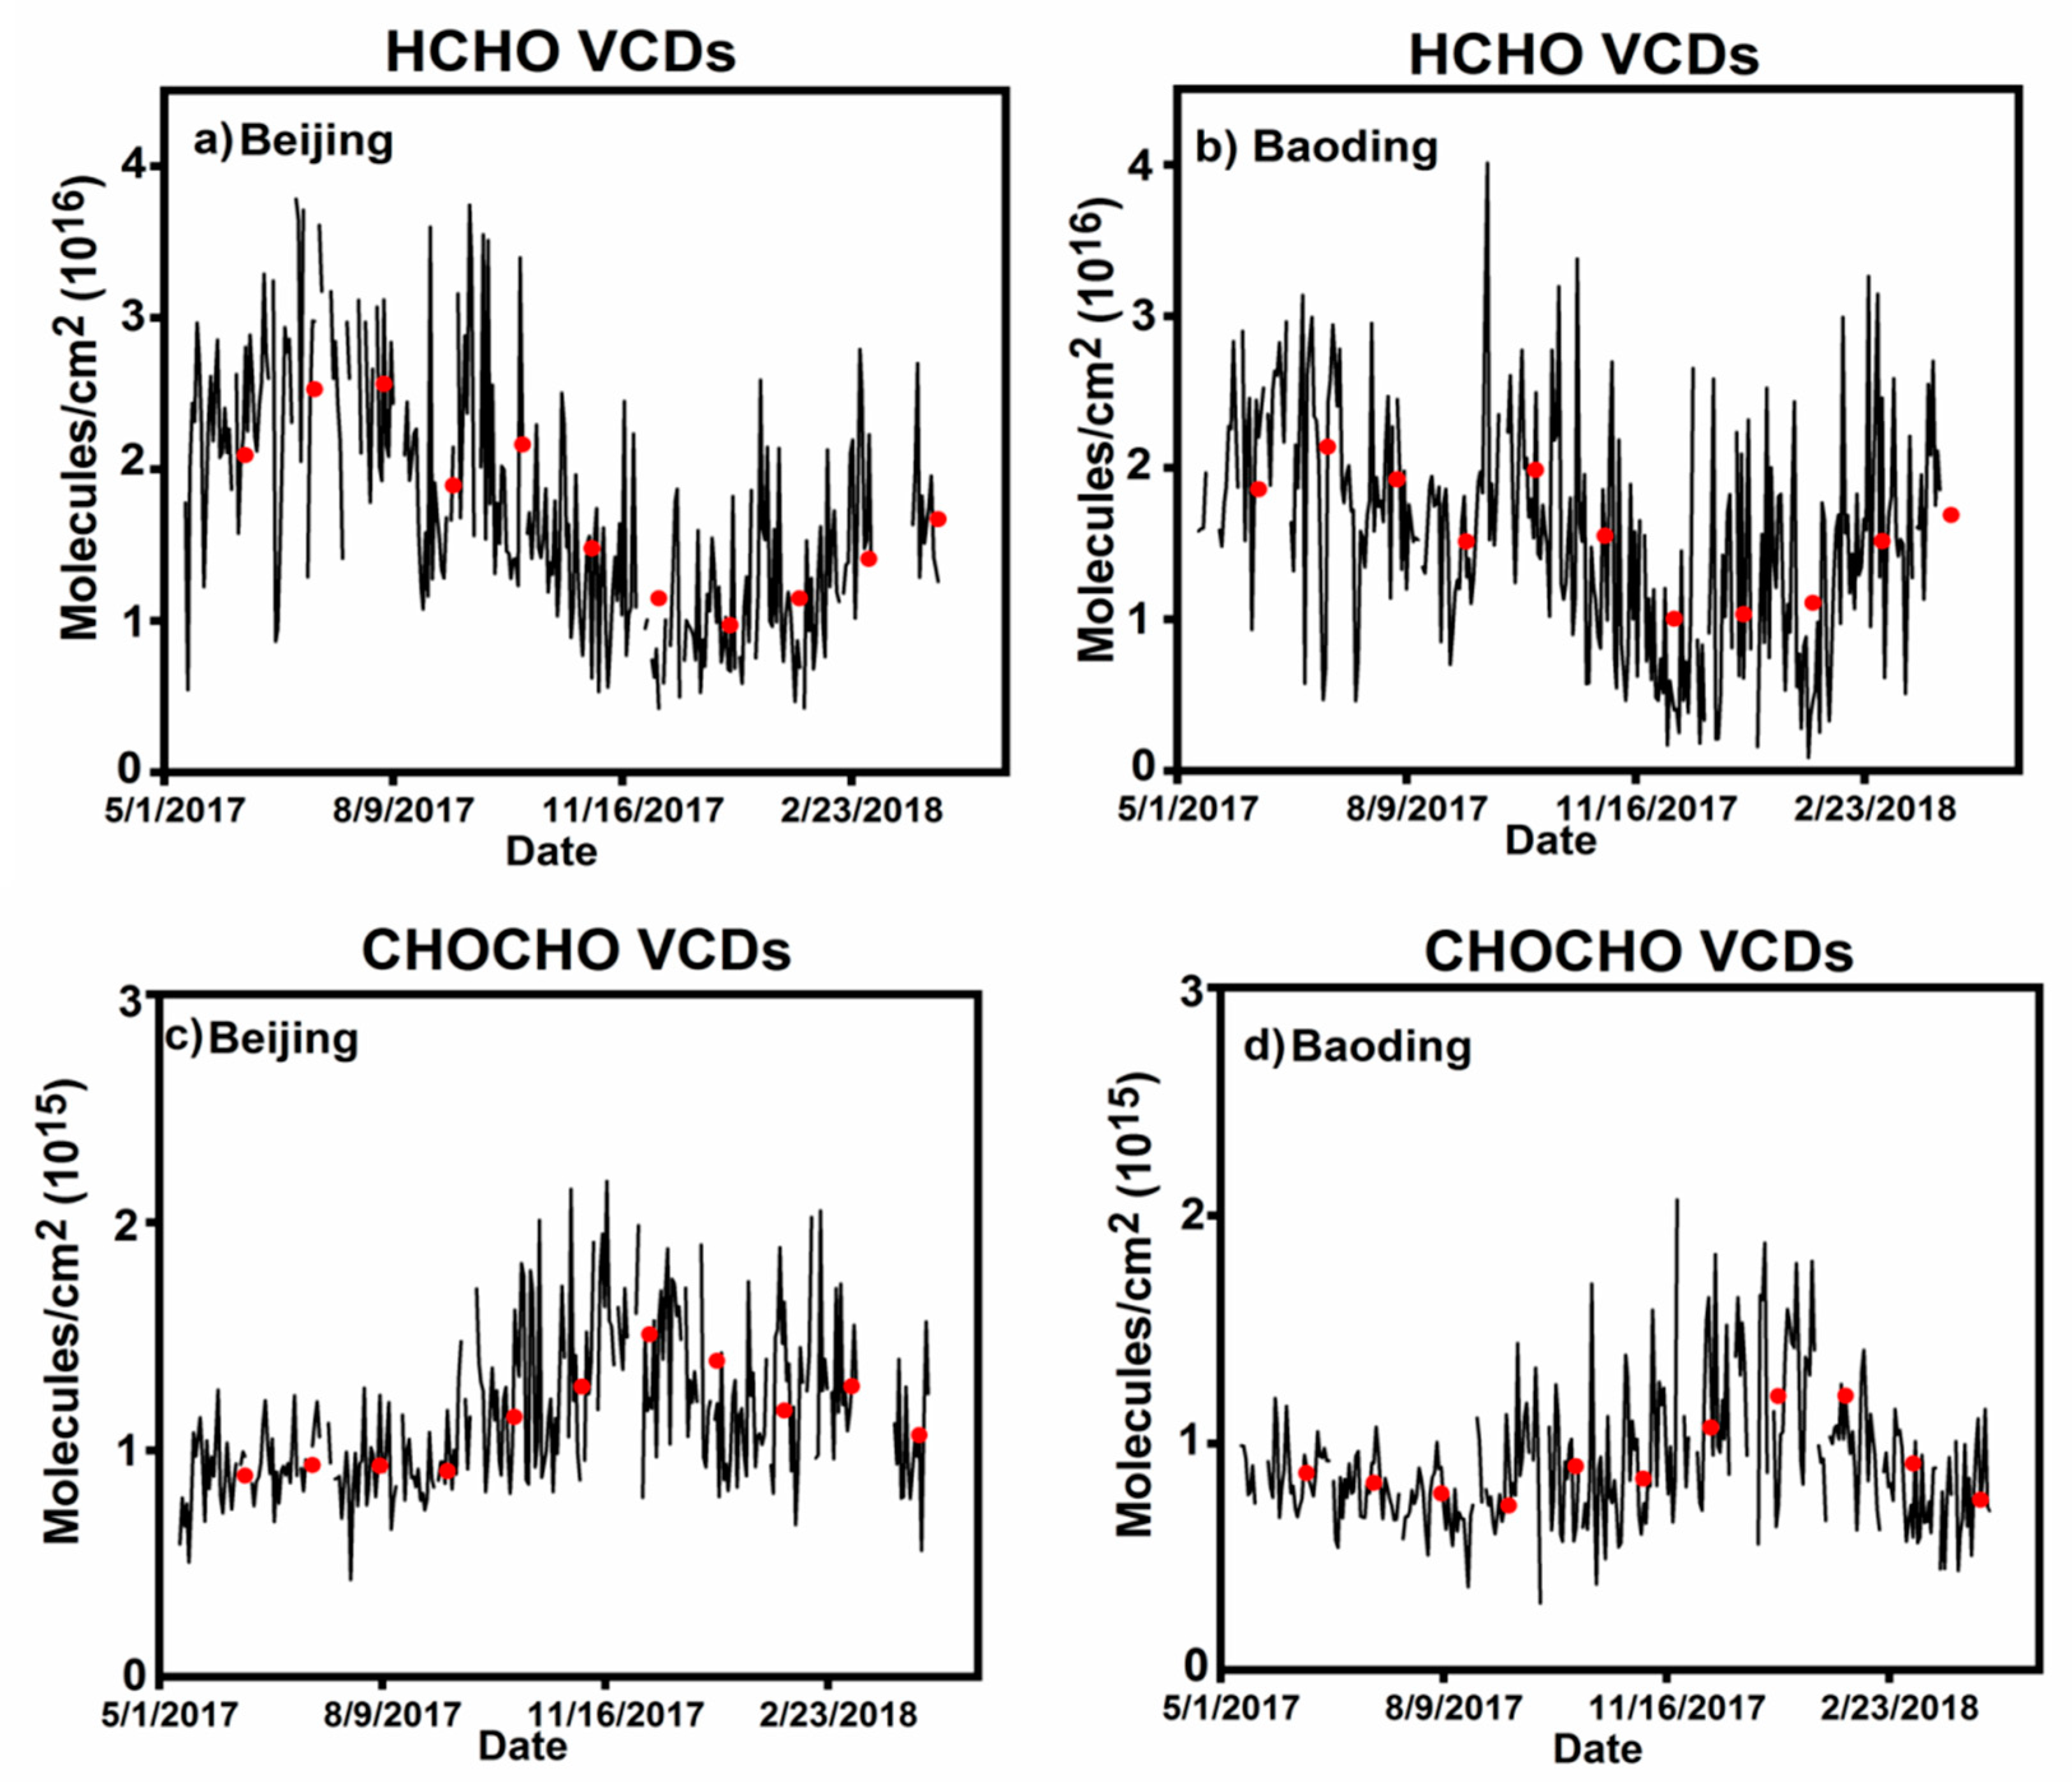
The spectral measurements were done from May 2017 to April 2018 in Beijing and Baoding, China. The spectral analysis done by QDOAS and the geometric approximation used for calculation of AMF resulted in the VCDs of HCHO and CHOCHO. The time series of daily averaged vertical column densities of HCHO and CHOCHO in Beijing and Baoding are presented in Figure 3. It is worth mentioning that there are a few intervals in the time series without measurements. These gaps are due to instrumental problems. The daily averaged VCDs of CHOCHO in Beijing vary from 4.32 × 10¹⁴ molec/cm2 to 2.18 × 10¹⁵ molec/cm2 with an average of 1.16 × 10¹⁵ molec/cm2 throughout the measurement period. The corresponding CHOCHO values in Baoding vary from 3.72 × 10¹⁴ molec/cm2 to 2.07 × 10¹⁵ molec/cm2 with an average value of 9.09 × 10¹⁴ molec/cm2 throughout the observations. The VCDs of CHOCHO in Beijing are on average 28% higher than in Baoding. The daily averaged VCDs of HCHO in Beijing vary from 4.23 × 10¹⁵ molec/cm2 to 3.78 × 10¹⁶ molec/cm2 with an average value of 1.70 × 10¹⁶ molec/cm2, whereas for Baoding the value range is from 2.29 × 10¹⁵ molec/cm2 to 4.01 × 10¹⁶ molec/cm2 with an average value of 1.57 × 10¹⁶ molec/cm2. Overall, an increase of 9% in values of HCHO from Baoding to Beijing is observed.

3.2. Seasonal Variation

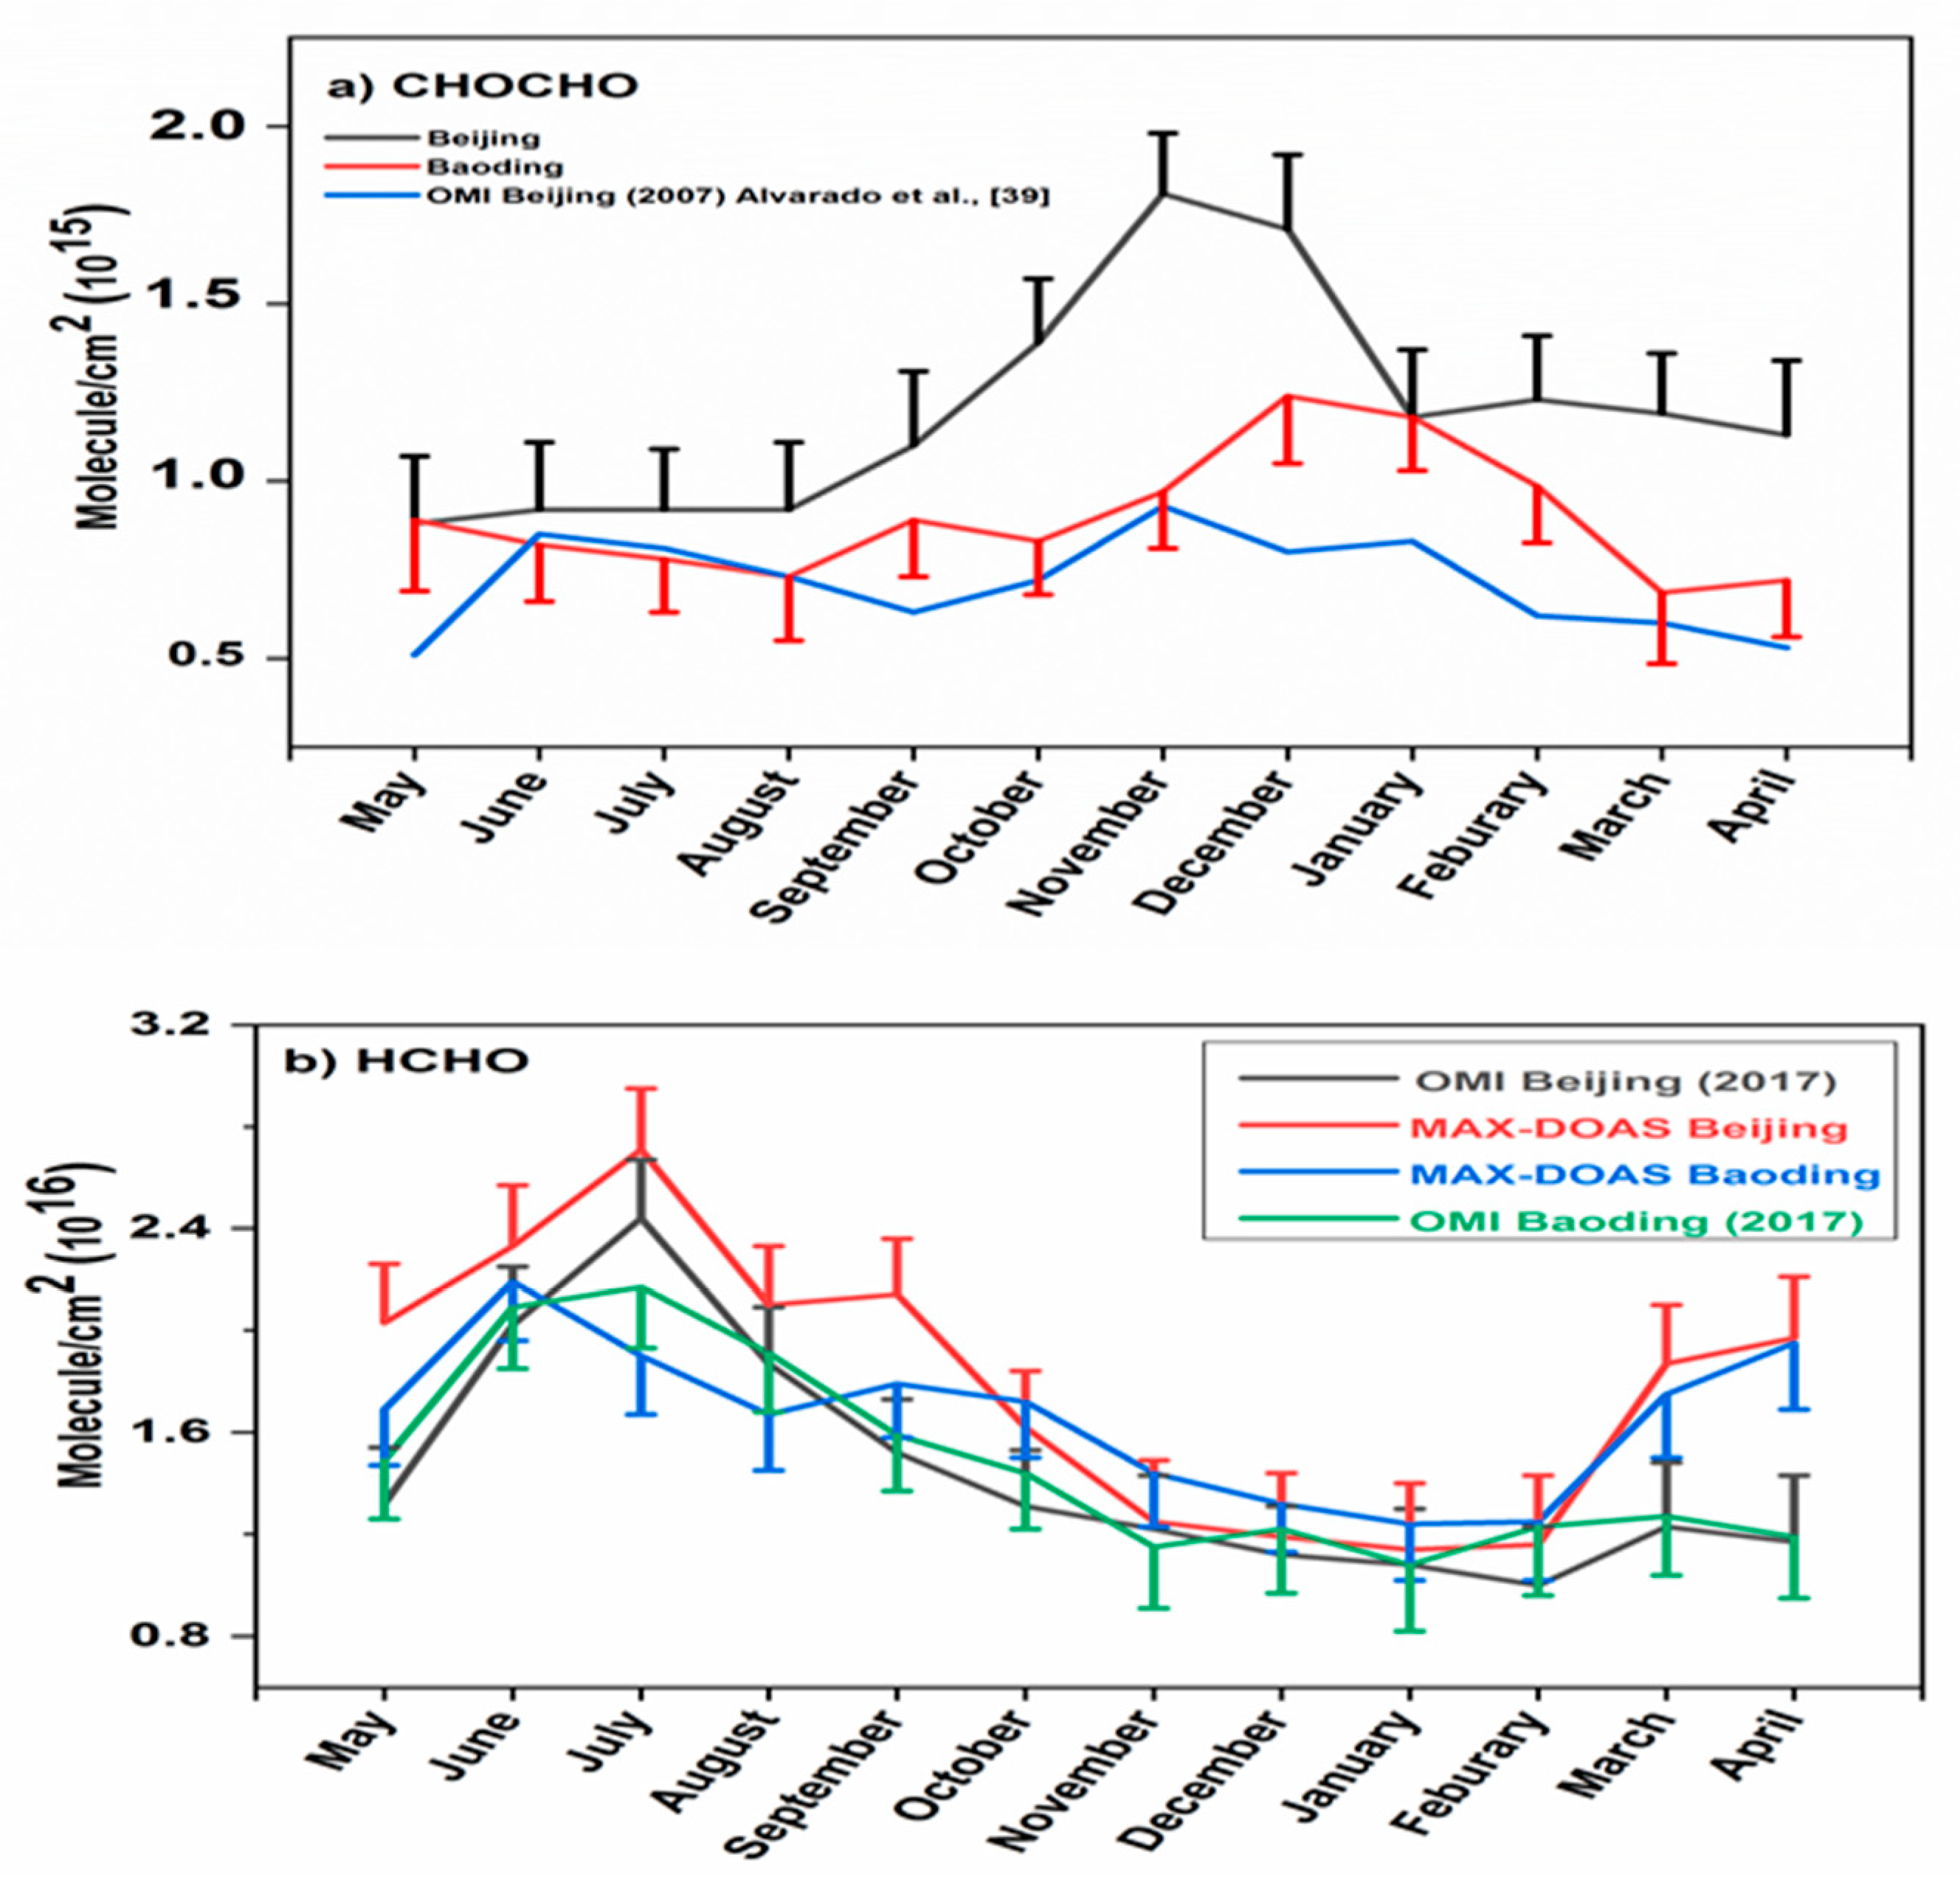
The measurements for CHOCHO in Beijing and Baoding showed an interesting phenomenon with maxima in winter and minima during the summer season. However, this finding is inconsistent with our well-known understanding of the seasonal variation of glyoxal. The whys and wherefores behind this phenomenon need to be investigated further and continuous monitoring of CHOCHO over different regions in China is suggested. The monthly and seasonal time series for CHOCHO showed good correlation with NO2 cycle reported in previous studies [30], which suggests the presence of possible anthropogenic sources for CHOCHO production. Figure 4 shows monthly variations of tropospheric HCHO and CHOCHO VCDs in Beijing and Baoding.
The HCHO VCDs at both stations follow a similar annual cycle. Higher levels were observed in summer, whereas reduction in HCHO level was noted during the winter season. The increase in HCHO during summer is considered to be due to the photochemical production of HCHO, biogenic emissions during growing season and burning of biomass in spring and autumn [31]. Monthly cycles for CHOCHO and HCHO obtained from MAX-DOAS observations were compared with OMI satellite data. The HCHO monthly cycles from both MAX-DOAS and OMI datasets followed a similar behaviour at Beijing and Baoding stations. However, the OMI observations were lower in magniutde as compared to MAX-DOAS observations
The CHOCHO monthly cycle from both MAX-DOAS and OMI observations also followed an almost similar trend but it is important to mention anomlies do exist in some months e.g., June.
Figure 5 shows a summary of CHOCHO and HCHO observed during the summer and winter season. The average HCHO VCDs are higher during summer months compared to winter months for Beijing and Baoding, respectively. Whereas the CHOCHO VCDs showed an increase during the winter season compared to the summer season in Beijing and Baoding. MAX-DOAS and OMI satellite data exhibit similar behavior for concentrations of CHOCHO and HCHO in different seasons. The ratio of winter: Summer for CHOCHO VCDs in Beijing and Baoding is 1.35 and 1.20, respectively. Whereas, the ratio of winter: Summer for HCHO VCDs in Beijing and Baoding is 0.60 and 0.80, respectively.

3.3. Diurnal Cycle

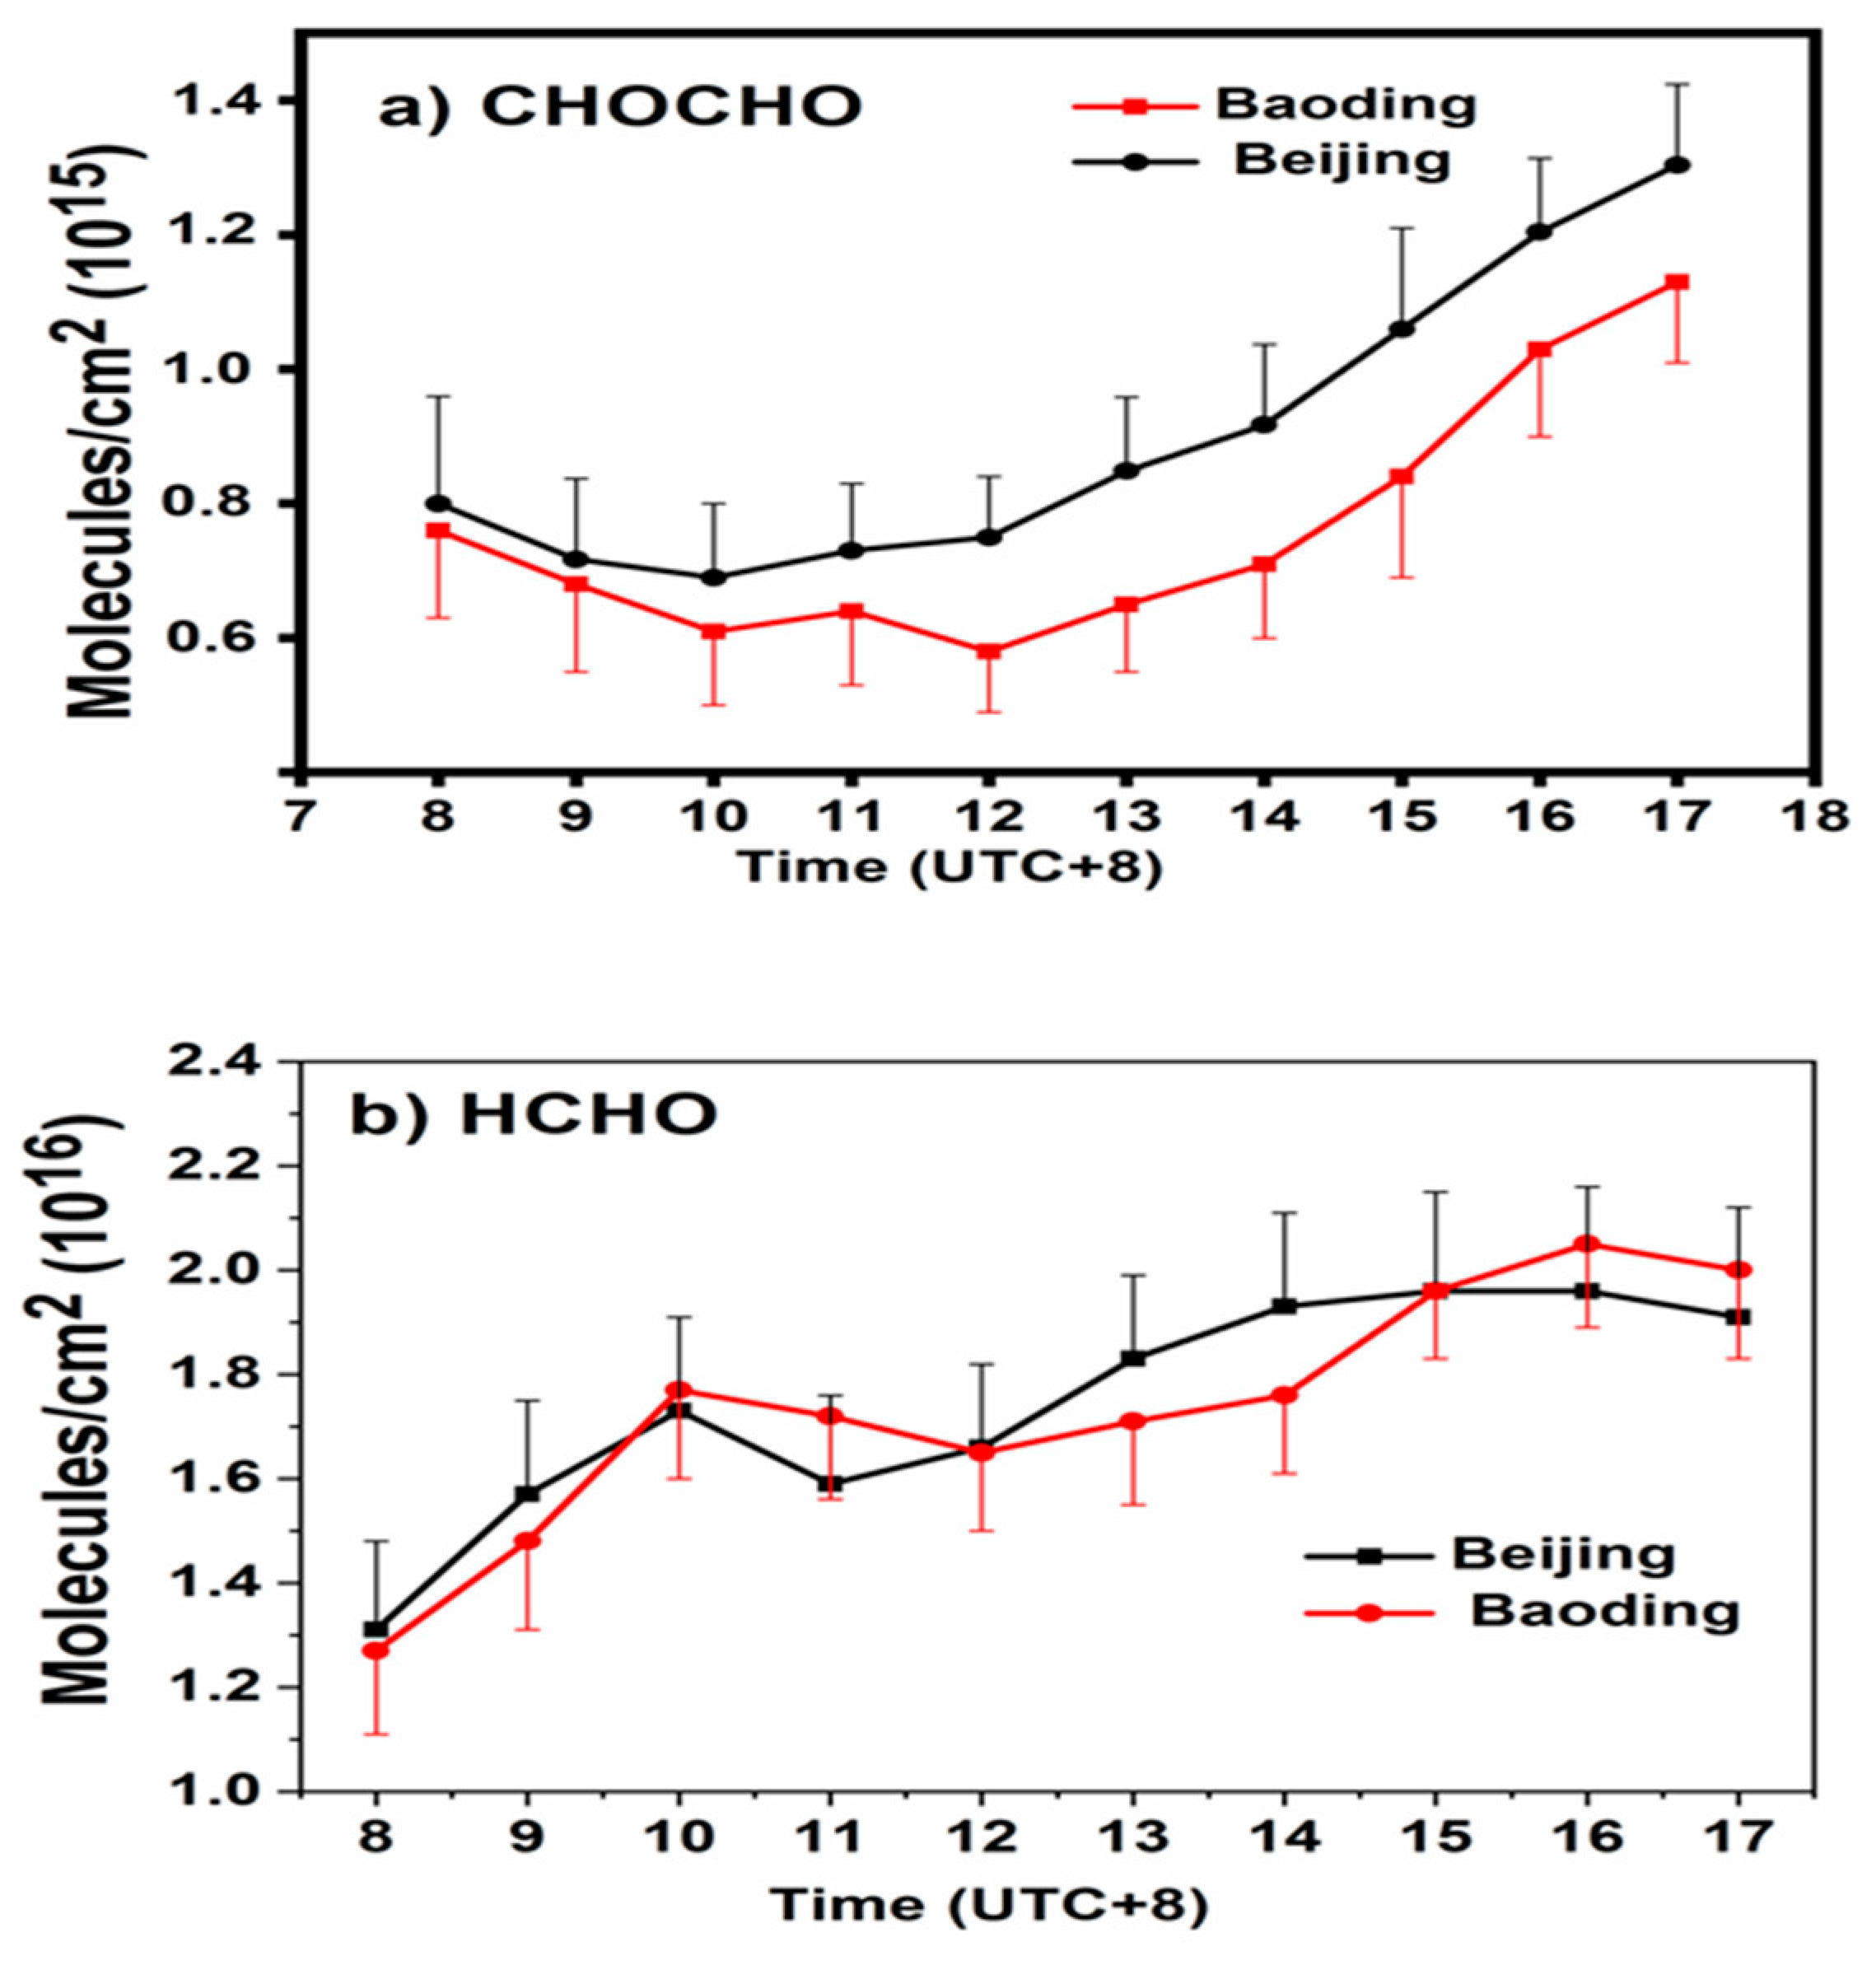
The analysis of the diurnal cycle of trace gases is vital for obtaining important information to understand the sources and atmospheric chemistry of these gases. The mean diurnal variations of the observed trace gases were calculated for both stations. Figure 6 represents the diurnal variation of HCHO and CHOCHO VCDs at Beijing and Baoding stations.
The diurnal variation of CHOCHO VCDs showed interesting phenomena with higher values in the evening time. A similar variation in the diurnal cycle of CHOCHO VCDs was observed at both sites. The CHOCHO VCDs decrease during noontime and then gradually start to increase with a maximum value observed in the evening [17].
The HCHO VCDs at both monitoring stations Beijing and Baoding followed a similar diurnal cycle. The steady buildup of HCHO starts at the beginning of the morning rush hour, until 10:00 (local time). This peak around 10:00 can be attributed to higher traffic load. Then, around noon, HCHO level starts to rise again which is indicative of formation of HCHO from the photo-oxidation of VOCs [30,32].

3.4. Weekly Cycle

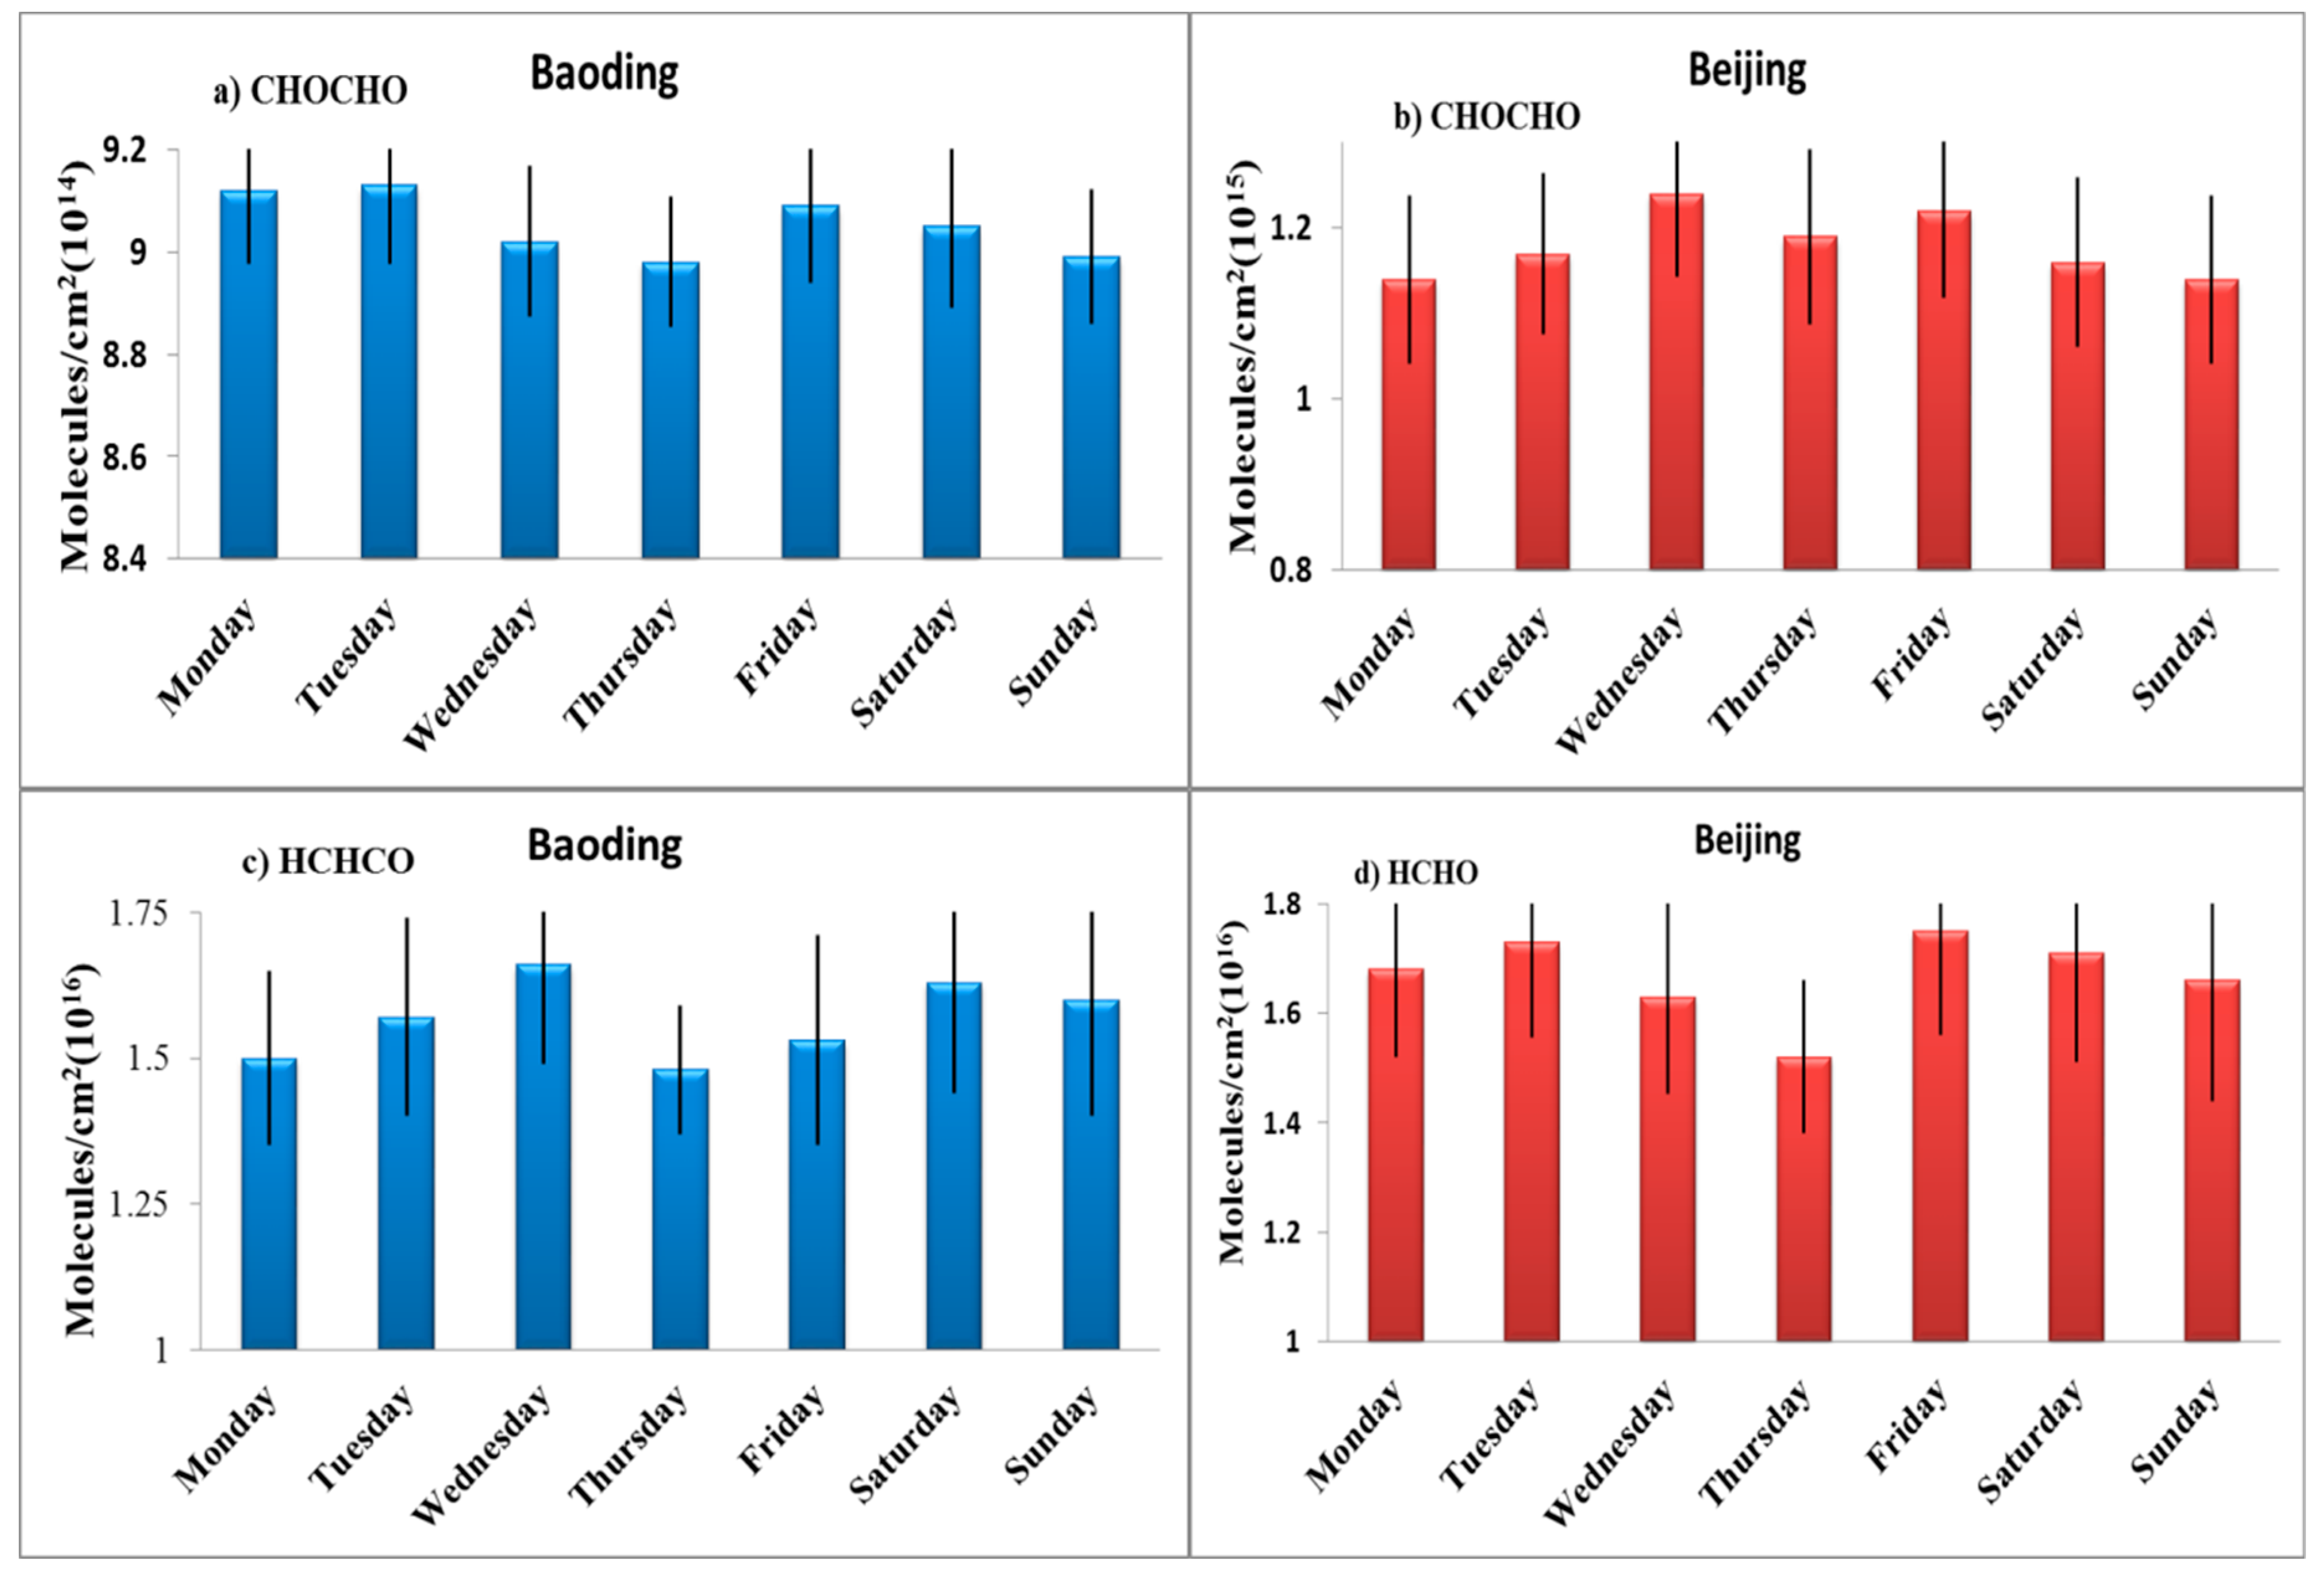
Anthropogenic activities of mankind are normally classified into a weekly cycle. It is generally observed that pollutant emission level is low on weekends due to a decline in traffic load on the roads and closure of industrial activities [33,34]. However, there is no significant reduction in pollutant level on weekends in different cities in China [17,30,35]. We investigated the weekly cycles of CHOCHO and HCHO VCDs in Beijing and Baoding as shown in Figure 7. We didn’t find any pronounced results for weekly cycles. Insignificant differences in the weekly cycles of CHOCHO, and HCHO VCDs were observed. These results indicate similar emissions during weekdays and weekends. These results can also be attributed to the fact that in many Chinese megacities, industries are functioning 24 h throughout the week [17]

3.5. Temperature Dependence

Photochemistry plays an important role in sources and sinks of different trace gases, therefore, temperature dependence was discussed. Temperature (T) data for Beijing and Baoding was obtained from (https://www.ncdc.noaa.gov/). Figure 8 represents the correlation of monthly mean HCHO and CHOCHO VCDs with monthly mean temperature. CHOCHO shows moderate anti-correlation in Beijing and Baoding with R value of 0.70 and 0.72, respectively. This indicates that photolysis is a major removal pathway for CHOCHO. HCHO shows positive correlation with temperature. Its correlation is very strong with R value of 0.90 and 0.84 for Beijing and Baoding. This phenomenon suggests that photo-oxidation of VOCs is a main source for HCHO formation.

3.6. Impact of Biogenic Emissions

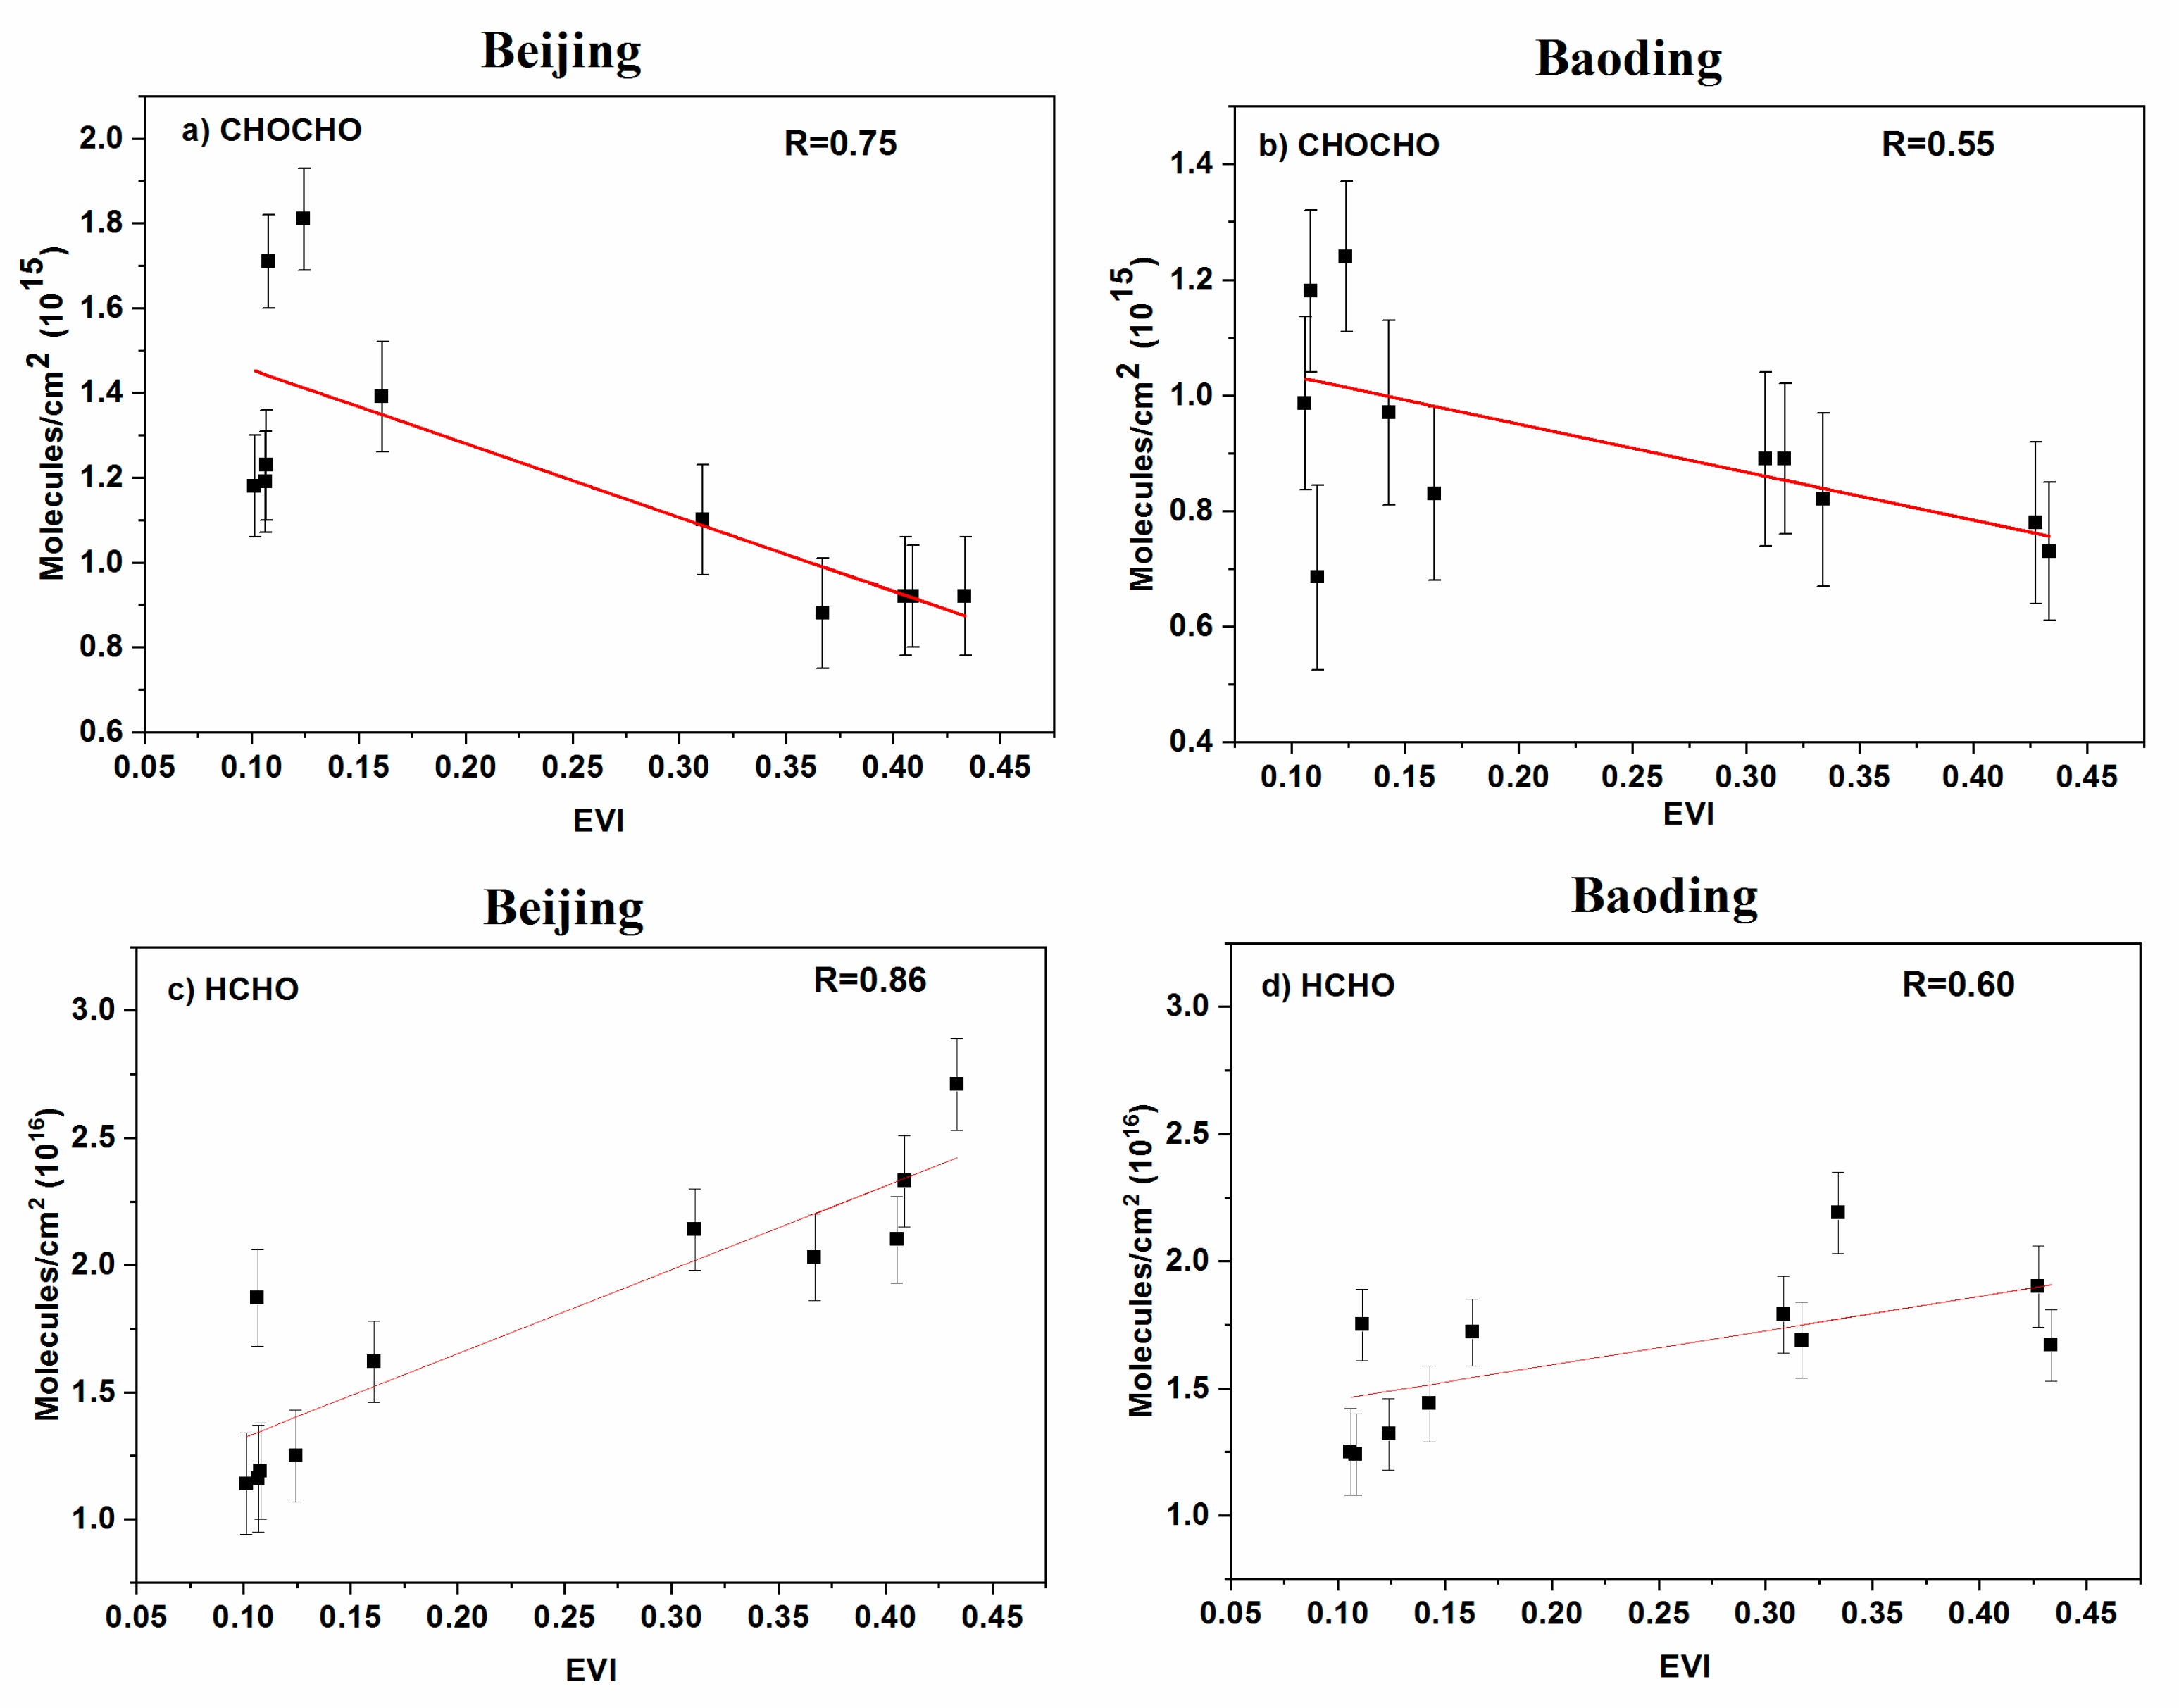
MODIS vegetation index products give spatial and temporal comparisons of vegetation cover [36,37,38]. Higher values of EVI were found in spring and summer months indicating the presence of vegetation. Figure 9 shows that CHOCHO is anti-correlated with the EVI at both monitoring stations whereas HCHO showed positive correlation with EVI. This indicates HCHO production is related to oxidation of isoprene at both Beijing and Baoding monitoring stations [39].

4. Discussion

Among the two monitoring stations, the higher levels of trace gas VCDs were noted in Beijing, whereas lower levels were observed in Baoding. These results are most likely because population density for Beijing is high and it also features high economic and industrial activities as compared to Baoding. The CHOCHO VCDs maxima in winter and minima during summer indicate the presence of possible anthropogenic sources e.g., aromatics and acetylene for CHOCHO production [28,40,41]. The significant increase of CHOCHO from October may be related to heating during winter. This finding is consistent with glyoxal retrieved over Beijing and Northern China from OMI satellite data [42,43]. The increase in HCHO during summer is considered to be due to the photochemical production of HCHO, biogenic emissions during growing season and the burning of biomass in spring and autumn [31].
The diurnal cycle of CHOCHO can be attributed to the fact that CHOCHO is photolysed during noon time resulting in lower levels of CHOCHO, then its level starts to increase in the late afternoon as rate of photolysis decreases gradually [17]. These results also indicate that photo-oxidation of VOCs is not the main source of glyoxal formation, rather they indicate a possible direct linkage with genuine anthropogenic sources.
The diurnal cycle of HCHO showed that its level started to rise during noon or afternoon which is indicative of formation of HCHO from photo-oxidation of VOCs [30,32]. Photochemistry plays an important role in sources and sinks of different trace gases. The negative correlation of CHOCHO with temperature indicates that photolysis is a major removal pathway for CHOCHO. Whereas, the positive correlation of HCHO with temperature indicates photo-oxidation of VOCs is a main source for HCHO formation.

5. Conclusions

MAX-DOAS measurements in Beijing and Baoding were done for a period of around one year (May 2017 to April 2018). Vertical column densities (VCDs) of HCHO and CHOCHO have been retrieved by using the geometric approximation approach. The average VCDs of HCHO and CHOCHO for the whole observation period have maxima in Beijing and minima in Baoding. The retrieved VCDs were used to examine the seasonal and diurnal cycles to have better understanding of their possible sources in Beijing and Baoding. CHOCHO showed clear seasonal variation with higher levels in winter and lower values during summer, whereas maxima for HCHO occurred in summer. These results indicate that photolysis is a major sink for CHOCHO. The increase in combustion of fossil fuels for heating purpose also plays an important role in increased production of CHOCHO during the winter season. On the other hand photochemical reactions are major sources for HCHO production. Diurnal cycles for HCHO VCDs showed that higher values were observed during midday hours and levels started to decline in the evening which showed a linkage with photochemical production. CHOCHO photolysed at noon, resulting in lower levels of CHOCHO during noon time, levels started to increase late in the afternoon as the rate of photolysis decreases gradually. These results indicate that photo oxidation of VOCs is not main source of glyoxal formation, and rather indicate the direct linkage with genuine anthropogenic sources. The strong correlation of HCHO with EVI showed that the oxidation of isoprene and HCHO production are strongly related.

Author Contributions

Conceptualization, Z.J., C.L. and M.F.K; formal analysis, Z.J., O.S. and A.T.; methodology, Q.H., W.T. and H.L.; resources, C.L.; validation, A.R., C.X. and X.J.; writing, review & editing, Z.J., M.F.K. and C.L.

Funding

This work was supported by grants from the National Key Research and Development Program of China (Nos. 2018YFC0213104), National Natural Science Foundation of China (Nos. 41722501, 91544212, 51778596, 41575021) and National Key Research and Development Program of China (Nos. 2016YFC0203302).

Acknowledgments

We are indebted to Shahid Sardar (Department of Modern Physics, USTC) and Safiullah (Department of Chemistry, USTC) for useful communications.

Conflicts of Interest

The authors declare no conflict of interest.

References

  1. Luo, Y.; Chen, H.; Peng, C.; Yang, G.; Yang, Y.; Zhang, Y. Relationship between air pollutants and economic development of the provincial capital cities in China during the past decade. PLoS ONE 2014, 9, e104013. [Google Scholar] [CrossRef] [PubMed]
  2. Seinfeld, J.H.; Pandis, S.N. Atmospheric Chemistry and Physics: From Air Pollution to Climate Change; John Wiley & Sons: Hoboken, NJ, USA, 2016. [Google Scholar]
  3. Fried, A.; Cantrell, C.; Olson, J.; Crawford, J.H.; Weibring, P.; Walega, J.; Richter, D.; Junkermann, W.; Volkamer, R.; Sinreich, R.; et al. Detailed comparisons of airborne formaldehyde measurements with box models during the 2006 INTEX-B and MILAGRO campaigns: Potential evidence for significant impacts of unmeasured and multi-generation volatile organic carbon compounds. Atmos. Chem. Phys. 2011, 11, 11867–11894. [Google Scholar] [CrossRef]
  4. Koppmann, R. Volatile Organic Compounds in the Atmosphere; Wiley-Blackwell: Hoboken, NJ, USA, 2007; pp. 1–3. [Google Scholar]
  5. Zhu, L.; Jacob, D.J.; Keutsch, F.N.; Mickley, L.J.; Scheffe, R.; Strum, M.; González Abad, G.; Chance, K.; Yang, K.; Rappenglück, B.; et al. Formaldehyde (HCHO) as a hazardous air pollutant: Mapping surface air concentrations from satellite and inferring cancer risks in the United States. Environ. Sci. Technol. 2017, 51, 5650–5657. [Google Scholar] [CrossRef] [PubMed]
  6. Pinardi, G.; Van Roozendael, M.; Abuhassan, N.; Adams, C.; Cede, A.; Clémer, K.; Fayt, C.; Frieß, U.; Gil, M.; Herman, J.; et al. MAX-DOAS formaldehyde slant column measurements during CINDI: Intercomparison and analysis improvement. Atmos. Meas. Tech. 2013, 6, 167–185. [Google Scholar] [CrossRef]
  7. Arlander, D.W.; Brüning, D.; Schmidt, U.; Ehhalt, D.H. The tropospheric distribution of formaldehyde during TROPOZ II. J. Atmos. Chem. 1995, 22, 251–269. [Google Scholar] [CrossRef]
  8. Fortems-Cheiney, A.; Chevallier, F.; Pison, I.; Bousquet, P.; Saunois, M.; Szopa, S.; Cressot, C.; Kurosu, T.P.; Chance, K.; Fried, A. The formaldehyde budget as seen by a global-scale multi-constraint and multi-species inversion system. Atmos. Chem. Phys. 2012, 12, 6699–6721. [Google Scholar] [CrossRef] [Green Version]
  9. Volkamer, R.; Molina, L.T.; Molina, M.J.; Shirley, T.; Brune, W.H. DOAS measurement of glyoxal as an indicator for fast VOC chemistry in urban air. Geophys. Res. Lett. 2005, 32, 1–4. [Google Scholar] [CrossRef]
  10. Wittrock, F.; Richter, A.; Oetjen, H.; Burrows, J.P.; Kanakidou, M.; Myriokefalitakis, S.; Volkamer, R.; Beirle, S.; Platt, U.; Wagner, T. Simultaneous global observations of glyoxal and formaldehyde from space. Geophys. Res. Lett. 2006, 33, 16. [Google Scholar] [CrossRef]
  11. Vrekoussis, M.; Wittrock, F.; Richter, A.; Burrows, J.P. Temporal and spatial variability of glyoxal as observed from space. Atmos. Chem. Phys. 2009, 9, 4485–4504. [Google Scholar] [CrossRef] [Green Version]
  12. Hönninger, G.; Friedeburg, C.V.; Platt, U. Multi axis differential optical absorption spectroscopy (MAX-DOAS). Atmos. Chem. Phys. 2004, 4, 231–254. [Google Scholar] [CrossRef] [Green Version]
  13. Chan, K.L.; Hartl, A.; Lam, Y.F.; Xie, P.H.; Liu, W.Q.; Cheung, H.M.; Lampel, J.; Pöhler, D.; Li, A.; Xu, J.; et al. Observations of tropospheric NO2 using ground based MAX-DOAS and OMI measurements during the Shanghai World Expo 2010. Atmos. Environ. 2015, 119, 45–58. [Google Scholar] [CrossRef]
  14. Xing, C.; Liu, C.; Wang, S.; Chan, K.L.; Gao, Y.; Huang, X.; Su, W.; Zhang, C.; Dong, Y.; Fan, G.; et al. Observations of the vertical distributions of summertime atmospheric pollutants and the corresponding ozone production in Shanghai, China. Atmos. Chem. Phys. 2017, 17, 14275–14289. [Google Scholar] [CrossRef] [Green Version]
  15. Sun, Z.; Mu, Y.; Liu, Y.; Shao, L. A comparison study on airborne particles during haze days and non-haze days in Beijing. Sci. Total Environ. 2013, 456, 1–8. [Google Scholar] [CrossRef] [PubMed]
  16. Plane, J.M.; Saiz-Lopez, A. UV-visible differential optical absorption spectroscopy (DOAS). In Analytical Techniques for Atmospheric Measurement; Blackwell Publishing Ltd.: Hoboken, NJ, USA, 2006; pp. 147–188. [Google Scholar]
  17. Javed, Z.; Liu, C.; Khokhar, M.F.; Xing, C.; Tan, W.; Subhani, M.A.; Rehman, A.; Tanvir, A. Investigating the impact of Glyoxal retrieval from MAX-DOAS observations during haze and non-haze conditions in Beijing. J. Environ. Sci. 2019, 80, 296–305. [Google Scholar] [CrossRef] [PubMed]
  18. Chance, K.; Kurucz, R.L. An improved high-resolution solar reference spectrum for earth’s atmosphere measurements in the ultraviolet, visible, and near infrared. J. Quant. Spectrosc. Radiat. Transf. 2010, 111, 1289–1295. [Google Scholar] [CrossRef]
  19. Vandaele, A.C.; Hermans, C.; Simon, P.C.; Carleer, M.; Colin, R.; Fally, S.; Merienne, M.F.; Jenouvrier, A.; Coquart, B. Measurements of the NO2 absorption cross-section from 42,000 cm−1 to 10,000 cm−1 (238–1000 nm) at 220 K and 294 K. J. Quant. Spectrosc. Radiat. Transf. 1998, 59, 171–184. [Google Scholar] [CrossRef]
  20. Serdyuchenko, A.; Gorshelev, V.; Weber, M.; Chehade, W.; Burrows, J.P. High spectral resolution ozone absorption cross-sections—Part 2: Temperature dependence. Atmos. Meas. Tech. 2014, 7, 625–636. [Google Scholar] [CrossRef]
  21. Thalman, R.; Volkamer, R. Temperature dependent absorption cross-sections of O2–O2 collision pairs between 340 and 630 nm and at atmospherically relevant pressure. Phys. Chem. Chem. Phys. 2013, 15, 15371–15381. [Google Scholar] [CrossRef]
  22. Meller, R.; Moortgat, G.K. Temperature dependence of the absorption cross sections of formaldehyde between 223 and 323 K in the wavelength range 225–375 nm. J. Geophys. Res. Atmos. 2000, 105, 7089–7101. [Google Scholar] [CrossRef]
  23. Fleischmann, O.C.; Hartmann, M.; Burrows, J.P.; Orphal, J. New ultraviolet absorption cross-sections of BrO at atmospheric temperatures measured by time-windowing Fourier transform spectroscopy. J. Photochem. Photobiol. A Chem. 2004, 168, 117–132. [Google Scholar] [CrossRef]
  24. Rothman, L.S.; Gordon, I.E.; Barber, R.J.; Dothe, H.; Gamache, R.R.; Goldman, A.; Perevalov, V.I.; Tashkun, S.A.; Tennyson, J. HITEMP, the high-temperature molecular spectroscopic database. J. Quant. Spectrosc. Radiat. Transf. 2010, 111, 2139–2150. [Google Scholar] [CrossRef]
  25. Irie, H.; Takashima, H.; Kanaya, Y.; Boersma, K.F.; Gast, L.; Wittrock, F.; Brunner, D.; Zhou, Y.; Roozendael, M.V. Eight-component retrievals from ground-based MAX-DOAS observations. Atmos. Meas. Tech. 2011, 4, 1027–1044. [Google Scholar] [CrossRef] [Green Version]
  26. Liu, H.; Liu, C.; Xie, Z.; Li, Y.; Huang, X.; Wang, S.; Xu, J.; Xie, P. A paradox for air pollution controlling in China revealed by “APEC Blue” and “Parade Blue”. Sci. Rep. 2016, 6, 34408. [Google Scholar] [CrossRef] [PubMed]
  27. Tan, W.; Liu, C.; Wang, S.; Xing, C.; Su, W.; Zhang, C.; Xia, C.; Liu, H.; Cai, Z.; Liu, J. Tropospheric NO2, SO2, and HCHO over the East China Sea, using ship-based MAX-DOAS observations and comparison with OMI and OMPS satellite data. Atmos. Chem. Phys. 2018, 18, 15387–15402. [Google Scholar] [CrossRef]
  28. Tian, X.; Xie, P.; Xu, J.; Wang, Y.; Li, A.; Wu, F.; Hu, Z.; Liu, C.; Zhang, Q. Ground-based MAX-DOAS observations of tropospheric formaldehyde VCDs and comparisons with the CAMS model at a rural site near Beijing during APEC 2014. Atmos. Chem. Phys. 2019, 5, 3375–3393. [Google Scholar] [CrossRef]
  29. Alvarado, L.M.A. Investigating the Role of Glyoxal Using Satellite and Max-Doas Measurements. Doctoral Dissertation, University of Bremen, Bremen, Germany, 2016. Available online: http://elib.suub.uni-bremen.de/edocs/00105347-1.pdf (accessed on 18 January 2019).
  30. Hendrick, F.; Müller, J.F.; Clémer, K.; Wang, P.; De Mazière, M.; Fayt, C.; Gielen, C.; Hermans, C.; Ma, J.Z.; Pinardi, G.; et al. Four years of ground-based MAX-DOAS observations of HONO and NO2 in the Beijing area. Atmos. Chem. Phys. 2014, 14, 765–781. [Google Scholar] [CrossRef]
  31. Chan, K.L.; Wang, Z.; Ding, A.; Heue, K.P.; Shen, Y.; Wang, J.; Zhang, F.; Hao, N.; Wenig, M. MAX-DOAS measurements of tropospheric NO2 and HCHO in Nanjing and the comparison to OMI observations. Atmos. Chem. Phys. Discuss 2019. [Google Scholar] [CrossRef]
  32. Gratsea, M.; Vrekoussis, M.; Richter, A.; Wittrock, F.; Schönhardt, A.; Burrows, J.; Kazadzis, S.; Mihalopoulos, N.; Gerasopoulos, E. Slant column MAX-DOAS measurements of nitrogen dioxide, formaldehyde, glyoxal and oxygen dimer in the urban environment of Athens. Atmos. Environ. 2016, 135, 118–131. [Google Scholar] [CrossRef]
  33. Cleveland, W.S.; Graedel, T.E.; Kleiner, B.; Warner, J.L. Sunday and workday variations in photochemical air pollutants in New Jersey and New York. Science 1974, 186, 1037–1038. [Google Scholar] [CrossRef]
  34. Chan, K.L.; Wiegner, M.; Wenig, M.; Pöhler, D. Observations of tropospheric aerosols and NO2 in Hong Kong over 5 years using ground based MAX-DOAS. Sci. Total Environ. 2018, 619, 1545–1556. [Google Scholar] [CrossRef]
  35. Chan, K.L.; Wang, S.; Liu, C.; Zhou, B.; Wenig, M.O.; Saiz-Lopez, A. On the summertime air quality and related photochemical processes in the megacity Shanghai, China. Sci. Total Environ. 2017, 580, 974–983. [Google Scholar] [CrossRef] [PubMed]
  36. Hoque, H.M.S.; Irie, H.; Damiani, A. First MAX-DOAS Observations of Formaldehyde and Glyoxal in Phimai, Thailand. J. Geophys. Res. Atmos. 2018, 123, 9957–9975. [Google Scholar] [CrossRef]
  37. Justice, C.O.; Vermote, E.; Townshend, J.R.; Defries, R.; Roy, D.P.; Hall, D.K.; Salomonson, V.V.; Privette, J.L.; Riggs, G.; Strahler, A.; et al. The Moderate Resolution Imaging Spectroradiometer (MODIS): Land remote sensing for global change research. IEEE Trans. Geosci. Remote Sens. 1998, 36, 1228–1249. [Google Scholar] [CrossRef]
  38. Running, S.W.; Justice, C.O.; Salomonson, V.; Hall, D.; Barker, J.; Kaufmann, Y.J.; Strahler, A.H.; Huete, A.R.; Muller, J.P.; Vanderbilt, V.; et al. Terrestrial remote sensing science and algorithms planned for EOS/MODIS. Int. J. Remote Sens. 1994, 15, 3587–3620. [Google Scholar] [CrossRef]
  39. Vrekoussis, M.; Wittrock, F.; Richter, A.; Burrows, J.P. GOME-2 observations of oxygenated VOCs: What can we learn from the ratio glyoxal to formaldehyde on a global scale? Atmos. Chem. Phys. 2010, 10, 10145–10160. [Google Scholar] [CrossRef]
  40. Liu, Z.; Wang, Y.; Vrekoussis, M.; Richter, A.; Wittrock, F.; Burrows, J.P.; Shao, M.; Chang, C.C.; Liu, S.C.; Wang, H.; et al. Exploring the missing source of glyoxal (CHOCHO) over China. Geophys. Res. Lett. 2012, 39, 10. [Google Scholar] [CrossRef]
  41. Myriokefalitakis, S.; Vrekoussis, M.; Tsigaridis, K.; Wittrock, F.; Richter, A.; Brühl, C.; Volkamer, R.; Burrows, J.P.; Kanakidou, M. The influence of natural and anthropogenic secondary sources on the glyoxal global distribution. Atmos. Chem. Phys. 2008, 8, 4965–4981. [Google Scholar] [CrossRef] [Green Version]
  42. Alvarado, L.M.A.; Richter, A.; Vrekoussis, M.; Wittrock, F.; Hilboll, A.; Schreier, S.F.; Burrows, J.P. Improved glyoxal retrieval from OMI measurements. Atmos. Meas. Tech. 2014, 7, 4133. [Google Scholar] [CrossRef]
  43. Wang, Y.; Tao, J.; Cheng, L.; Yu, C.; Wang, Z.; Chen, L. A Retrieval of Glyoxal from OMI over China: Investigation of the Effects of Tropospheric NO2. Remote Sens. 2019, 11, 137. [Google Scholar] [CrossRef]
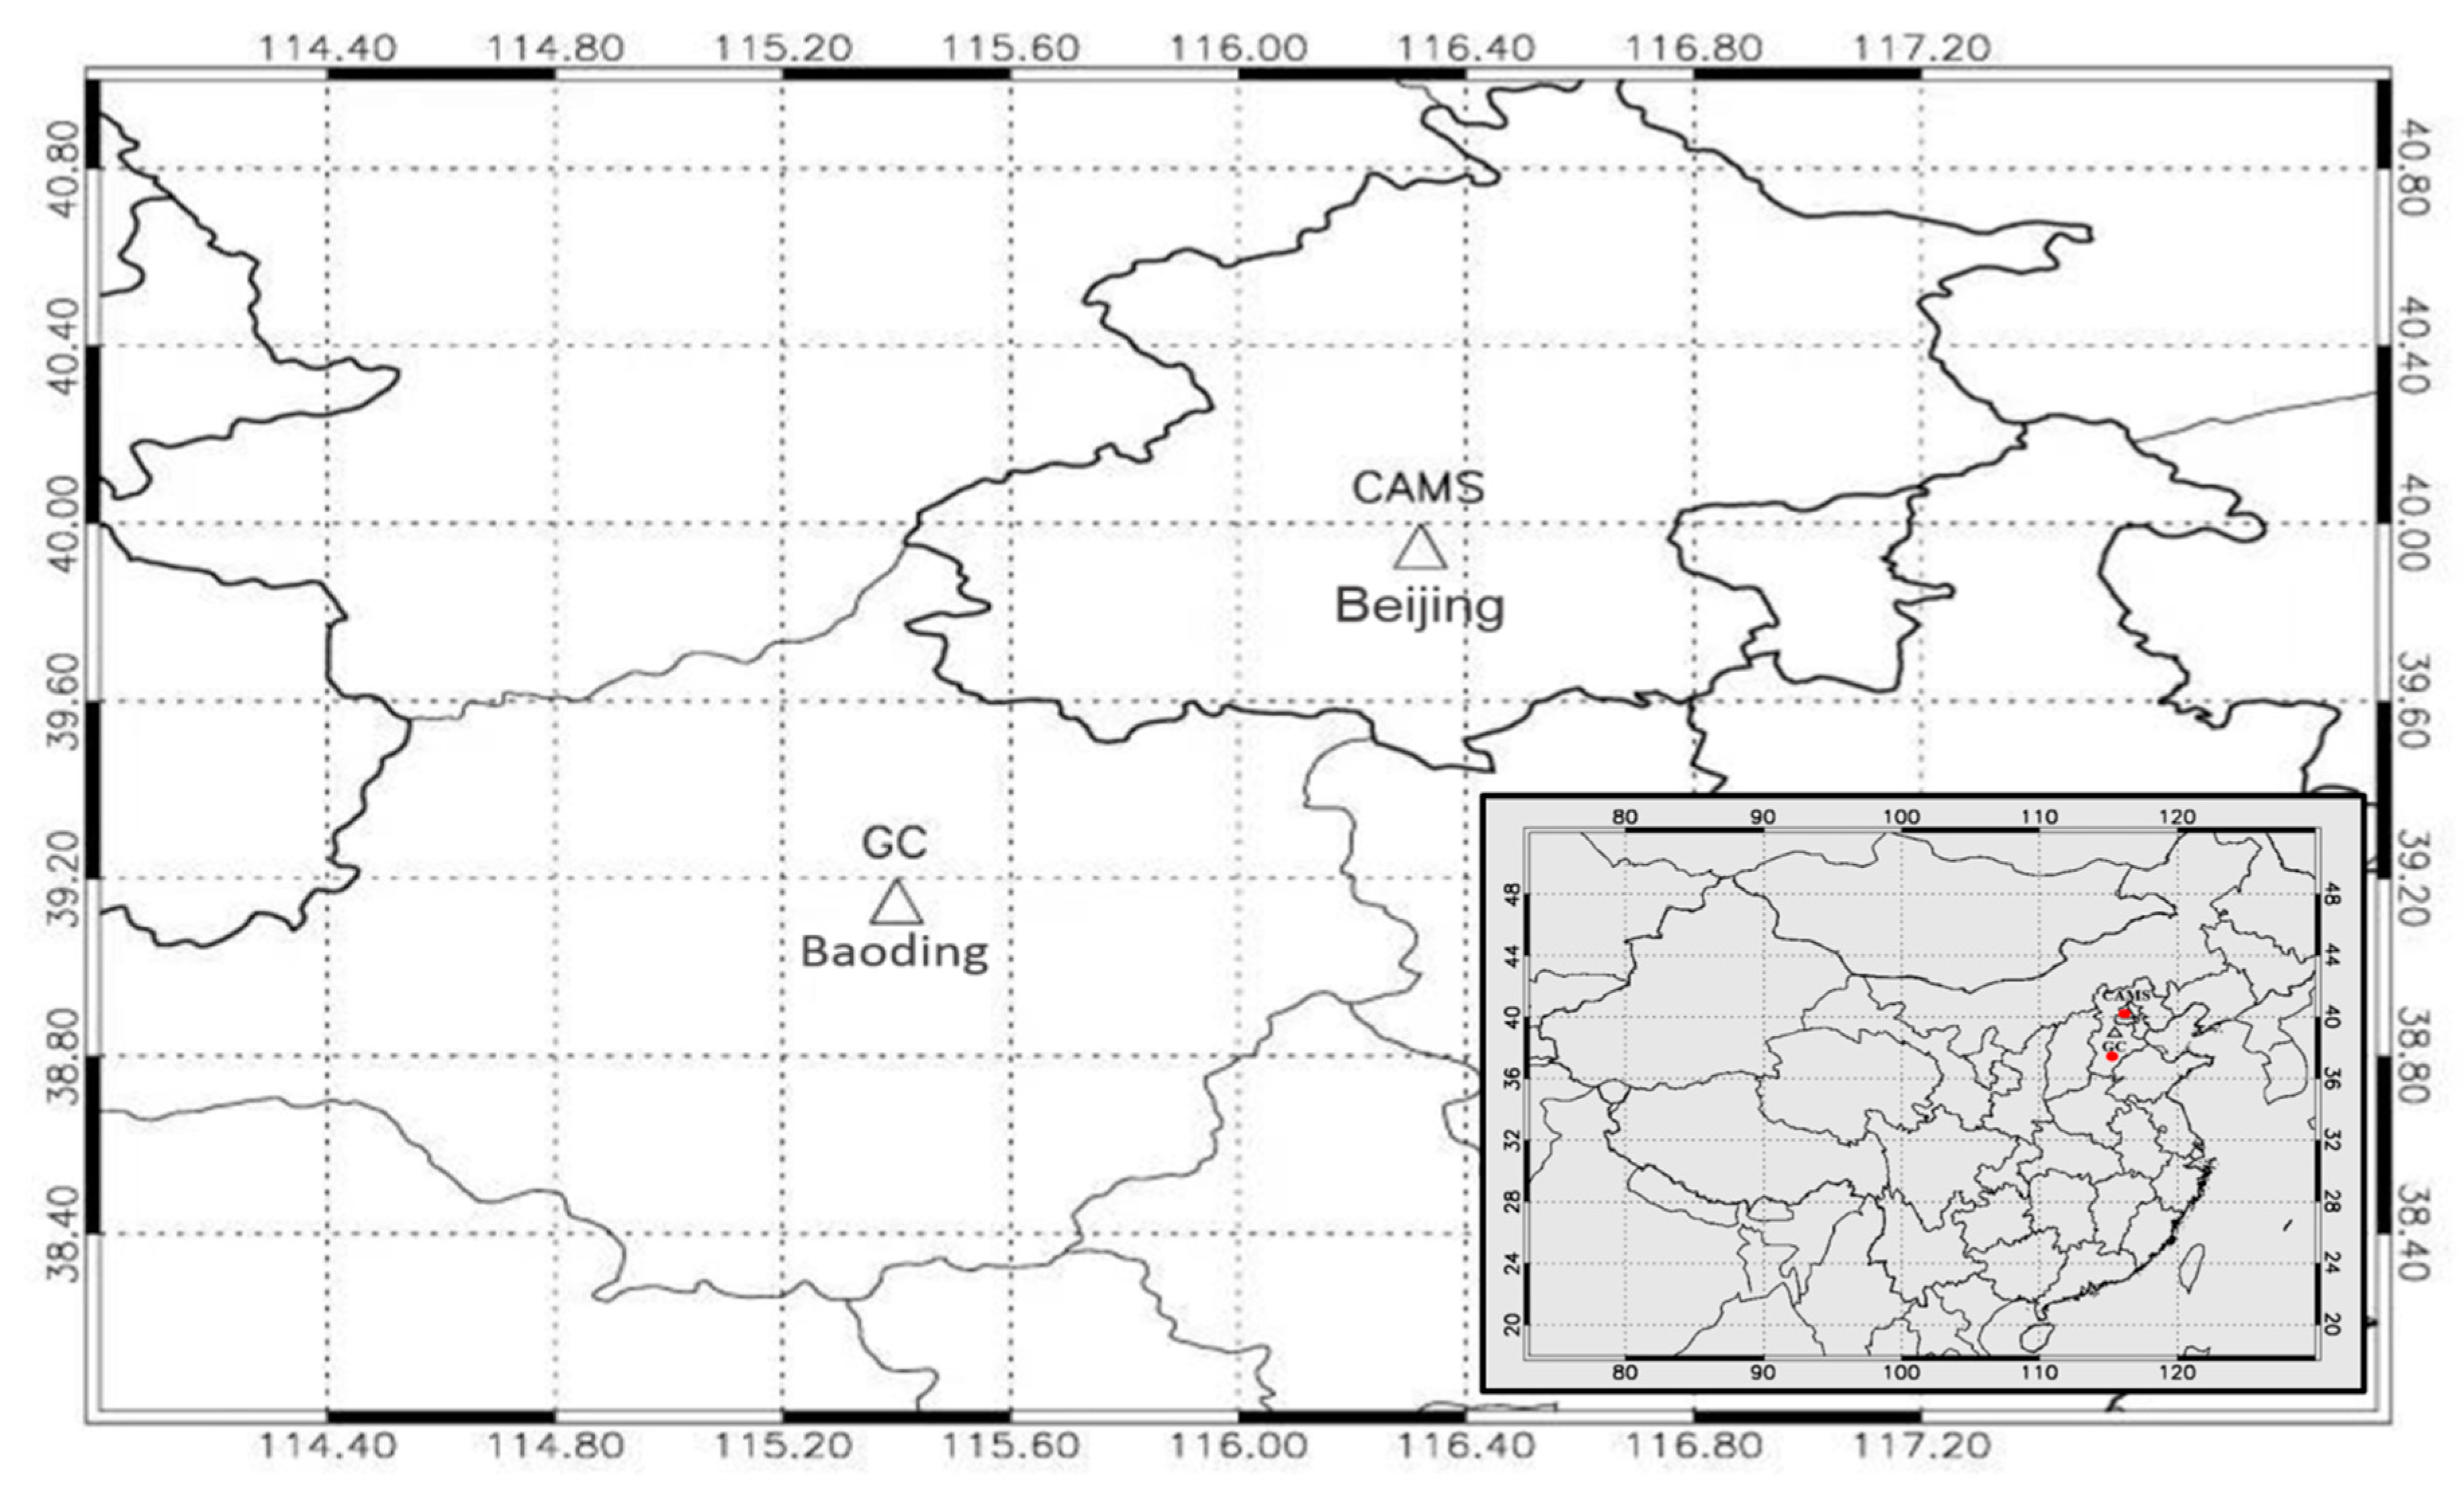
Figure 1. Location of the two multi-axis differential optical absorption spectroscopy (MAX-DOAS) observation sites (triangles represent the Chinese Academy of Meteorological Sciences (CAMS) (Beijing) and Gucheng GC (Baoding) monitoring stations).
Remotesensing 11 01524 g001
Figure 2. DOAS fit for CHOCHO and HCHO at different elevation angles. The red lines represent the fitted optical densities and black lines denote the measured densities. The spectra were obtained on 28th of June 2017 at Baoding station.
Remotesensing 11 01524 g002
Figure 3. Time-series of vertical column densities (VCDs) for CHOCHO and HCHO in Beijing and Baoding. The black line shows the daily averaged VCDs, whereas the red circles show the moving average after every 30 days.
Remotesensing 11 01524 g003
Figure 4. Monthly averaged VCDs for CHOCHO and HCHO from MAX-DOAS and ozone monitoring instrument (OMI) satellite data at Beijing and Baoding site. The vertical lines represent the error bar (standard deviation). One part of the bar is shown to avoid busy graphs.
Remotesensing 11 01524 g004
Figure 5. Seasonal variations for (a) CHOCHO and (b) HCHO from MAX-DOAS and OMI satellite observations at Beijing and Baoding sites. The vertical lines represent the error bar (standard deviation).
Remotesensing 11 01524 g005
Figure 6. Diurnal cycle for (a) CHOCHO and (b) HCHO VCDs monitored at Beijing and Baoding sites. The error bar (standard deviation) is represented by vertical lines. To avoid busy graphs, only one part of the bar is presented.
Remotesensing 11 01524 g006
Figure 7. Weekly cycles of (a,b) CHOCHO and (c,d) HCHO at Beijing and Baoding monitoring stations. The vertical lines show the standard deviation of the variable.
Remotesensing 11 01524 g007
Figure 8. Correlation plots of monthly mean VCDs (a,c) CHOCHO, and (b,d) HCHO with monthly mean temperature at Beijing and Baoding. The vertical lines show the standard deviation of the variable.
Remotesensing 11 01524 g008
Figure 9. Correlation plots of monthly mean VCDs of (a,b) CHOCHO and (c,d) HCHO with enhanced vegetation index (EVI). The vertical lines show the standard deviation of the variable.
Remotesensing 11 01524 g009
Table 1. Settings for the formaldehyde (HCHO) and glyoxal (CHOCHO) DOAS spectral analysis.
9Data SourceTrace Gases
HCHOCHOCHO
Wavelength 337–357438–457
NO2298 K, Vandaele et al. [19]
NO2220 K, Vandaele et al. [19]
O3223 K, Serdyuchenko et al. [20]
O3243 K, Serdyuchenko et al. [20]x
O4293 K, Thalman and Volkamer [21]
HCHO297 K, Meller and Moortgat [22]X
CHOCHO296 K, Volkamer et al. [9]x
BrO223 K, Fleischmann et al. [23]x
H2O296 K, HITEMP; Rothman et al. [24]x
RingCalculated with QDOAS
Polynomial degree 55