Article

Validation of Portable Mobile Mapping System for Inspection Tasks in Thermal and Fluid–Mechanical Facilities

by
Manuel Rodríguez-Martín
1,2,
Pablo Rodríguez-Gonzálvez
3,*,
Esteban Ruiz de Oña Crespo
4 and
Diego González-Aguilera
4
1
Department of Mechanical Engineering, Universidad de Salamanca, 37700, Béjar (Salamanca), Spain
2
Technological Department, Catholic University of Ávila, 05005, Ávila, Spain
3
Department of Mining Technology, Topography and Structures. Universidad de León, 24401, Ponferrada (Spain), Spain
4
Department of Cartographic and Land Engineering. Universidad de Salamanca, 05003, Ávila, Spain
*
Author to whom correspondence should be addressed.
Remote Sens. 2019, 11(19), 2205; https://doi.org/10.3390/rs11192205
Submission received: 30 August 2019 / Revised: 15 September 2019 / Accepted: 19 September 2019 / Published: 20 September 2019
(This article belongs to the Special Issue Mobile Mapping Technologies)

Abstract

:
The three-dimensional registration of industrial facilities has a great importance for maintenance, inspection, and safety tasks and it is a starting point for new improvements and expansions in the industrial facilities context. In this paper, a comparison between the results obtained using a novel portable mobile mapping system (PMMS) and a static terrestrial laser scanner (TLS), widely used for 3D reconstruction in civil and industrial scenarios, is carried out. This comparison is performed in the context of industrial inspection tasks, specifically in the thermal and fluid-mechanics facilities in a hospital. The comparison addresses the general reconstruction of a machine room, focusing on the quantitative and qualitative analysis of different elements (e.g., valves, regulation systems, burner systems and tanks, etc.). The validation of the PMMS is provided considering the TLS as ground truth and applying a robust statistical analysis. Results come to confirm the suitability of the PMMS to perform inspection tasks in industrial facilities.

1. Introduction

Traditionally, geomatics techniques have been used mainly for the determination and recording of terrain and outdoor scenarios in surveying engineering. However, they also can be applied in industrial context and energy applications [1,2,3,4]. In this way, geomatics techniques can be used to generate three-dimensional models of large and complex scenes as nuclear power plants [5], the generation of as-built models in architecture [6,7] or, even, for metrological tasks related with the quality assessment of products [8,9,10,11]. Portable mobile mapping systems (PMMSs) allow the generation of dense, geo-referenced, three-dimensional models while the operator is moving though the scene [12]. This novel technology has been developed in the last years becoming the most innovative and emerging technique in surveying tasks [4].
The scope of application of PMMSs is diverse: from cultural heritage constructions [13] and civil structures to industrial sites [14], indoor spaces [15], and natural environments [16]. PMMSs contain two groups of sensors that act in a synchronized way to reconstruct the scene three-dimensionally: navigation and remote sensing modules. The navigation module usually is based on an inertial measurement unit (IMU) and, sometimes, it also can be equipped with a Global Navigation Satellite System (GNSS) receiver. The remote sensing module normally is based on a laser scanning sensor and, sometimes, also different types of cameras. A deep review about this emerging technology and the different typologies of PMMSs is presented in [12].
The PMMS analyzed in this paper is the GeoSLAM Zeb-Revo [17] (from now on, Zeb-Revo). Nowadays, it is one of the most widespread PMMSs, and several investigations have addressed its use for different purposes as natural space management [16], cultural heritage documentation [18], underground documentation [19,20], and disaster analysis [21], among others. In Zeb-Revo, the navigation module is based on an IMU, whereas the remote sensing module is a 2D laser profilometer. The latter is a compact laser scanning range finder which is more compact and light-weight than a traditional 3D laser scanner system and its battery consumption is more optimal [22]. In [23], Zeb-Revo and Leica Pegasus-Backpack were compared with a Z+F Terrestrial Laser Scanner (TLS), providing Zeb-Revo discrepancies around 4 cm. In [22], a robust statistical comparison between Zeb-Revo and Leica Pegasus-Backpack was performed. Although it was demonstrated that both systems performed within manufacturer specifications, Zeb-Revo generally outperformed the manufacturer values despite the presence of outliers.
The adequate distribution of thermal and fluid-mechanical equipment (such as boilers, tanks, heat exchangers, valves, and others) within the machine rooms is an important issue that must be subject of a rigorous study, especially in singular facilities such as hospitals. The tasks of expansion, maintenance, inspection, and improvement of thermal and fluid-mechanical installations require prior knowledge of the elements of the installation as a starting point. Additionally, the criteria for the equipment distribution are normally indicated by international and/or national standards and regulations (e.g., [24,25]). For this reason, meeting the geometric and technical requirements based on standards and regulations is a mandatory task for the facilities engineers. Many of these requirements are based on geometrical criteria such as distance among boilers or other equipment, geometric and volumetric conditions of the rooms, spaces for maintenance tasks, empty spaces for emergency exits, etc. The generation of a three-dimensional model of machine rooms using PMMS is a powerful tool to ensure the quality and efficiency of the service, allowing the registration of the different elements and devices of the installation and their state of conservation, reducing in this manner the risk of possible maintenance problems, making future improvement actions easier such as the expansion of the facilities or improvement actions, all based on accurate, scaled, and duly documented geospatial information. The design and calculation of the facilities must be carried out according to the technical criteria indicated in the standards and regulations, for example, the allowed pipe diameters. The design and calculation of the thermal facilities must be carried out according to the technical criteria that indicate standards [26]. The calculation criteria—for example, the location of valves, the dimensions of the equipment, etc.—must be computed following these indications, being the finished facilities subject to inspection processes also regulated by these standards. Due to this, inspection and documentation tasks are mandatory to certify that the installation meets the standards, consequently, the use of methods that three-dimensionally record these spaces are totally justified. In [4], a method based on PMMS is proposed for the maintenance of machine rooms, providing the automatic extraction of pipes with relative deviation ranges between 0.50% and 11.21% of the mean diameter value.
The aim of this work was to validate the inspection effectiveness of a PMMS, Zeb-Revo, by comparing its results with those obtained with a TLS, Faro Focus 3D, whose survey was used as reference. As a result, many maintenance and inspection tasks could be done in a simpler way and in less time if a PMMS is used instead of a TLS. After this introduction, this paper is structured as follows: Section 2 describes the methodology and materials employed. Experimental results are presented in Section 3, along with the robust statistical analysis. Discussion is detailed in Section 4, whereas the main conclusions are presented at the end of the paper (Section 5).

2. Materials and Methods
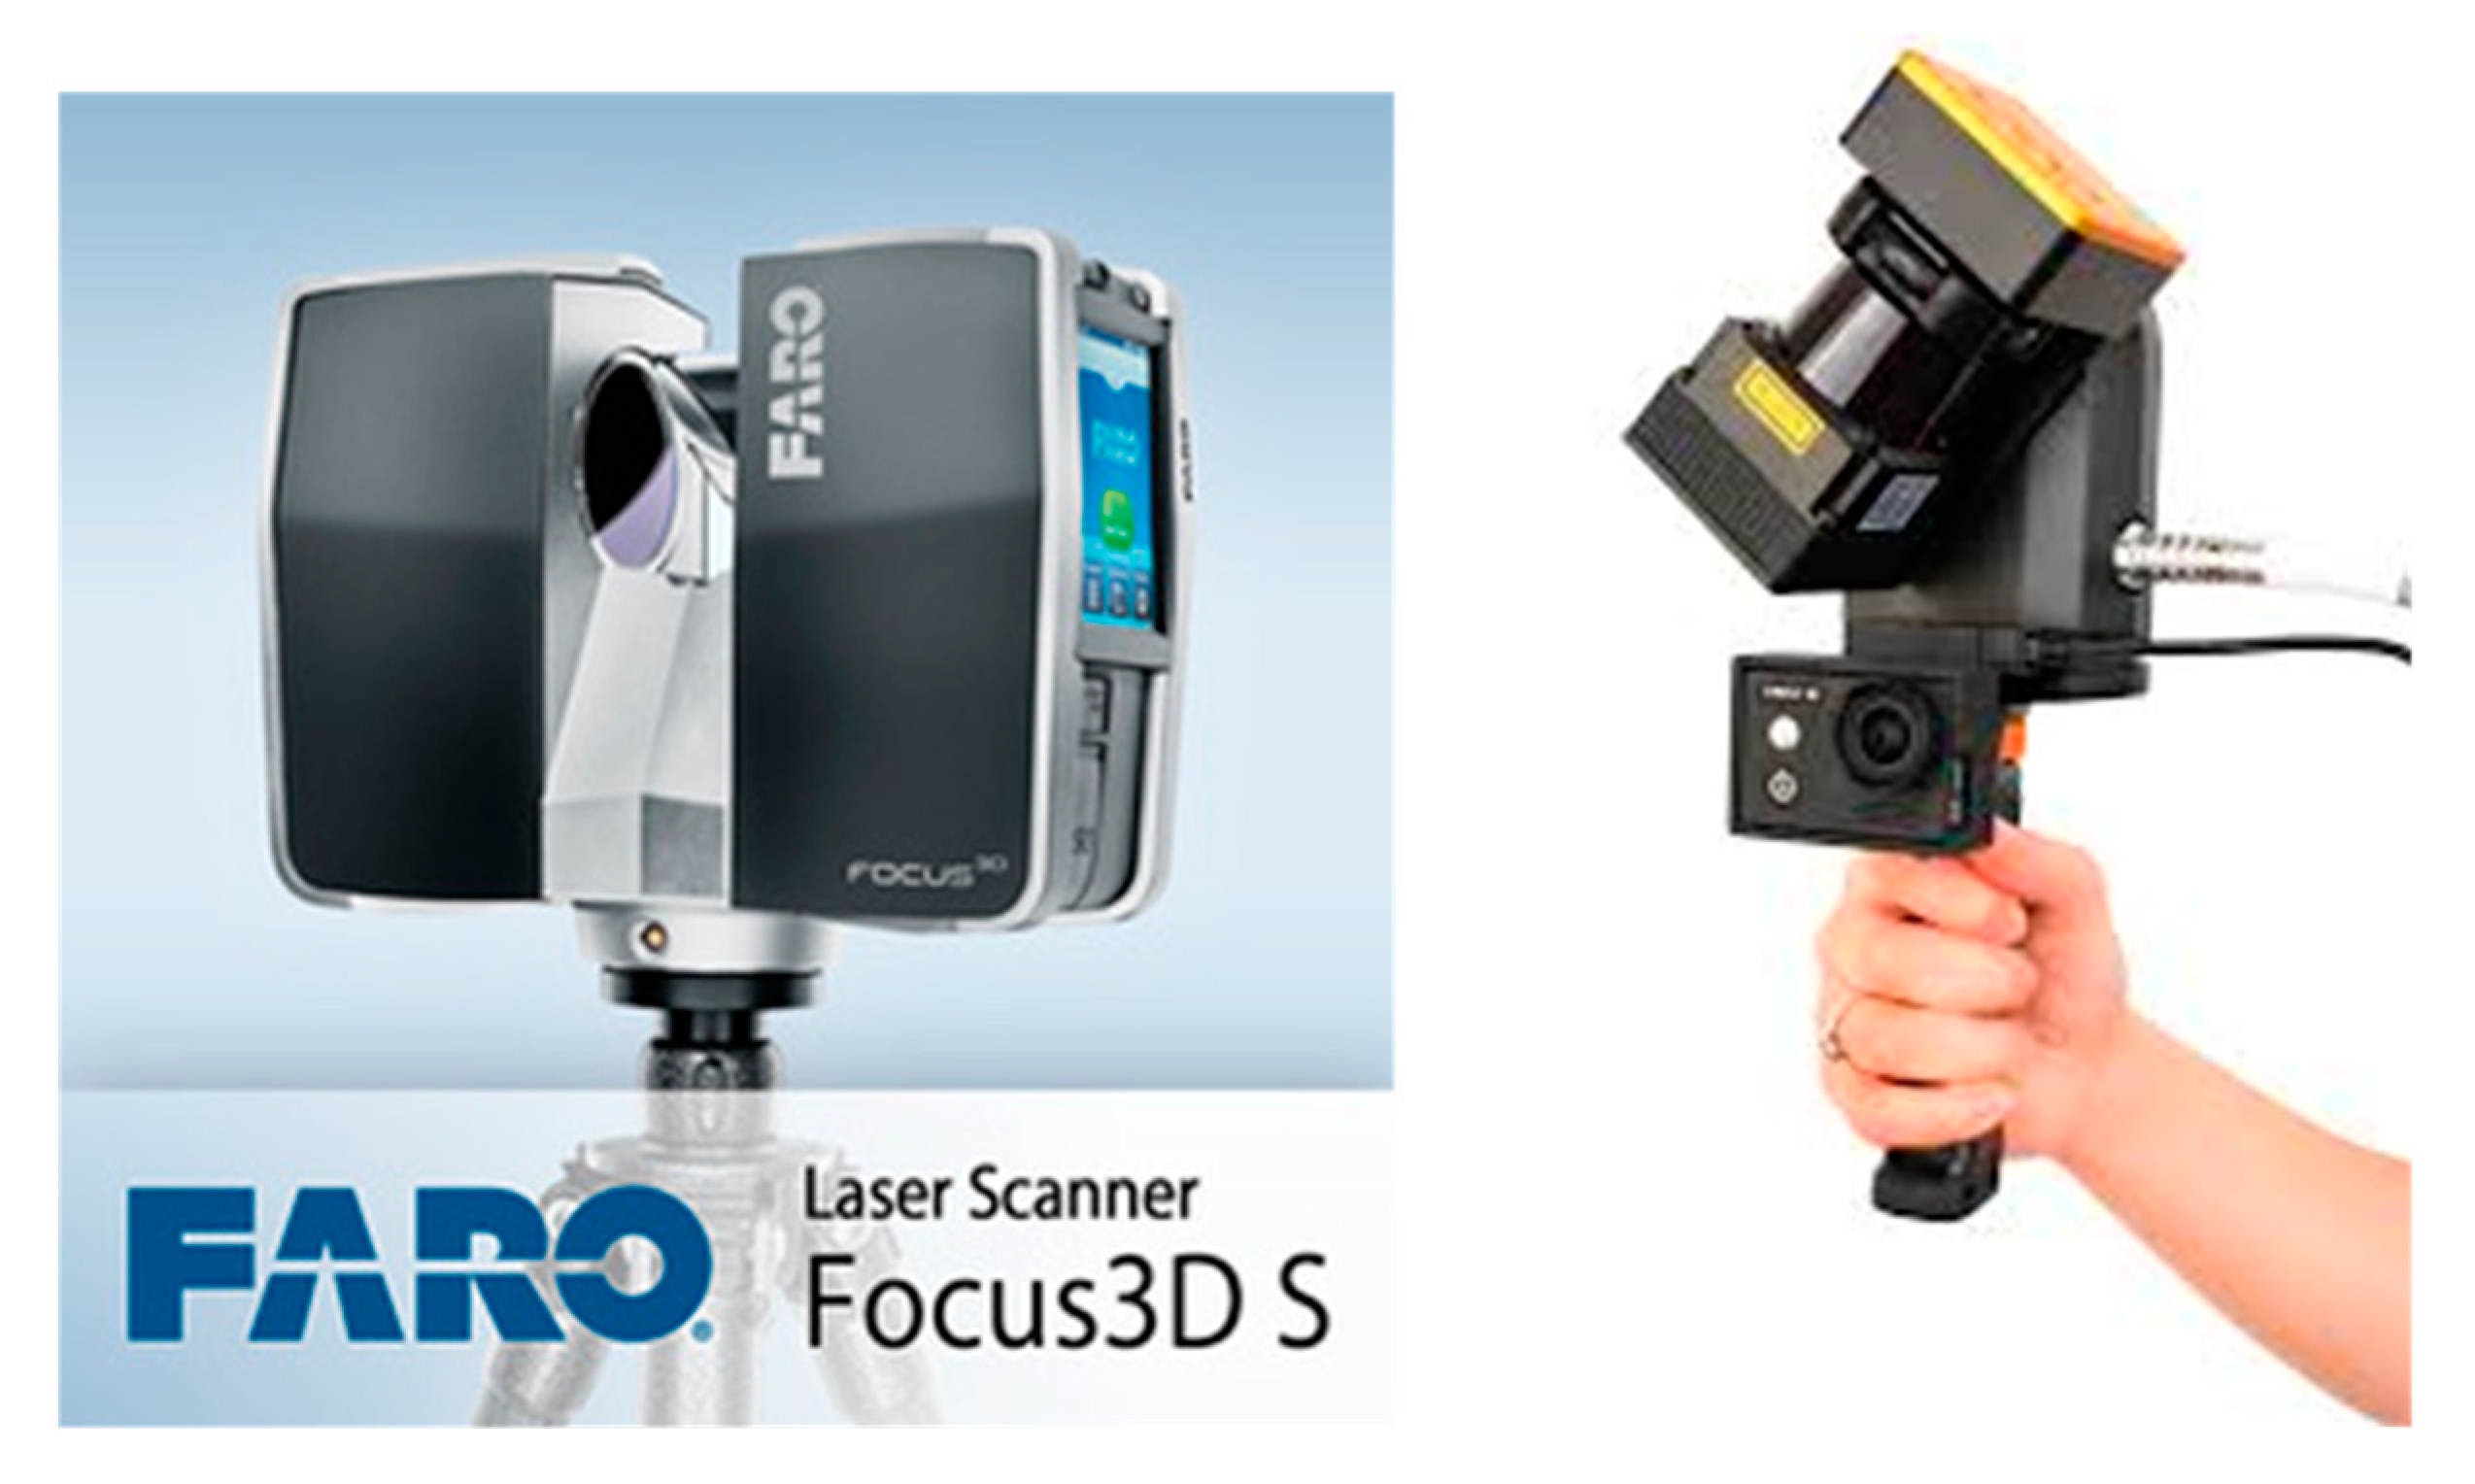
A specific methodology for data analysis was stablished to compare the potential of the PMMS, Zeb-Revo, for the evaluation of fluid-mechanical facilities, using a TLS, Faro Focus3D, as ground truth.

2.1. Materials

Zeb-Revo [16] can be considered as the natural evolution of the first version, ZEBedee, which was developed by the CSIRO ICT Center in Brisbane (Australia) [27,28]. This scanning device is based on a 2D profilometer (Hokuyo UTM-30LX) which can be displaced using a platform support. Moreover, Zeb-Revo is equipped with an IMU as navigation module, which is continuously rotating during data acquisition. Then, the device can be equipped with a commercial camera GoPro Hero installed to record the scenario during the data acquisition and, in this manner, the different scanned elements can be easily located on video. It is especially useful because Zeb-Revo does not record radiometry information, so differentiating zones only based on geometry (without color information) is difficult. The 2D laser profilometer is a compact laser scanner, which is more efficient, light-weight, and compact than any TLS used for three-dimensional reconstruction [22].
Due to the continuous rotation of the sensor and the movement of the operator, three-dimensional information (i.e., points) is acquired. The data are stored in a server with a hard disk that is located in a backpack, which is part of the equipment. Specific features of the Zeb-Revo are indicated in Table 1.
For its part, a TLS, FARO Focus3D 120 (from here, Faro) (Figure 1), was used for the scanning of the reference point cloud (ground truth). This device consists on an infrared laser scanner which takes measures directly using the principle of phase shift in the range of 0.60–120 m at a wavelength of 905 nm. Its field of view covers 320° vertically and 360° horizontally, allowing an angular resolution of 0.009° and a measurement rate of 976,000 points per second, recording radiometric information for each point. The precision provided by the manufacturer is of 2 mm in normal lighting conditions with a beam divergence of 0.19 mrad. This device allows a high accuracy three-dimensional reconstruction, so it was chosen as the ground truth [29].
Furthermore, three reference spheres (14.5 cm of diameter) were required and located in different points of the scene to register the different individual point clouds acquired by Faro and, also, for the subsequent alignment of the point clouds acquired by Zeb-Revo. The spheres acted as reference providing a common Coordinate Reference System (CRS) for the comparison.

2.2. Methods

The developed methodology (Figure 2) was designed specifically for the evaluation of the derived products obtained with the PMMS, Zeb-Revo, specifically oriented to the extraction of the most critical parameters for the inspection of industrial facilities. In addition, the methodology allows the qualitative analysis of in-detail elements from the point cloud generated by the PMMS, Zeb-Revo.

2.2.1. Data Acquisition

The first step was the data acquisition which was addressed using both devices (Faro-Dataset I and Zeb-Revo-Dataset II) but, previously, a reference network was set up to analyze the different point clouds generated from Faro and Zeb-Revo in the same CRS. This reference network was designed with spheres attached to different metal parts of the scene, using neodymium magnets to ensure that they remain static during the data acquisition (Figure 3).
Regarding the protocol for data acquisition, the PMMS requires to start and finish in the same position of the scene. For this reason, the trajectory planned using Zeb-Revo follows a closed-loop. This trajectory must be established to specifically cover the complete machine room minimizing occlusions. Please note that the error of this kind of PMMS typically increases with time/length of the walk. The maximum data acquisition time provided by the manufacturer (working in continuous mode) is approximate twenty minutes, after which the quality of the reconstruction may be reduced. This time requirement is enough to scan extensive industrial facilities with a single-loop (if that was not enough, several loops could be used to generate different point clouds). Data acquisition protocol contemplates a preliminary inspection of the scene to plan a suitable data acquisition path, detect potentially physical obstacles (e.g., equipment, tools or pipes on the floor, drips, etc.) that would affect the data acquisition and remove them if it is necessary and/or possible.
Once PMMS data (Dataset II) was acquired, the point cloud of the scene was registered in a local CRS. If ground control points are visible in the acquired data, the point clouds can be georeferenced in a global CRS using a rigid Helmert transformation. Alternatively, the individual point clouds can be also referenced in the same local CRS implementing an iterative closest point (ICP) registration [30]. For additional details about Zeb-Revo processing, the reader is referred to [12].
Data acquisition was performed planning the path inside the building (450 m2) and requiring approximately four minutes. The total track was about 115 m long, so the walking speed was near 0.43 m·s−1, or 1.6 km·h−1. The front part of the sensor was always oriented in the direction of advance. A part of the followed trajectory and a 3D view of the reconstruction using the manufacturer’s software (GeoSLAM) is shown in Figure 4.
Once the Dataset II using the PMMS was obtained, the TLS, Faro, was used to gather the Dataset I, which was used as ground truth. The data acquisition protocol with the TLS was carefully designed, so that the complete scanning area was covered with the minimum number of scans in order to minimize possible alignment errors. In this way, data acquisition with TLS was implemented from four different positions to ensure that the entire scene was covered. The resulting and aligned point cloud of the machine room was used to validate the dataset obtained with Zeb-Revo.

2.2.2. Data Processing

Once data acquisition protocol for Dataset I (Faro) and Dataset II (Zeb-Revo) was implemented, data processing strategy was applied over the point clouds generated with both laser systems, in order to extract the results. Data processing methodology (Figure 2) was fully oriented to compare the obtained results using Zeb-Revo with respect to the ground truth defined with Faro.

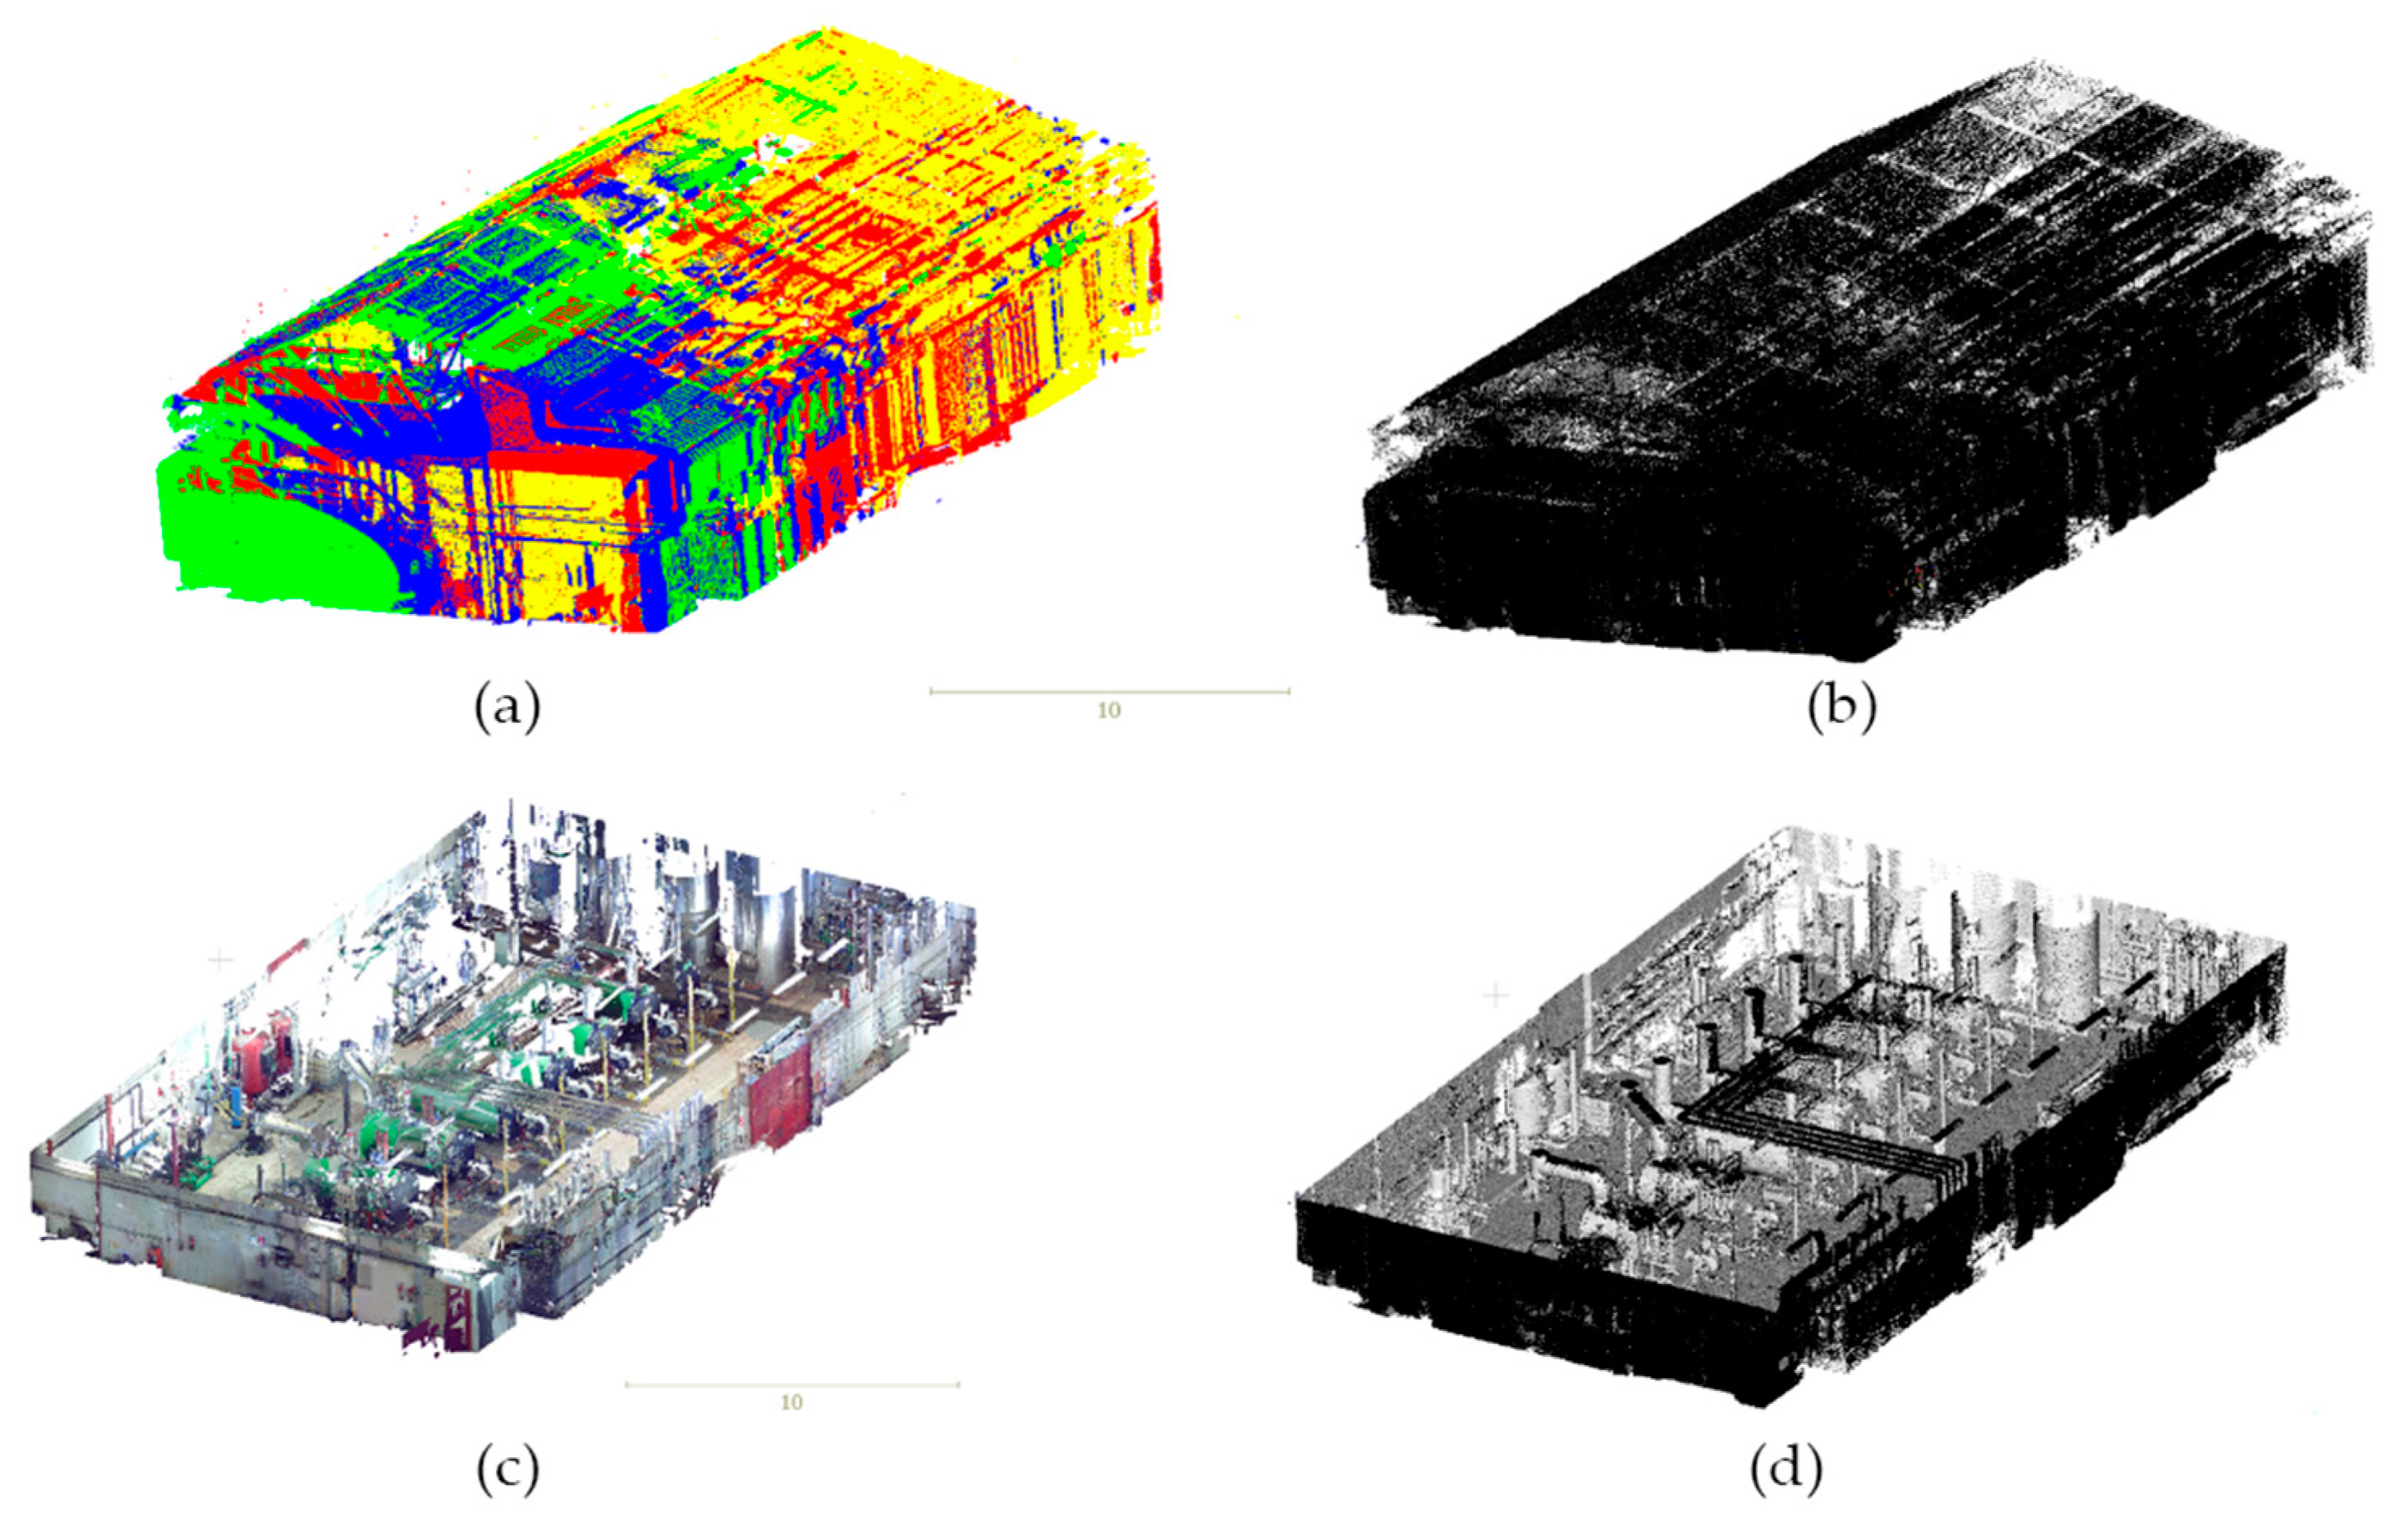
Point Clouds Processing: Merging, Alignment, and Segmentation

Dataset I (Faro) was composed by four individual point clouds (Figure 5a) generated from different positions in order to cover the entire scene. Point clouds were merged using the aligning algorithms provided by Faro Scene software. Spheres distributed along the scene were used to stablish plane-to-plane correspondences, which provide the initial approximations for the ICP [31]. As a result, a single point cloud with 165,829,378 points was obtained from the Dataset I (Faro).
Both dataset (Dataset I-Faro, Dataset II-Zeb-Revo) were aligned under the same CRS using the aforementioned spheres. For the alignment process, firstly, the three spheres were segmented for each point cloud and, subsequently, the centers of the spheres were extracted using a RANSAC-based sphere fitting [32]. The standard deviation (SD) resulting from the fitting is shown in Table 2.
In this way, three invariant references (centers of spheres) were obtained with an acceptable fitting error (Table 2), acting as homologous points for each dataset. The average error of the sphere fitting was 3.5 mm and 6.2 mm for the TLS (Dataset I) and the PMMS (Dataset II), respectively. The alignment between both point clouds was implemented by means of CloudCompare [33]. This software provides a registration tool which can align two point clouds if there are at least three corresponding point pairs in both datasets.
The root mean square error (RMSE) of the individual Faro scans was 6.2 mm, whereas the RMSE of the alignment of the PMMS point cloud to the reference system was 12.1 mm. Note that the alignment error between the individual TLS point clouds generates an error propagation in the subsequent analysis—e.g., the cylinder fitting—especially in the small pipes.
Once both datasets (Figure 5) were georeferenced in the same CRS, different regions of interest were used for primitives fitting and quality assessment through a robust statistical analysis (Figure 6).
The regions chosen for the analysis are the next:
  • Pipes (cylindrical regions): Thermal and fluid-mechanics facilities as the machine rooms normally have numerous pipes with different diameters, typologies and lengths that join the boilers and other equips with the gas connections, with the residual gas evacuations and with the water circuits. For this reason, focusing on inspection tasks, it can be necessary to check if the installed pipes are appropriate considering the design specification criteria for the thermal and fluid-mechanic facilities and the standards and regulations. Furthermore, the registration of pipes is highly useful for maintenance tasks and the parameters of the installed pipes as the diameter must be also considered for future modifications or expansion of the installation. These reasons motivated the choice of diameters as main parameters to be extracted from the point clouds for the identification of the pipes. In this way, three representative pipe regions were chosen for each boiler (Figure 7). These were chosen for having the smallest diameter (e.g., gas pipes which inject the gas into the boiler) and the largest diameter (e.g., water return pipe). This last was evaluated in two different locations: in the connection with the boiler and in the roof (Figure 7a,b). The aim is to control the deviation between the point clouds used to fit the pipes using Zeb-Revo and Faro.
  • Planes referring to the interior enclosures of the machine room: the planes fitted from the vertical walls and the floor are chosen because these regions have interest for the documentation of volumetric parameters of the rooms, which are relevant for design and maintenance tasks as calculation of ventilation conditions, lighting design, emergency exists, etc. Furthermore, the relative location between the enclosures, the equipment and pipes are criteria to consider for compliance with standards and regulations.
  • Floor plane: One portion of the floor was chosen. The selection of this region was not easy because there were lot of obstacles which prevent its adequate segmentation. This region was selected without obstacles in order to analyze better its deviation (Figure 6).
  • Wall plane: Two portions of vertical walls were chosen (Figure 6). Again, these regions were selected without obstacles for providing a better analysis (Figure 6).

Feature Extraction of Pipes

First, to extract features of pipes a cylinder fitting was applied [32]. Particularly, this algorithm is based on a voting strategy well-known as RANSAC and can be implemented to detect different continuous and idealized geometries from point clouds (e.g., planes, spheres, cylinders, torus, etc.). In this case, the algorithm was applied to fit cylinders from the point clouds acquired in both datasets (Faro, Zeb-Revo). Once the cylinder was fitted, important features as diameters, lengths and a position were obtained. The quality of the adjustment was assessed through the discrepancy of each discrete point with respect to the ideal fitted cylinder.

Feature Extraction of Floor and Walls

The method to extract the features of the floor and wall regions is based on principal components analysis (PCA) algorithm which has been successfully applied to extract, from photogrammetric point clouds, geometrical features as angles between normal vectors of planes for the misalignment calculation of the steel welded plaques [8,34], as well as to compute the local 3D feature extraction for a machine learning classification of weld beads [35]. Specifically, PCA through the covariance matrix allows us to calculate the main components of the spatial points distribution, using the computation of eigenvectors. For instance, the eigenvector extracted from the smallest eigenvalue (λ0) indicates the normal direction (v0) to the fitting plane, and thus the normal direction for the wall and floor planes. Considering a point cloud of n points with coordinates x, y, z where xm, ym, zm are the centroid coordinates, the covariance matrix (2) for each of them is calculated from the matrix of points (W). The covariance matrix (C) has the values of the variance in the principal diagonal (2). By the diagonalization process of matrix C, the eigenvectors of the covariance matrix are obtained, and as a result, the three eigenvalues (λ1, λ2, λ3).
W = ( x 1 x m y 1 y m z 1 z m x n x m y n y m z n z m )
C = 1 n W T W = ( σ x x σ y x σ x z σ y x σ y y σ y z σ z x σ z y σ z z )
Using this procedure, planes were fitted from point clouds for both datasets (Faro-Dataset I, Zeb-Revo-Dataset II). The residuals were processed as the distance between each discrete point and the fitted planes. In this way, SD was calculated for the initial evaluation of the quality of the adjustment. Also, the misalignment between the planes was calculated (in mrad) as the angle between the normal vectors.

Primitive Fitting Error and Robust Statistical Analysis

Once planes and cylinders were fitted, a primitive fitting error was provided. The objective was to compare the Zeb-Revo results (Dataset II) with Faro results (Dataset I) used as ground truth. In this respect, point-primitive distances were computed for the elements described in the previous sections (Figure 6 and Figure 7), concretely for the two pipes (Figure 8) and for all the planes. In addition, a robust statistical analysis was applied over the samples to avoid the effect caused by outliers. In this context, several studies [36,37,38] demonstrated that in the accuracy assessment of data provided by laser scanner systems, as well as photogrammetry, the hypothesis that errors follow a Gaussian distribution is hardly verified. This might be due to the presence of residual system errors, but also to the presence of undesirable scanned objects [22]. In the following analyses non-parametric estimators, the median m, normalized median absolute deviation (NMAD) (3) and the square root of the biweight midvariance (BWMV) (4), were employed. Specifically, the NMAD (3) allows to compare error dispersions from Gaussian samples, since it is normalized by the inverse of the cumulative distribution function of the Gaussian [39]
NMAD   = 1.4826 MAD
BWMV = n i = 1 n a i ( x i m ) 2 ( 1 U i 2 ) 4 ( i = 1 n a i ( 1 U i 2 ) ( 1 5 U i 2 ) ) 2
a i = { 1 ,   i f | U i | < 1 0 ,   i f | U i | 1
U = x i m 9 MAD
being the median absolute deviation MAD (7) the median (m) of the absolute deviations from the data’s median (mx)
MAD = m ( | x i m x | )
Additionally, the interpercentile range (IPR) at 50% and 95% of confidence level were reported. Please note also that due to the asymmetry of the error distribution was not possible to provide a plus-minus range, but an absolute interpercentile range; therefore, the percentile values at 2.5% and 97.5% were reported to outline the aforementioned asymmetry.

3. Results

As consequence of the direct application of the proposed methodology, results were obtained. In this way, a comparison between the cylinders fitted from the two datasets (Faro and Zeb-Revo) is shown in Table 3, Table 4 and Table 5, whereas the results for the planes fitted (roof and walls) are shown in Table 6. Results from the robust statistical analysis where points from Zeb-Revo were compared with respect to the cylinders and planes fitted from Faro are outlined in Table 7 and Table 8.

3.1. Cylinder Fitting for Pipes

The standard deviation (SD) and diameter discrepancies of the cylinders fitted were calculated (Figure 8) (Table 3, Table 4 and Table 5). Ideally, this discrepancy must be zero but, in this case, it is a useful accuracy measure of the method.
The SD for the fitting process for the Dataset I (Faro) was between 1 and 7 mm (being higher in those cylinders located on the roof). These results (Table 3, Table 4 and Table 5) were considered as reference for comparison (ground truth).
As it was indicated in Table 3, Table 4 and Table 5, the diameter discrepancies obtained with both sensors (Faro and Zeb-Revo) were between 0.6 and 1.9 cm for all the analyzed pipes, but analyzing discrepancies in relative terms, the deviation between the two diameters of the two cylinders fitted (Faro and Zeb-Revo) was notably higher for small diameter cylinders (21.55%) than for large diameter cylinders (3.2% and 4.8%).
The computation of distances between the point clouds obtained using Zeb-Revo (Dataset II) and the cylinders fitted from the Dataset I (Faro); and the subsequently application of the robust statistical analysis gave some results (Table 7) that can be summarized in the next way:
  • Bias results: the median in the cylinders of bigger diameter is between 2.6 and -3.2 mm, whereas for cylinders of smaller size the median is around 8 mm (Table 7). The latter is compatible with the difference in diameter of approximately 1 cm between the cylinders adjusted for both sensors (Table 3).
  • Dispersion results: Robust analysis using the normalized median absolute deviation (NMAD) and the interpercentile range (IPR) (Table 7 and Table 8) shows higher dispersion results for cylinders with larger diameter, always remaining at 1.45 and 0.65 cm, whereas dispersion results are smaller for smaller diameters. The latter and the results of median indicate that there is an initial bias in the cylinders with a small diameter and this error is not due to the dispersion of the data obtained with Zeb-Revo. Please note, that gas pipes shown the highest discrepancies in relative values, but in the present analysis (absolutes values) they are lowest. This behavior is caused by the discrepancy computation which depends inversely proportional to the cylinder diameter.
The robust statistical analysis carried out also discards that the distribution of distances of the points obtained with Zeb-Revo with respect to the cylinders adjusted with Faro follows a Gaussian distribution (on the basis of a visual inspection of a quantile-quantile plot).

3.2. Plane Fitted for Floor and Wall Regions

The standard deviation of the fitting was calculated for each plane (Figure 8). The SD of the fitting is between 1.7 and 2.6 mm for the Dataset I (Faro) and between 7 and 8.8 mm for Dataset II (Zeb-Revo). These results are consistent because the accuracy of Faro is around 2 mm and the expected accuracy of Zeb-Revo is centimetric. The results of Dataset I were considered as reference for comparison for the subsequent robust statistical analysis.
The computation of distances between the cloud of points obtained with Zeb-Revo (Dataset II) and the cylinders fitted from Faro (Dataset I) and the application of the robust statistical analysis gave some results that can be summarized as follows (Table 8):
  • Bias results: The median in vertical planes (walls) was significantly higher than in horizontal plane (floor). It could be the consequence of an initial bias of unknown origin, which, as hypothesis, could be caused by the different surface finish of wall in relation to the floor one, as well, as the relative position and distance regarding the path of the PMMS data acquisition.
  • Dispersion results: Robust statistical analysis with MAD and IPR showed homogeneous dispersion results in all cases (Table 7 and Table 8).

3.3. In-Detail Elements: Qualitative Analysis

Different discrete elements have been segmented from point clouds in order to qualitatively assess the level of visualization of these. In Figure 9 is shown a gas pressure regulator system (usually installed in thermal installations) located at the entrance of the boilers. As the reader can see, the difference in the resolution between the two datasets is important but the points of the PMMS are enough for the identification of the valve, because the three elements of the system are distinguishable. Note that both point clouds present outliers.
In Figure 10, a cutting valve (usual in most fluid-mechanical installations) is located in the connection to the boiler water pipe. In this, the geometry of the valve is defined in both point clouds, however the final part of the grip is not appreciated in the PMMS point cloud, whereas in the TLS point cloud the valve is fully appreciated. In Figure 11, a boiler burner is shown. In this case, the completeness is higher in the PMMS point cloud but the final part of the grip is not appreciated in the TLS point cloud. This is due to the fact that PMMS takes the data in motion and all the zones are covered, whereas the TLS is static, and the completeness of the models depends on the number of stations of the laser scanner. Finally, a hot water tank is shown in Figure 12. In this case, the same thing happens: the PMMS point cloud is more complete than the TLS point cloud, while this last presents a higher resolution and detail perception.

4. Discussion

Indoor mapping and modeling is probably the main application scenario for PMMS. This becomes even more significant in the specific case of industrial facilities, where the present elements can be reconducted on the basis of parametric geometries and therefore deliver a BIM. For this case, PMMS offers the best compromise between spatial resolution, precision, surveying time, and cost [12].
The potential advantages of PMMS can be summed up on the completeness of the data acquisition thanks to the maneuverability and flexibility of the PMMS in complex scenarios; and the speed of acquisition due to the lack of static stations. Regarding the advantages of the PMMS in relation to the TLS, the key factor is the reduced surveying time. In the present study case, the surveying time for the 4 TLS scans encompassed 28 min and 40 s, whereas the PMMS required only 4 min and 18 s. Ergo, the surveying time was reduced in almost seven times, obtaining at the same a comparable level of completeness.
The results of the primitive fitting are inside the interval expected on the basis of the manufacturer a-priori precision (standard deviation lower than 3 cm). However, in terms of the computed pipe diameters, there was identified a bias. Considering the analysis of the pipes, the bias existing in the smaller pipes is significant. This could be caused by the alignment error during the SLAM processing. Since the precision of the PMMS is about 1 to 3 cm, this error becomes noteworthy for pipes diameters about 8 cm. However, other error sources are not excluded, such as the high curvature of the pipe and/or the surface finish. As a result, this issue will require further investigations. Regarding the water pipes, due to the larger diameter, the relative discrepancy is lower than 5% (Table 4 and Table 5). Please note that in the case of the roof water pipes the discrepancies could reach a bit higher values (up to 8.2% as stated in Table 5). This could be caused by the object–sensor distance and the lower completeness due to the limited point of view and small distance among pipes.
The extension of the pipe analysis from the diameter value up to the complete pipe, the PMMS point cloud discrepancies, against the primitive from TLS, decrease for the small pipes (gas), whereas for the larger (water), the discrepancy is zero centered in a ±3 mm interval. Therefore, the PMMS is a suitable sensor for the maintenance, inspection, and safety tasks in fluid-mechanical installation, due to the lack a significant bias, and relative diameter discrepancies lower than 5%. For the gas pipes (diameters lower than 10 cm), the use of the PMMS is limited to general documentation purposes (e.g., location of the pipes).
The static nature of the TLS data acquisition gave place to occlusions in the reference point cloud, but also non-acquisition of parts of the fluid-mechanical installations (e.g., valves, grips). This first issue (occlusions) could not be especially relevant in the primitive fitting due to the careful planning of data acquisition phase; however, the absence of TLS data causes outliers in the point-to-point analysis. So, this discrete analysis requires to take into account the point’s neighborhood to avoid mismatches in the discrepancy calculation. Regarding the non-acquisition of small parts, the dynamic nature of the PMMS makes it more suitable than TLS to document industrial facilities.
Regarding the plane analysis, the primitive fitting from PMMS point cloud is compatible with the technical specifications. The derived robust confidence intervals are more symmetrical than the pipes ones. The IPR 95% lower than 35 mm is a very significant results related to the PMMS ability to record this kind of complex environment. For both vertical planes, a significant bias was detected, that could be caused by the surface finish (in relation to the floor plane). In addition, the object-sensor relative position during the data acquisition path (see Figure 4) could be another explanation for the abovementioned bias. The last possible error source is a residual error from the alignment procedure carried out with spheres. This effect is inevitable, but it is diminished by the fact of being both active sensors (the scale parameter is not expected to be significant), remaining only the error from the sphere network design and sphere centroid extraction. However, the centimetric error provided by the PMMS unlike the millimetric error of the TLS, can generate an error in the alignment of the point clouds which justify the bias. The obtention of additional information as the plane misalignment can check the plane orientation, a normally neglected aspect in the analysis of 3D fitting. As expected, the floor plane misalignment is not significant, since it is in the same precision range than the precision construction levels (approximately 0.1 gons). However, for the wall planes it is noticed a significant put-of-plumb condition, with an equivalent displacement of 2 to 4.5 cm for a four meters height (value which exceeds the tolerances of the support plates of the beams used for industrial installations). This angular discrepancy can be attributed to the aforementioned wall’s surface finish, and to a lesser extent, the data acquisition path and the residual error on the alignment of the PMMS in relation to the TLS.
Finally, regarding the robust analysis, it can be noted that a slight overestimation of the dispersion values for the Gaussian assessment in relation to the NMAD. In relation to the robust dispersion parameters, NMAD and the square root of BWMV present compatible values. The robust confidence interval provides information related to the asymmetry of the discrepancy sample. When the non-normality is very pronounced (e.g., kurtosis > 10) the Gaussian-derived confidence interval tend to be overestimated. The comparison with the robust interval, for the present study case, reach difference up to 10 mm for the water return pipe 3 (roof).

5. Conclusions

A quantitative and qualitative comparison between the results obtained using a novel PMMS (Zeb-Revo) and the results obtained with a TLS (Faro) for inspection tasks in thermal and fluid-mechanical facilities is provided. Point clouds gathered from both devices were aligned in the same coordinate system using a network of spheres. Segmentation of objects of interest (walls, roofs, floors, and pipes) was implemented to fit ideal geometries useful for the extraction of important features of the facility, as cylinder (pipes) and planes (walls and roof) that allow to extract different features of interest. The different results obtained with the two sensors were compared applying a robust statistical analysis to evaluate the real potential of the PMMS. Additionally, different specific devices of interest—such as valves, regulation systems, tanks, or burners—were segmented from the two datasets to qualitatively show the level of detail which allows Zeb-Revo in comparison with Faro. Globally, the PMMS performance is inside the technical specification provided by the manufacturer, as it is shown by other studies [22].
The deviation in the estimation of the diameter in the analyzed pipes using Zeb-Revo (with respect to the dataset obtained with Faro) is between 9 and 16 mm when a RANSAC fitting methodology is applied. This deviation could be acceptable for inspection tasks of industrial facilities such as the one proposed in [4]. This deviation in relative terms is higher for pipes with smaller diameter (21.55% in an 8 cm pipe), whereas this relative deviation is better for pipes with higher diameter (3.23% and 4.8% in a 28 cm pipe), always remaining around the centimetric precision given by the Zeb-Revo manufacturer.
A robust statistical analysis was applied to compare the deviation of the discrete points acquired from Zeb-Revo with respect the ideal cylinder fitted from Faro. This analysis shows acceptable results of bias and dispersion (NMAD between 6.5 and 14.5 mm), but for those cylinders of smaller diameter, a bias is detected (7.5–8 mm). This bias could be the main cause of the high percentage deviation in the diameter measurement of those pipes and the origin is not completely explained (pipe curvature, surface finish, etc.) as stated in the discussion section.
The studied planes fitted from points for each dataset show geometrical similitude. This is evaluated through the angle between the normal vector of the plane generated from Zeb-Revo and the one generated with Faro. The misaligned angle analysis allowed to identify an angular discrepancy for the wall planes, whereas in the case of the floor plane, the value 1.3 mrad can be considered a very good result. However, while the dispersion results studied with NMAD, square root of BWMV and IPR are suitable for the three planes (NMAD between 5.9 and 7.4 mm), a significant bias is detected in vertical planes (median −27.2 and −12.8 mm).
Finally, the extraction and qualitative analysis of the specific in-detail elements from the two datasets shows the differences in terms of resolution between them. The identification of element is obviously more evident using TLS (also considering the color registration, which is an added value for the definition of these elements). However, the completeness of the PMMS point cloud can be even higher than the dataset obtained from TLS, allowing for visual identification of elements commonly used in the facilities, such as cutting valves, pressure regulation systems, and burner systems.
Future works will address the improvement of the processes of alignment that allows to obtain an answer to the problem of the bias.

Author Contributions

Conceptualization, M.R.-M. and P.R.-G.; Methodology, M.R.-M. and P.R.-G.; Data acquisition, M.R.-M. and P.R.-G.; Validation, M.R.-M., P.R.-G., and E.R.d.O.C.; Formal analysis, M.R.-M. and P.R.-G.; Resources, D.G.-A.; Writing—original draft preparation, M.R.-M., P.R.-G., E.R.d.O.C., and D.G.-A.; Writing—review and editing, M.R.-M., P.R.-G., and D.G.-A.

Funding

This research received no external funding.

Conflicts of Interest

The authors declare no conflict of interest.

References

  1. Gonzalez-Aguilera, D.; Del Pozo, S.; Lopez, G.; Rodriguez-Gonzalvez, P. From point cloud to CAD models: Laser and optics geotechnology for the design of electrical substations. Opt. Laser Technol. 2012, 44, 1384–1392. [Google Scholar] [CrossRef]
  2. Rodríguez-Gonzálvez, P.; Gonzalez-Aguilera, D.; Lopez-Jimenez, G.; Picon-Cabrera, I. Image-based modeling of built environment from an unmanned aerial system. Autom. Constr. 2014, 48, 44–52. [Google Scholar] [CrossRef]
  3. Caldwell, R. Hull inspection techniques and strategy-remote inspection developments. In Proceedings of the SPE Offshore Europe Conference & Exhibition, Aberdeen, UK, 5–8 September 2017. [Google Scholar]
  4. Rodríguez-Martín, M.; Rodríguez-Gonzálvez, P.; Gonzalez-Aguilera, D.; Nocerino, E. Novel Approach for Three-Dimensional Integral Documentation of Machine Rooms in Hospitals Using Portable Mobile Mapping System. IEEE Access 2018, 6, 79200–79210. [Google Scholar] [CrossRef]
  5. Hullo, J.F.; Thibault, G.; Boucheny, C.; Dory, F.; Mas, A. Multi-Sensor As-Built Models of Complex Industrial Architectures. Remote Sens. 2015, 7, 16339–16362. [Google Scholar] [CrossRef] [Green Version]
  6. Pătrăucean, V.; Armeni, I.; Nahangi, M.; Yeung, J.; Brilakis, I.; Haas, C. State of research in automatic as-built modeling. Adv. Eng. Inform. 2015, 29, 162–171. [Google Scholar] [CrossRef]
  7. Quattrini, R.; Malinverni, E.S.; Clini, P.; Nespeca, R.; Orlietti, E. From TLS to HBIM. High quality semantically-aware 3d modeling of complex architecture. Int. Arch. Photogramm. Remote Sens. Spat. Inf. Sci. 2015, 367–374. [Google Scholar] [CrossRef]
  8. Rodríguez-Martín, M.; Rodríguez-Gonzálvez, P.; Lagüela, S.; González-Aguilera, D. Macro-photogrammetry as a tool for the accurate measurement of three-dimensional misalignment in welding. Autom. Constr. 2016, 71, 189–197. [Google Scholar] [CrossRef]
  9. Rodríguez-Gonzálvez, P.; Rodríguez-Martín, M.; Ramos, L.F.; González-Aguilera, D. 3D reconstruction methods and quality assessment for visual inspection of welds. Autom. Constr. 2017, 79, 49–58. [Google Scholar] [CrossRef]
  10. Muhammad, J.; Altun, H.; Abo-Serie, E. Welding seam profiling techniques based on active vision sensing for intelligent robotic welding. Int. J. Adv. Manuf. Technol. 2017, 88, 127–145. [Google Scholar] [CrossRef]
  11. Shah, H.N.M.; Sulaiman, M.; Shukor, A.Z.; Kamis, Z.; Rahman, A.A. Butt welding joints recognition and location identification by using local thresholding. Robot. Comput. Integr. Manuf. 2018, 51, 181–188. [Google Scholar] [CrossRef]
  12. Nocerino, E.; Rodríguez-Gonzálvez, P.; Menna, F. Introduction to mobile mapping with portable systems. In Laser Scanning: An Emerging Technology in Structural Engineering; CRC Press: Boca Raton, FL, USA, 2019; pp. 37–52. [Google Scholar]
  13. Nocerino, E.; Menna, F.; Toschi, I.; Morabito, D.; Remondino, F.; Rodríguez-Gonzálvez, P. Valorisation of history and landscape for promoting the memory of WWI. J. Cult. Herit. 2017, 29, 113–122. [Google Scholar] [CrossRef]
  14. Russhakim, N.A.S.; Ariff, M.F.M.; Majid, Z.; Idris, K.M.; Darwin, N.; Abbas, M.A.; Zainuddin, K.; Yusoff, A.R. The Suitability of Terrestrial Laser Scanning for Building Survey and Mapping Applications. Int. Arch. Photogramm. Remote Sens. Spat. Inf. Sci. 2019, 42, 663–670. [Google Scholar] [CrossRef]
  15. Nikoohemat, S.; Peter, M.; Oude Elberink, S.; Vosselman, G. Exploiting indoor mobile laser scanner trajectories for semantic interpretation of point clouds. ISPRS Ann. Photogramm. Remote Sens. Spat. Inf. Sci. 2017, 2017, 355–362. [Google Scholar] [CrossRef]
  16. Rodríguez-Gonzálvez, P.; Nocerino, E. Portable Mobile Mapping Systems applied to the Management of Natural Spaces. In New Developments in Agricultural Research; Nova Science Publishers: New York, NY, USA, 2019; pp. 1–43. [Google Scholar]
  17. GeoSlam Zeb-Revo. Available online: https://geoslam.com/solutions/zeb-revo/ (accessed on 13 September 2019).
  18. Chiabrando, F.; Coletta, C.D.; Sammartano, G.; Spanò, A.; Spreafico, A. “Torino 1911” project: A contribution of a slam-based survey to extensive 3D heritage modeling. Int. Arch. Photogramm. Remote Sens. Spat. Inf. Sci. 2018, 225–234. [Google Scholar] [CrossRef]
  19. Dewez, T.J.B.; Yart, S.; Thuon, Y.; Pannet, P.; Plat, E. Towards cavity-collapse hazard maps with Zeb-Revo handheld laser scanner point clouds. Photogramm. Rec. 2017, 32, 354–376. [Google Scholar] [CrossRef] [Green Version]
  20. Masiero, A.; Fissore, F.; Guarnieri, A.; Pirotti, F.; Visintini, D.; Vettore, A. Performance Evaluation of Two Indoor Mapping Systems: Low-Cost UWB-Aided Photogrammetry and Backpack Laser Scanning. Appl. Sci. 2018, 8, 416. [Google Scholar] [CrossRef]
  21. Chiabrando, F.; Sammartano, G.; Spanò, A. A comparison among different optimization levels in 3D multi-sensor models. A test case in emergency context: 2016 Italian earthquake. Int. Arch. Photogramm. Remote Sens. Spat. Inf. Sci. 2017, 155–162. [Google Scholar] [CrossRef]
  22. Nocerino, E.; Menna, F.; Remondino, F.; Toschi, I.; Rodríguez-Gonzálvez, P. Investigation of indoor and outdoor performance of two portable mobile mapping systems. Proc. SPIE 2017, 10332. [Google Scholar] [CrossRef]
  23. Tucci, G.; Visintini, D.; Bonora, V.; Parisi, E. Examination of Indoor Mobile Mapping Systems in a Diversified Internal/External Test Field. Appl. Sci. 2018, 8, 401. [Google Scholar] [CrossRef]
  24. AENOR (Spanish Association for Standardisation). Machine Rooms and Gas Fired Self-Contained Apparatus for Heating or Cooling Generation or Cogeneration, Standard UNE 60601:2013. Available online: https://www.aenor.com/normas-y-libros/buscador-de-normas/une/?c=N0052265 (accessed on 12 November 2014).
  25. BOE (Official State Gazette of the Government of Spain). Real Decreto 2060/2008, de 12 de Diciembre, Por el Que se Aprueba el Reglamento de Equipos a Presión y Sus Instrucciones Técnicas Complementarias; Ministerio de Industria, Turismo y Comercio: Madrid, Spain, 2009; pp. 12297–12388.
  26. BOE (Official State Gazette of the Government of Spain). Real Decreto 1027/2007, de 20 de Julio, Por el Que se Aprueba el Reglamento de Instalaciones Térmicas en Los Edificios; Ministerio de la Presidencia: Madrid, Spain, 2007; pp. 35931–35984.
  27. Bosse, M.; Zlot, R.; Flick, P. Zebedee: Design of a Spring-Mounted 3-D Range Sensor with Application to Mobile Mapping. IEEE Trans. Robot. 2012, 28, 1104–1119. [Google Scholar] [CrossRef]
  28. Eyre, M.; Wetherelt, A.; Coggan, J. Evaluation of automated underground mapping solutions for mining and civil engineering applications. J. Appl. Remote Sens. 2016, 10, 20–39. [Google Scholar] [CrossRef]
  29. Cabo, C.; Del Pozo, S.; Rodríguez-Gonzálvez, P.; Ordóñez, C.; González-Aguilera, D. Comparing Terrestrial Laser Scanning (TLS) and Wearable Laser Scanning (WLS) for Individual Tree Modeling at Plot Level. Remote Sens. 2018, 10, 540. [Google Scholar] [CrossRef]
  30. Besl, P.; McKay, M. A method for registration of 3-D shapes. IEEE Trans. Pattern Anal. Mach. Intell. 1992, 14, 239–256. [Google Scholar] [CrossRef]
  31. Wujanz, D.; Barazzetti, L.; Previtali, M.; Scaioni, M. A Comparative Study among Three Registration Algorithms: Performance, Quality Assurance and Accuracy. Int. Arch. Photogramm. Remote Sens. Spat. Inf. Sci. 2019, 779–786. [Google Scholar] [CrossRef]
  32. Schnabel, R.; Wahl, R.; Klein, R. Efficient RANSAC for Point-Cloud Shape Detection. Comput. Graph. Forum 2007, 26, 214–226. [Google Scholar] [CrossRef]
  33. Cloud Compare. GPL Software (Version 2.9.1). Available online: www.danielgm.net/cc/ (accessed on 7 August 2019).
  34. Rodríguez-Martín, M.; Rodríguez-Gonzálvez, P.; Gonzalez-Aguilera, D.; Fernandez-Hernandez, J. Feasibility study of a structured light system applied to welding inspection based on articulated coordinate measure machine data. IEEE Sens. J. 2017, 17, 4217–4224. [Google Scholar] [CrossRef]
  35. Rodríguez-Gonzálvez, P.; Rodríguez-Martín, M. Weld Bead Detection Based on 3D Geometric Features and Machine Learning Approaches. IEEE Access 2019, 7, 14714–14727. [Google Scholar] [CrossRef]
  36. Höhle, J.; Höhle, M. Accuracy assessment of digital elevation models by means of robust statistical method. ISPRS J. Photogramm. Remote Sens. 2009, 64, 398–406. [Google Scholar] [CrossRef]
  37. Hasan, A.; Pilesjö, P.; Persson, A. The use of LIDAR as a data source for digital elevation models–a study of the relationship between the accuracy of digital elevation models and topographical attributes in northern peatlands. Hydrol. Earth Syst. Sci. Discuss. 2011, 8, 5497–5522. [Google Scholar] [CrossRef]
  38. Rodríguez-Gonzálvez, P.; Garcia-Gago, J.; Gomez-Lahoz, J.; González-Aguilera, D. Confronting Passive and Active Sensors with Non-Gaussian Statistics. Sensors 2014, 14, 13759–13777. [Google Scholar] [CrossRef] [Green Version]
  39. Herrero-Huerta, M.; Lindenbergh, R.; Rodríguez-Gonzálvez, P. Automatic tree parameter extraction by a Mobile LiDAR System in an urban context. PLoS ONE 2018, 13, e0196004. [Google Scholar] [CrossRef] [PubMed]
Figure 1. Faro Laser Scanner Focus 3D S (Left) by courtesy of www.faro.com; and GeoSlam Zeb-Revo (Right) by courtesy of https://geoslam.com.
Remotesensing 11 02205 g001
Figure 2. Pipeline for the validation of portable mobile mapping system for inspection tasks in thermal and fluid-mechanical facilities.
Remotesensing 11 02205 g002
Figure 3. Sphere located in a pillar of the machine room (attached by a neodymium magnet).
Remotesensing 11 02205 g003
Figure 4. Three-dimensional scene shown by GeoSlam viewer (a) and followed trajectory during the data acquisition (green line) (b).
Remotesensing 11 02205 g004
Figure 5. Dataset I: four point clouds obtained and aligned with Faro (a). Dataset II: point cloud obtained with Zeb-Revo (b). Dataset I: segmented point cloud to appreciate the distribution of facilities using Faro. (c). Dataset II: segmented point cloud to appreciate the distribution of facilities using Zeb-Revo (d).
Remotesensing 11 02205 g005
Figure 6. Different regions of interest used to fit the cylinders and planes (marked in green). The wall planes 1 and 2 are numbered in (a); while the floor planes and pipes highlighted are also shown in (b).
Remotesensing 11 02205 g006
Figure 7. Regions of interest (pipes) used to fit the cylinder primitives: Water return pipe region located in the floor (a), water return pipe region located in the boiler (b), and gas pipe region (c).
Remotesensing 11 02205 g007
Figure 8. Procedure used to compare the different point clouds in pipes regions. The same procedure is following to compare the plane regions.
Remotesensing 11 02205 g008
Figure 9. Example of points clouds of the pressure regulation system located at the entrance of the gas in the boilers obtained with Faro (Left) and with Zeb-Revo (Right).
Remotesensing 11 02205 g009
Figure 10. Example of points clouds of the cutting valve at the entrance of the water in the boilers obtained with Faro (Left) and with Zeb-Revo (Right).
Remotesensing 11 02205 g010
Figure 11. Example of points clouds of the burner system located in the boilers obtained with Faro (Left) and with Zeb-Revo (Right).
Remotesensing 11 02205 g011
Figure 12. Example of point clouds of the hot water tank obtained with Faro (Left) and with Zeb-Revo (Right).
Remotesensing 11 02205 g012
Table 1. Technical features of the PMMS, Zeb-Revo.
ParameterValue
Measurement range (indoor) (m)30
Measurement range (outdoor) (m)15
Data capture speed (points/s)43,200
Accuracy±0.1%
Relative accuracy1-3 cm
Field of view270° × 360°
Operating time (h)4
Scanner dimensions (mm)86 × 113 × 470
Weight (kg)0.85
Rotation frequency (Hz)0.5
Table 2. Standard deviation of the RANSAC-based sphere fitting to align both datasets in a global CRS.
SphereSD (m)
Zeb-RevoFaro
1±0.0064±0.0041
2±0.0067±0.0038
3±0.0057±0.0026
Table 3. Diameters discrepancies and standard deviations (SD) obtained from the RANSAC cylinder fitting of the pipes: gas pipe regions (Figure 7).
Gas Pipe
RegionsDiameter
TLS (m)
SD
TLS (m)
Diameter
PMMS (m)
SD
PMMS (m)
Discrepancy (m)% Discrepancy
10.078±0.0010.097±0.008−0.01924.08%
20.076±0.0010.094±0.008−0.01924.70%
30.075±0.0010.093±0.007−0.01824.34%
40.077±0.0010.088±0.007−0.01013.08%
−0.01621.55%
Table 4. Diameters discrepancies and standard deviations (SD) obtained from the RANSAC cylinder fitting of the pipes: water return pipe regions located in the boiler (Figure 7).
Water Return Pipe (Connection in the Boiler)
RegionsDiameter
TLS (m)
SD
TLS (m)
Diameter
PMMS (m)
SD
PMMS (m)
Discrepancy (m)% Discrepancy
10.287±0.0020.298±0.021−0.0113.94%
20.284±0.0030.294±0.014−0.0103.52%
30.284±0.0030.290±0.014−0.0062.11%
40.282±0.0030.291±0.016−0.0093.34%
−0.0093.23%
Table 5. Diameters discrepancies and standard deviations (SD) obtained from the RANSAC cylinder fitting of the pipes: water return pipe regions located in the roof (Figure 7).
Water Return Pipe (Roof)
RegionsDiameter
TLS (m)
SD
TLS (m)
Diameter
PMMS (m)
SD
PMMS (m)
Discrepancy (m)% Discrepancy
10.285±0.0040.275±0.0180.0103.47%
20.242±0.0070.260±0.026−0.0187.24%
30.245±0.0050.265±0.017−0.0208.22%
40.275±0.0060.275±0.014−0.0000.11%
0.0124.76%
Table 6. Results of the fitting for the vertical planes (walls) and horizontal plane (roof) from point clouds regions (Figure 6).
Number of PointsNormal Vector CoordinatesSD (m)Misaligned Angle (Mrad)
xyz
Floor planeFaro3896744−0.00230.00241.00000.00261.334
Zeb-Revo120780−0.00360.00271.00000.0070
Vertical wall 1Faro4060260.39030.9027−0.00370.00194.567
Zeb-Revo93870.39270.9197−0.00330.0088
Vertical wall 2Faro4438520.39350.91930.00490.001711.250
Zeb-Revo197840.39670.9179−0.00580.0083
Table 7. Gaussian vs. Robust statistical analysis: Different regions analyzed (1–4) comparing the discrete points from Zeb-Revo with respect to the fitted surface (cylinder or plane) generated from Faro.
Gaussian AssessmentRobust Assessment
KurtosisSkewnessSample
Mean
Sample
Deviation
MedianMADNMADSqrt (BWMV)IPR 50%Perc. 0.025Perc. 0.975IPR 95%
Water return pipe (boiler) (2)6.3530.6180.0020.0120.0010.0070.0110.0120.014−0.0200.0260.047
Water return pipe (boiler) (3)3.6940.3430.0030.0140.0030.0090.0140.0140.019−0.0230.0340.057
Gas pipe (2)2.9410.2020.0080.0090.0070.0060.0090.0090.013−0.0090.0280.037
Gas pipe (3)4.201−0.0430.0080.0070.0080.0040.0070.0070.009−0.0060.0220.028
Water return pipe (roof) (3)32.0283.2130.0010.0200.0000.0100.0140.0150.020−0.0300.0390.069
Water return pipe (roof) (4)3.4410.047−0.0030.014−0.0030.0090.0130.0140.018−0.0300.0260.055
Vertical wall (1)79.3033.399−0.0270.009−0.0270.0050.0070.0080.010−0.042−0.0110.031
Vertical wall (2)4.2770.184−0.0130.008−0.0130.0050.0070.0080.010−0.0290.0050.034
Floor plane11.7010.146−0.0030.007−0.0030.0040.0060.0060.008−0.0160.0110.027
Table 8. Summary of bias and dispersion data for the analyzed regions (1–4) comparing the discrete points from Zeb-Revo with respect to the fitted surface (cylinder or plane) generated from Faro.
BiasDispersion
Median (mm)NMAD (mm)Sqrt (BWMV) (mm)IPR 50% (mm)IPR 95% (mm)Perc 0.025Perc 0.975
Water return pipe (boiler) (2)1.4±10.9±11.614.546.5−20.326.3
Water return pipe (boiler) (3)2.6±13.7±14.018.657.3−23.234.1
Gas pipe (2)7.5±9.4±9.512.736.6−9.027.6
Gas pipe (3)8.0±6.5±6.88.828.2−6.122.1
Water return pipe (roof) (3)−0.4±14.5±15.519.568.8−29.938.9
Water return pipe (roof) (4)−3.2±13.4±13.818.255.4−29.725.8
Vertical wall (1)−27.2±7.1±7.69.731.2−41.8−10.6
Vertical wall (2)−12.8±7.4±8.010.034.1−29.05.1
Floor plane−3.2±5.9±6.48.026.9−16.310.7

