A Hierarchical Airport Detection Method Using Spatial Analysis and Deep Learning

 ,
, 
Abstract
1. Introduction
2. Materials
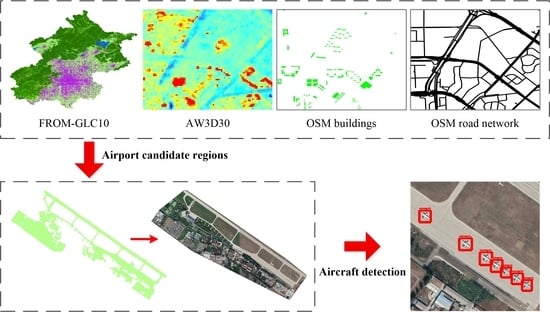
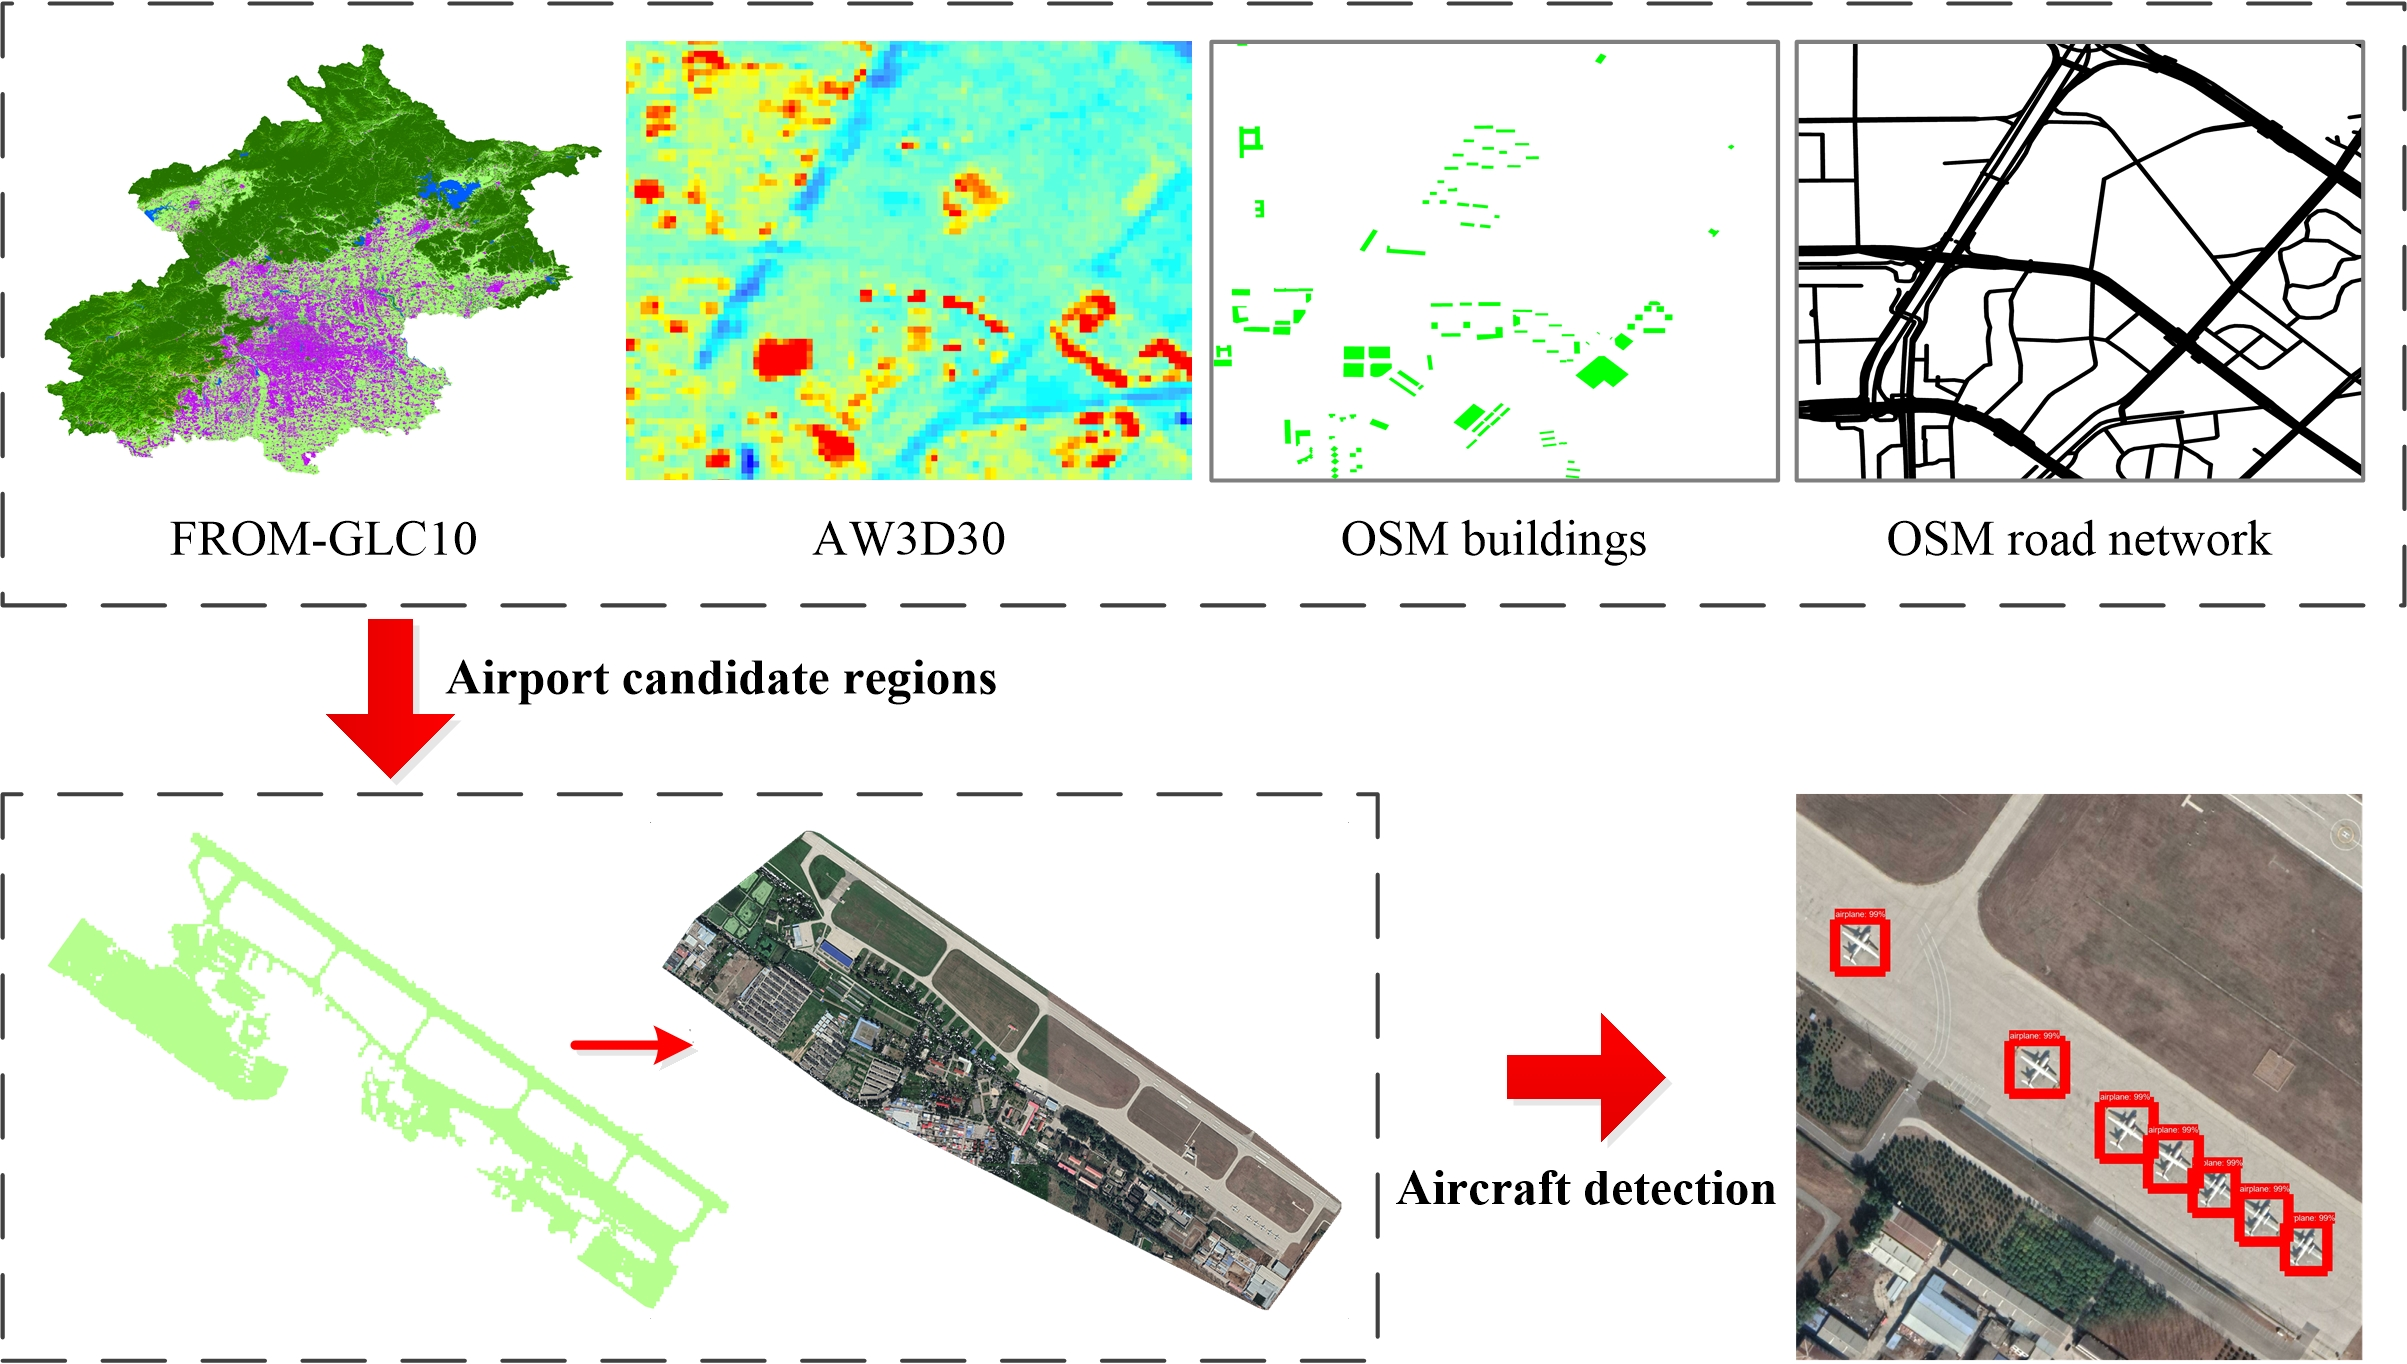
3. Methods
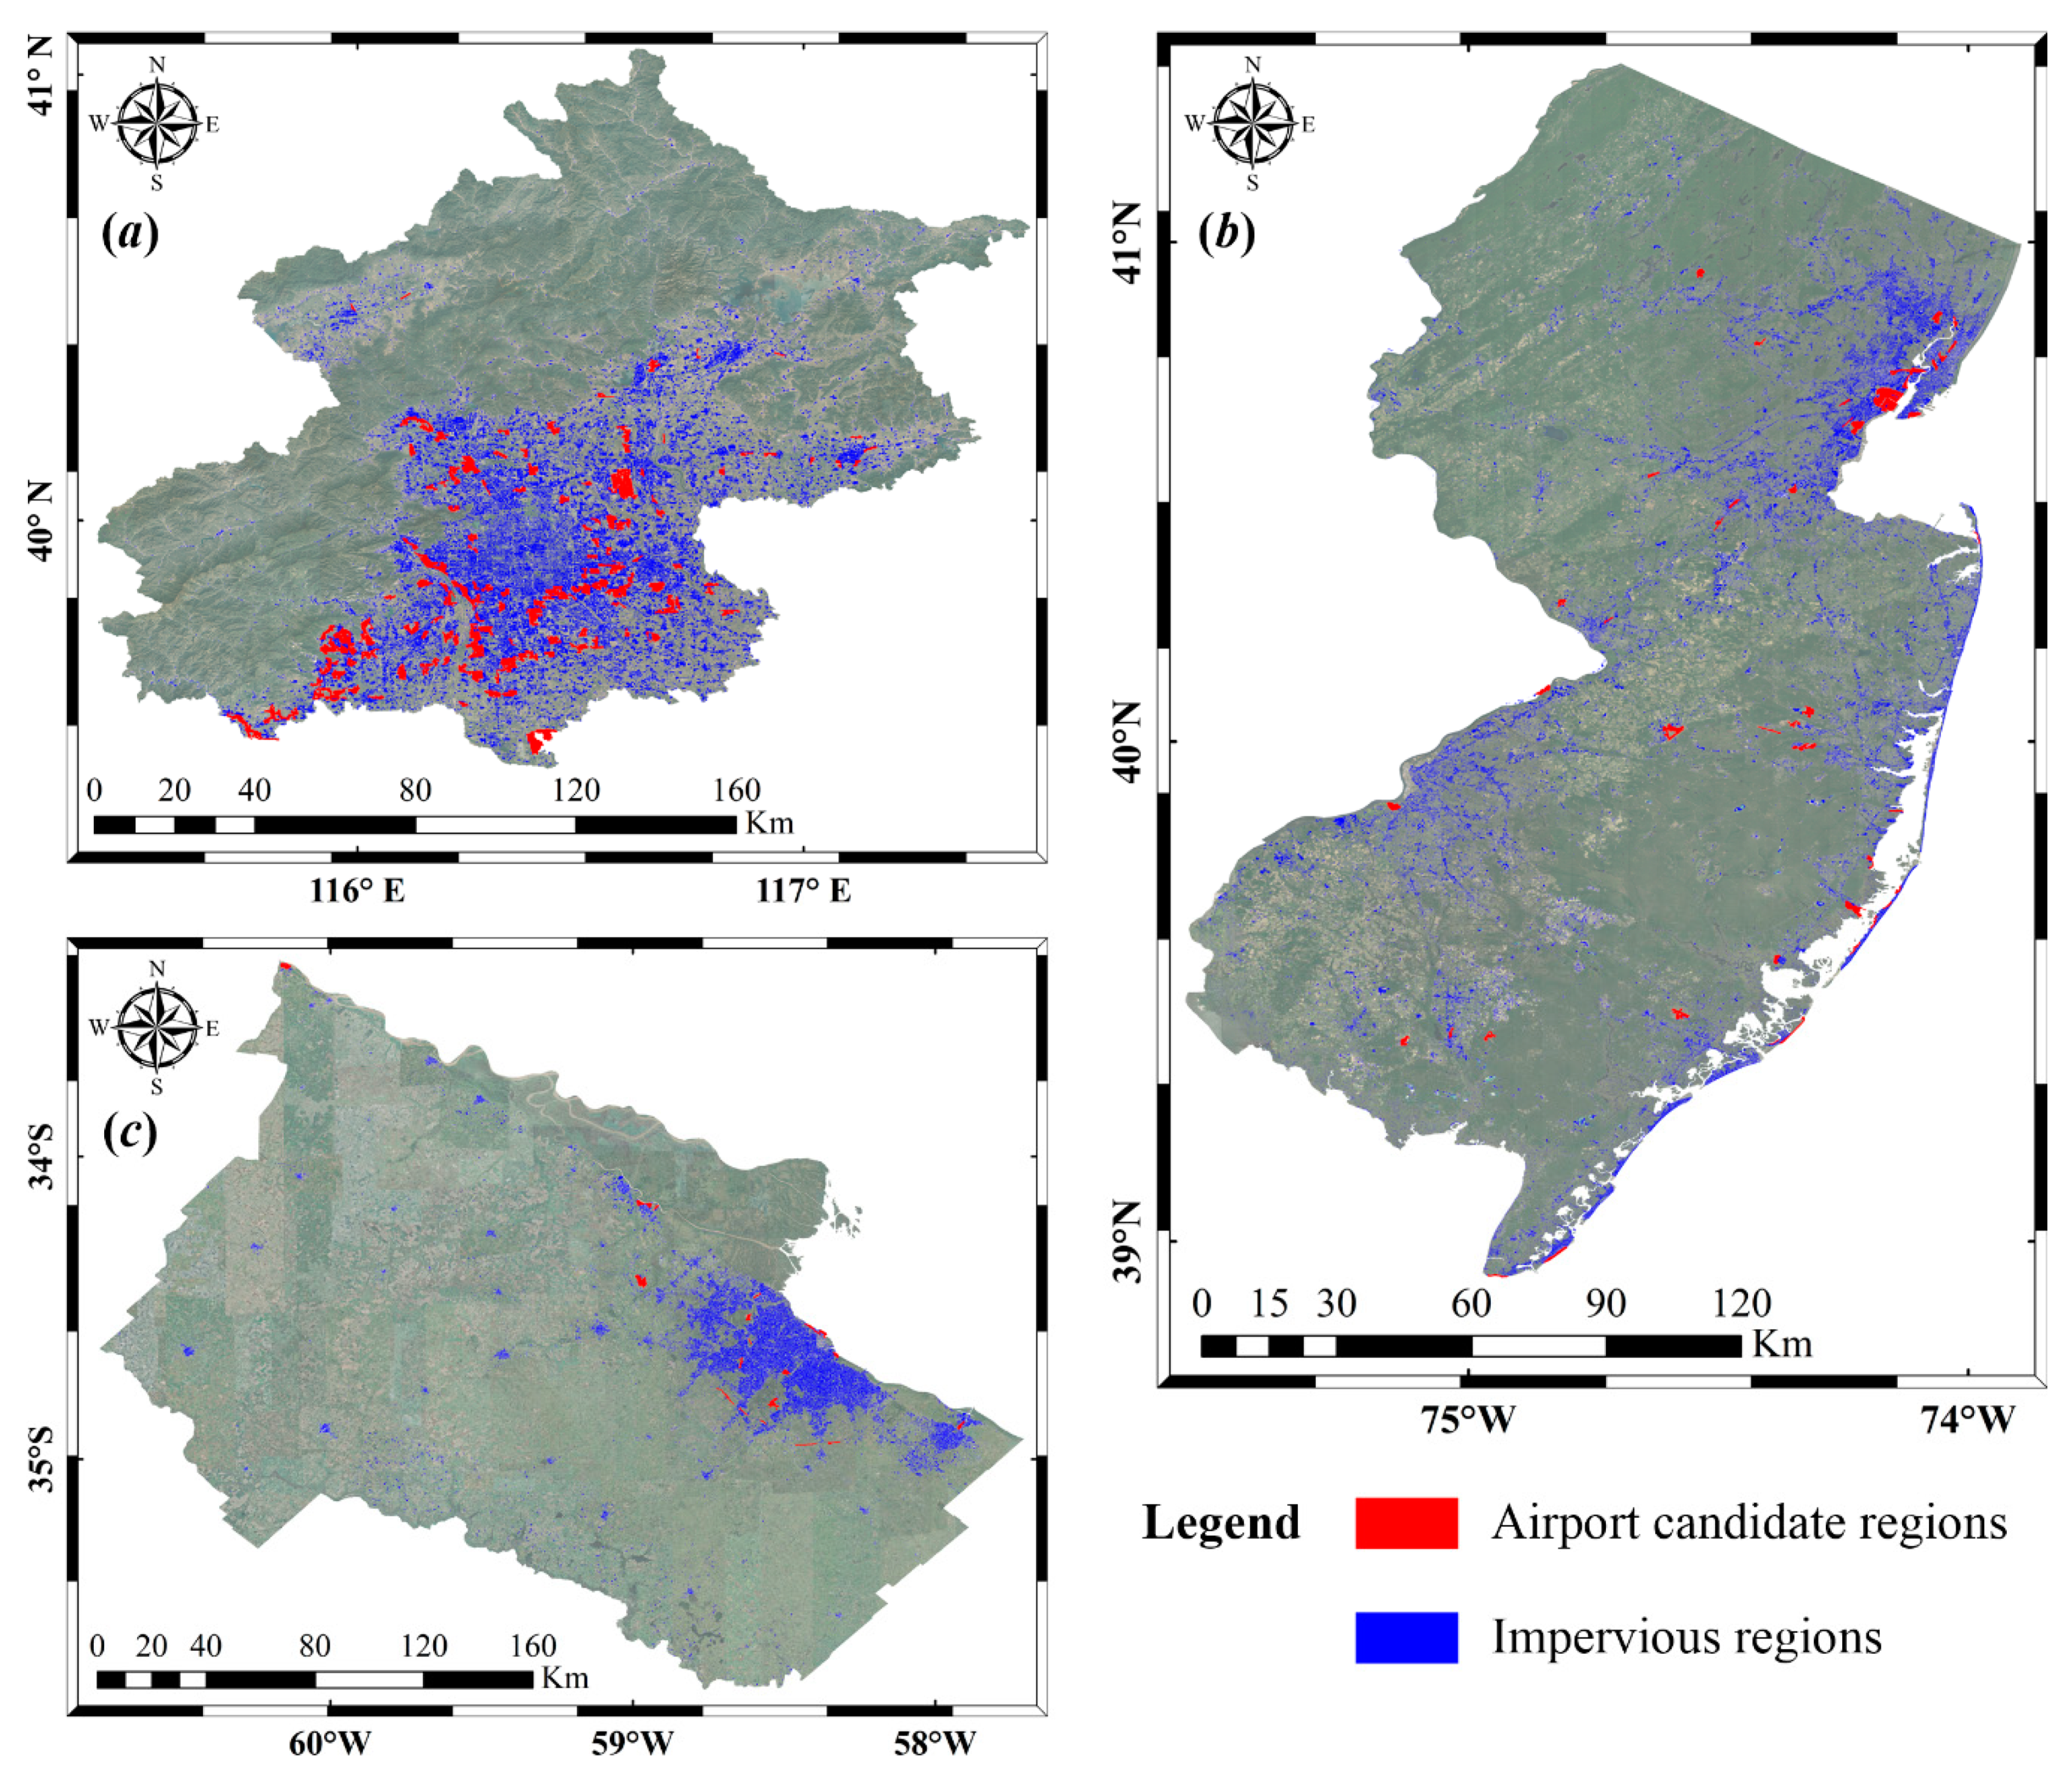
3.1. Candidate Airport Regions
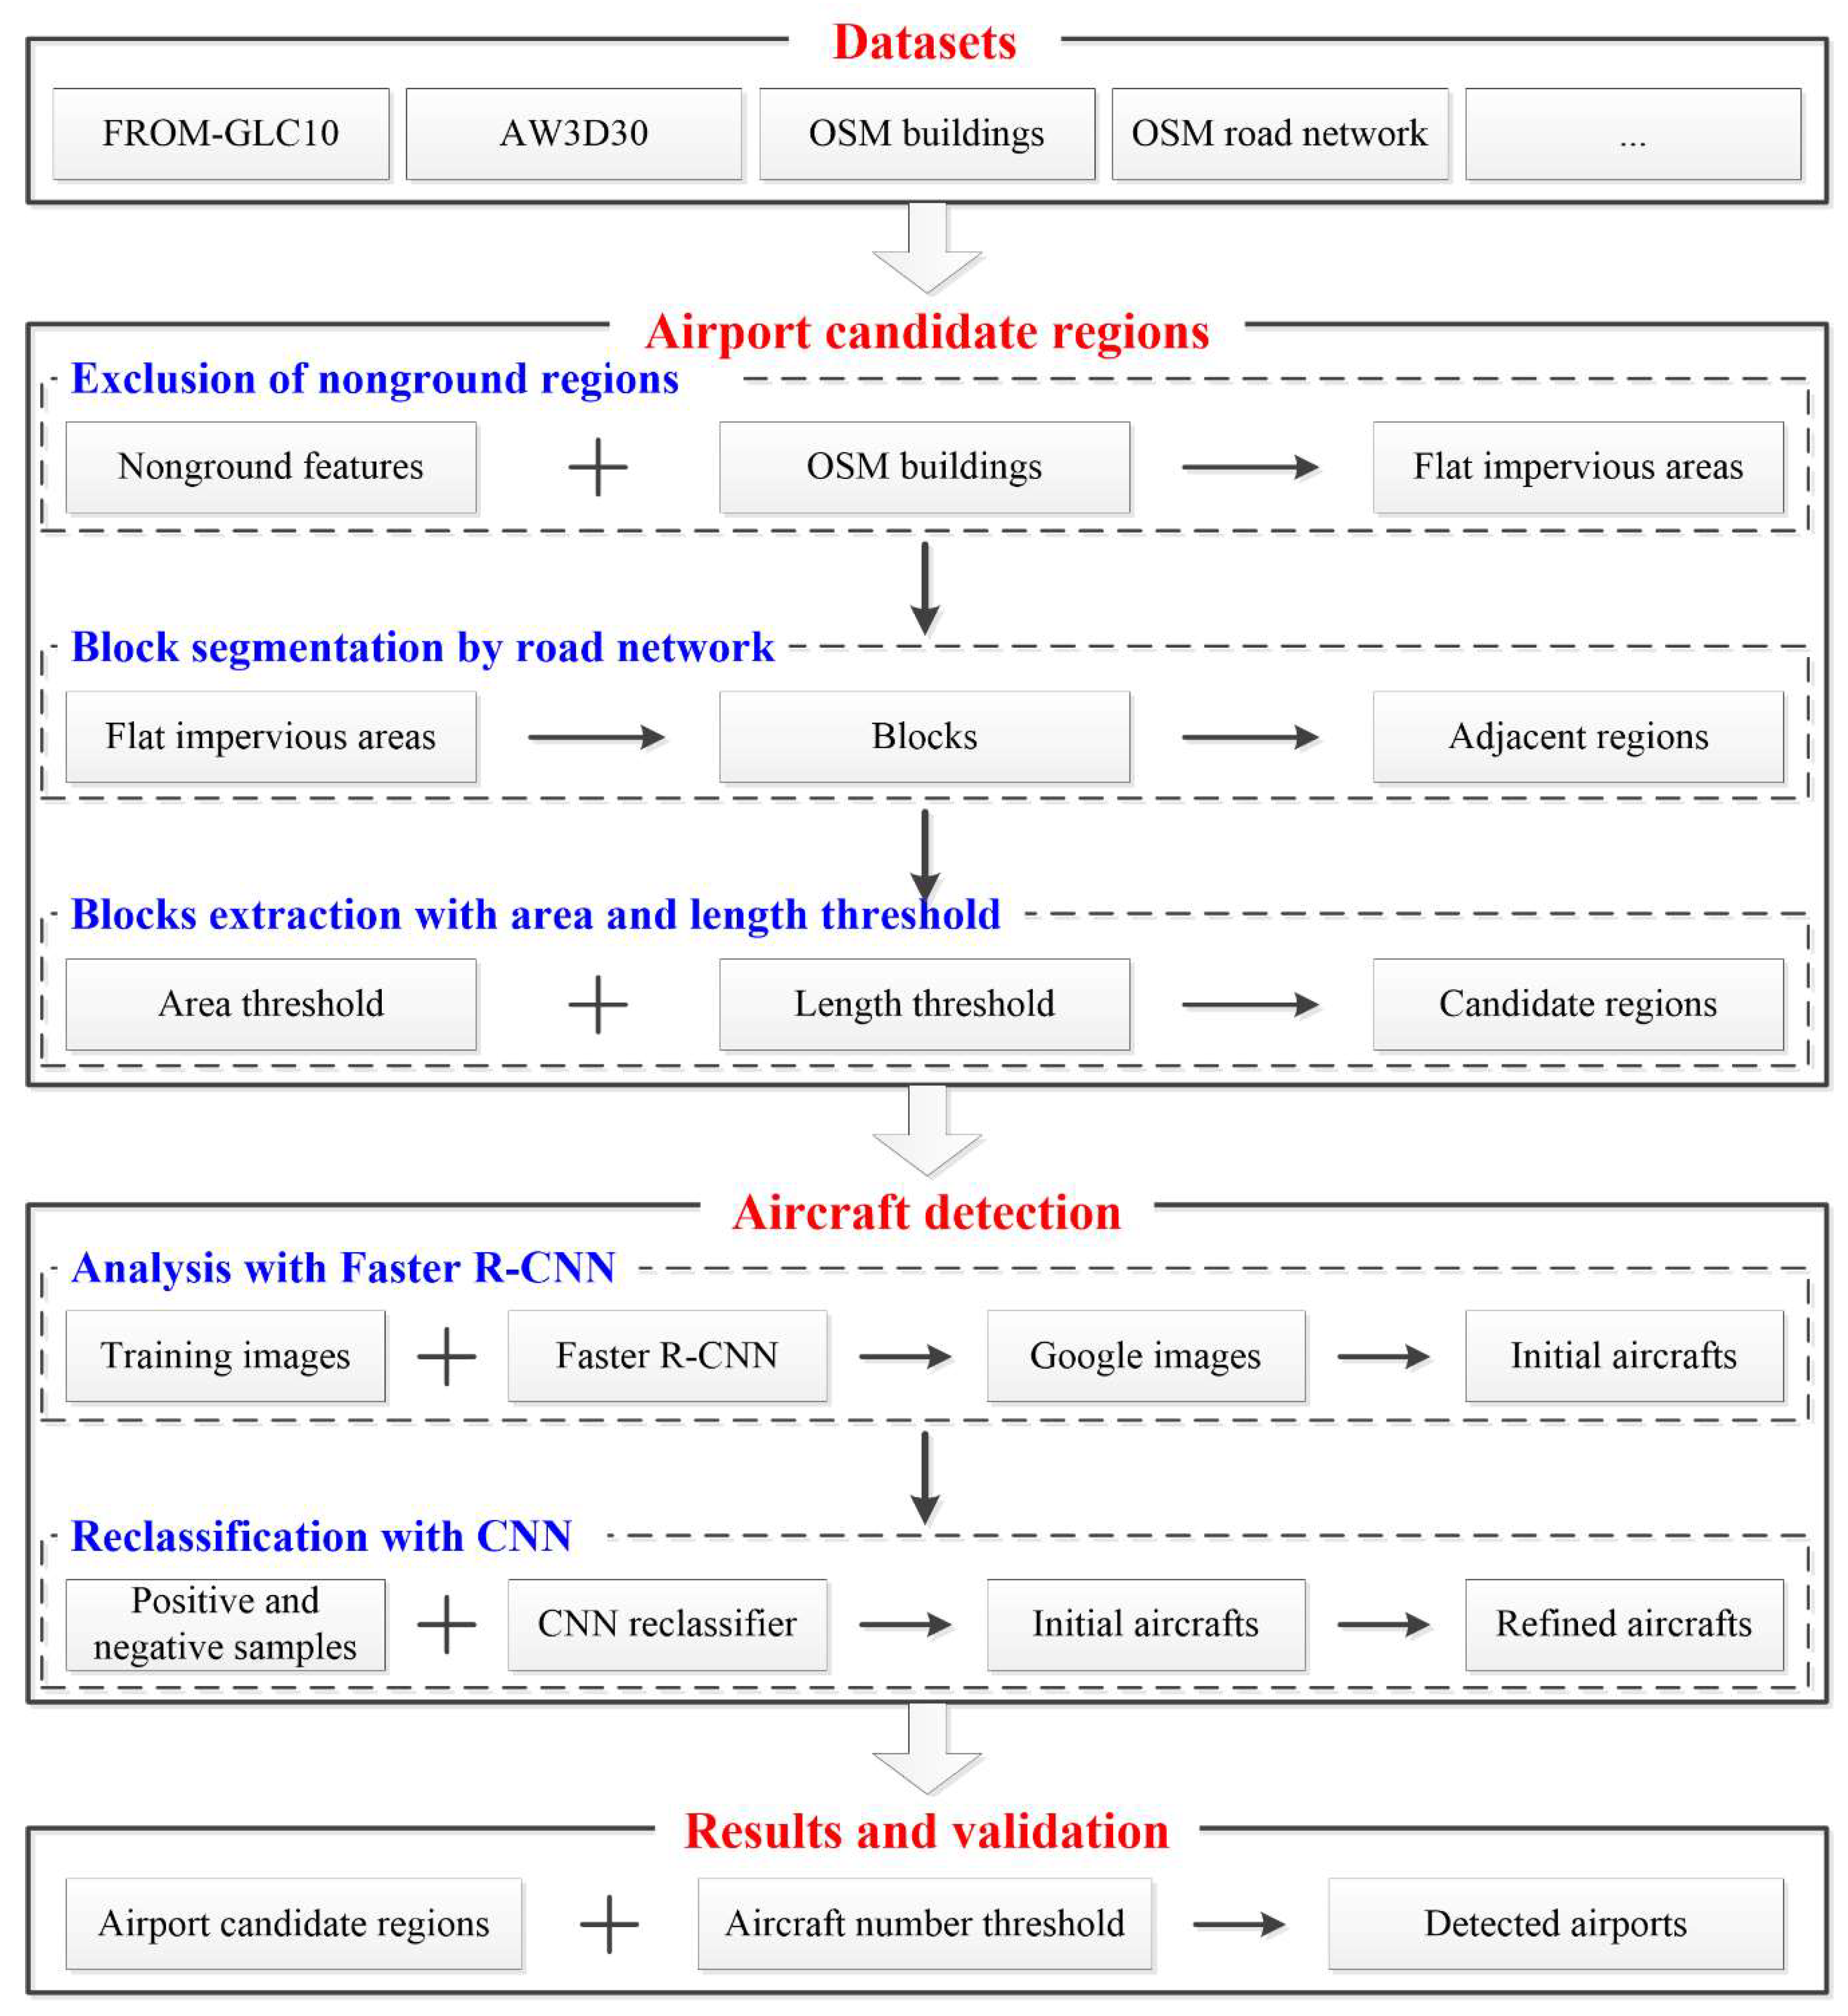
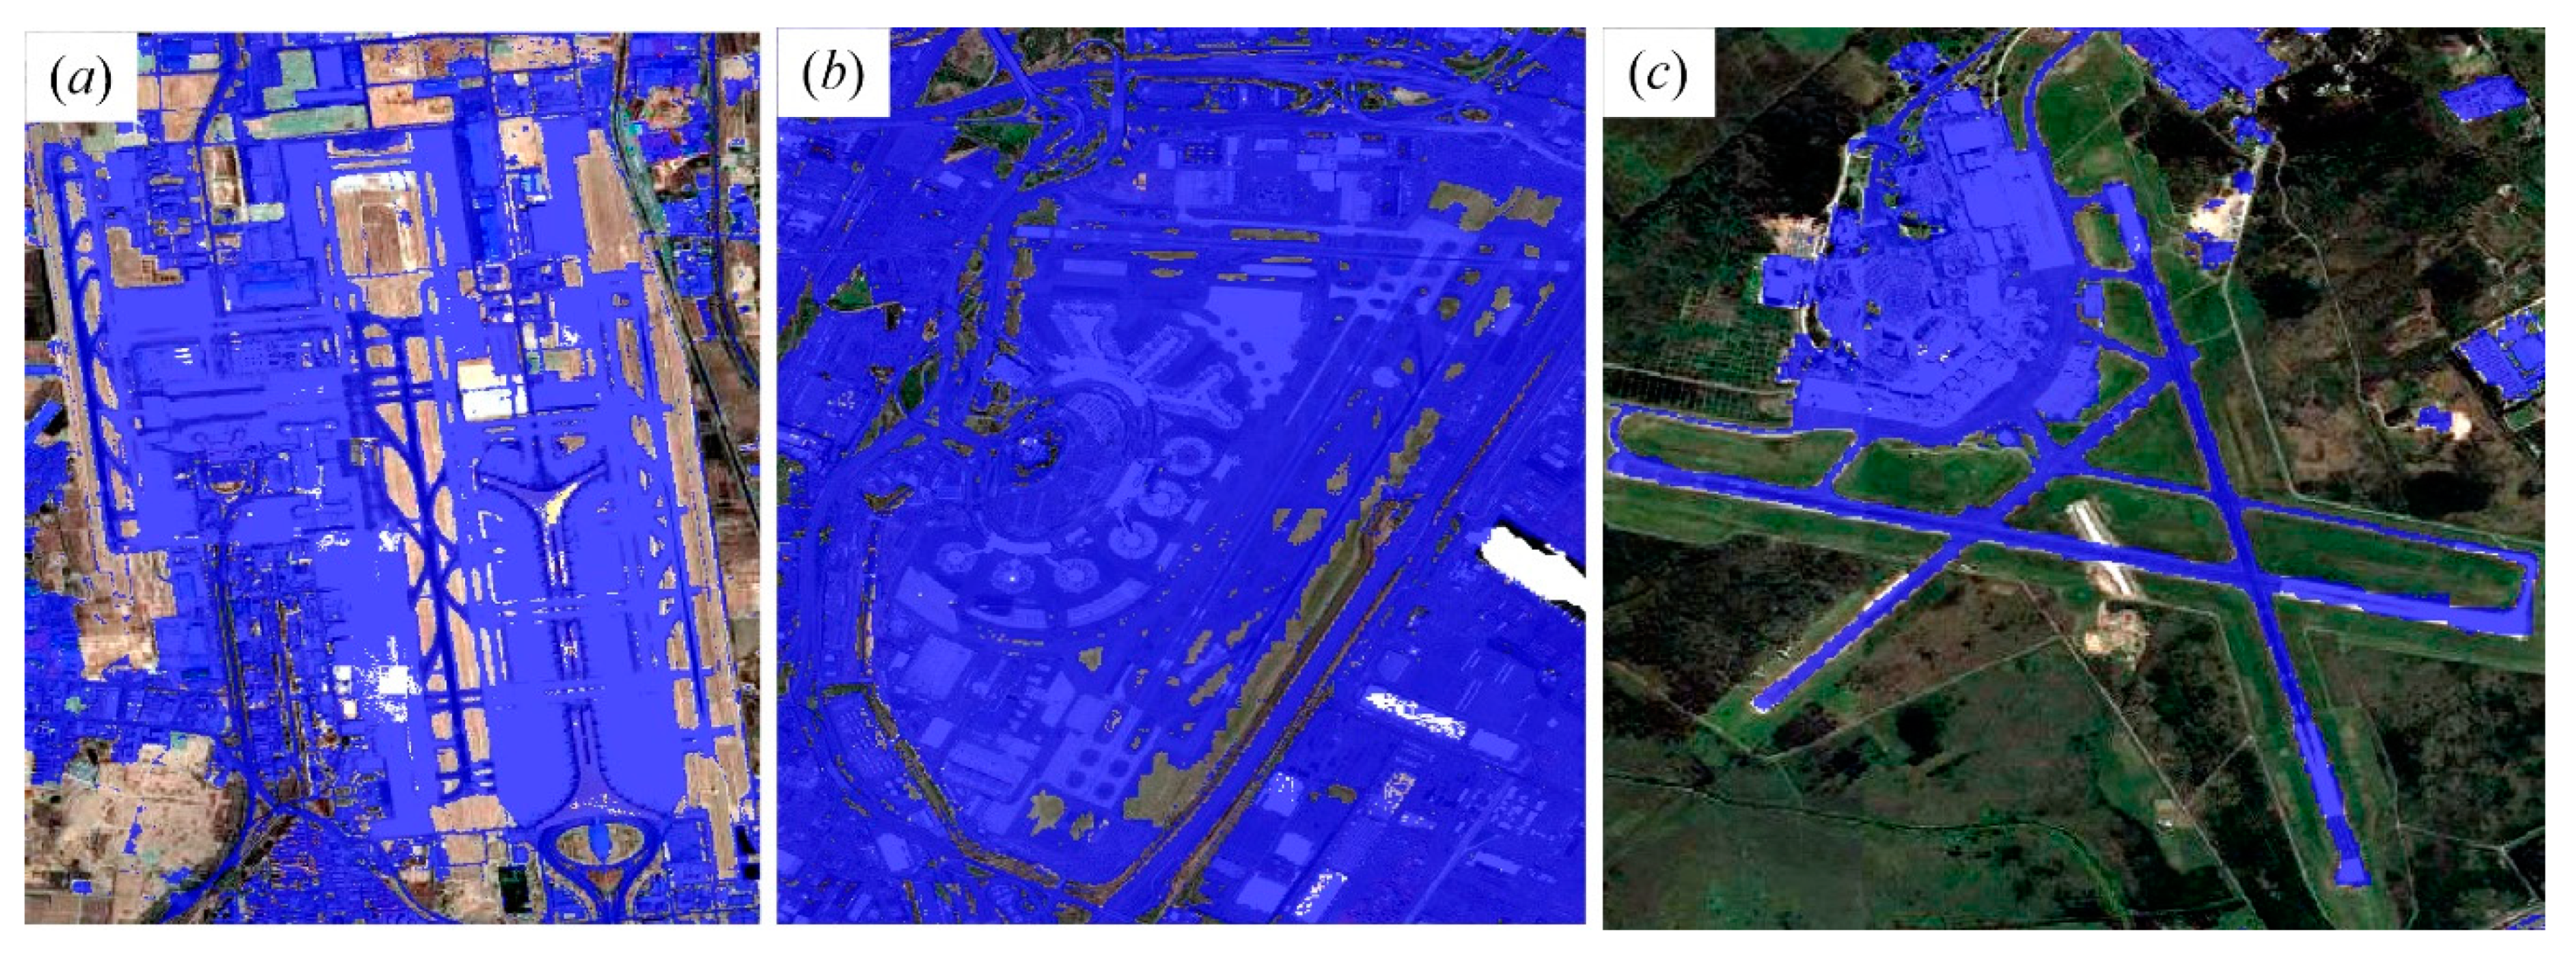
3.1.1. Exclusion of Nonground Regions
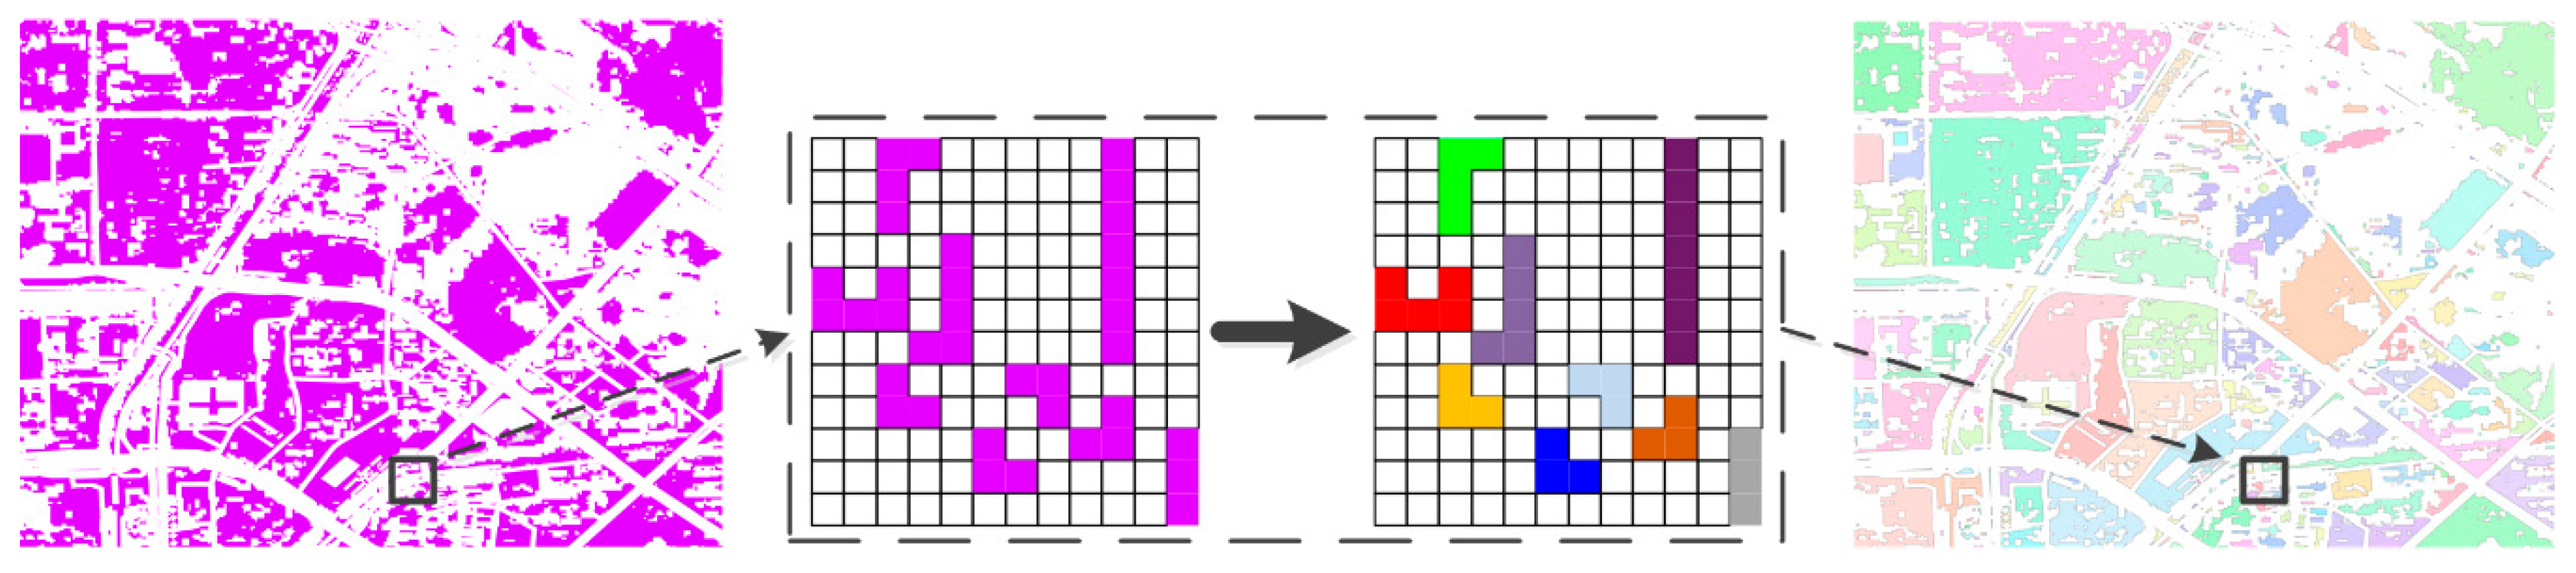
3.1.2. Block Segmentation by Road Networks
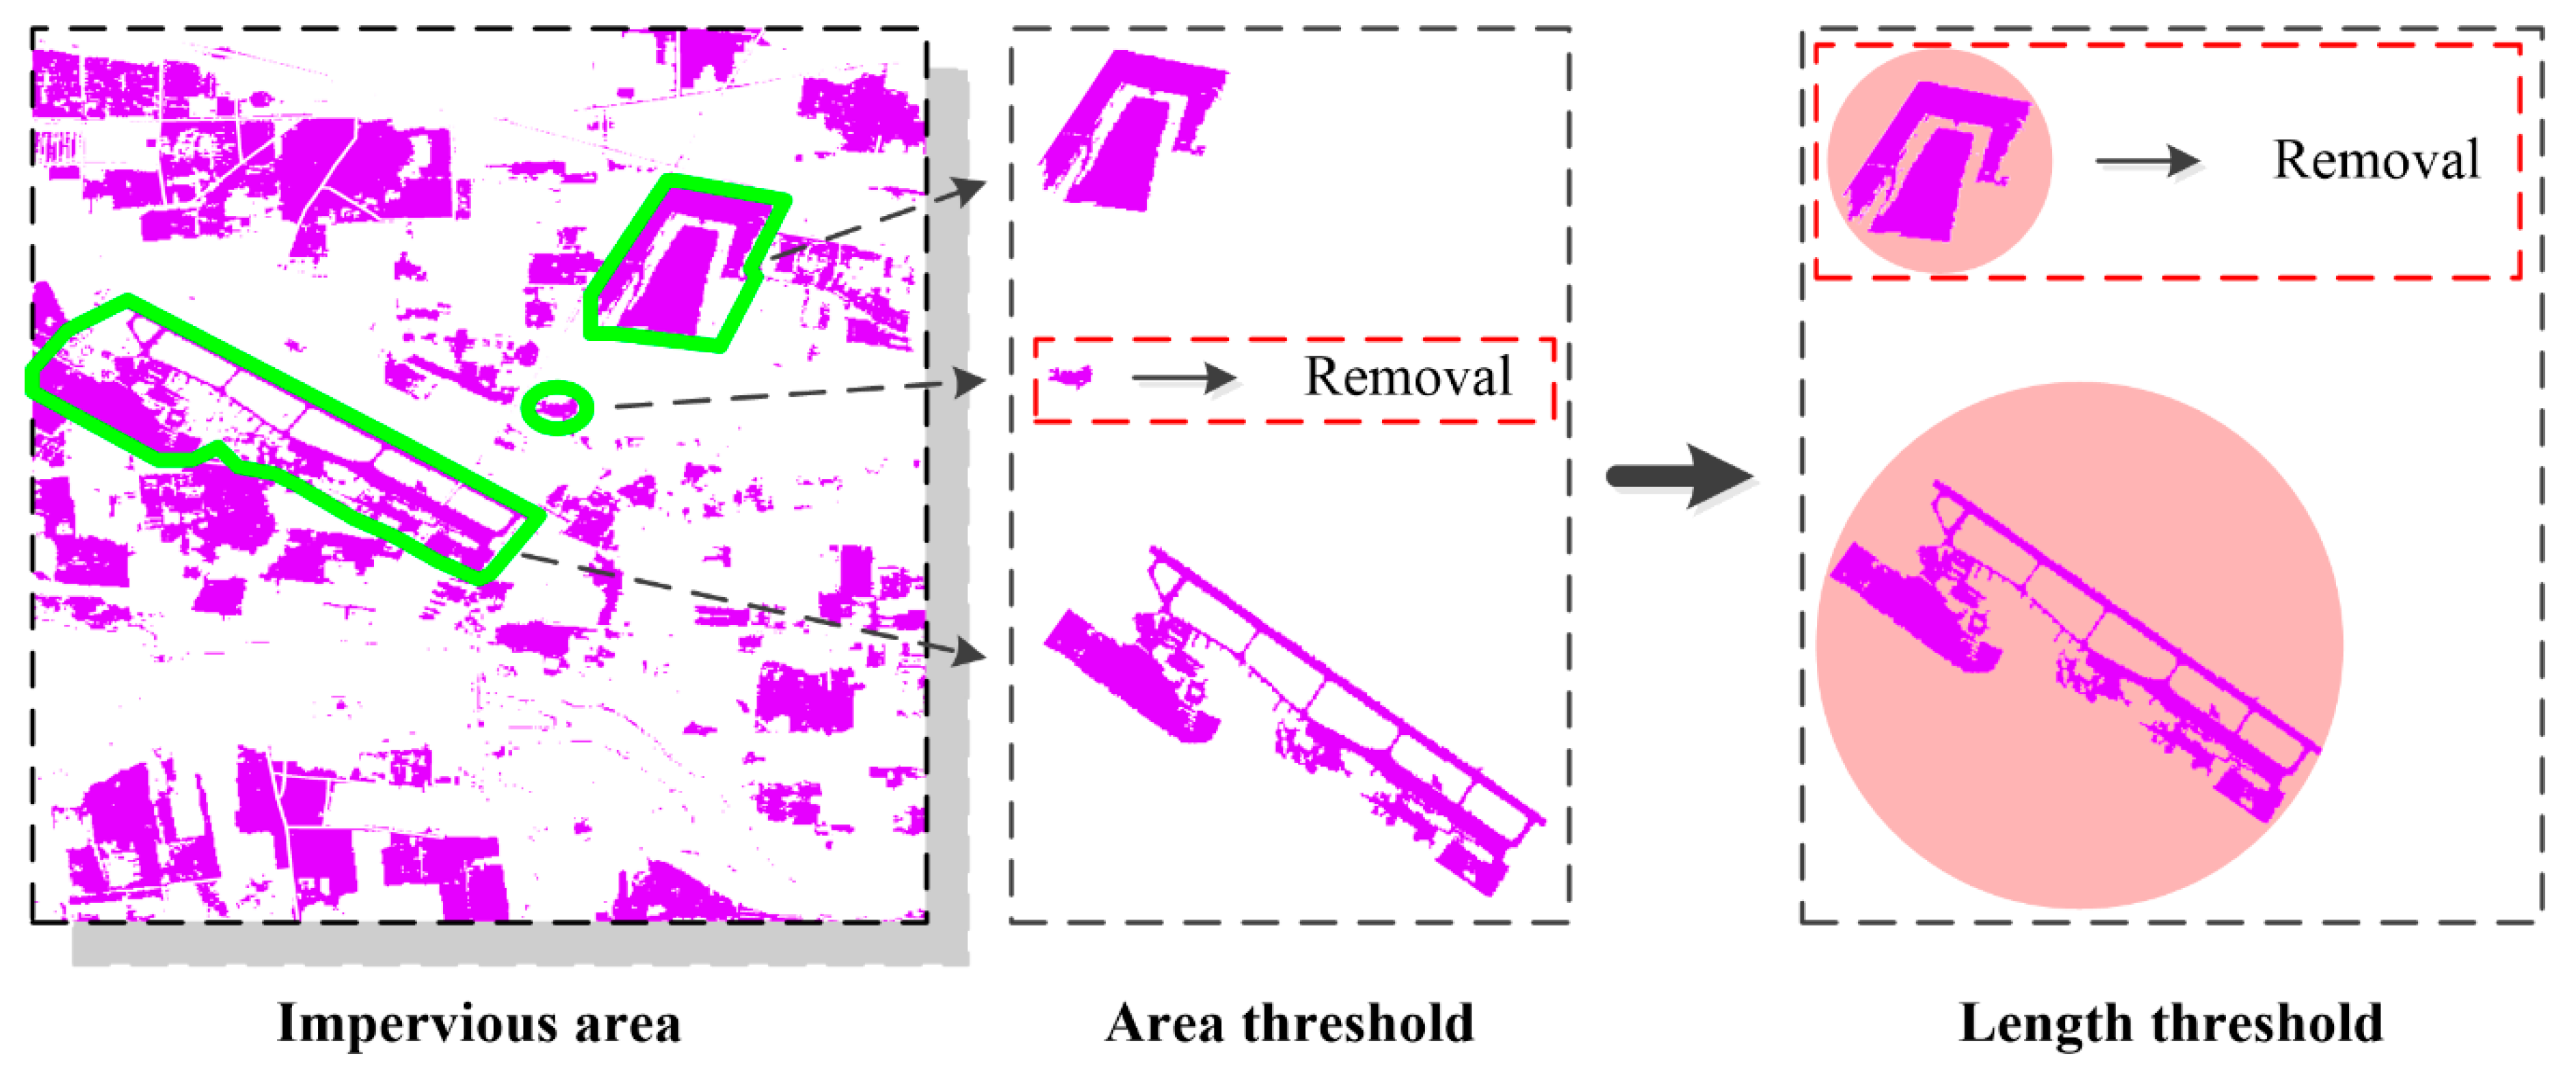
3.1.3. Blocks Extraction with Area and Length Thresholds
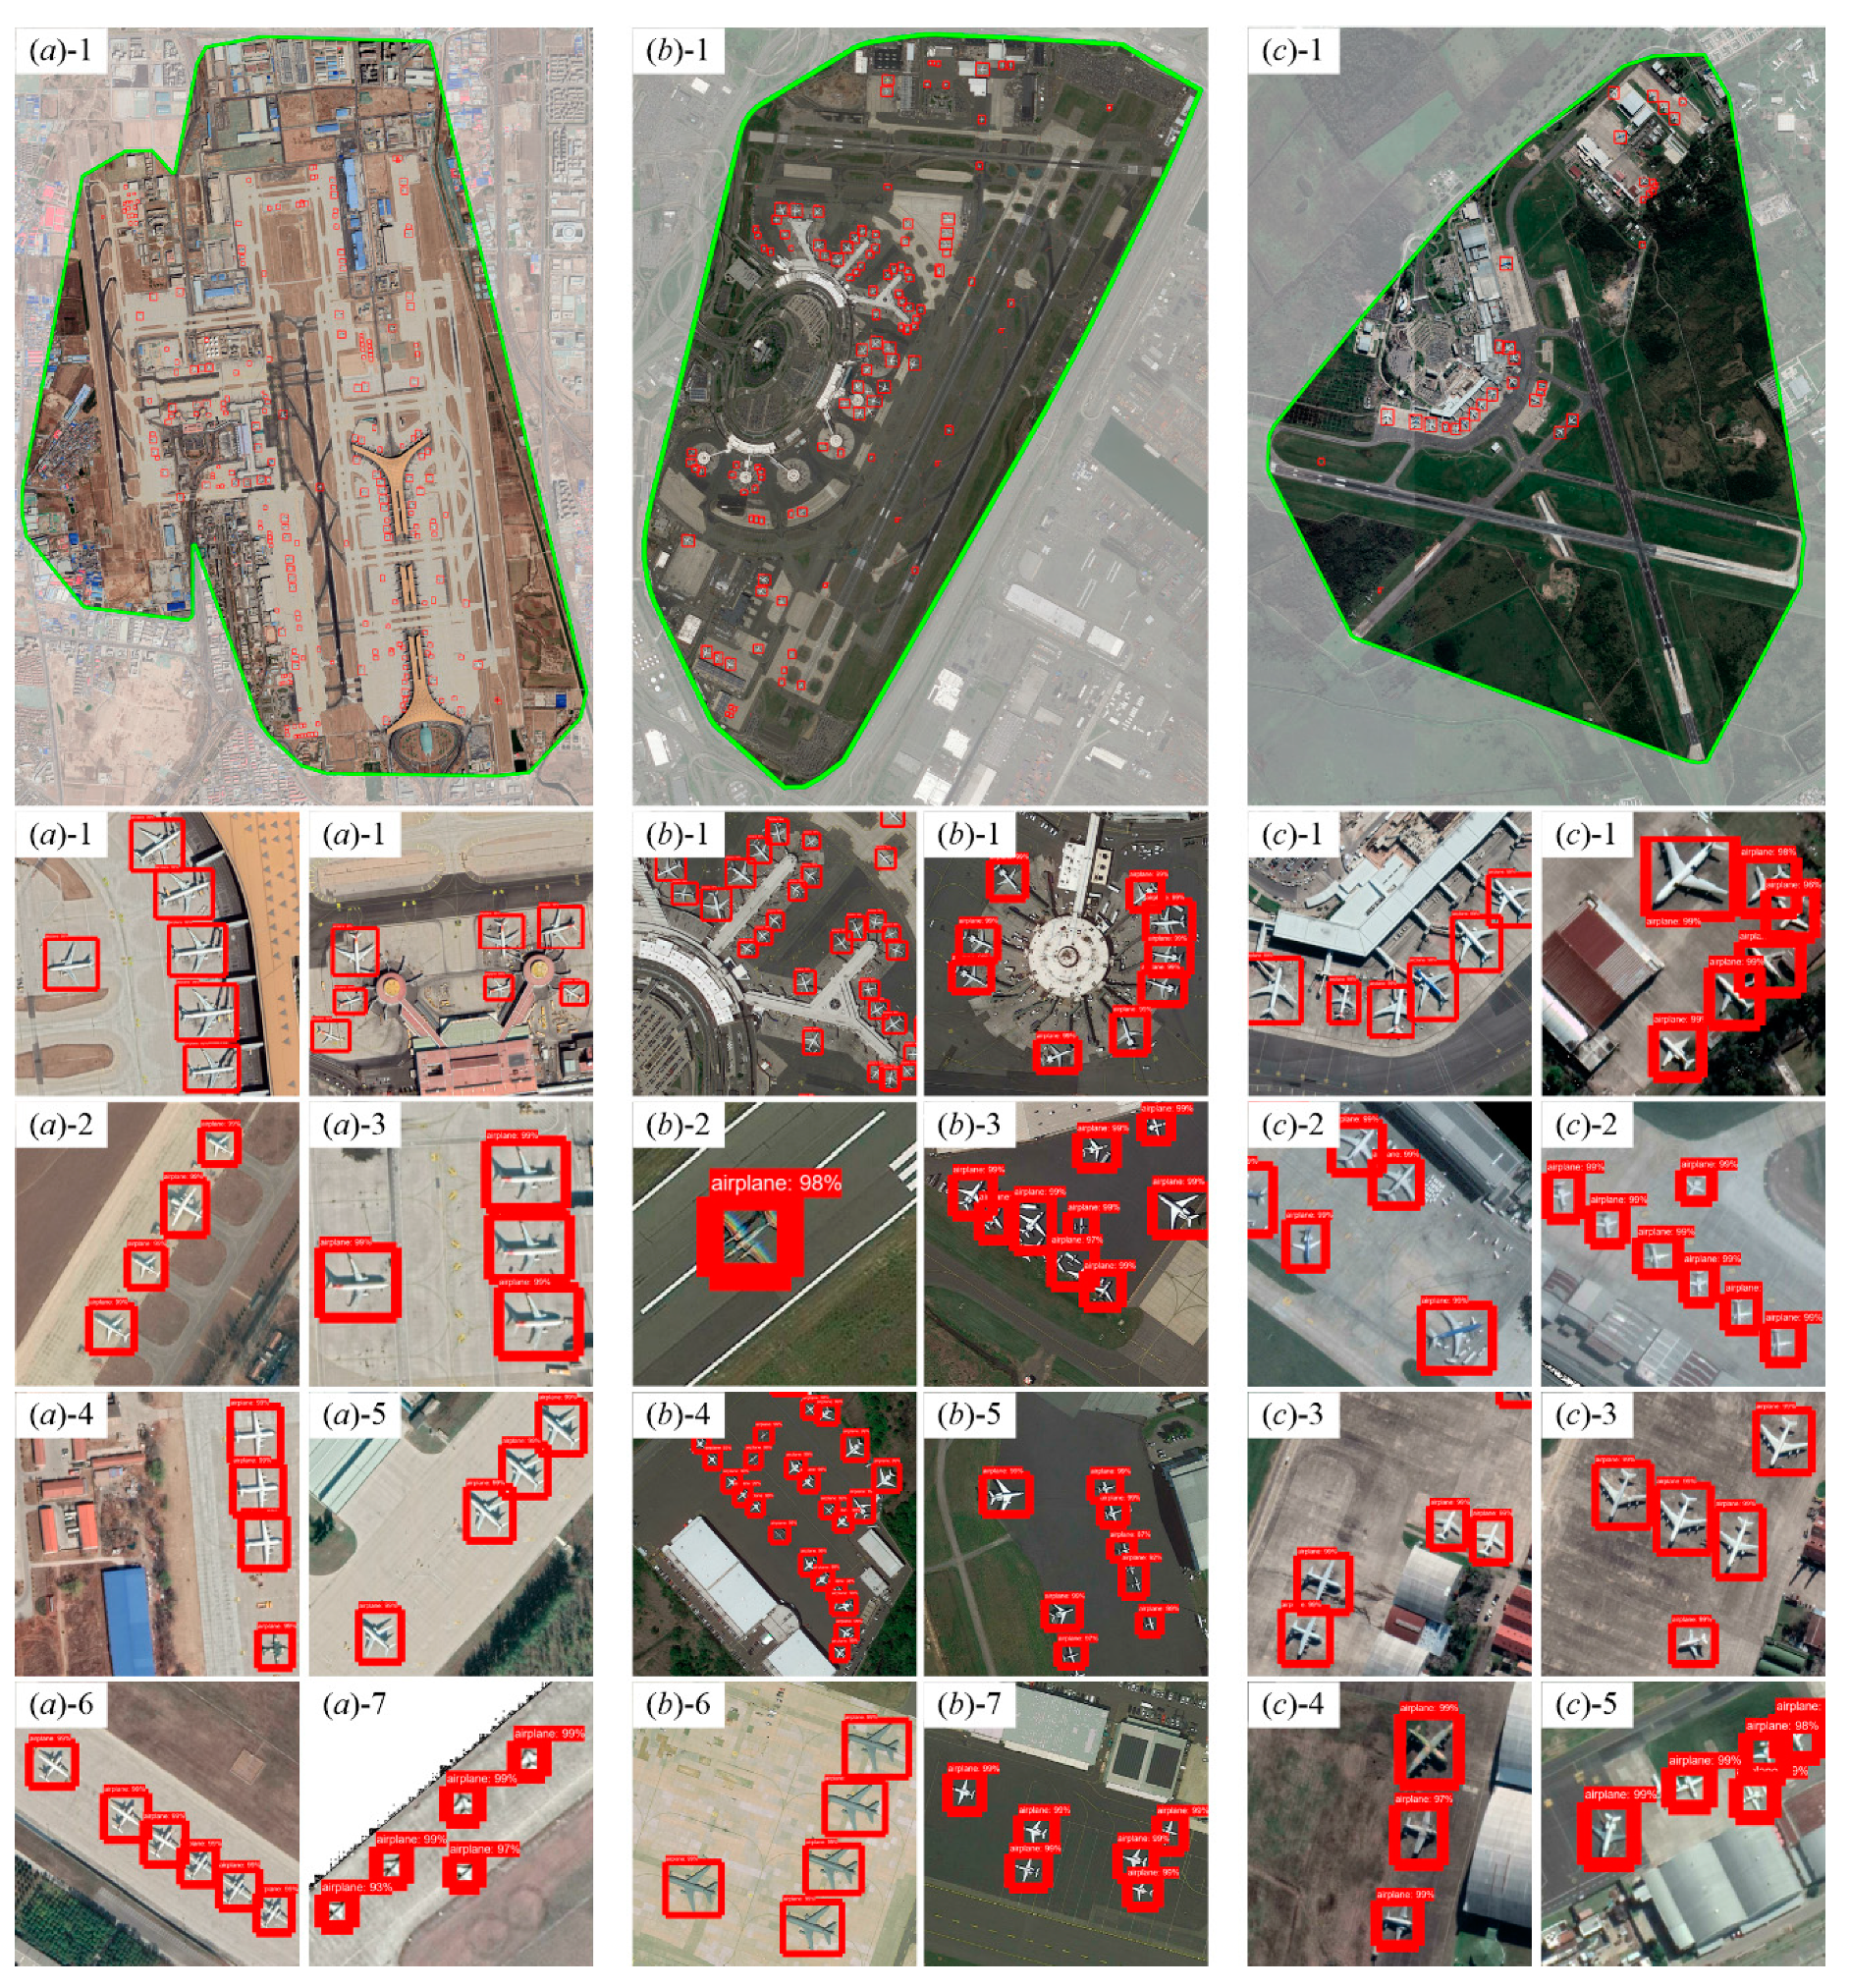
3.2. Aircraft Detection
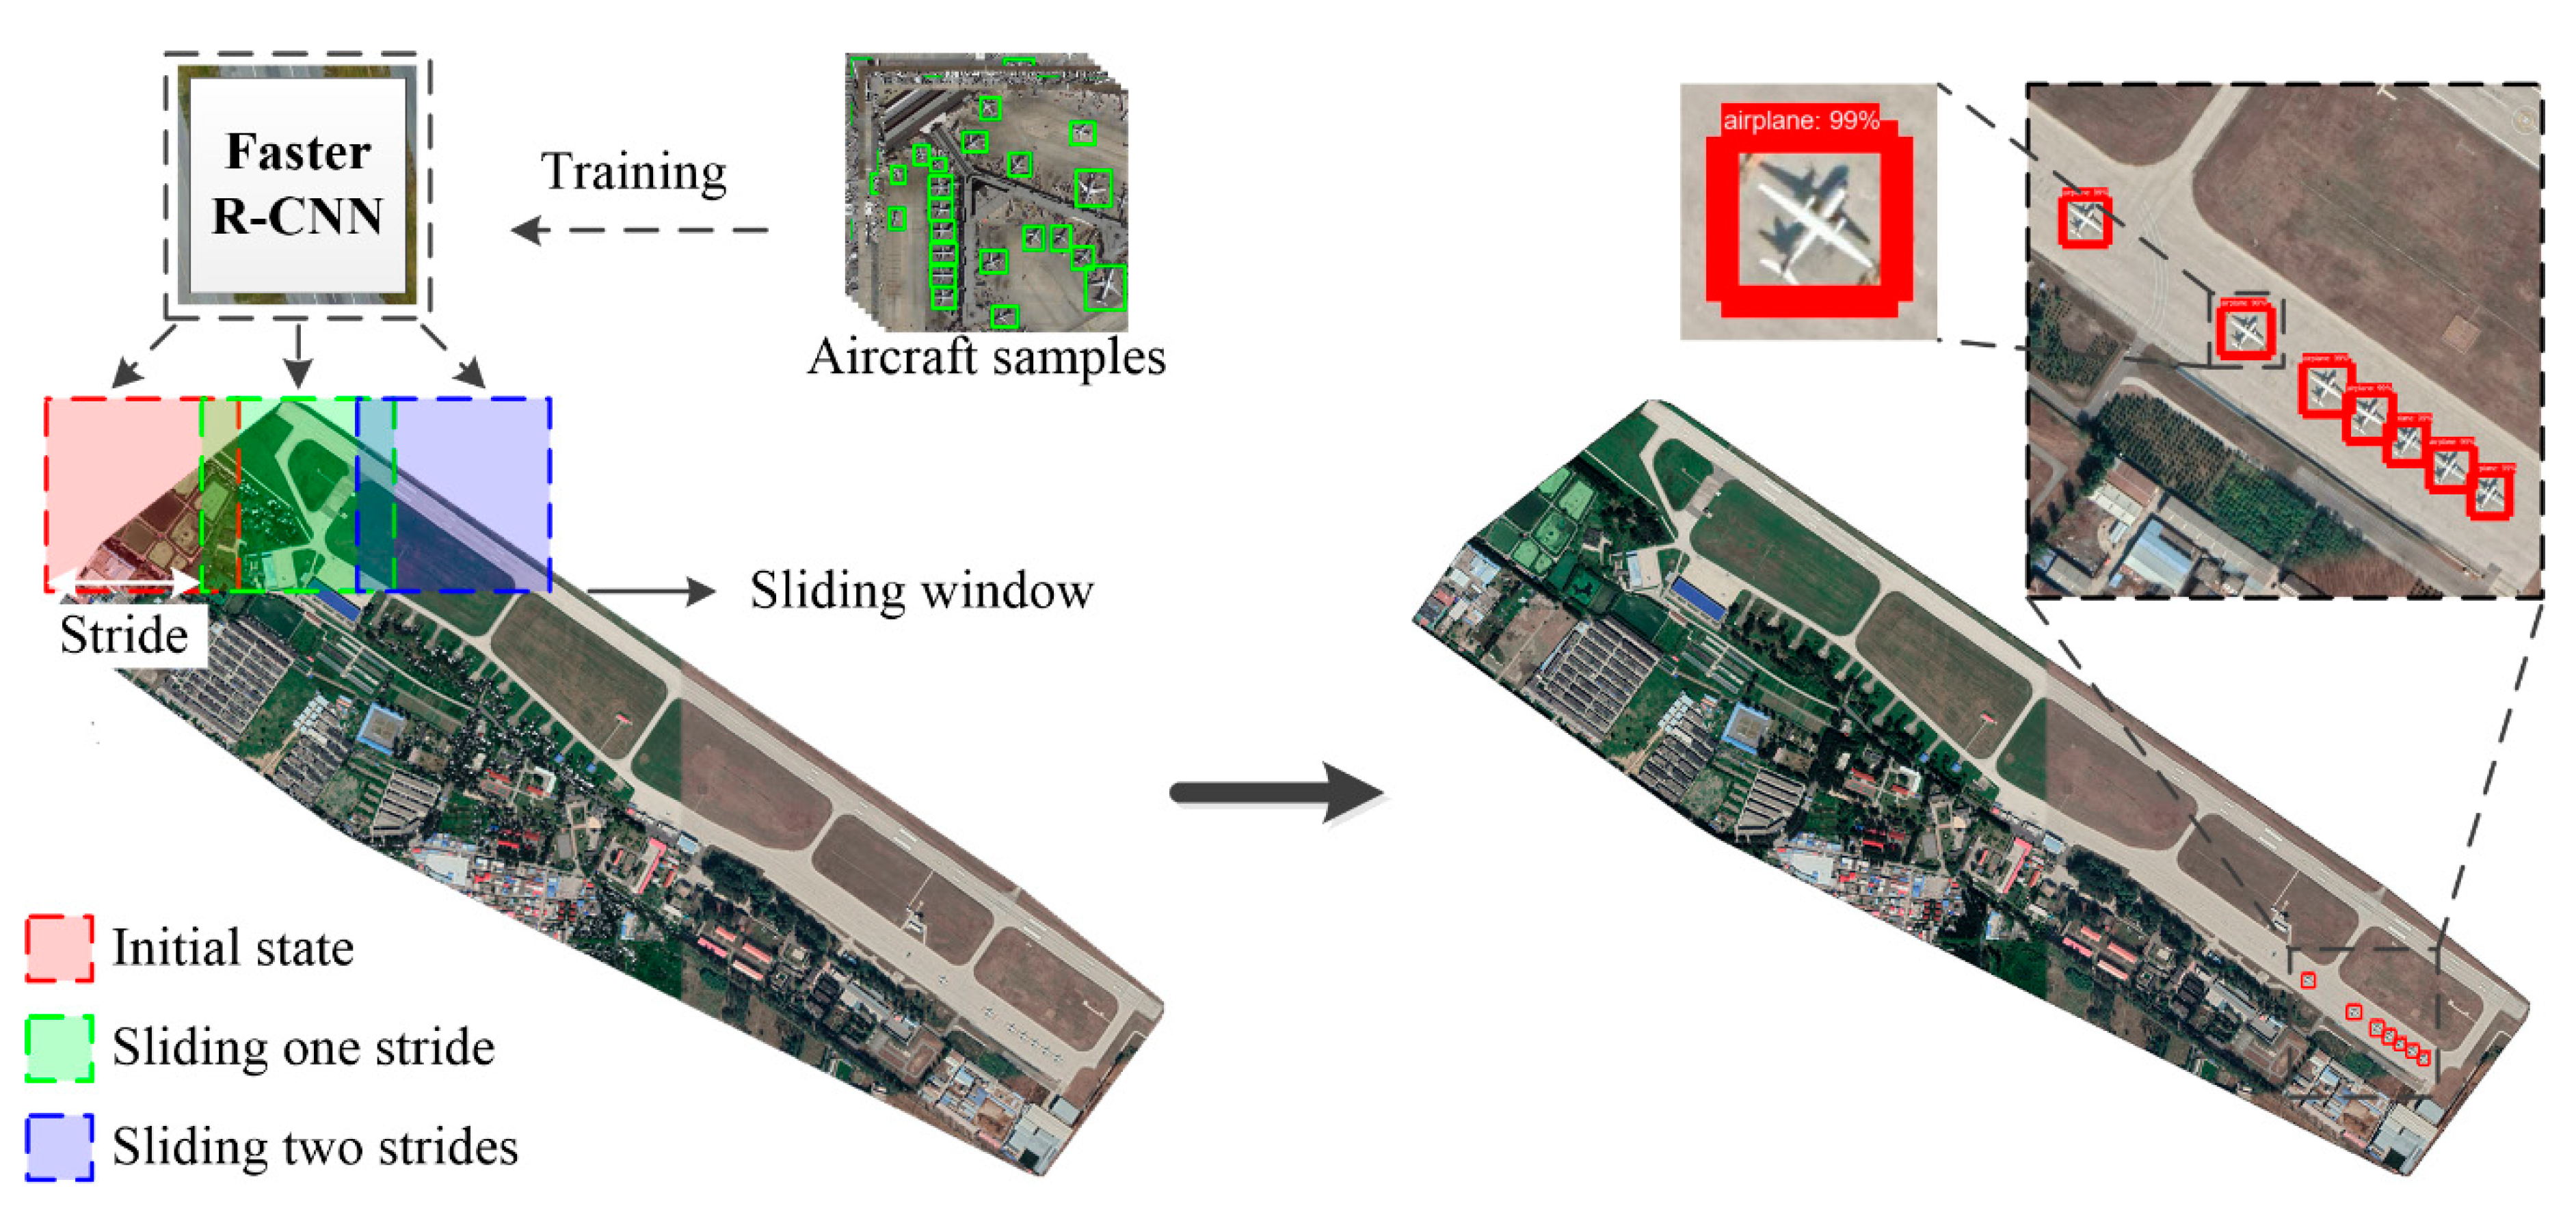
3.2.1. Analysis with Faster R-CNN
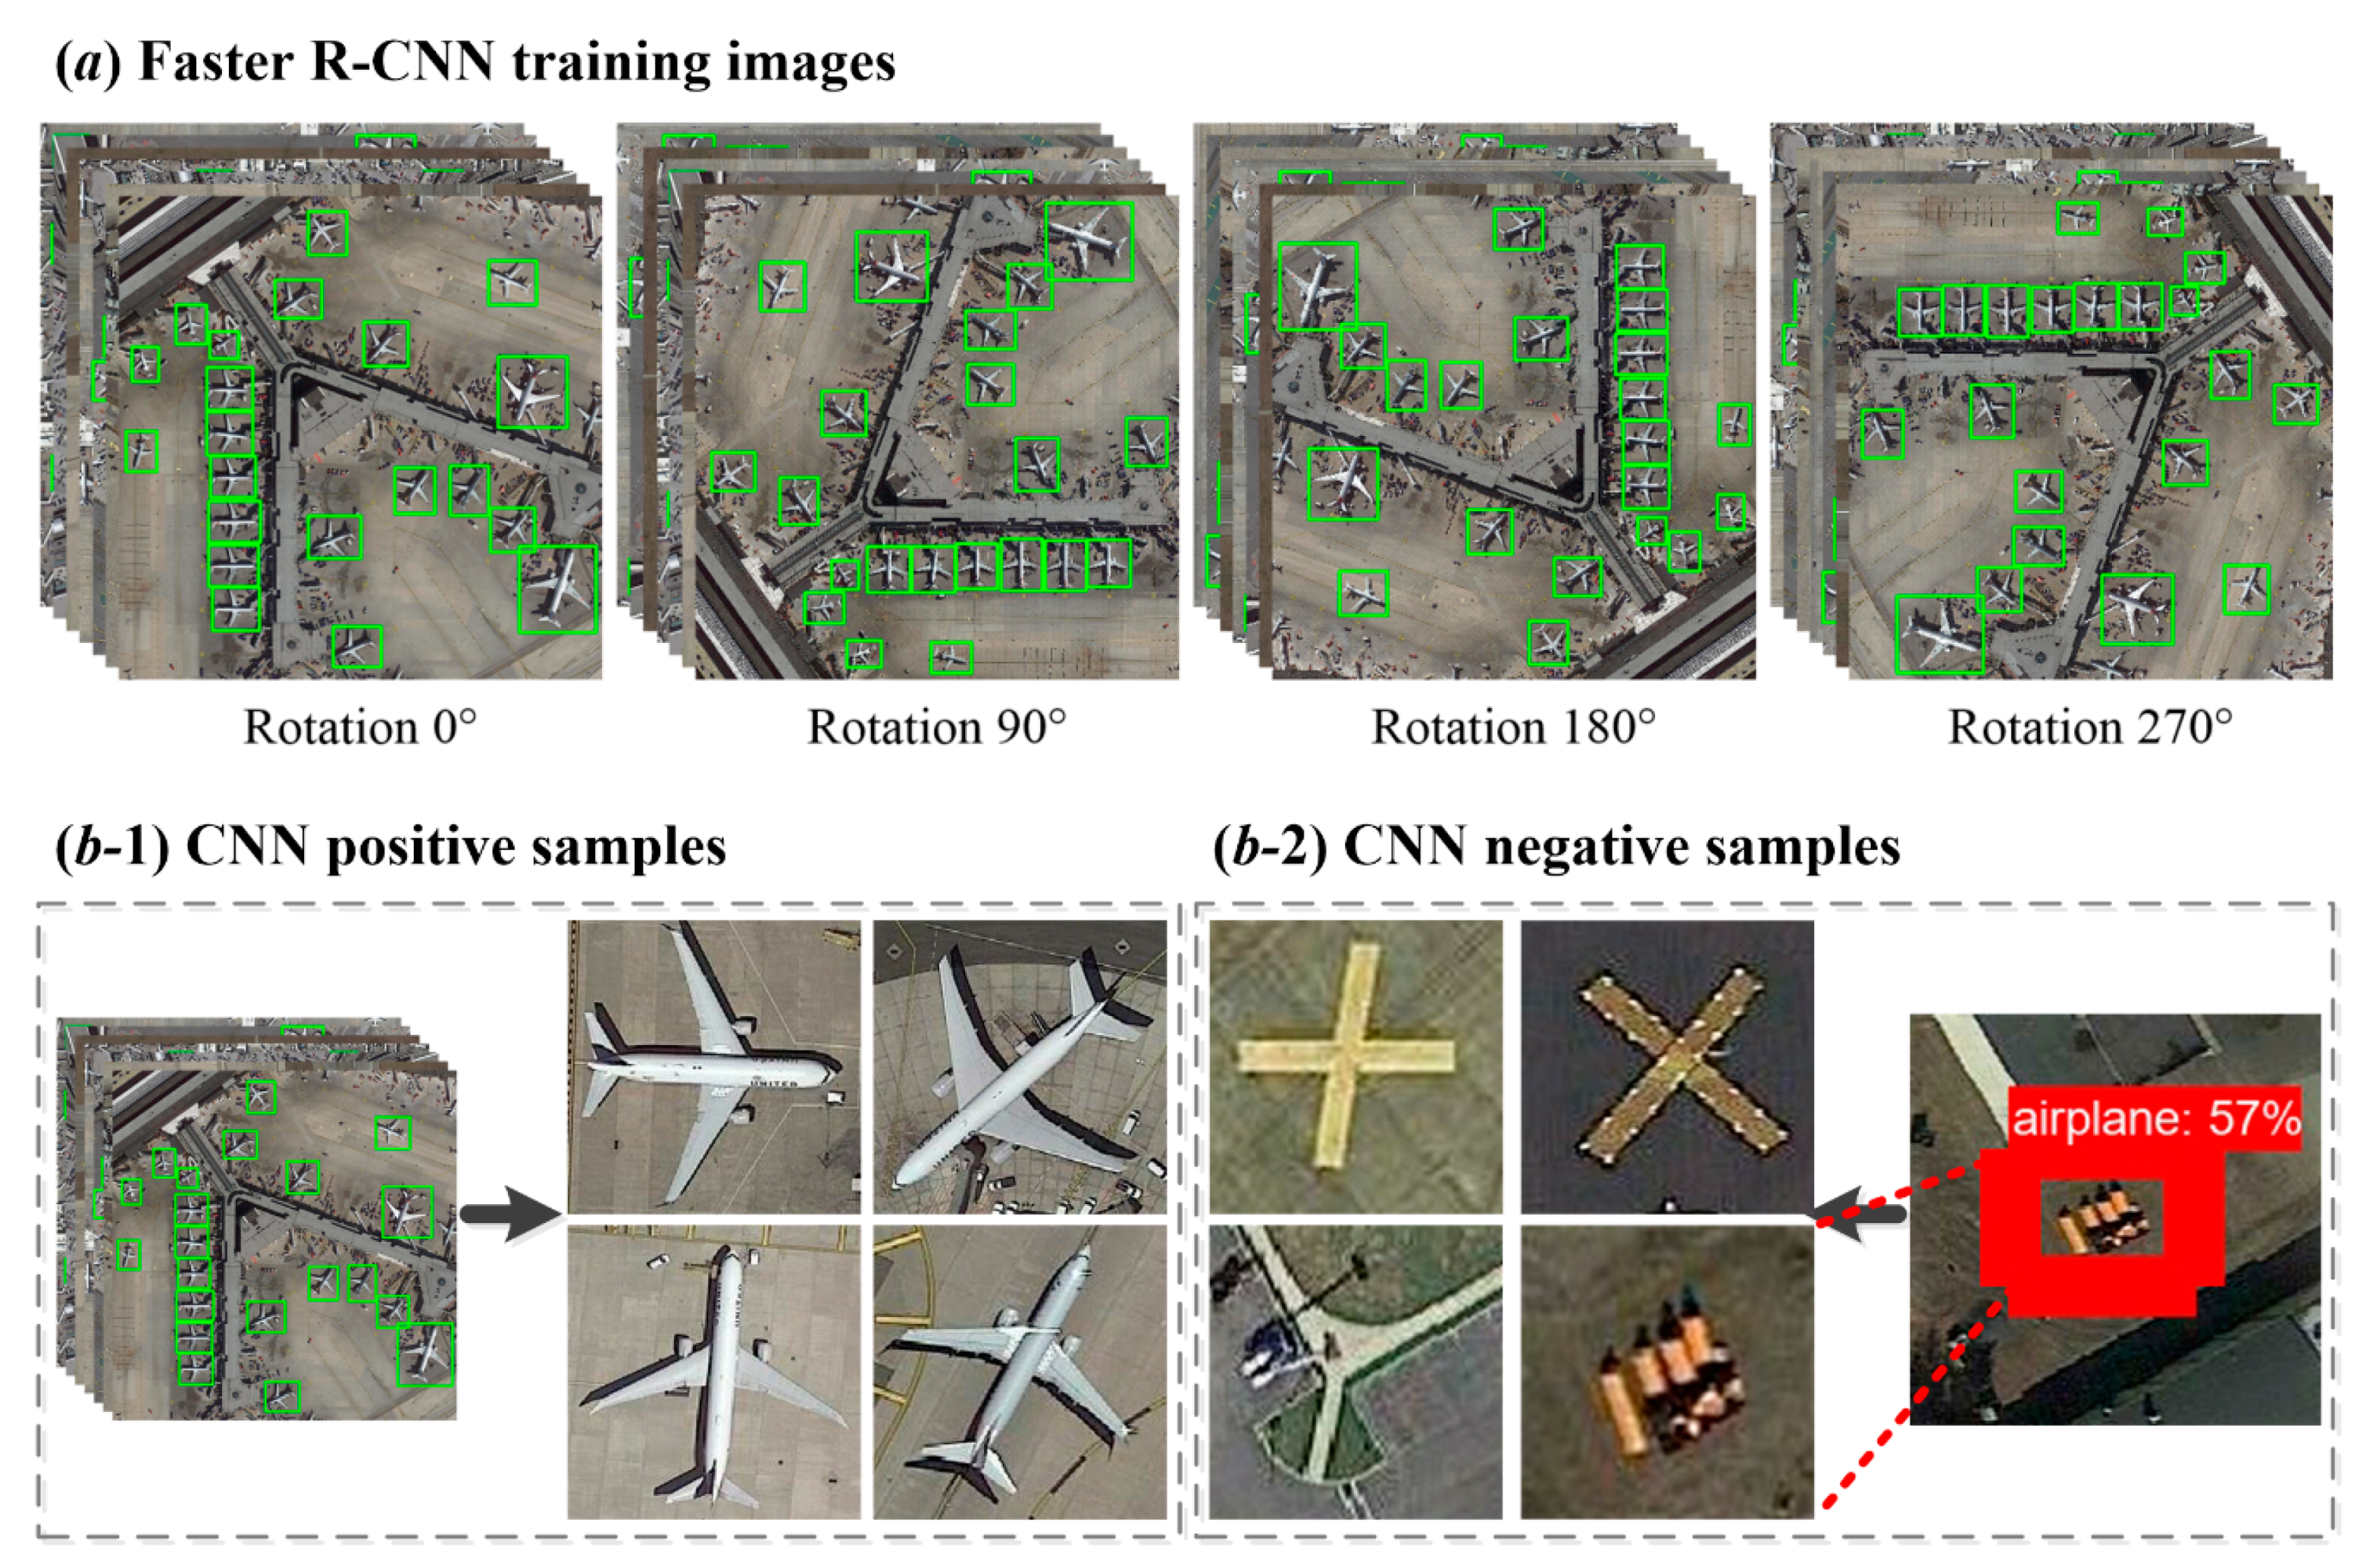
3.2.2. Reclassification with CNN
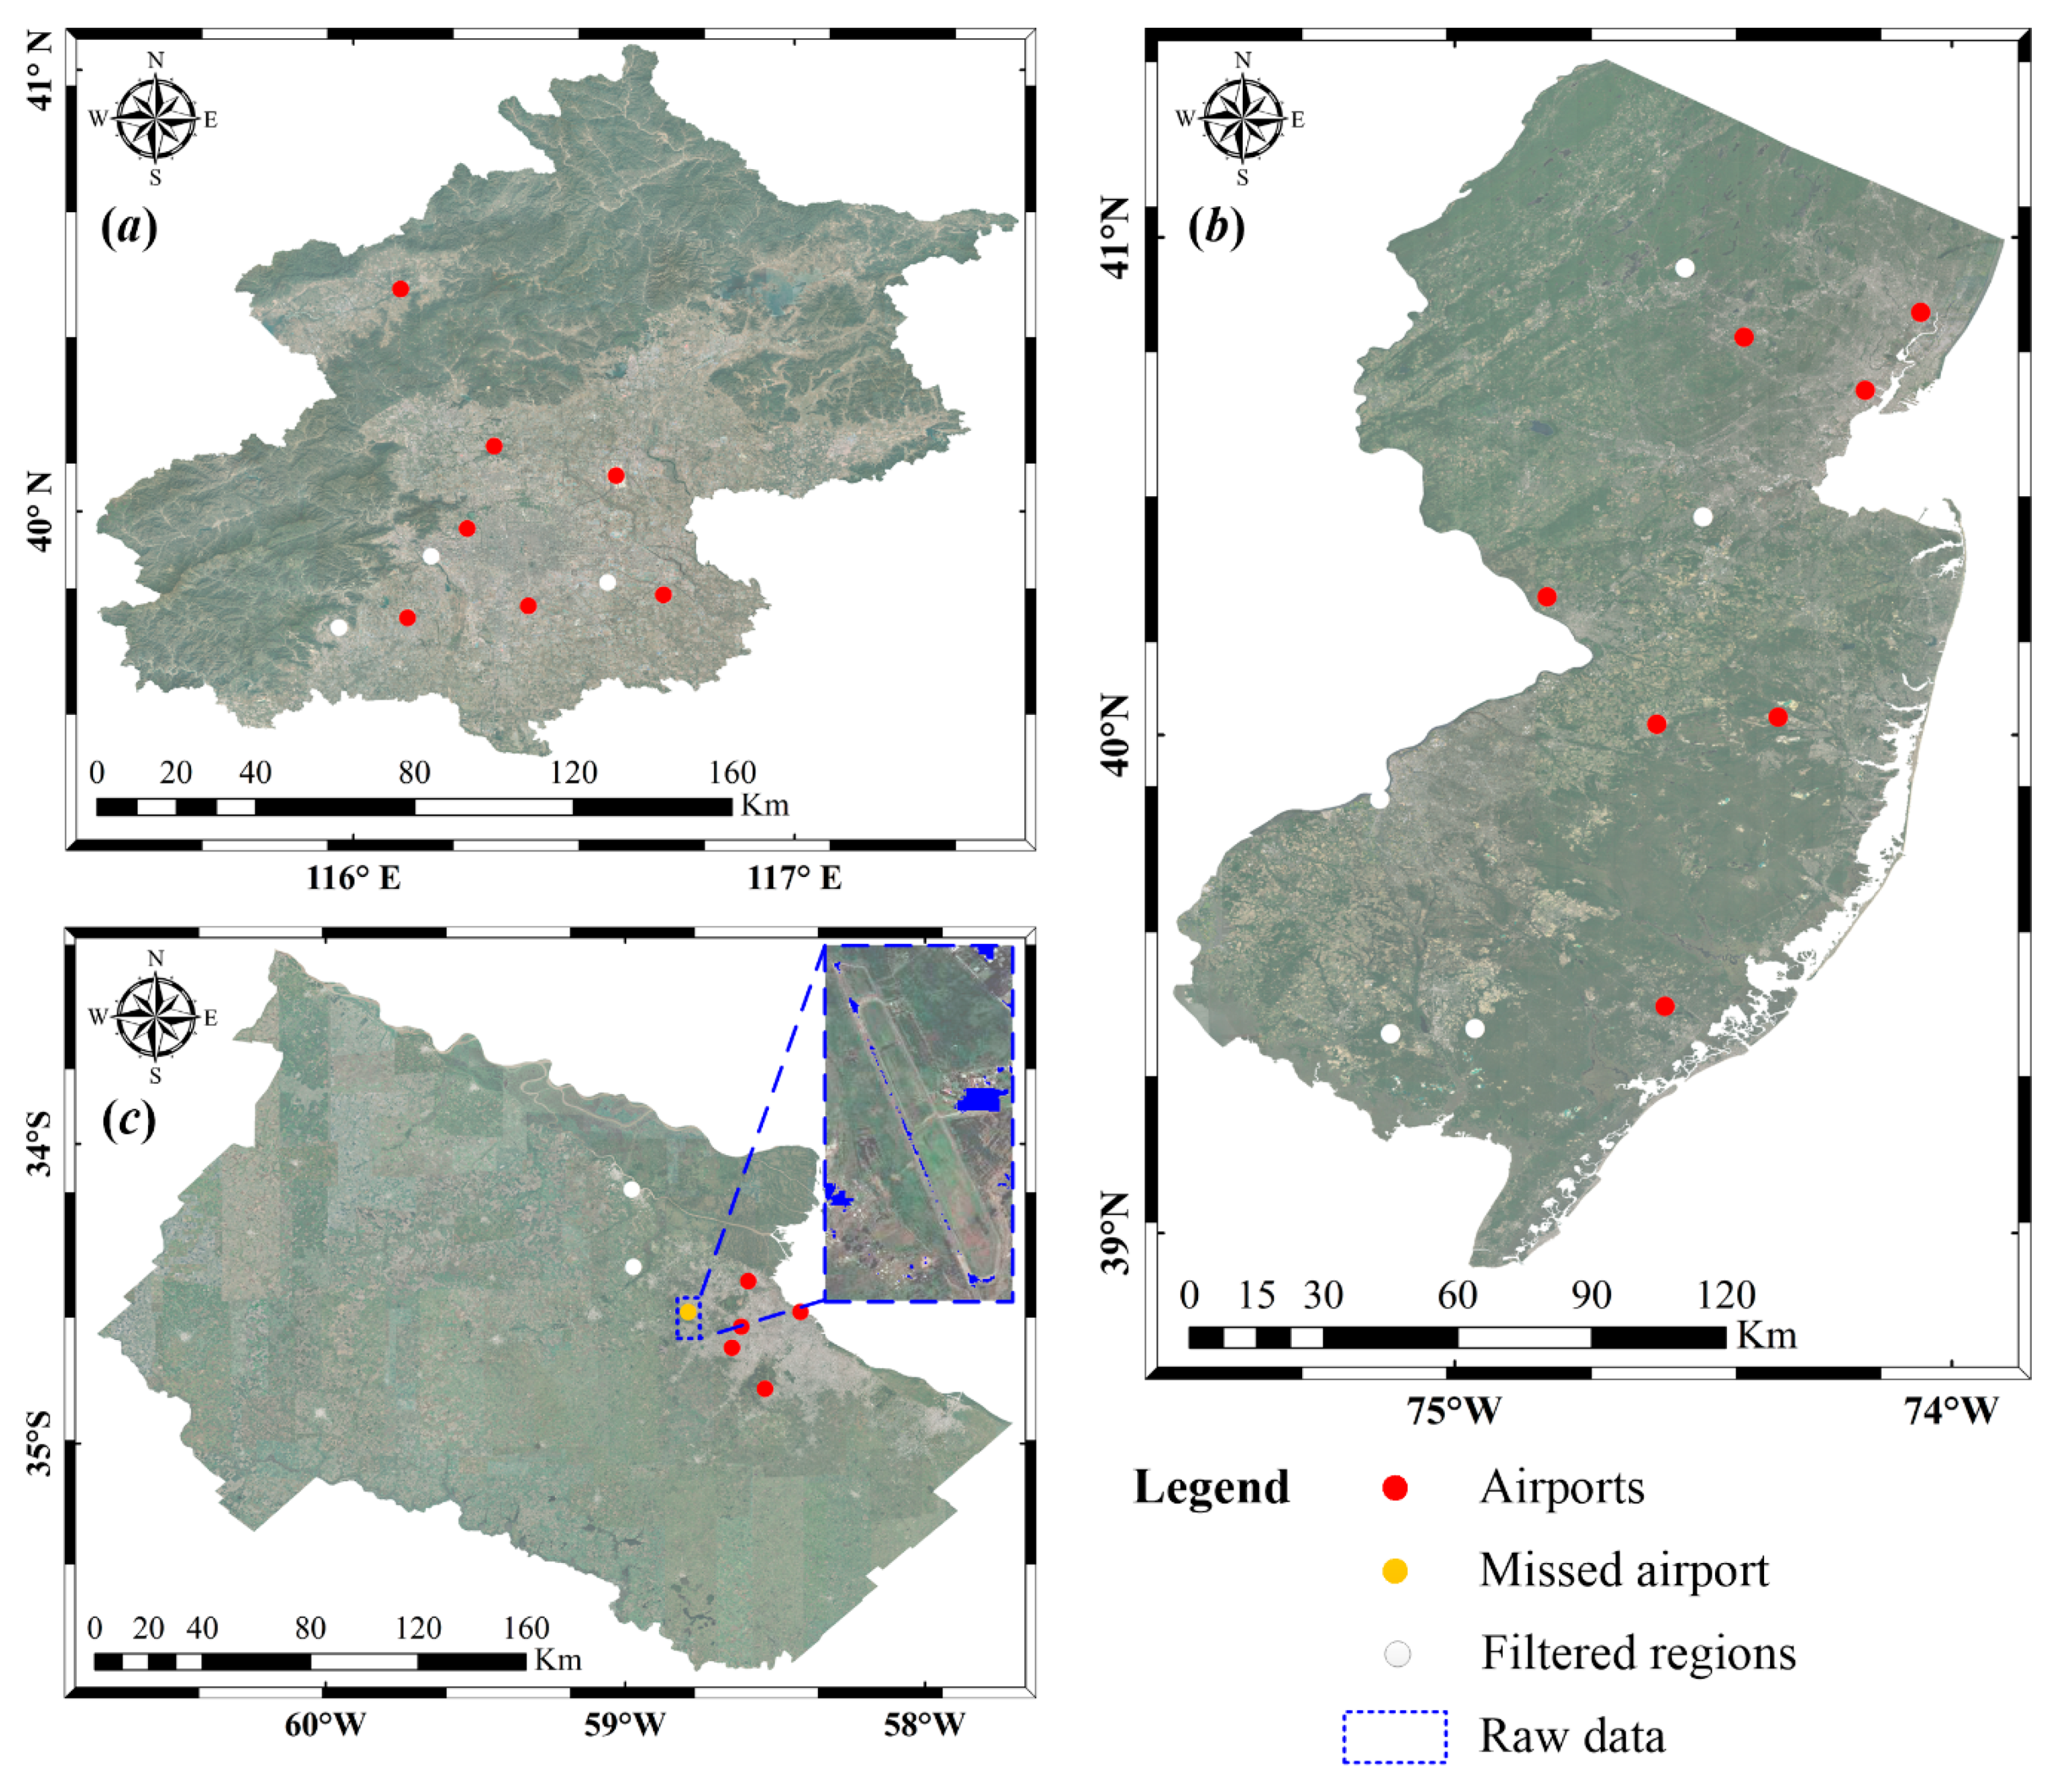
4. Results and Validation
5. Discussion
5.1. Candidate Airport Regions
5.1.1. Possibility of Worldwide Airport Detection from FROM-GLC10 Product
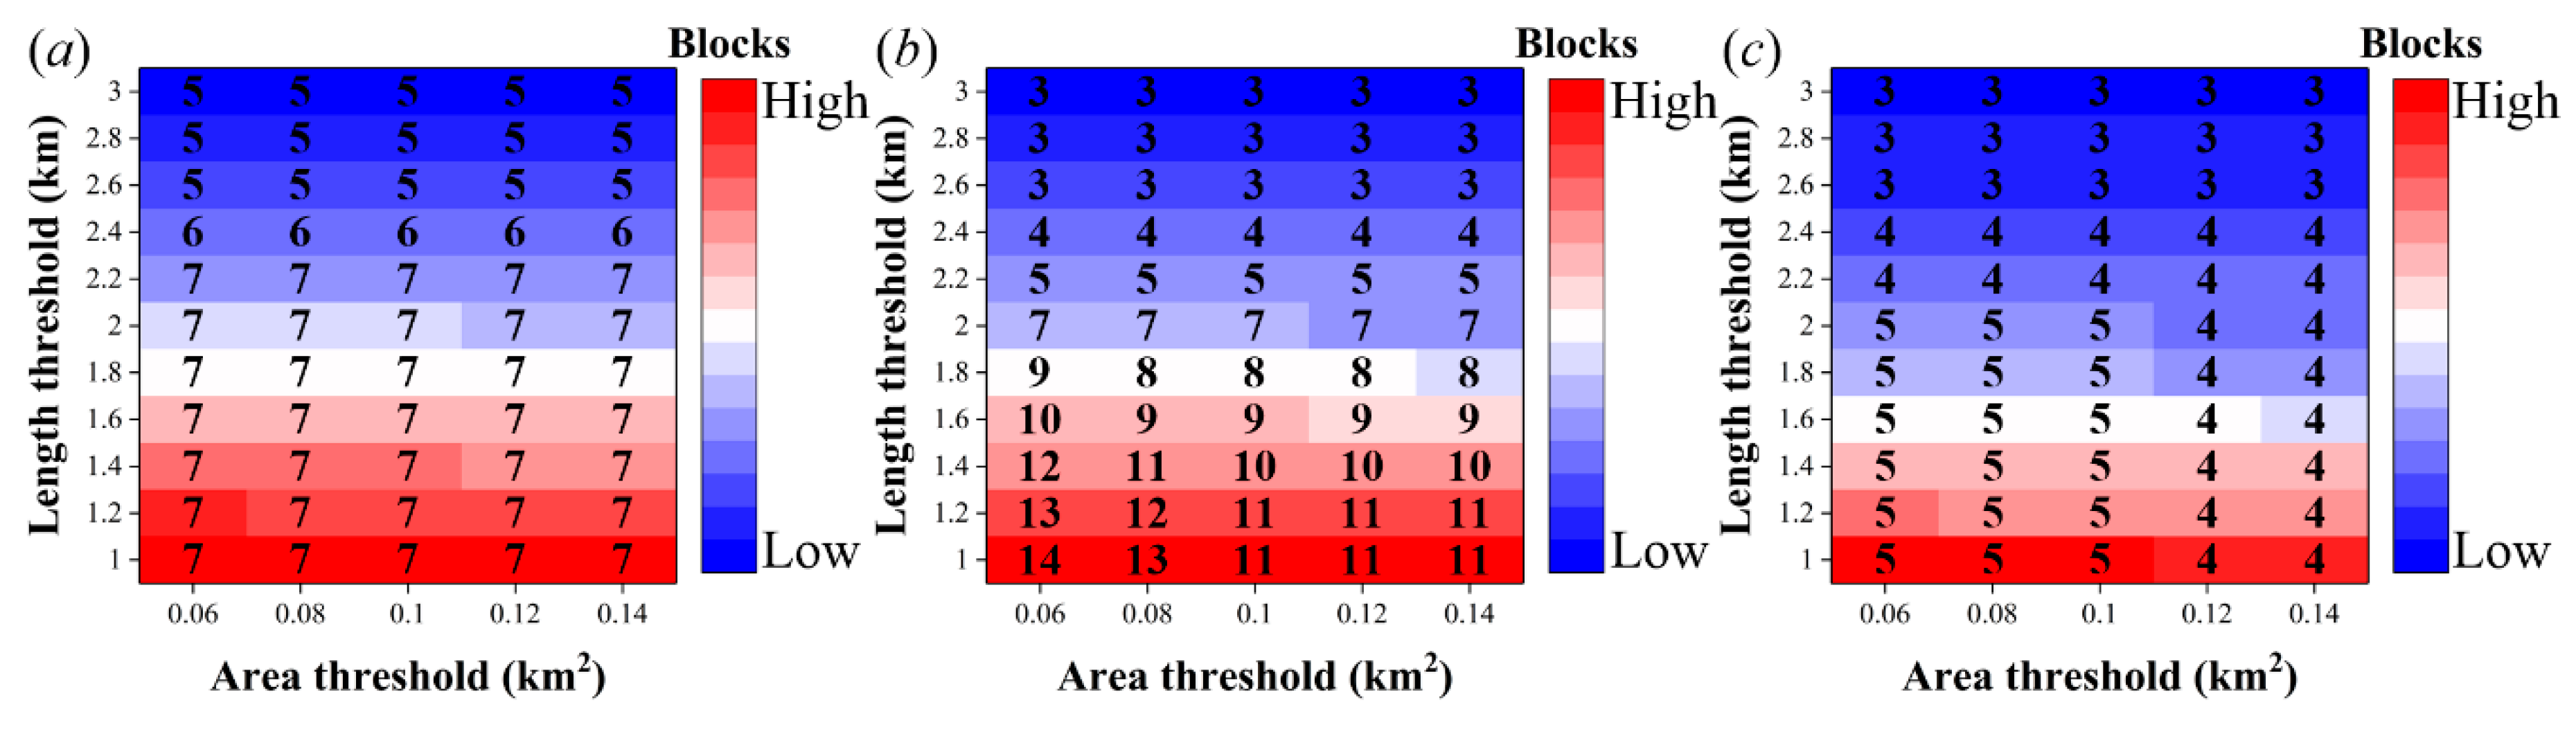
5.1.2. Selection of Area and Length Thresholds
5.2. Aircraft Detection
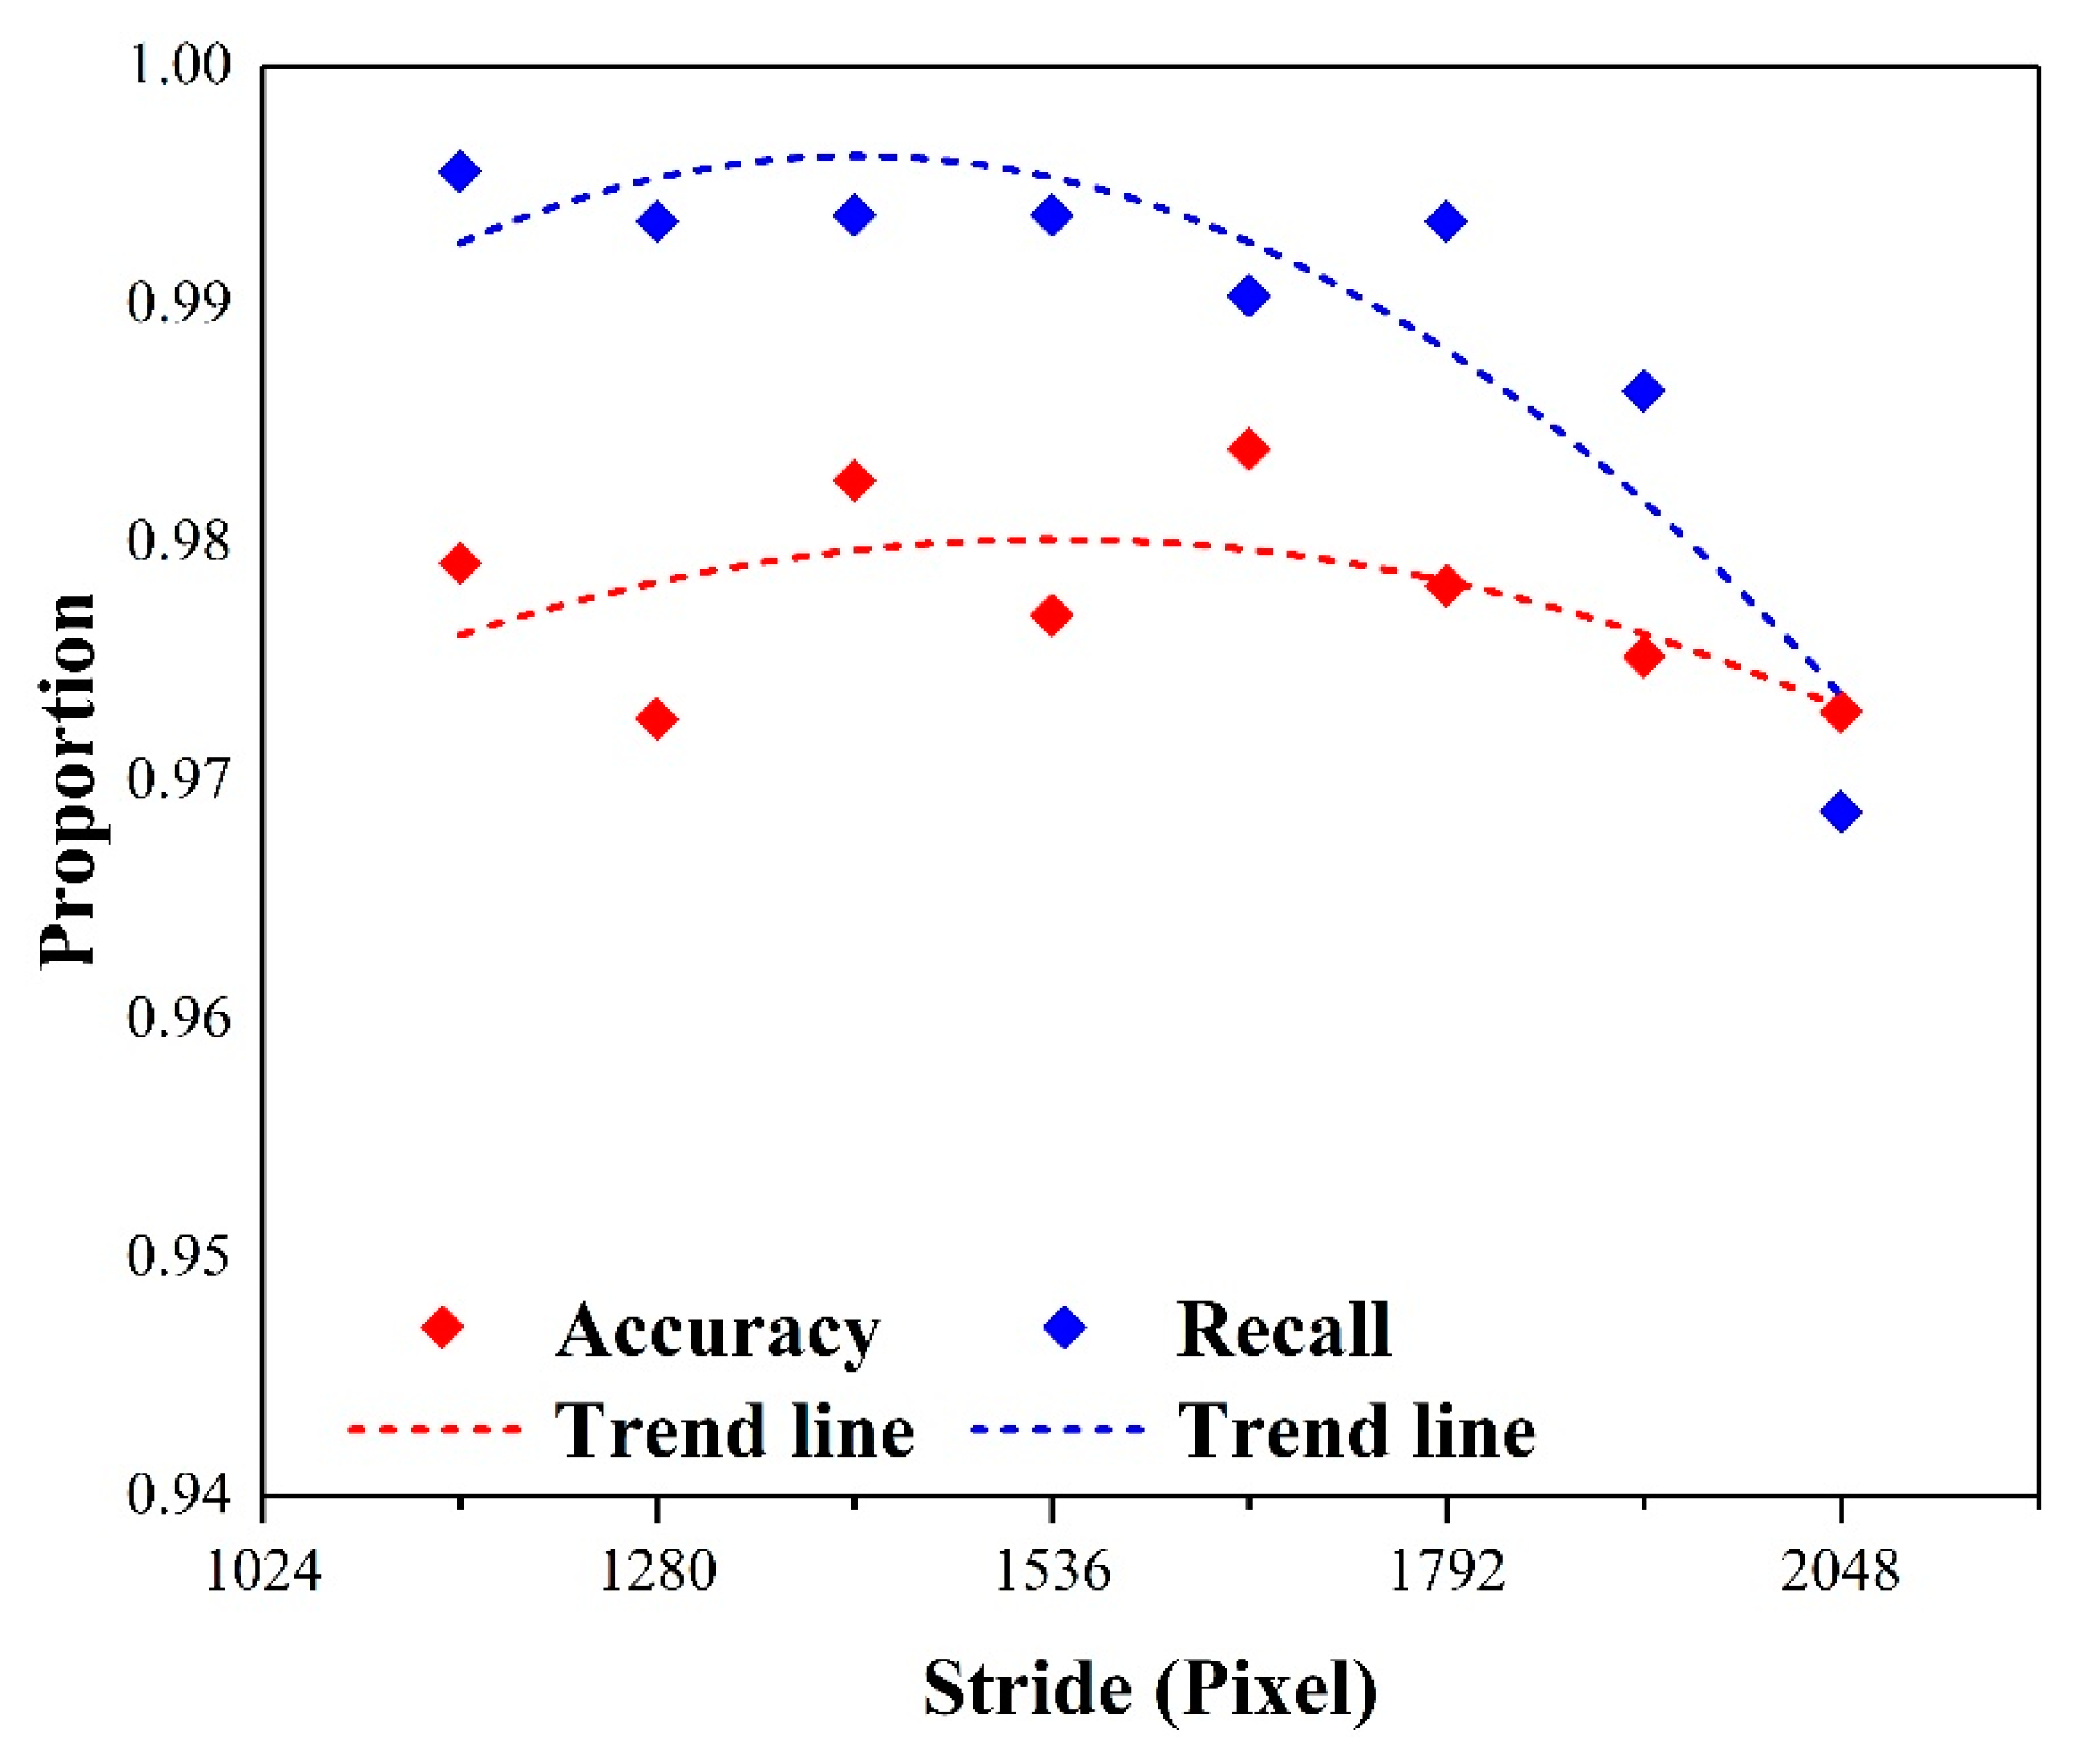
5.2.1. Parameters of the Sliding Window in Faster R-CNN
5.2.2. CNN Reclassifier for Accuracy Improvement
5.3. Pros and Cons
6. Conclusions
Author Contributions
Funding
Acknowledgments
Conflicts of Interest
References
- Liu, D.; He, L.; Carin, L. Airport Detection in Large Aerial Optical Imagery. In Proceedings of the IEEE International Conference on Acoustics, Speech and Signal Processing, Montreal, QC,Canada, 17–21 May 2004; pp. 761–764. [Google Scholar]
- Wang, Y.; Pan, L. Automatic Airport Recognition Based on Saliency Detection and Semantic Information. ISPRS Int. J. Geo-Inf. 2016, 5, 115. [Google Scholar] [CrossRef]
- de Neufville, R. Airline network development in europe and its implications for airport planning. Eur. J. Transp. Infrast. 2008, 8, 264–265. [Google Scholar]
- Bajardi, P.; Poletto, C.; Ramasco, J.J.; Tizzoni, M.; Colizza, V.; Vespignani, A. Human Mobility Networks, Travel Restrictions, and the Global Spread of 2009 H1N1 Pandemic. PLoS ONE 2011, 6, e16591. [Google Scholar] [CrossRef]
- Cheng, G.; Han, J.; Guo, L.; Qian, X.; Zhou, P.; Yao, X.; Hu, X. Object detection in remote sensing imagery using a discriminatively trained mixture model. ISPRS J. Photogramm. Remote Sens. 2013, 85, 32–43. [Google Scholar] [CrossRef]
- Chen, Y.; Li, W.; Sakaridis, C.; Dai, D.; Van Gool, L. Domain Adaptive Faster R-CNN for Object Detection in the Wild. 2018 IEEE/Cvf Conf. Comput. Vis. Pattern Recognit. 2018, 3339–3348. [Google Scholar]
- Budak, U.; Halici, U.; Sengur, A.; Karabatak, M.; Xiao, Y. Efficient Airport Detection Using Line Segment Detector and Fisher Vector Representation. IEEE Geosci. Remote Sens. Lett. 2016, 13, 1–5. [Google Scholar] [CrossRef]
- Liu, N.Y.; Cui, Z.Y.; Cao, Z.J.; Pi, Y.M.; Dang, S.H. Airport detection in large-scale sar images via line segment grouping and saliency analysis. IEEE Geosci. Remote Sens. Lett. 2018, 15, 434–438. [Google Scholar] [CrossRef]
- Chen, F.; Ren, R.; Van De Voorde, T.; Xu, W.; Zhou, G.; Zhou, Y. Fast Automatic Airport Detection in Remote Sensing Images Using Convolutional Neural Networks. Remote Sens. 2018, 10, 443. [Google Scholar] [CrossRef]
- Yao, X.; Han, J.; Guo, L.; Bu, S.; Liu, Z. A coarse-to-fine model for airport detection from remote sensing images using target-oriented visual saliency and CRF. Neurocomputing 2015, 164, 162–172. [Google Scholar] [CrossRef]
- Tang, G.; Xiao, Z.; Liu, Q. A Novel Airport Detection Method via Line Segment Classification and Texture Classification. IEEE Geosci. Remote Sens. Lett. 2015, 12, 2408–2412. [Google Scholar] [CrossRef]
- Xiao, Z.; Gong, Y.; Long, Y.; Li, D.; Wang, X.; Liu, H. Airport Detection Based on a Multiscale Fusion Feature for Optical Remote Sensing Images. IEEE Geosci. Remote Sens. Lett. 2017, 14, 1469–1473. [Google Scholar] [CrossRef]
- Aytekin, O.; Zongur, U.; Halici, U. Texture-based airport runway detection. IEEE Geosci. Remote Sens. Lett. 2013, 10, 471–475. [Google Scholar] [CrossRef]
- Zhu, D.; Wang, B.; Zhang, L. Airport Target Detection in Remote Sensing Images: A New Method Based on Two-Way Saliency. IEEE Geosci. Remote Sens. Lett. 2015, 12, 1096–1100. [Google Scholar]
- Tao, C.; Tan, Y.H.; Cai, H.J.; Tian, J.W. Airport detection from large ikonos images using clustered sift keypoints and region information. IEEE Geosci. Remote Sens. Lett. 2011, 8, 128–132. [Google Scholar] [CrossRef]
- Zhao, D.P.; Ma, Y.Y.; Jiang, Z.G.; Shi, Z.W. Multiresolution airport detection via hierarchical reinforcement learning saliency model. IEEE J. Sel. Top. Appl. Earth Obs. Remote Sens. 2017, 10, 2855–2866. [Google Scholar] [CrossRef]
- Polat, N.; Uysal, M. Investigating performance of Airborne LiDAR data filtering algorithms for DTM generation. Measurement 2015, 63, 61–68. [Google Scholar] [CrossRef]
- Gong, P.; Liu, H.; Zhang, M.; Li, C.; Wang, J.; Huang, H.; Clinton, N.; Ji, L.; Li, W.; Bai, Y.; et al. Stable classification with limited sample: transferring a 30-m resolution sample set collected in 2015 to mapping 10-m resolution global land cover in 2017. Sci. Bull. 2019, 64, 370–373. [Google Scholar] [CrossRef]
- Chen, Z.; Zhang, T.; Ouyang, C. End-to-End Airplane Detection Using Transfer Learning in Remote Sensing Images. Remote Sens. 2018, 10, 139. [Google Scholar] [CrossRef]
- Xu, Y.; Zhu, M.; Xin, P.; Li, S.; Qi, M.; Ma, S. Rapid Airplane Detection in Remote Sensing Images Based on Multilayer Feature Fusion in Fully Convolutional Neural Networks. Sensors 2018, 18, 2335. [Google Scholar] [CrossRef]
- Bo, S.; Jing, Y. Region-based airplane detection in remotely sensed imagery. In Proceedings of the 2010 3rd International Congress on Image and Signal Processing, Yantai, China, 16–18 October 2010; pp. 1923–1926. [Google Scholar]
- Luo, Q.H.; Shi, Z.W. Airplane detection in remote sensing images based on object proposal. In Proceedings of the 2016 IEEE International Geoscience and Remote Sensing Symposium (IGARSS), Beijing, China, 10–15 July 2016. [Google Scholar]
- Wang, G.; Wang, X.; Fan, B.; Pan, C. Feature Extraction by Rotation-Invariant Matrix Representation for Object Detection in Aerial Image. IEEE Geosci. Remote Sens. Lett. 2017, 14, 851–855. [Google Scholar] [CrossRef]
- Zhang, L.B.; Zhang, Y.Y. Airport detection and aircraft recognition based on two-layer saliency model in high spatial resolution remote-sensing images. IEEE J. Sel. Top. Appl. Earth Obs. Remote Sens. 2017, 10, 1511–1524. [Google Scholar] [CrossRef]
- Yokoya, N.; Iwasaki, A. Object Detection Based on Sparse Representation and Hough Voting for Optical Remote Sensing Imagery. IEEE J. Sel. Top. Appl. Earth Obs. Remote Sens. 2015, 8, 1. [Google Scholar] [CrossRef]
- Liu, G.; Sun, X.; Fu, K.; Wang, H.Q. Aircraft recognition in high-resolution satellite images using coarse-to-fine shape prior. IEEE Geosci. Remote Sens. Lett. 2013, 10, 573–577. [Google Scholar] [CrossRef]
- Tan, Y.; Li, Q.; Li, Y.; Tian, J. Aircraft Detection in High-Resolution SAR Images Based on a Gradient Textural Saliency Map. Sensors 2015, 15, 23071–23094. [Google Scholar] [CrossRef] [PubMed]
- Zhang, W.; Lv, W.; Zhang, Y.; Tian, J.; Ma, J. Unsupervised-learning airplane detection in remote sensing images. In MIPPR 2015: Remote Sensing Image Processing, Geographic Information Systems, and Other Applications; SPIE: Bellingham, WA, USA, 2015; Volume 9815, p. 981503. [Google Scholar]
- Li, X.B.; Wang, S.J. Object detection using convolutional neural networks in a coarse-to-fine manner. IEEE Geosci. Remote Sens. Lett. 2017, 14, 2037–2041. [Google Scholar] [CrossRef]
- Yang, Y.; Zhuang, Y.; Bi, F.; Shi, H.; Xie, Y. M-FCN: Effective Fully Convolutional Network-Based Airplane Detection Framework. IEEE Geosci. Remote Sens. Lett. 2017, 14, 1–5. [Google Scholar] [CrossRef]
- Zhu, M.; Xu, Y.; Ma, S.; Li, S.; Ma, H.; Han, Y. Effective Airplane Detection in Remote Sensing Images Based on Multilayer Feature Fusion and Improved Nonmaximal Suppression Algorithm. Remote Sens. 2019, 11, 1062. [Google Scholar] [CrossRef]
- Yu, Y.; Guan, H.; Zai, D.; Ji, Z. Rotation-and-scale-invariant airplane detection in high-resolution satellite images based on deep-Hough-forests. ISPRS J. Photogramm. Remote Sens. 2016, 112, 50–64. [Google Scholar] [CrossRef]
- Guo, W.; Yang, W.; Zhang, H.; Hua, G. Geospatial Object Detection in High Resolution Satellite Images Based on Multi-Scale Convolutional Neural Network. Remote Sens. 2018, 10, 131. [Google Scholar] [CrossRef]
- Li, Y.; Zhang, H.; Shen, Q. Spectral–Spatial Classification of Hyperspectral Imagery with 3D Convolutional Neural Network. Remote Sens. 2017, 9, 67. [Google Scholar] [CrossRef]
- Sellami, A.; Farah, M.; Farah, I.R.; Solaiman, B. Hyperspectral imagery classification based on semi-supervised 3-D deep neural network and adaptive band selection. Expert Syst. Appl. 2019, 129, 246–259. [Google Scholar] [CrossRef]
- Ma, L.; Liu, Y.; Zhang, X.; Ye, Y.; Yin, G.; Johnson, B.A. Deep learning in remote sensing applications: A meta-analysis and review. ISPRS J. Photogramm. Remote Sens. 2019, 152, 166–177. [Google Scholar] [CrossRef]
- Zhang, P.; Niu, X.; Dou, Y.; Xia, F. Airport Detection on Optical Satellite Images Using Deep Convolutional Neural Networks. IEEE Geosci. Remote Sens. Lett. 2017, 14, 1183–1187. [Google Scholar] [CrossRef]
- Girshick, R.; Donahue, J.; Darrell, T.; Malik, J.; Malik, J. Rich Feature Hierarchies for Accurate Object Detection and Semantic Segmentation. 2014 IEEE Conf. Comput. Vis. Pattern Recognit. 2014, 580–587. [Google Scholar]
- Girshick, R. Fast R-CNN. In Proceedings of the 2015 IEEE International Conference on Computer Vision (ICCV), Washington, DC, USA, 7–13 December 2015; pp. 1440–1448. [Google Scholar]
- Ren, S.; He, K.; Girshick, R.; Sun, J. Faster R-CNN: Towards Real-time Object Detection with Region Proposal Networks. IEEE Trans. Pattern Anal. Mach. Intell. 2017, 39, 1137–1149. [Google Scholar] [CrossRef] [PubMed]
- Zhang, L.; Lin, L.; Liang, X.; He, K. Is Faster R-CNN Doing Well for Pedestrian Detection? In Proceedings of the European Conference on Computer Vision (ECCV), Amsterdam, The Netherlands, 11–14 October 2016. [Google Scholar]
- Ren, Y.; Zhu, C.; Xiao, S. Deformable Faster R-CNN with Aggregating Multi-Layer Features for Partially Occluded Object Detection in Optical Remote Sensing Images. Remote Sens. 2018, 10, 1470. [Google Scholar] [CrossRef]
- Ding, P.; Zhang, Y.; Deng, W.-J.; Jia, P.; Kuijper, A. A light and faster regional convolutional neural network for object detection in optical remote sensing images. ISPRS J. Photogramm. Remote Sens. 2018, 141, 208–218. [Google Scholar] [CrossRef]
- Zhang, Y.H.; Fu, K.; Sun, H.; Sun, X.; Zheng, X.W.; Wang, H.Q. A multi-model ensemble method based on convolutional neural networks for aircraft detection in large remote sensing images. Remote Sens. Lett. 2018, 9, 11–20. [Google Scholar] [CrossRef]
- Han, X.B.; Zhong, Y.F.; Feng, R.Y.; Zhang, L.P. Robust geospatial object detection based on pre-trained faster r-cnn framework for high spatial resolution imagery. In Proceedings of the 2017 IEEE International Geoscience and Remote Sensing Symposium (IGARSS), Fort Worth, TX, USA, 23–28 July 2017; pp. 3353–3356. [Google Scholar]
- Mallick, J.; Rahman, A.; Singh, C.K. Modeling urban heat islands in heterogeneous land surface and its correlation with impervious surface area by using night-time ASTER satellite data in highly urbanizing city, Delhi-India. Adv. Space Res. 2013, 52, 639–655. [Google Scholar] [CrossRef]
- Tadono, T.; Nagai, H.; Ishida, H.; Oda, F.; Naito, S.; Minakawa, K.; Iwamoto, H. GENERATION OF THE 30 M-MESH GLOBAL DIGITAL SURFACE MODEL BY ALOS PRISM. ISPRS - Int. Arch. Photogramm. Remote Sens. Spat. Inf. Sci. 2016, 41, 157–162. [Google Scholar] [CrossRef]
- Yahaya, S.I.; El Azzab, D. Vertical accuracy assessment of global digital elevation models and validation of gravity database heights in Niger. Int. J. Remote Sens. 2019, 40, 7966–7985. [Google Scholar] [CrossRef]
- Susaki, J. Adaptive Slope Filtering of Airborne LiDAR Data in Urban Areas for Digital Terrain Model (DTM) Generation. Remote Sens. 2012, 4, 1804–1819. [Google Scholar] [CrossRef]
- Zhang, K.; Chen, S.-C.; Whitman, D.; Shyu, M.-L.; Yan, J.; Zhang, C. A progressive morphological filter for removing nonground measurements from airborne LIDAR data. IEEE Trans. Geosci. Remote Sens. 2003, 41, 872–882. [Google Scholar] [CrossRef]
- Song, Y.; Long, Y.; Wu, P.; Wang, X. Are all cities with similar urban form or not? Redefining cities with ubiquitous points of interest and evaluating them with indicators at city and block levels in China. Int. J. Geogr. Inf. Sci. 2018, 32, 1–30. [Google Scholar] [CrossRef]
- Chen, C.Y.; Liu, M.Y.; Tuzel, O.; Xiao, J.X. R-cnn for small object detection. Lect. Notes Comput. Sci. 2017, 10115, 214–230. [Google Scholar]
- Eggert, C.; Brehm, S.; Winschel, A.; Zecha, D.; Lienhart, R. A closer look: Small object detection in faster R-CNN. In Proceedings of the 2017 IEEE Int. Conf. Multimed. Expo (Icme), Hong Kong, China , 10–14 July 2017; pp. 421–426. [Google Scholar]
- Foody, G.M.; Ling, F.; Boyd, D.S.; Li, X.; Wardlaw, J. Earth Observation and Machine Learning to Meet Sustainable Development Goal 8.7: Mapping Sites Associated with Slavery from Space. Remote Sens. 2019, 11, 266. [Google Scholar] [CrossRef]
- Pérez-Hoyos, A.; García-Haro, F.; San-Miguel-Ayanz, J. A methodology to generate a synergetic land-cover map by fusion of different land-cover products. Int. J. Appl. Earth Obs. Geoinf. 2012, 19, 72–87. [Google Scholar] [CrossRef]
- See, L.; Fritz, S. A method to compare and improve land cover datasets: application to the GLC-2000 and MODIS land cover products. IEEE Trans. Geosci. Remote Sens. 2006, 44, 1740–1746. [Google Scholar] [CrossRef]
- Paleari, S.; Redondi, R.; Malighetti, P. A comparative study of airport connectivity in China, Europe and US: Which network provides the best service to passengers? Transp. Res. Part E: Logist. Transp. Rev. 2010, 46, 198–210. [Google Scholar] [CrossRef]
- Liu, W.; Anguelov, D.; Erhan, D.; Szegedy, C.; Reed, S.; Fu, C.Y.; Berg, A.C. SSD: Single Shot MultiBox Detector. In Proceedings of the 2016 European Conference on Computer Vision, Amsterdam, The Netherlands, 11–14 October 2016; pp. 21–37. [Google Scholar]
- Redmon, J.; Divvala, S.; Girshick, R.; Farhadi, A. You Only Look Once: Unified, Real-Time Object Detection. 2016 IEEE Conf. Comput. Vis. Pattern Recognit. (Cvpr) 2016, 779–788. [Google Scholar]
- Kang, J.; Korner, M.; Wang, Y.; Taubenböck, H.; Zhu, X.X. Building instance classification using street view images. ISPRS J. Photogramm. Remote Sens. 2018, 145, 44–59. [Google Scholar] [CrossRef]
- Branson, S.; Wegner, J.D.; Hall, D.; Lang, N.; Schindler, K.; Perona, P. From Google Maps to a fine-grained catalog of street trees. ISPRS J. Photogramm. Remote Sens. 2018, 135, 13–30. [Google Scholar] [CrossRef]
- Cao, R.; Zhu, J.; Tu, W.; Li, Q.; Cao, J.; Liu, B.; Zhang, Q.; Qiu, G. Integrating Aerial and Street View Images for Urban Land Use Classification. Remote Sens. 2018, 10, 1553. [Google Scholar] [CrossRef]


| Datasets | Spatial Resolution (m) | Updated | Sources |
|---|---|---|---|
| FROM-GLC10 | 10 | 2017 | Tsinghua University |
| AW3D30 | 30 | April 2019 | Japan Aerospace Exploration Agency |
| OSM datasets | - | May 15th, 2019 | Open Street Map |
| Administrative boundaries | - | - | Center for Spatial Sciences, University of California, Davis |
| Google images (19-level) | 0.23 | - | |
| Airport validation data | - | June 12th, 2019 | Crowd-sourced |
| City | Attribution | Impervious Area | |
|---|---|---|---|
| All | Candidate Airport | ||
| Beijing | Relative area (%) | 15.49 | 1.64 |
| Block counts | 294,955 | 192 | |
| New Jersey | Relative area (%) | 7.95 | 0.37 |
| Block counts | 537,640 | 58 | |
| Northeastern Buenos Aires | Relative area (%) | 5.05 | 0.06 |
| Block counts | 164,266 | 23 | |
| City | Faster R-CNN | Refined by CNN Reclassifier | ||
|---|---|---|---|---|
| Prediction | User’s Accuracy | Prediction | User’s Accuracy | |
| Beijing | 340 | 90.88% | 313 | 95.53% |
| New Jersey | 380 | 88.16% | 348 | 93.68% |
| Northeastern Buenos Aires | 109 | 85.32% | 99 | 91.92% |
| Total | 829 | 88.90% | 760 | 94.21% |
© 2019 by the authors. Licensee MDPI, Basel, Switzerland. This article is an open access article distributed under the terms and conditions of the Creative Commons Attribution (CC BY) license (http://creativecommons.org/licenses/by/4.0/).
Share and Cite
Zeng, F.; Cheng, L.; Li, N.; Xia, N.; Ma, L.; Zhou, X.; Li, M. A Hierarchical Airport Detection Method Using Spatial Analysis and Deep Learning. Remote Sens. 2019, 11, 2204. https://doi.org/10.3390/rs11192204
Zeng F, Cheng L, Li N, Xia N, Ma L, Zhou X, Li M. A Hierarchical Airport Detection Method Using Spatial Analysis and Deep Learning. Remote Sensing. 2019; 11(19):2204. https://doi.org/10.3390/rs11192204
Chicago/Turabian StyleZeng, Fanxuan, Liang Cheng, Ning Li, Nan Xia, Lei Ma, Xiao Zhou, and Manchun Li. 2019. "A Hierarchical Airport Detection Method Using Spatial Analysis and Deep Learning" Remote Sensing 11, no. 19: 2204. https://doi.org/10.3390/rs11192204
APA StyleZeng, F., Cheng, L., Li, N., Xia, N., Ma, L., Zhou, X., & Li, M. (2019). A Hierarchical Airport Detection Method Using Spatial Analysis and Deep Learning. Remote Sensing, 11(19), 2204. https://doi.org/10.3390/rs11192204