WorldView-2 Data for Hierarchical Object-Based Urban Land Cover Classification in Kigali: Integrating Rule-Based Approach with Urban Density and Greenness Indices


Abstract
1. Introduction
2. Study Area and Data Description
2.1. Conceptualizing Land Cover Classification Scheme
2.2. Training and Validation Data Collection
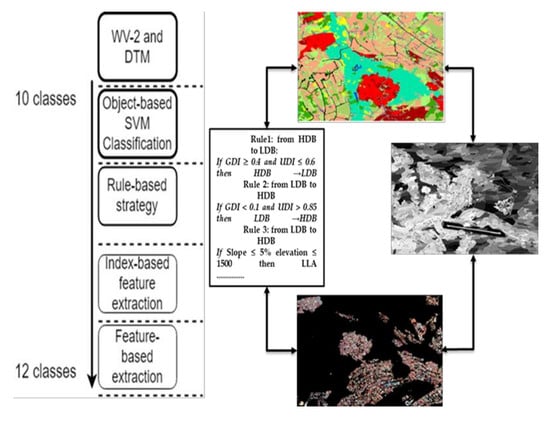
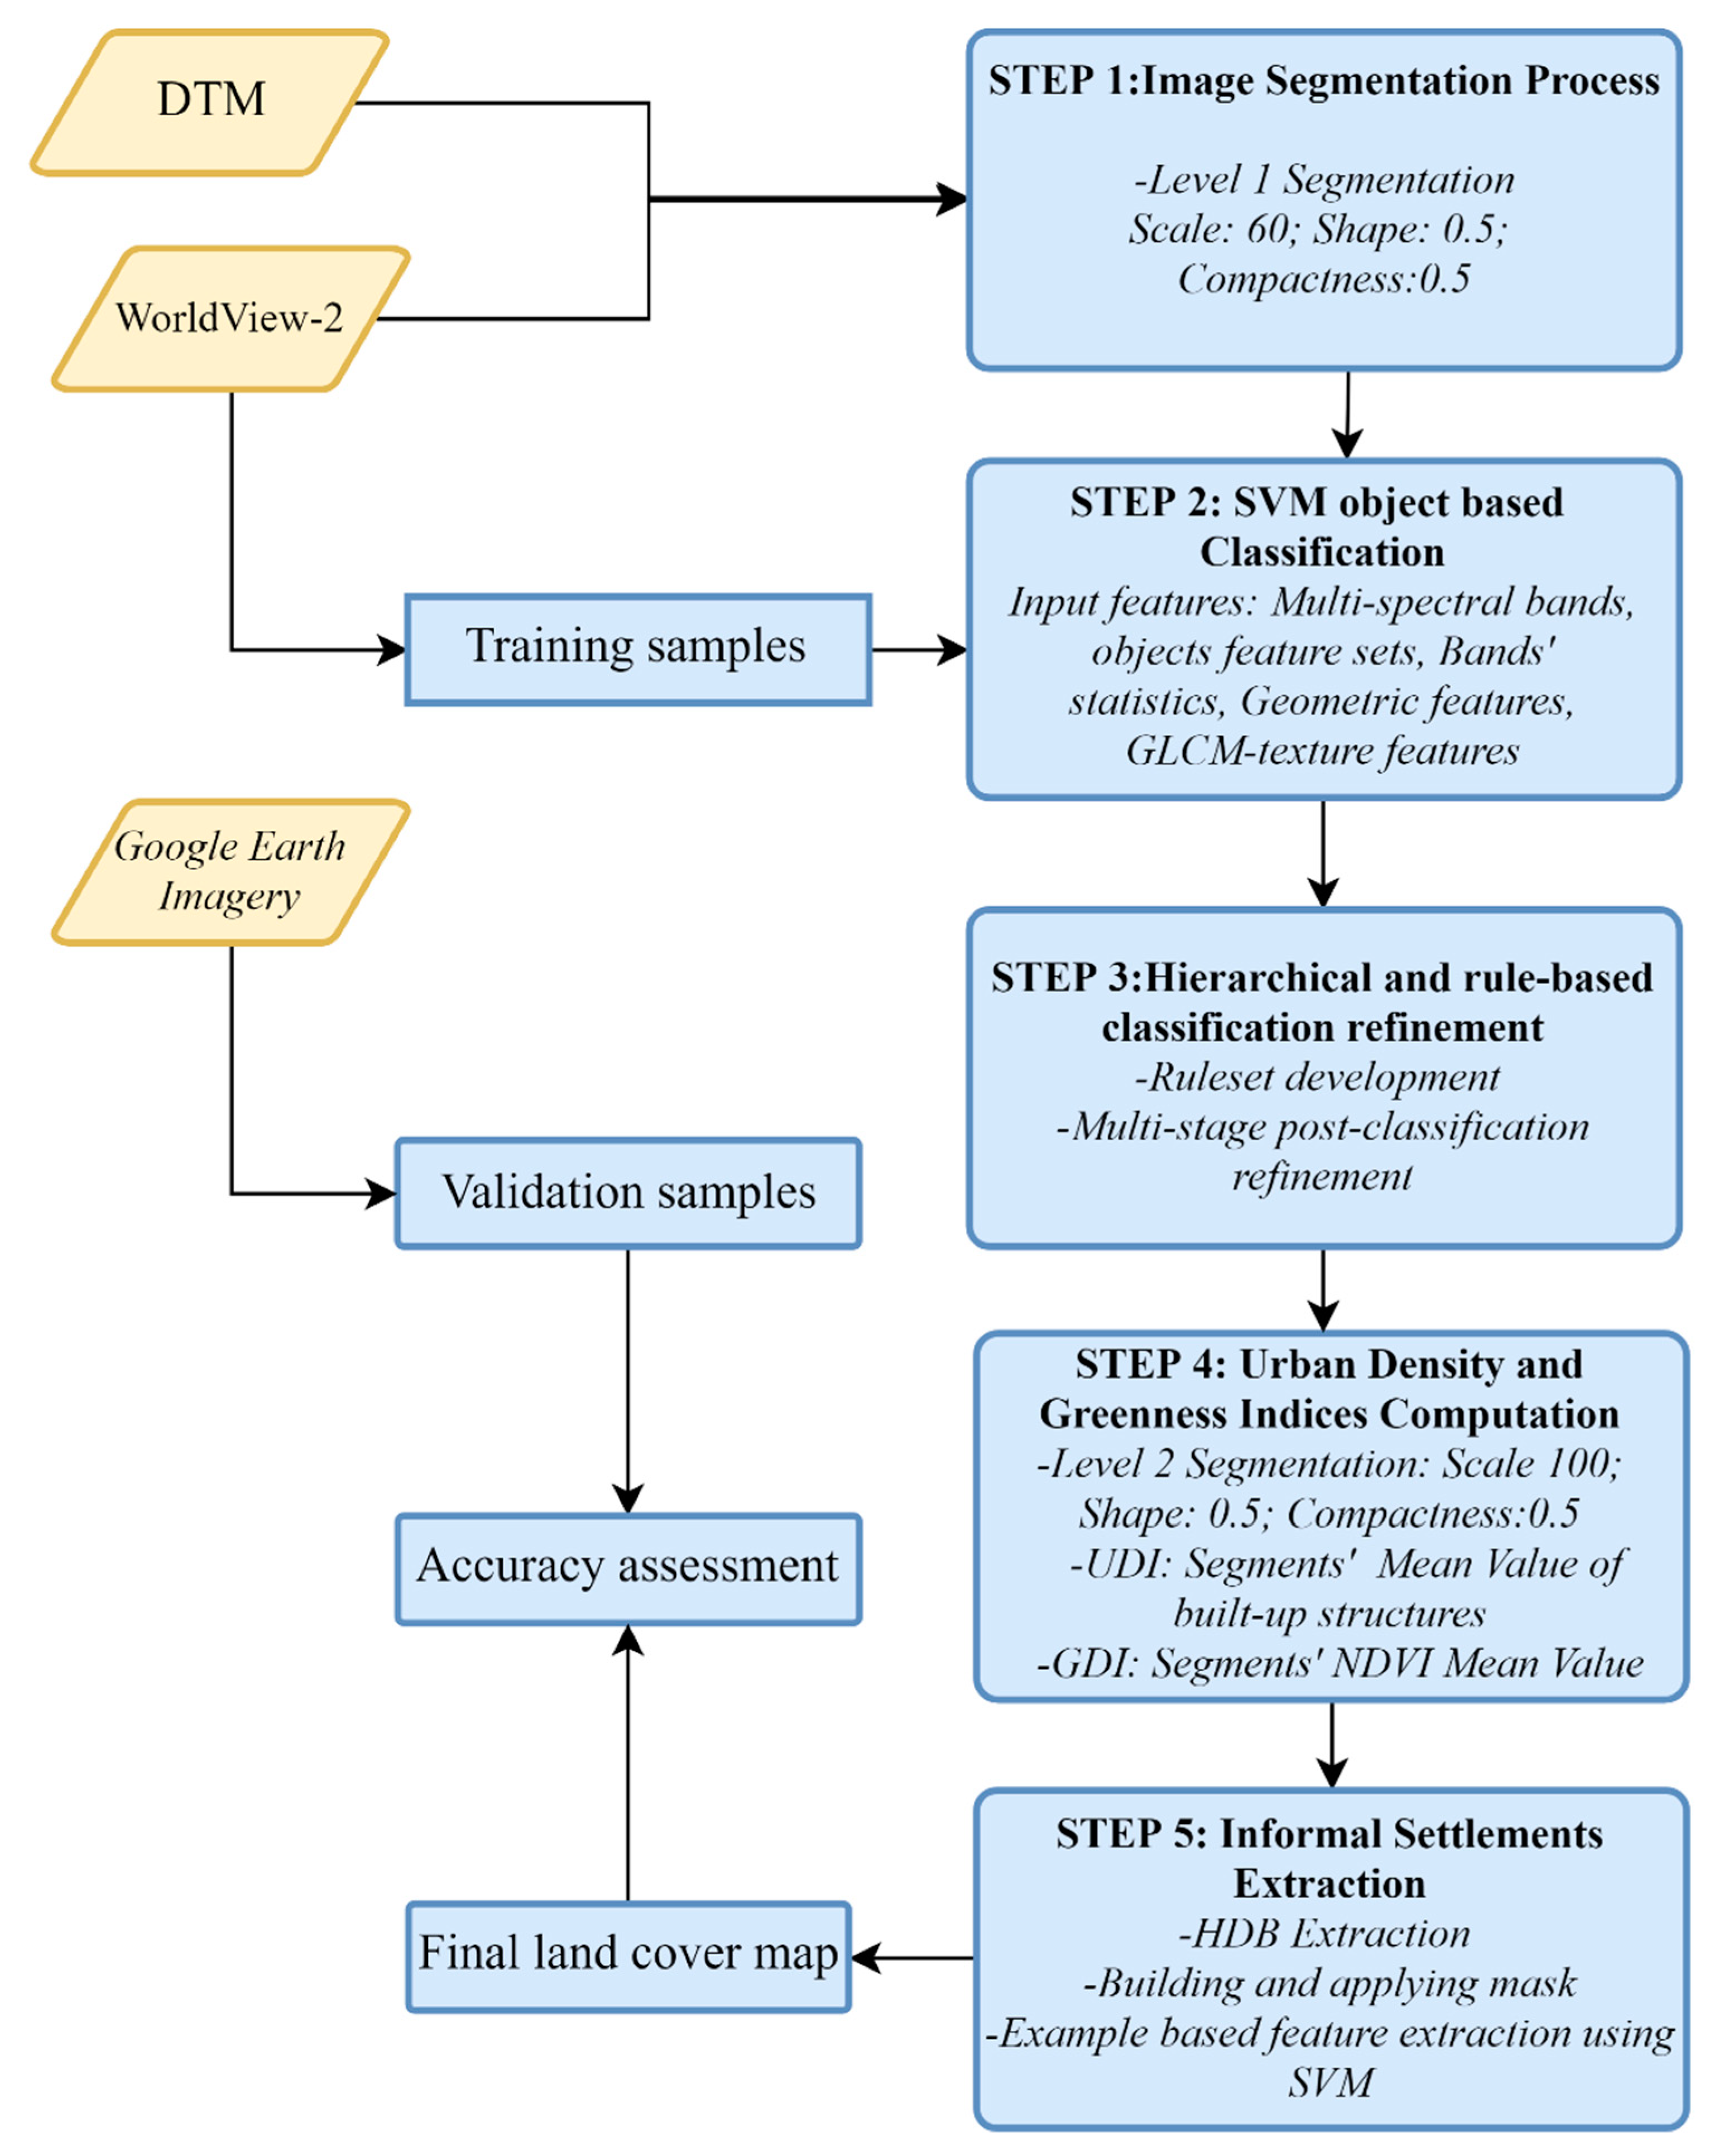
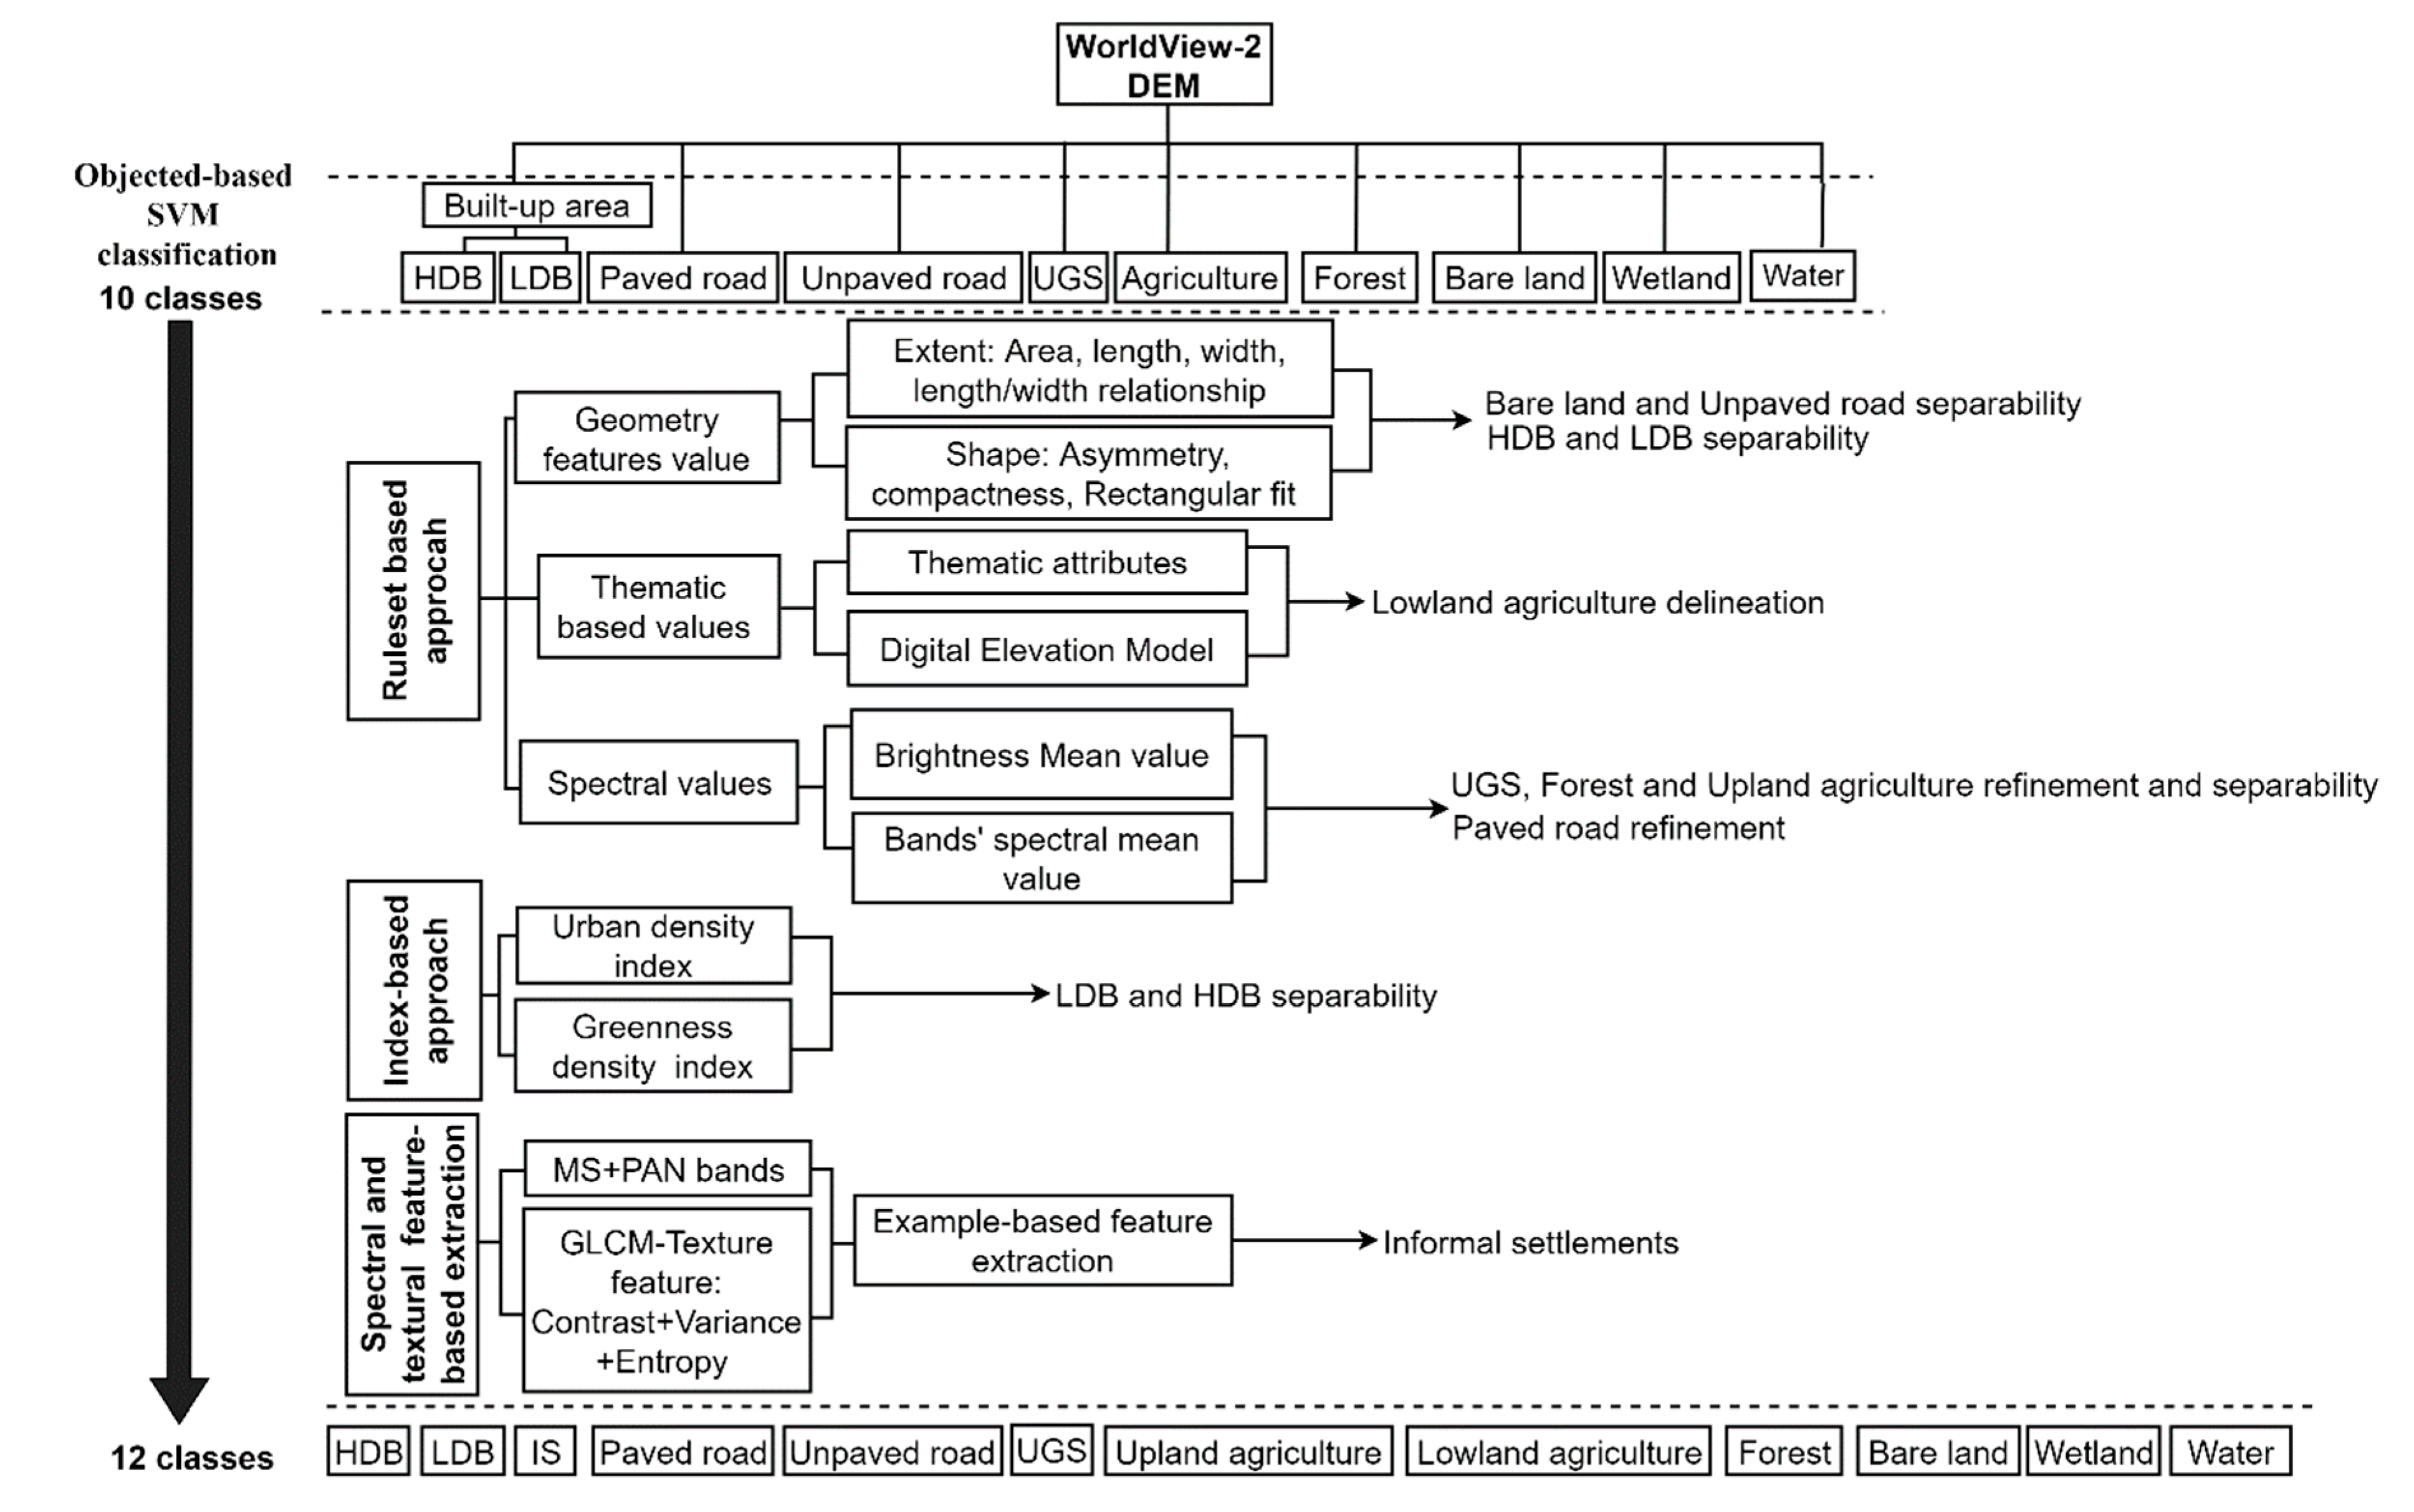
3. Methodology
3.1. Step 1: Image Segmentation
3.2. Step 2: SVM Object-Based Image Classification
3.3. Step 3: Hierarchical Classification Refinement with Ruleset
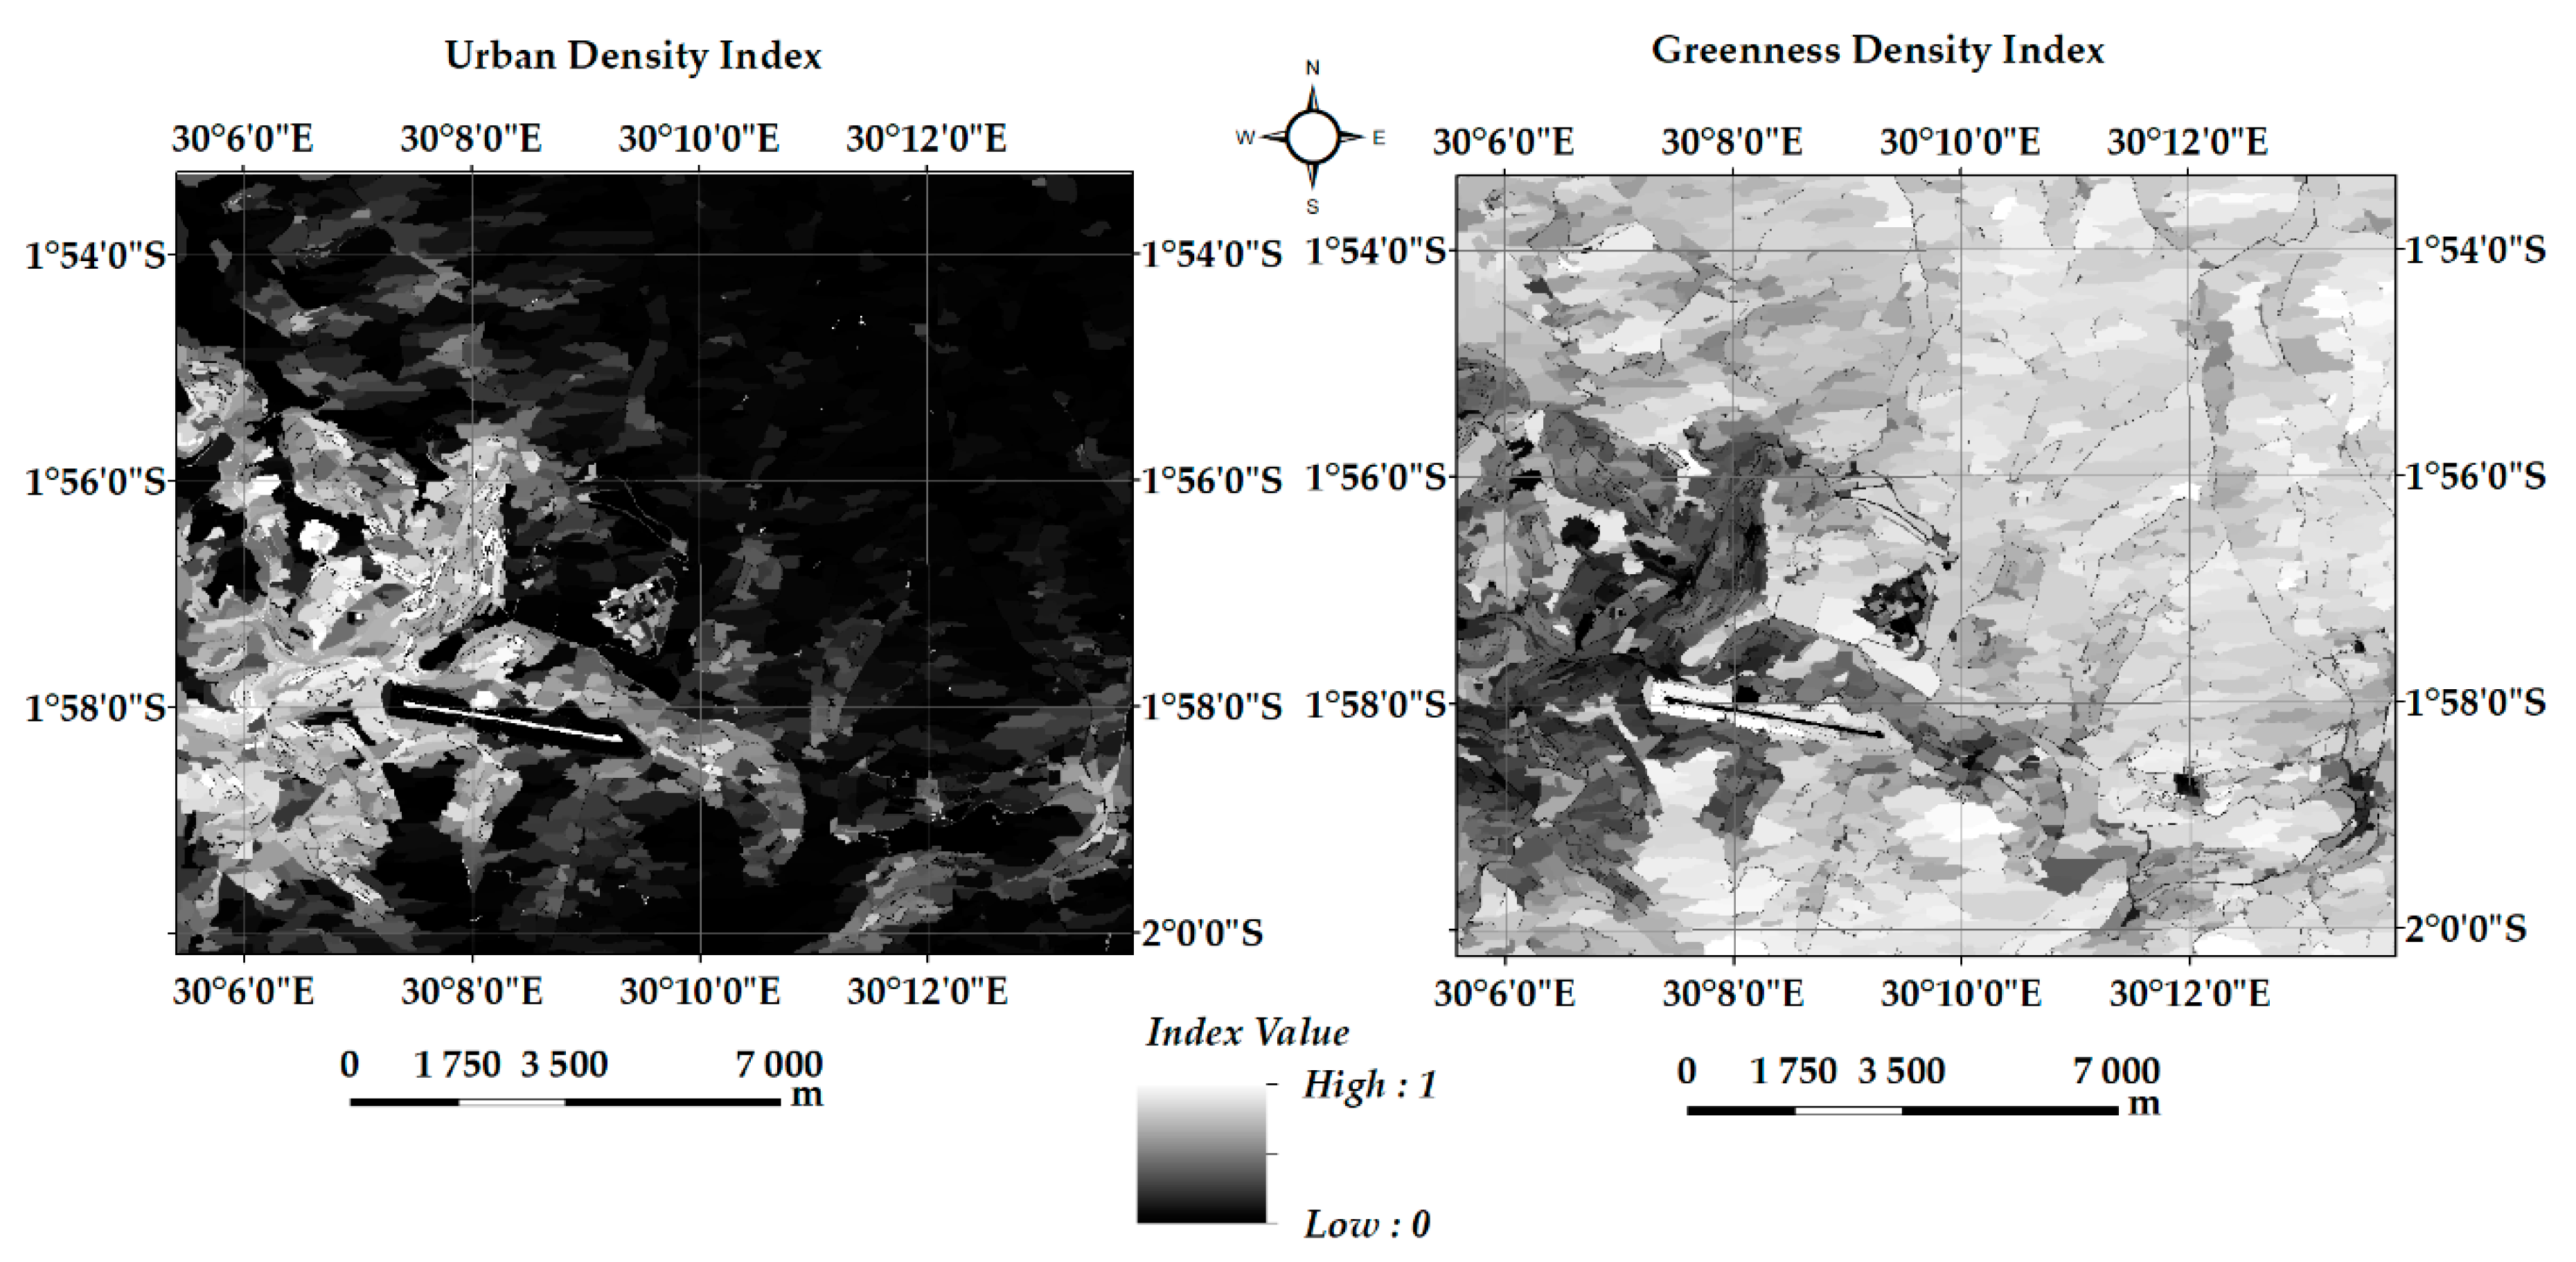
3.4. Step 4: Urban Density and Greenness Indices Computation
| Rule1: from HDB to LDB: |
| If GDI ≥ 0.4 and UDI ≤ 0.6 then HDB →.LDB |
| Rule 2: from LDB to HDB |
| If GDI < 0.1 and UDI > 0.85 then LDB → HDB |
3.5. Step 5: Informal Settlements Extraction
4. Results
5. Discussion
6. Conclusions and Further Research
Author Contributions
Funding
Acknowledgments
Conflicts of Interest
References
- Girard, L.F.; Forte, B.; Cerreta, M.; Toro, P.; Forte, F. The Human Sustainable City: Challenges and Perspectives from the Habitat Agenda; Ashgate: Aldershot, UK, 2003. [Google Scholar]
- Kleniewski, N.; Thomas, A. Cities, Change, and Conflict, 4th ed.; Linda Schreiber: Belmont, CA, USA, 2010. [Google Scholar]
- Rahman, A.; Kumar, Y.; Fazal, S.; Bhaskaran, S. Urbanization and Quality of Urban Environment Using Remote Sensing and GIS Techniques in East Delhi-India. J. Geogr. Inf. Syst. 2011, 3, 62–84. [Google Scholar] [CrossRef]
- De Souza, M.L. Metropolitan deconcentration, socio-political fragmentation and extended suburbanisation: Brazilian urbanisation in the 1980s and 1990s. Geoforum 2001, 32, 437–447. [Google Scholar] [CrossRef]
- Hardoy, J.E.; Mitlin, D.; Satterthwaite, D. Environmental Problems in Third World Cities; Earthscan: London, UK, 1992. [Google Scholar]
- van Vliet, J.; Eitelberg, D.A.; Verburg, P.H. A global analysis of land take in cropland areas and production displacement from urbanization. Glob. Environ. Chang. 2017, 43, 107–115. [Google Scholar] [CrossRef]
- Ziaei, Z.; Pradhan, B.; Mansor, S.B. A rule-based parameter aided with object-based classification approach for extraction of building and roads from WorldView-2 images. Geocarto Int. 2014, 29, 554–569. [Google Scholar] [CrossRef]
- United Nations Department of Economics and Social Affairs, Population Division. United Nations World Urbanization Prospects: The 2014 Revision; United Nations Department of Economics and Social Affairs, Population Division: New York, NY, USA, 2015. [Google Scholar]
- Vanhuysse, S.; Grippa, T.; Lennert, M.; Wolff, E.; Idrissa, M. Contribution of nDSM derived from VHR stereo imagery to urban land-cover mapping in Sub-Saharan Africa. In Proceedings of the Urban Remote Sensing Event (JURSE), 2017 Joint, Dubai, UAE, 6–8 March 2017; pp. 1–4. [Google Scholar]
- Kuffer, M.; Pfeffer, K.; Sliuzas, R.; Baud, I. Extraction of slum areas from VHR imagery using GLCM variance. IEEE J. Sel. Top. Appl. Earth Obs. Remote Sens. 2016, 9, 1830–1840. [Google Scholar] [CrossRef]
- Wulder, M.A.; Coops, N.C.; Roy, D.P.; White, J.C.; Hermosilla, T. Land cover 2.0. Int. J. Remote Sens. 2018, 39, 4254–4284. [Google Scholar] [CrossRef]
- Zhu, Z.; Woodcock, C.E. Continuous change detection and classification of land cover using all available Landsat data. Remote Sens. Environ. 2014, 144, 152–171. [Google Scholar] [CrossRef]
- Bibby, P.; Shepherd, J. Monitoring land cover and land use for urban and regional planning. Geogr. Inf. Syst. 1999, 2, 953–965. [Google Scholar]
- Dewan, A.M.; Yamaguchi, Y. Land use and land cover change in Greater Dhaka, Bangladesh: Using remote sensing to promote sustainable urbanization. Appl. Geogr. 2009, 29, 390–401. [Google Scholar] [CrossRef]
- Gashaw, T.; Tulu, T.; Argaw, M.; Worqlul, A.W.; Tolessa, T.; Kindu, M. Estimating the impacts of land use/land cover changes on Ecosystem Service Values: The case of the Andassa watershed in the Upper Blue Nile basin of Ethiopia. Ecosyst. Serv. 2018, 31, 219–228. [Google Scholar] [CrossRef]
- Furberg, D.; Ban, Y. Satellite monitoring of urban sprawl and assessment of its potential environmental impact in the Greater Toronto Area between 1985 and 2005. Environ. Manag. 2012, 50, 1068–1088. [Google Scholar] [CrossRef] [PubMed]
- Haas, J.; Ban, Y. Urban Land Cover and Ecosystem Service Changes Based on Landsat TM and Sentinel-2A Data. IEEE J. Sel. Top. Appl. Earth Obs. Remote Sens. 2018, 11, 485–497. [Google Scholar] [CrossRef]
- Zhou, W.; Troy, A.; Grove, M. Object-based land cover classification and change analysis in the Baltimore metropolitan area using multitemporal high resolution remote sensing data. Sensors 2008, 8, 1613–1636. [Google Scholar] [CrossRef] [PubMed]
- Ban, Y.; Hu, H.; Rangel, I.M. Fusion of Quickbird MS and RADARSAT SAR data for urban land-cover mapping: Object-based and knowledge-based approach. Int. J. Remote Sens. 2010, 31, 1391–1410. [Google Scholar] [CrossRef]
- Asner, G.P.; Warner, A.S. Canopy shadow in IKONOS satellite observations of tropical forests and savannas. Remote Sens. Environ. 2003, 87, 521–533. [Google Scholar] [CrossRef]
- Lu, D.; Weng, Q. Extraction of urban impervious surfaces from an IKONOS image. Int. J. Remote Sens. 2009, 30, 1297–1311. [Google Scholar] [CrossRef]
- Lu, D.; Hetrick, S.; Moran, E. Land cover classification in a complex urban-rural landscape with QuickBird imagery. Photogramm. Eng. Remote Sens. 2010, 76, 1159–1168. [Google Scholar] [CrossRef]
- Belgiu, M.; Drǎguţ, L.; Strobl, J. Quantitative evaluation of variations in rule-based classifications of land cover in urban neighbourhoods using WorldView-2 imagery. ISPRS J. Photogramm. Remote Sens. 2014, 87, 205–215. [Google Scholar] [CrossRef]
- Haas, J.; Ban, Y. Sentinel-1A SAR and sentinel-2A MSI data fusion for urban ecosystem service mapping. Remote Sens. Appl. Soci. Environ. 2017, 8, 41–53. [Google Scholar] [CrossRef]
- Kohli, D.; Sliuzas, R.; Stein, A. Urban slum detection using texture and spatial metrics derived from satellite imagery. J. Spat. Sci. 2016, 61, 405–426. [Google Scholar] [CrossRef]
- Pacifici, F.; Chini, M.; Emery, W.J. A neural network approach using multi-scale textural metrics from very high-resolution panchromatic imagery for urban land-use classification. Remote Sens. Environ. 2009, 113, 1276–1292. [Google Scholar] [CrossRef]
- Puissant, A.; Hirsch, J.; Weber, C. The utility of texture analysis to improve per-pixel classification for high to very high spatial resolution imagery. Int. J. Remote Sens. 2005, 26, 733–745. [Google Scholar] [CrossRef]
- Qin, Y.; Niu, Z.; Chen, F.; Li, B.; Ban, Y. Object-based land cover change detection for cross-sensor images. Int. J. Remote Sens. 2013, 34, 6723–6737. [Google Scholar] [CrossRef]
- González-Audícana, M.; Saleta, J.L.; Catalán, R.G.; García, R. Fusion of multispectral and panchromatic images using improved IHS and PCA mergers based on wavelet decomposition. IEEE Trans. Geosci. Remote Sens. 2004, 42, 1291–1299. [Google Scholar] [CrossRef]
- Haris, K.; Efstratiadis, S.N.; Maglaveras, N.; Katsaggelos, A.K. Hybrid image segmentation using watersheds and fast region merging. IEEE Trans. Image Process. 1998, 7, 1684–1699. [Google Scholar] [CrossRef] [PubMed]
- Kit, O.; Lüdeke, M.; Reckien, D. Texture-based identification of urban slums in Hyderabad, India using remote sensing data. Appl. Geogr. 2012, 32, 660–667. [Google Scholar] [CrossRef]
- Kit, O.; Lüdeke, M. Automated detection of slum area change in Hyderabad, India using multitemporal satellite imagery. ISPRS J. Photogramm. Remote Sens. 2013, 83, 130–137. [Google Scholar] [CrossRef]
- Liu, H.; Huang, X.; Wen, D.; Li, J. The use of landscape metrics and transfer learning to explore urban villages in China. Remote Sens. 2017, 9, 365. [Google Scholar] [CrossRef]
- Gianinetto, M.; Rusmini, M.; Candiani, G.; Via, G.D.; Frassy, F.; Maianti, P.; Marchesi, A.; Nodari, F.R.; Dini, L. Hierarchical classification of complex landscape with VHR pan-sharpened satellite data and OBIA techniques. Eur. J. Remote Sens. 2014, 47, 229–250. [Google Scholar] [CrossRef]
- Johnson, B.A. High-resolution urban land-cover classification using a competitive multi-scale object-based approach. Remote Sens. Lett. 2013, 4, 131–140. [Google Scholar] [CrossRef]
- Novack, T.; Esch, T.; Kux, H.; Stilla, U. Machine learning comparison between WorldView-2 and QuickBird-2-simulated imagery regarding object-based urban land cover classification. Remote Sens. 2011, 3, 2263–2282. [Google Scholar] [CrossRef]
- Mboga, N.; Persello, C.; Bergado, J.R.; Stein, A. Detection of Informal Settlements from VHR Images Using Convolutional Neural Networks. Remote Sens. 2017, 9, 1106. [Google Scholar] [CrossRef]
- Jawak, S.D.; Luis, A.J. Improved land cover mapping using high resolution multiangle 8-band WorldView-2 satellite remote sensing data. J. Appl. Remote Sens. 2013, 7, 073573. [Google Scholar] [CrossRef]
- Pacifici, F.; Chanussot, J.; Du, Q. 2011 GRSS data fusion contest: Exploiting WorldView-2 multi-angular acquisitions. In Proceedings of the 2011 IEEE International Geoscience and Remote Sensing Symposium, Vancouver, BC, Canada, 24–29 July 2011; pp. 1163–1166. [Google Scholar]
- Longbotham, N.; Chaapel, C.; Bleiler, L.; Padwick, C.; Emery, W.J.; Pacifici, F. Very high resolution multiangle urban classification analysis. IEEE Trans. Geosci. Remote Sens. 2011, 50, 1155–1170. [Google Scholar] [CrossRef]
- Rhinane, H.; Hilali, A.; Berrada, A.; Hakdaoui, M. Detecting slums from SPOT data in Casablanca Morocco using an object based approach. J. Geogr. Inf. Syst. 2011, 3, 217. [Google Scholar] [CrossRef]
- Aminipouri, M.; Sliuzas, R.; Kuffer, M. Object-oriented analysis of very high resolution orthophotos for estimating the population of slum areas, case of Dar-Es-Salaam, Tanzania. In Proceedings of the ISPRS XXXVIII Conference, Ahmedabad, India, 17–18 December 2009; pp. 1–6. [Google Scholar]
- Duque, J.C.; Patino, J.E.; Ruiz, L.A.; Pardo-Pascual, J.E. Measuring intra-urban poverty using land cover and texture metrics derived from remote sensing data. Landsc. Urban Plan. 2015, 135, 11–21. [Google Scholar] [CrossRef]
- Valero, S.; Chanussot, J.; Benediktsson, J.A.; Talbot, H.; Waske, B. Advanced directional mathematical morphology for the detection of the road network in very high resolution remote sensing images. Pattern Recognit. Lett. 2010, 31, 1120–1127. [Google Scholar] [CrossRef]
- Jin, X.; Davis, C.H. Automated building extraction from high-resolution satellite imagery in urban areas using structural, contextual, and spectral information. EURASIP J. Adv. Signal Process. 2005, 2005, 745309. [Google Scholar] [CrossRef]
- Yan, D.; Zhao, Z. Road detection from quickbird fused image using IHS transform and morphology. In Proceedings of the Geoscience and Remote Sensing Symposium (IGARSS’03), Toulouse, France, 21–25 July 2003; pp. 3967–3969. [Google Scholar]
- Bouziani, M.; Goïta, K.; He, D.-C. Automatic change detection of buildings in urban environment from very high spatial resolution images using existing geodatabase and prior knowledge. ISPRS J. Photogramm. Remote Sens. 2010, 65, 143–153. [Google Scholar] [CrossRef]
- Li, M.; Stein, A.; Bijker, W.; Zhan, Q. Region-based urban road extraction from VHR satellite images using binary partition tree. Int. J. Appl. Earth Obs. Geoinf. 2016, 44, 217–225. [Google Scholar] [CrossRef]
- Nobrega, R.; O’hara, C.; Quintanilha, J. Detecting roads in informal settlements surrounding Sao Paulo city by using object-based classification. In Proceedings of the 1st International Conference on Object-based Image Analysis (OBIA 2006), Salzburg, Austria, 4–5 July 2006. [Google Scholar]
- Turlapaty, A.; Gokaraju, B.; Du, Q.; Younan, N.H.; Aanstoos, J.V. A hybrid approach for building extraction from spaceborne multi-angular optical imagery. IEEE J. Sel. Top. Appl. Earth Obs. Remote Sens. 2012, 5, 89–100. [Google Scholar] [CrossRef]
- Haas, J.; Ban, Y. Mapping and monitoring urban ecosystem services using multitemporal high-resolution satellite data. IEEE J. Sel. Top. Appl. Earth Obs. Remote Sens. 2017, 10, 669–680. [Google Scholar] [CrossRef]
- Pu, R.L.; Landry, S.; Yu, Q. Object-based urban detailed land cover classification with high spatial resolution IKONOS imagery. Int. J. Remote Sens. 2011, 32, 3285–3308. [Google Scholar] [CrossRef]
- Furberg, D.; Ban, Y.F. Satellite Monitoring and Impact Assessment of Urban Growth in Stockholm, Sweden between 1986 and 2006. In Proceedings of the 29th Symposium of the European Association of Remote Sensing Laboratories, Chania, Greece, 15 March 2010; pp. 131–142. [Google Scholar]
- Kuffer, M.; Barros, J.; Sliuzas, R.V. The development of a morphological unplanned settlement index using very-high-resolution (VHR) imagery. Comput. Environ. Urban. Syst. 2014, 48, 138–152. [Google Scholar] [CrossRef]
- Hurskainen, P.; Pellikka, P. Change detection of informal settlements using multi-temporal aerial photographs–the case of Voi, SE-Kenya. In Proceedings of the 5th African Association of Remote Sensing of the Environment Conference, Unpaginated CD-ROM, Nairobi, Kenya, 17–22 October 2004. [Google Scholar]
- Veljanovski, T.; Kanjir, U.; Pehani, P.; Oštir, K.; Kovačič, P. Object-based image analysis of VHR satellite imagery for population estimation in informal settlement Kibera-Nairobi, Kenya. In Remote Sensing-Applications; Boris, E., Ed.; IntechOpen: London, UK, 2012. [Google Scholar]
- Mathenge, C.W. Application of Object Oriented Image Analysis in Slum Identification and Mapping: The Case of Kisumu, Kenya; University of Twente Faculty of Geo-Information and Earth Observation (ITC): Enschede, The Netherlands, 2011. [Google Scholar]
- Hofmann, P. Detecting informal settlements from IKONOS image data using methods of object oriented image analysis-an example from Cape Town (South Africa). In Proceedings of the Remote Sensing of Urban Areas/Fernerkundung in urbanen Räumen, Regensburg, Germany, 22–23 June 2001. [Google Scholar]
- United Nations. UN SDG Indicators Global Database. 2018. Available online: https://unstats.un.org/sdgs/indicators/database/ (accessed on 29 August 2019).
- Bachofer, F.; Hochschild, V. A SVM-based Approach to Extract Building Footprints from Pléiades Satellite Imagery. In Proceedings of the International Conference on Geospatial Technologies for Sustainable Urban and Rural Development, Kigali, Rwanda, 18–20 November 2015. [Google Scholar]
- National Institute of Statistics of Rwanda. Fourth Population and Housing Census; NISR: Kigali, Rwanda, 2012. [Google Scholar]
- Digital Globe. The Benefits of the Eight Spectral Bands of WorldView-2; Digital Globe: Westminster, CO, USA, 2010. [Google Scholar]
- Baatz, M.; Schäpe, A. Multiresolution segmentation: An optimization approach for high quality multi-scale image segmentation. In Angewandte Geographische Informationsverarbeitung; Herbert Wichmann Verlag: Herbert, New Zealand, 2000; pp. 12–23. [Google Scholar]
- Shao, Y.; Lunetta, R.S. Comparison of support vector machine, neural network, and CART algorithms for the land-cover classification using limited training data points. ISPRS J. Photogramm. Remote Sens. 2012, 70, 78–87. [Google Scholar] [CrossRef]
- Song, M.; Civco, D. Road extraction using SVM and image segmentation. Photogramm. Eng. Remote Sensing. 2004, 70, 1365–1371. [Google Scholar] [CrossRef]
- Kohli, D.; Sliuzas, R.; Kerle, N.; Stein, A. An ontology of slums for image-based classification. Comput. Environ. Urban. Syst. 2012, 36, 154–163. [Google Scholar] [CrossRef]
- Niebergall, S.; Loew, A.; Mauser, W. Integrative assessment of informal settlements using VHR remote sensing data—The Delhi case study. IEEE J. Sel. Top. Appl. Earth Obs. Remote Sens. 2008, 1, 193–205. [Google Scholar] [CrossRef]
- Robinson, D.J.; Redding, N.J.; Crisp, D.J. Implementation of a Fast Algorithm for Segmenting SAR Imagery; Electronic Research Lab: Salibsbury, Australia, 2002. [Google Scholar]
- Herold, M.; Liu, X.; Clarke, K.C. Spatial metrics and image texture for mapping urban land use. Photogramm. Eng. Remote Sens. 2003, 69, 991–1001. [Google Scholar] [CrossRef]
- Myint, S.W.; Gober, P.; Brazel, A.; Grossman-Clarke, S.; Weng, Q.H. Per-pixel vs. object-based classification of urban land cover extraction using high spatial resolution imagery. Remote Sens. Environ. 2011, 115, 1145–1161. [Google Scholar] [CrossRef]
- Maxa, M.; Bolstad, P. Mapping northern wetlands with high resolution satellite images and LiDAR. Wetlands 2009, 29, 248–260. [Google Scholar] [CrossRef]
- Simard, M.; Zhang, K.; Rivera-Monroy, V.H.; Ross, M.S.; Ruiz, P.L.; Castañeda-Moya, E.; Twilley, R.R.; Rodriguez, E. Mapping height and biomass of mangrove forests in Everglades National Park with SRTM elevation data. Photogramm. Eng. Remote Sens. 2006, 72, 299–311. [Google Scholar] [CrossRef]
- Haque, M.E.; Al-Ramadan, B.; Johnson, B.A. Rule-based land cover classification from very high-resolution satellite image with multiresolution segmentation. J. Appl. Remote Sens. 2016, 10, 036004. [Google Scholar] [CrossRef]
- Yang, X.; Chen, L.; Li, Y.; Xi, W.; Chen, L. Rule-based land use/land cover classification in coastal areas using seasonal remote sensing imagery: A case study from Lianyungang City, China. Environ. Monit. Assess. 2015, 187, 449. [Google Scholar] [CrossRef] [PubMed]
- Kohli, D.; Warwadekar, P.; Kerle, N.; Sliuzas, R.; Stein, A. Transferability of object-oriented image analysis methods for slum identification. Remote Sens. 2013, 5, 4209–4228. [Google Scholar] [CrossRef]
- Haralick, R.M.; Shanmugam, K.; Dinstein, I. Textural features for image classification. IEEE Trans. Syst. Man Cybern. Syst. 1973, SMC-3, 610–621. [Google Scholar] [CrossRef]
- Mason, S.O.; Fraser, C.S. Image sources for informal settlement management. Photogramm. Rec. 1998, 16, 313–330. [Google Scholar] [CrossRef]
- United Nations Human Settlements Programme. UN-HABITAT and Cities Alliance Analytical Perspective of Pro-Poor Slum Upgrading Frameworks; United Nations Human Settlements Programme (UN-HABITAT): Nairobi, Kenya, 2006. [Google Scholar]
- Hofmann, P.; Blaschke, T.; Strobl, J. Quantifying the robustness of fuzzy rule sets in object-based image analysis. Int. J. Remote Sens. 2011, 32, 7359–7381. [Google Scholar] [CrossRef]
- Fernández, I.C.; Morales, N.S. One-class land-cover classification using MaxEnt: The effect of modelling parameterization on classification accuracy. PeerJ 2019, 7, e7016. [Google Scholar]
- Foody, G.; Arora, M. An evaluation of some factors affecting the accuracy of classification by an artificial neural network. Int. J. Remote Sens. 1997, 18, 799–810. [Google Scholar] [CrossRef]
- Pal, M.; Mather, P.M. An assessment of the effectiveness of decision tree methods for land cover classification. Remote Sens. Environ. 2003, 86, 554–565. [Google Scholar] [CrossRef]


| No | Land Cover Class | Description |
|---|---|---|
| 1. | HDB | Areas with high concentration of buildings and few green structures (<30%). HDB also includes multistory buildings with organized spatial patterns, large in shape and size, e.g., industrial areas, schools and/or market and commercial complexes |
| 2. | LDB | Isolated buildings surrounded by gardens and planned areas with ventilation space. The LDB includes sparse settlements in urban fringe zones and those in surrounding rural areas |
| 3. | Informal Settlements | Congested small buildings with irregular shape, absence of both ventilation space and green structures |
| 4. | Paved Roads | Linear features corresponding to tarmac road, paved parking areas and airport runways |
| 5. | Unpaved Roads | Linear features corresponding to road with unpaved surface |
| 6. | UGS | Gardens and golf courses |
| 7. | Upland agriculture | Planted fields with perennial and seasonal crops localized in hillside on slope greater than 5% and post-harvested fields with sparse vegetated patches |
| 8. | Lowland agriculture | Semi-humid and dry lowlands localized in valleys and occupied by perennial crops (especially sugar cane) and seasonal crops (especially irrigated rice) and vegetables |
| 9. | Forest | Forest plantation with dense canopy structure and forest with low canopy structure including degraded forested zones |
| 10. | Bare land | Unsealed surface with total absence of vegetation |
| 11. | Wetland | Permanently flooded lowland with papyrus and other aquatic vegetation species |
| 12. | Water | Lakes and water bodies naturally created or human-made water bodies with irregular shapes. Fish ponds, swimming pools and water streams with linear and/curved shape |
| Land Cover Classes | Training Samples | Validation Data |
|---|---|---|
| # of Objects | # of Points | |
| HDB | 181 | 493 |
| LDB | 26 | 536 |
| IS | 14 | 134 |
| PR | 36 | 485 |
| UPR | 14 | 237 |
| UGS | 12 | 328 |
| Agriculture (Lowland and Highland) | 41 | 299 |
| Forest | 53 | 211 |
| Bare land | 20 | 110 |
| Wetland | 26 | 48 |
| Water | 15 | 44 |
| Total | 438 | 2925 |
| Feature Category | Selected Features |
|---|---|
| Spectral features | Mean |
| Standard deviation | |
| Geometric features—Extent | Area |
| Width | |
| Length | |
| —Shape | Asymmetry |
| Compactness | |
| Rectangular fit | |
| GLCM-Texture features | Mean |
| Entropy | |
| Standard deviation |
| No | Ruleset Objective | Applied Rules and Thresholds |
|---|---|---|
| 1 | Lowland agriculture delineation | Slope ≤ 5% and elevation ≤ 1500 m corresponds to lowland. All objects of the agriculture super-class overlapping with extracted lowland were assigned to lowland agriculture class using Thematic Attributes’ Object Feature by applying ≤0.1% Minimum overlap as threshold value |
| 2 | Assigning unpaved road to bare land | Unpaved road with length ≤ 300pixels; width ≥ 5 pixels; asymmetry ≥ 0.8 and Rectangular fit ≥ 0.4 are considered as bare land |
| 3 | Assigning bare land to unpaved road | Bare land with width ≤ 30 pixels and length ≥50 pixels and Rectangular fit ≤ 0.4 are assigned to unpaved road |
| 4 | Separating forest from Wetland | Forest with Red spectral Mean value ≥ 200 and ≤ 1400 m elevation value were considered as Wetland |
| 5 | Assigning green space around LDB to UGS | LDB with Red spectral Mean value ≤ 200 were considered as UGS |
| Reference Data (Percentage) | ||||||||||||||
|---|---|---|---|---|---|---|---|---|---|---|---|---|---|---|
| No | Classified Data | HDB | LDB | IS | PR | UPR | UGS | UPA | LLA | Forest | Bare Land | Wetland | Water | UA (%) |
| 1 | HDB | 72.2 | 4.1 | 13.9 | 0.1 | 1.6 | 0.1 | 0 | 0 | 0 | 2.5 | 0 | 0 | 90.6 |
| 2 | LDB | 18.8 | 81.5 | 7.1 | 0.9 | 6.3 | 1.7 | 0.5 | 0 | 0.2 | 8.5 | 0 | 0 | 55.1 |
| 3 | IS | 2.8 | 0 | 77 | 0 | 0 | 0 | 0 | 0 | 0 | 0 | 0 | 0 | 90.2 |
| 4 | PR | 3.5 | 0.1 | 0 | 97.3 | 0.1 | 0.3 | 0 | 0.3 | 0 | 0 | 0 | 0 | 79.6 |
| 5 | UPR | 2 | 3.2 | 1.4 | 0.1 | 90.3 | 0.6 | 0 | 0.3 | 0 | 10.5 | 0 | 0 | 52.8 |
| 6 | UGS | 0.7 | 6.8 | 0.3 | 1.4 | 0 | 82.6 | 1.5 | 0.4 | 0.9 | 0.6 | 0.4 | 0 | 60.7 |
| 7 | UPA | 0 | 4.2 | 0 | 0.2 | 0.4 | 13.4 | 92.8 | 2.1 | 6.7 | 6.4 | 0 | 0 | 70.7 |
| 10 | LLA | 0 | 0 | 0.2 | 0 | 0 | 0.1 | 0 | 94.1 | 0.5 | 1.4 | 18.1 | 0.9 | 94.1 |
| 8 | Forest | 0.1 | 0 | 0 | 0 | 0 | 1.2 | 4.7 | 0.7 | 91.4 | 0 | 0 | 0 | 98.3 |
| 9 | Bare land | 0 | 0.1 | 0 | 0 | 1.3 | 0 | 0.4 | 2 | 0.3 | 70.1 | 0 | 0 | 93.8 |
| 11 | Wetland | 0 | 0 | 0 | 0 | 0 | 0 | 0 | 0 | 0 | 0 | 76.7 | 0 | 100 |
| 12 | Water | 0 | 0 | 0 | 0 | 0 | 0 | 0 | 0.2 | 0 | 0 | 4.8 | 99.1 | 97.8 |
| Total | 100 | 100 | 100 | 100 | 100 | 100 | 100 | 100 | 100 | 100 | 100 | 100 | ||
| PA (%) | 72.2 | 81.5 | 77 | 97.3 | 90.3 | 82.6 | 92.8 | 94.1 | 91.4 | 70.1 | 76.7 | 99.1 | ||
© 2019 by the authors. Licensee MDPI, Basel, Switzerland. This article is an open access article distributed under the terms and conditions of the Creative Commons Attribution (CC BY) license (http://creativecommons.org/licenses/by/4.0/).
Share and Cite
Mugiraneza, T.; Nascetti, A.; Ban, Y. WorldView-2 Data for Hierarchical Object-Based Urban Land Cover Classification in Kigali: Integrating Rule-Based Approach with Urban Density and Greenness Indices. Remote Sens. 2019, 11, 2128. https://doi.org/10.3390/rs11182128
Mugiraneza T, Nascetti A, Ban Y. WorldView-2 Data for Hierarchical Object-Based Urban Land Cover Classification in Kigali: Integrating Rule-Based Approach with Urban Density and Greenness Indices. Remote Sensing. 2019; 11(18):2128. https://doi.org/10.3390/rs11182128
Chicago/Turabian StyleMugiraneza, Theodomir, Andrea Nascetti, and Yifang Ban. 2019. "WorldView-2 Data for Hierarchical Object-Based Urban Land Cover Classification in Kigali: Integrating Rule-Based Approach with Urban Density and Greenness Indices" Remote Sensing 11, no. 18: 2128. https://doi.org/10.3390/rs11182128
APA StyleMugiraneza, T., Nascetti, A., & Ban, Y. (2019). WorldView-2 Data for Hierarchical Object-Based Urban Land Cover Classification in Kigali: Integrating Rule-Based Approach with Urban Density and Greenness Indices. Remote Sensing, 11(18), 2128. https://doi.org/10.3390/rs11182128