Soil Organic Carbon Mapping Using LUCAS Topsoil Database and Sentinel-2 Data: An Approach to Reduce Soil Moisture and Crop Residue Effects


Abstract
1. Introduction
2. Materials and Methods
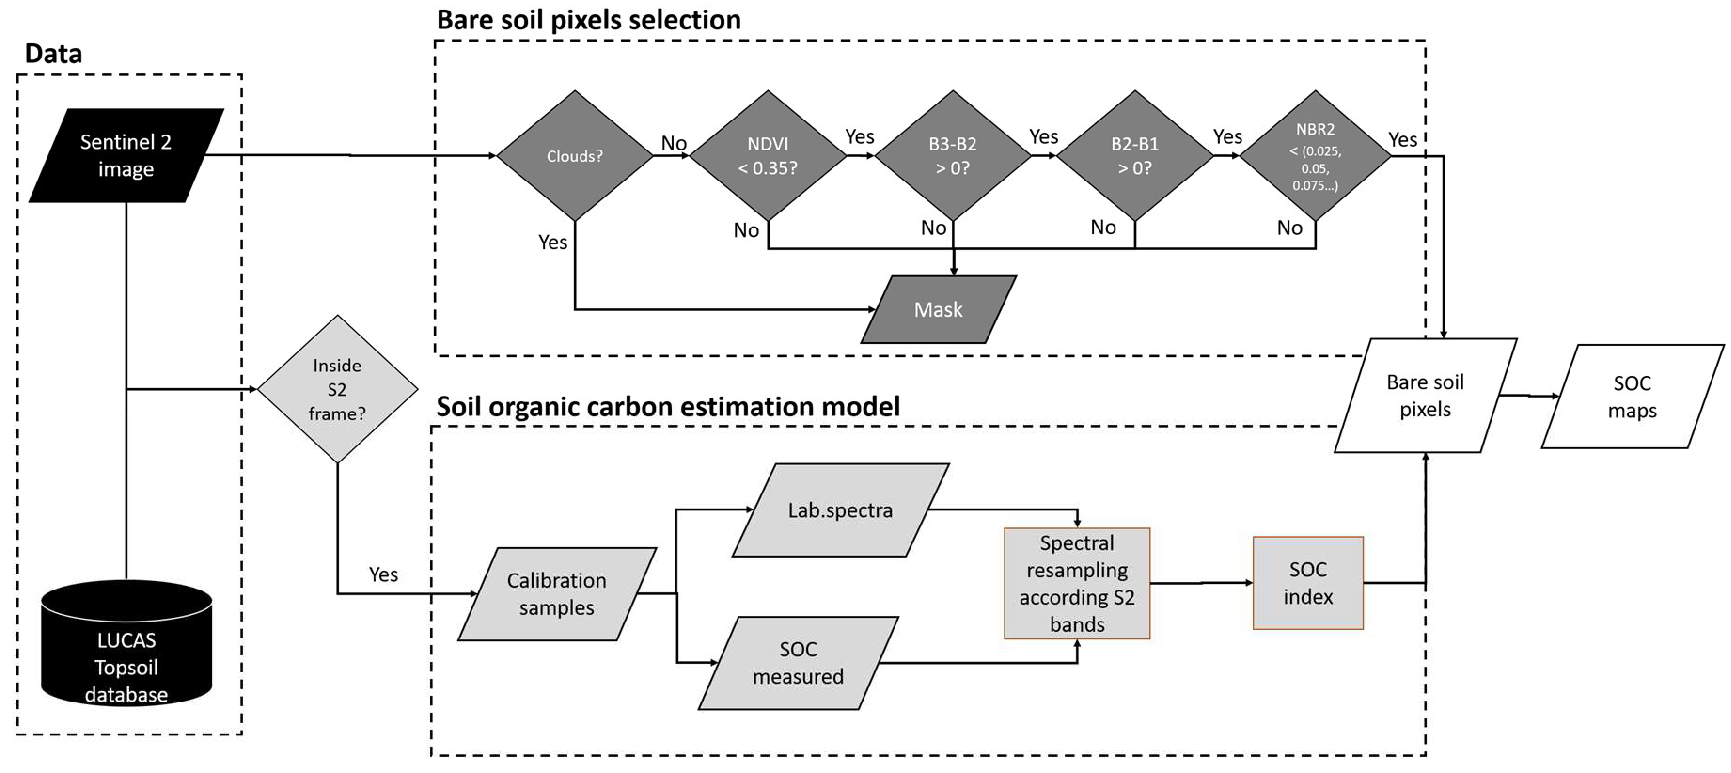
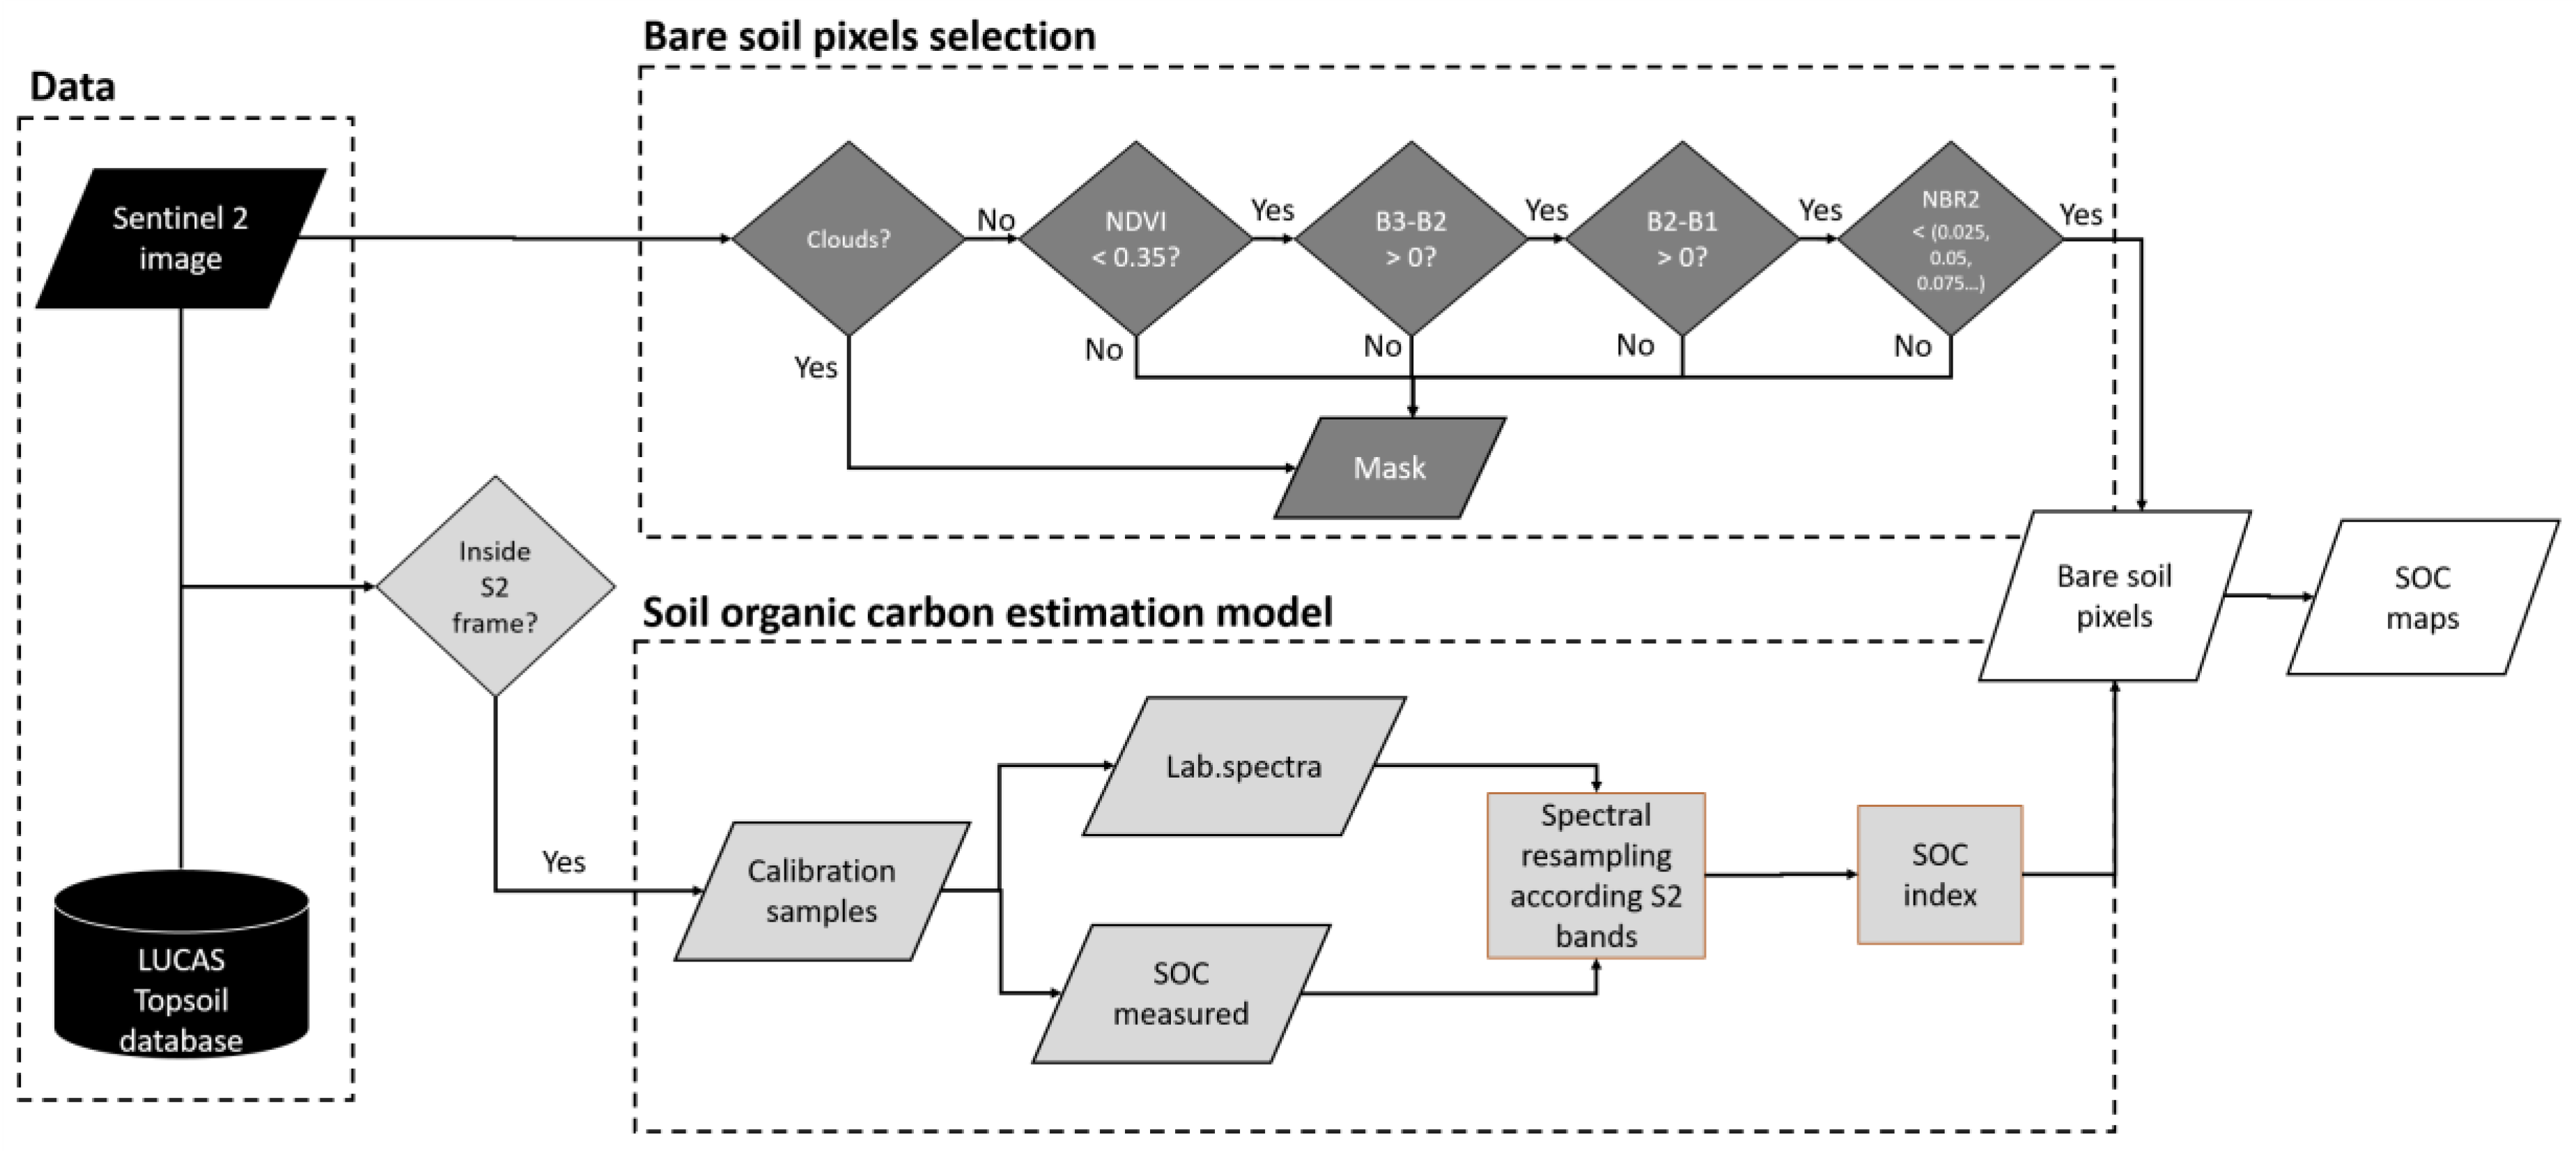
2.1. Study Area and Sentinel-2 Data
2.2. SOC Calibration Models, Validation, and Mapping
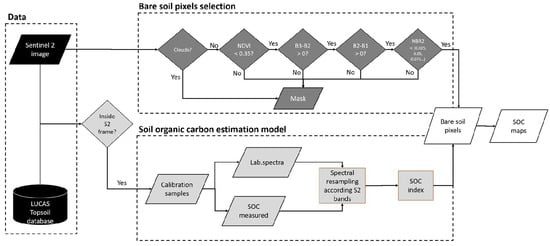
- Zero clouds probability. For this purpose, the clouds probability layer provided by European Space Agency (ESA) was used to exclude pixels with a cloud probability higher than zero.
- NDVI (normalized difference between B8 and B4) lower than 0.35 to exclude green vegetation, growing crops, and mixed pixels.
- Differences between B3 and B2 (Green Vegetation Index 1 = GVI1) and between B4 and B3 (Green Vegetation Index 2 = GVI2) both higher than 0. The application of these filters improves the soil mask [14].
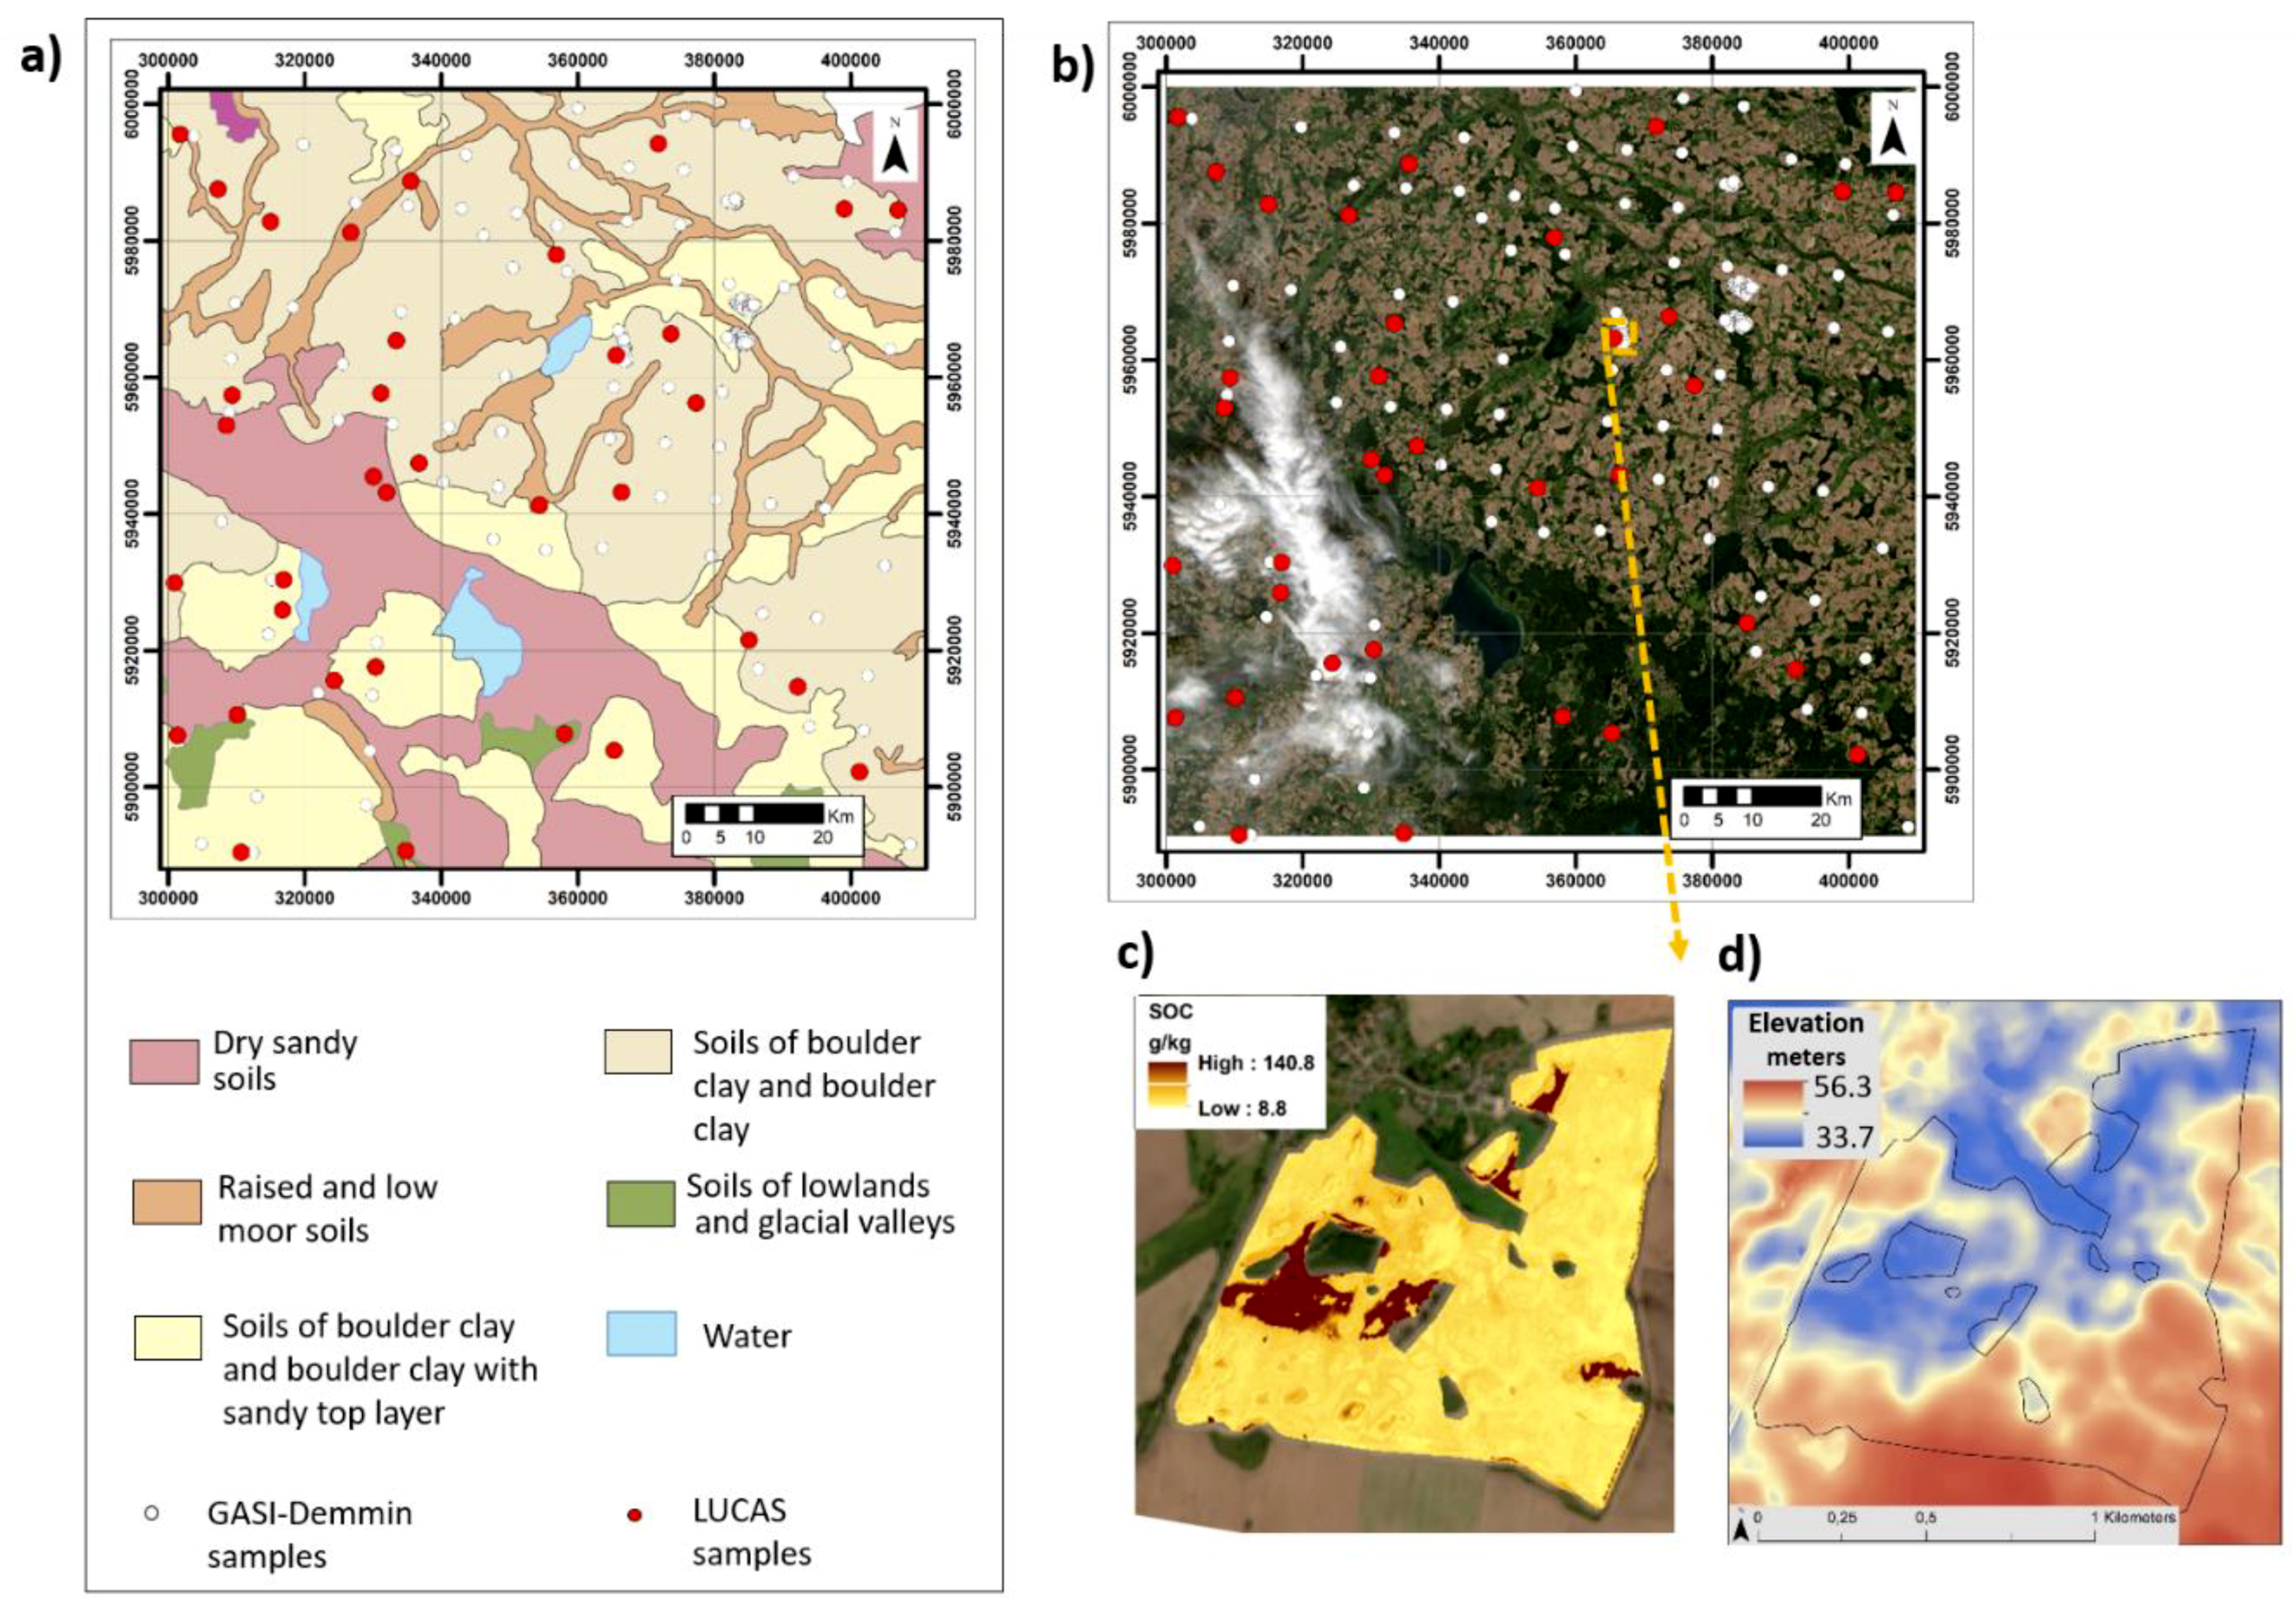
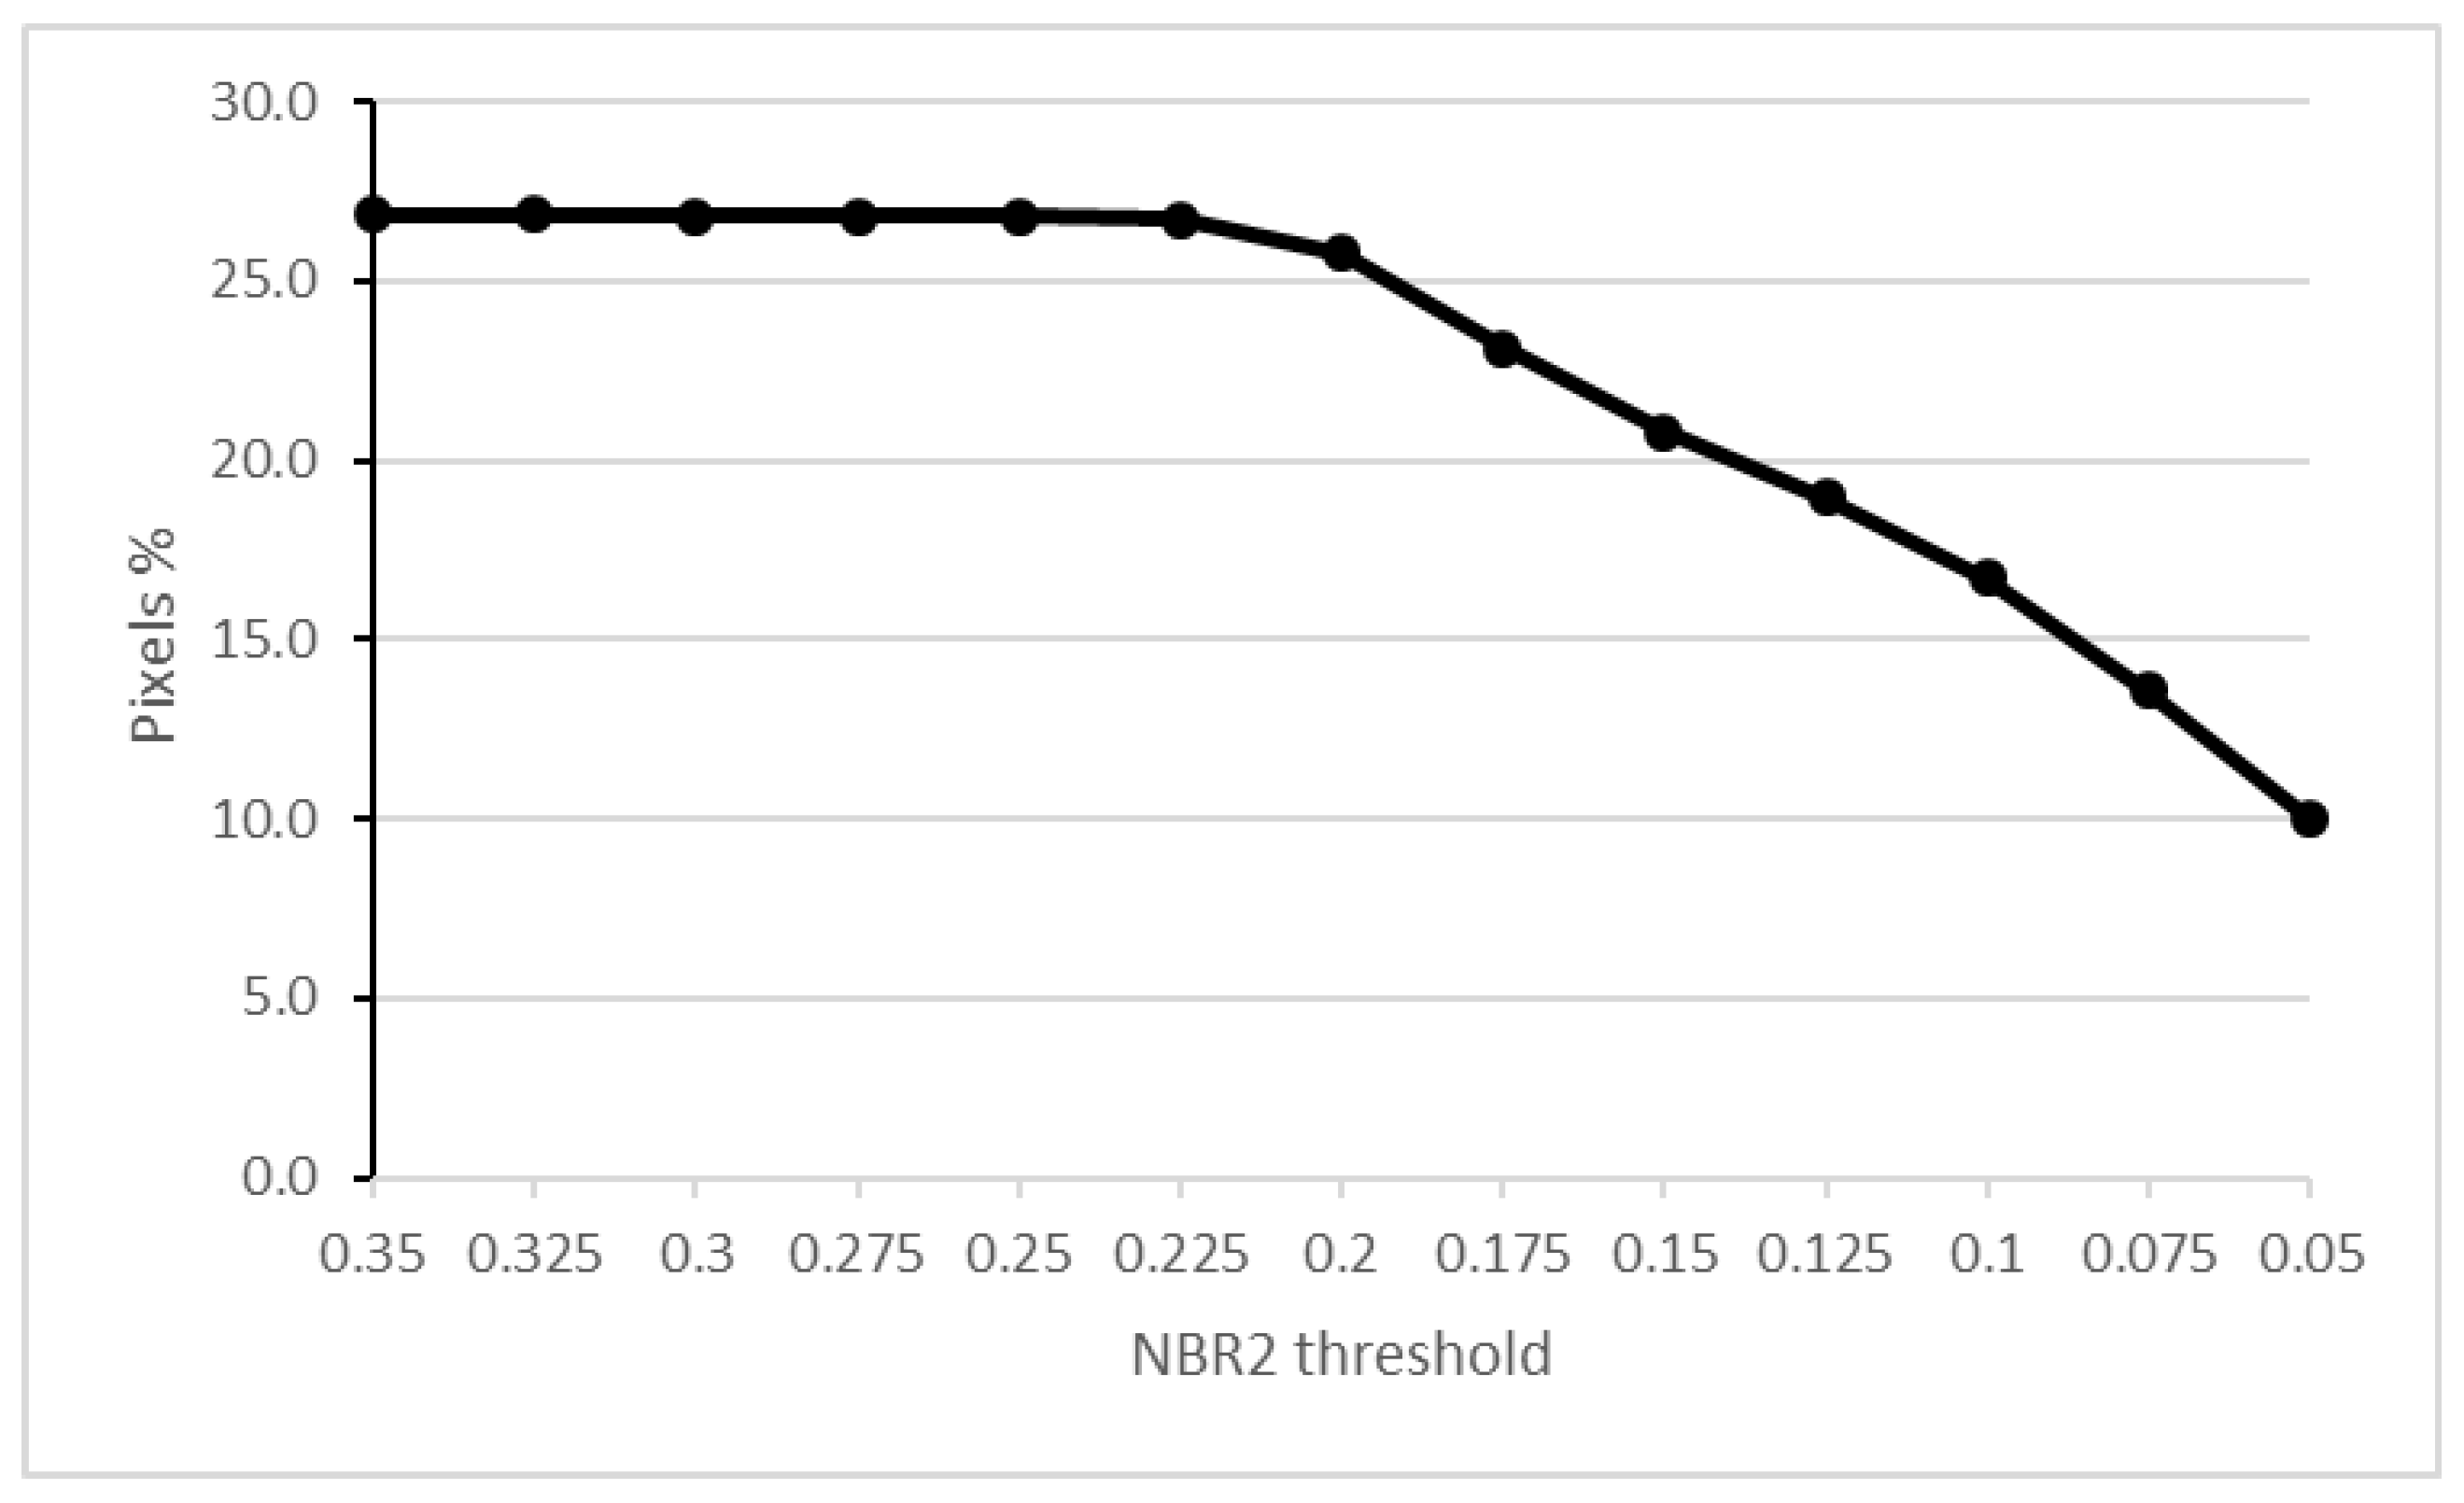
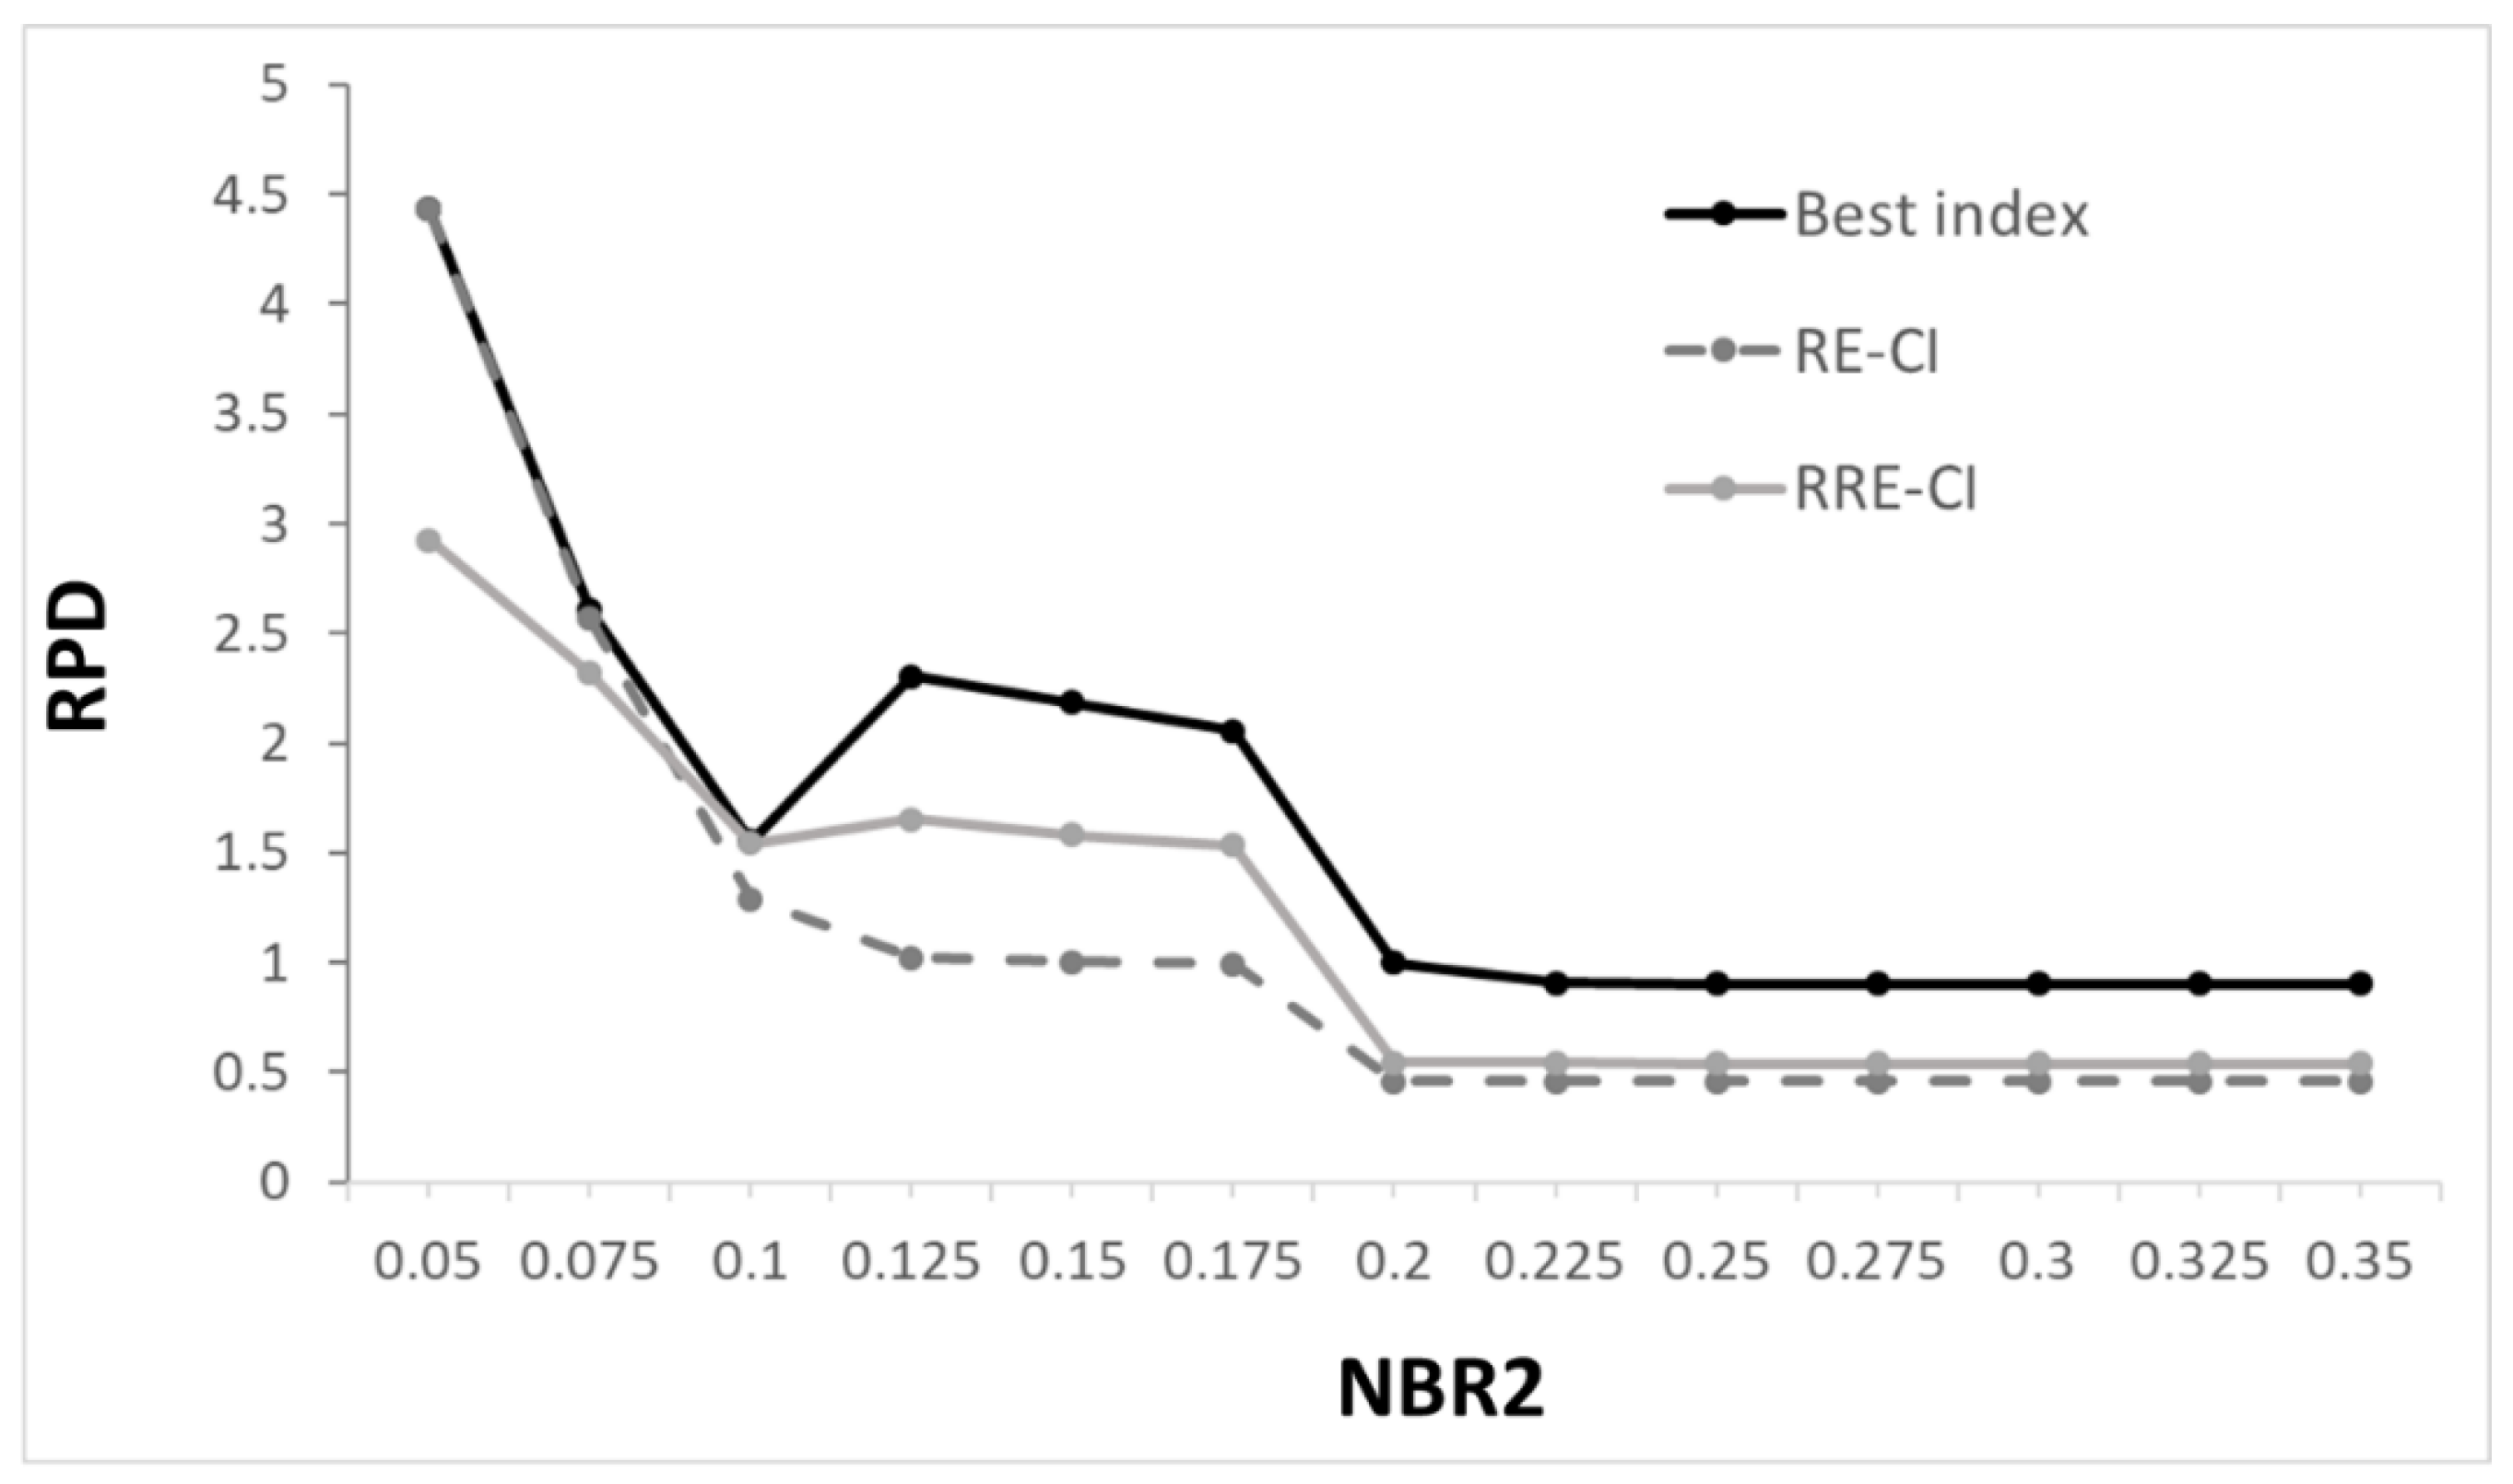
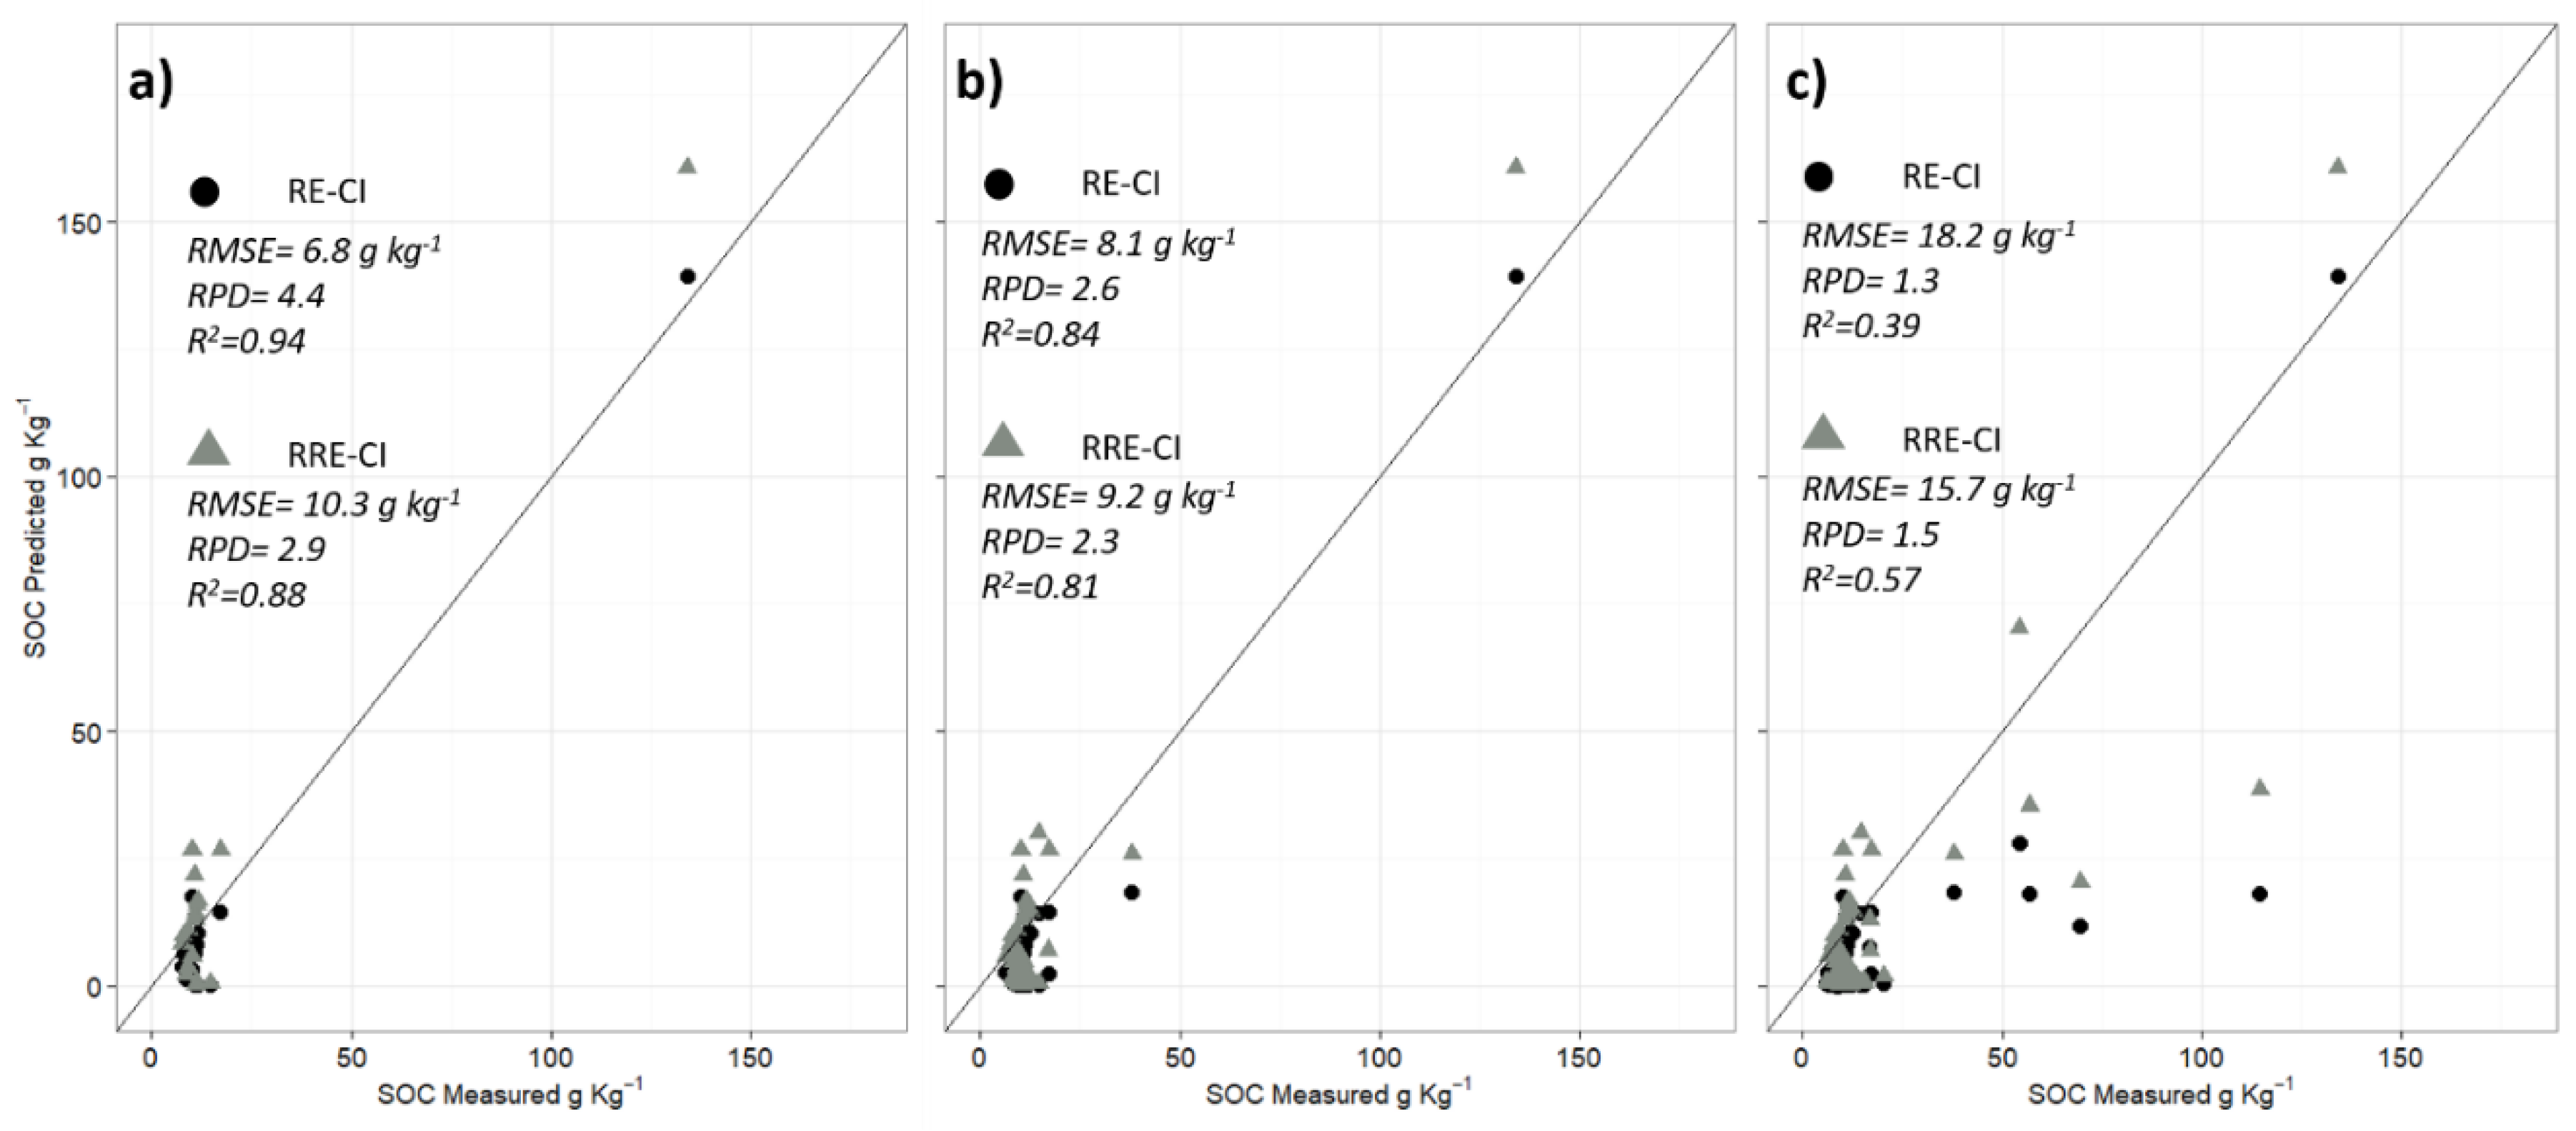
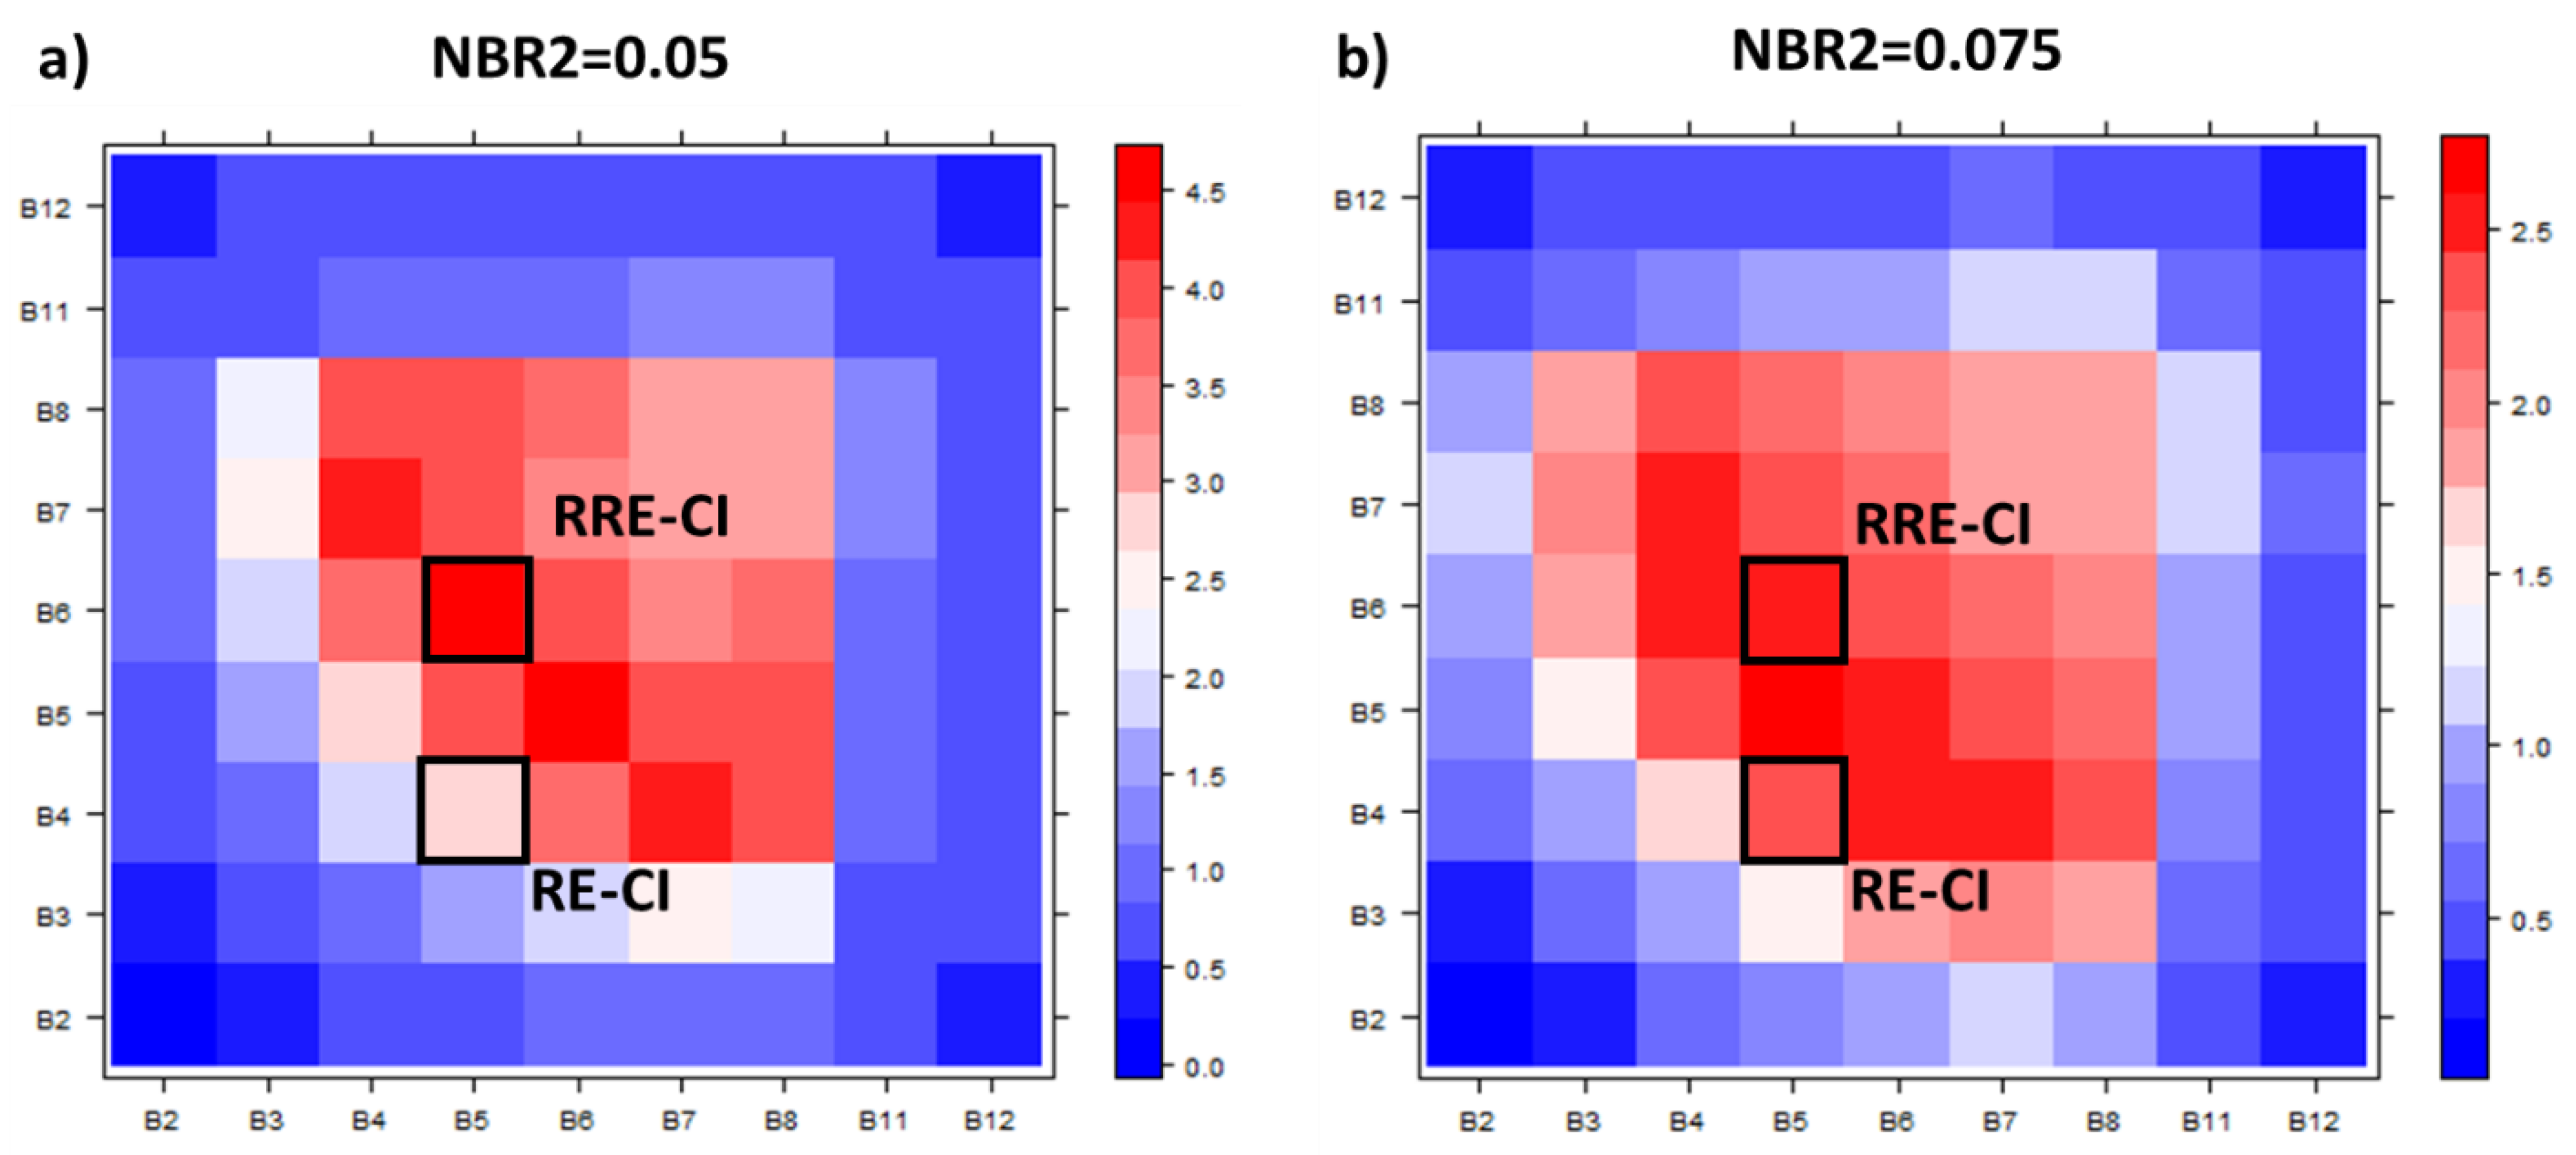
- Lastly, different Normalized Burn Ratio 2 (NBR2) index thresholds (from 0.025 to 0.35 in steps of 0.025) were tested in order to exclude spectra affected by high soil moisture content or crop residues. This index was computed as the normalized difference between B11 and B12 (Equation (2)). These two bands are strongly correlated with soil moisture [22] and their differences allow discriminating between dry soil spectra, moist soil spectra, and spectra influenced by straw, other residues, or dry vegetation [14]. The difference between the reflectance around 1600 nm and that around 2100 nm is close to 0 for the soil, while the presence of straw increases this difference (Figure 2).
3. Results
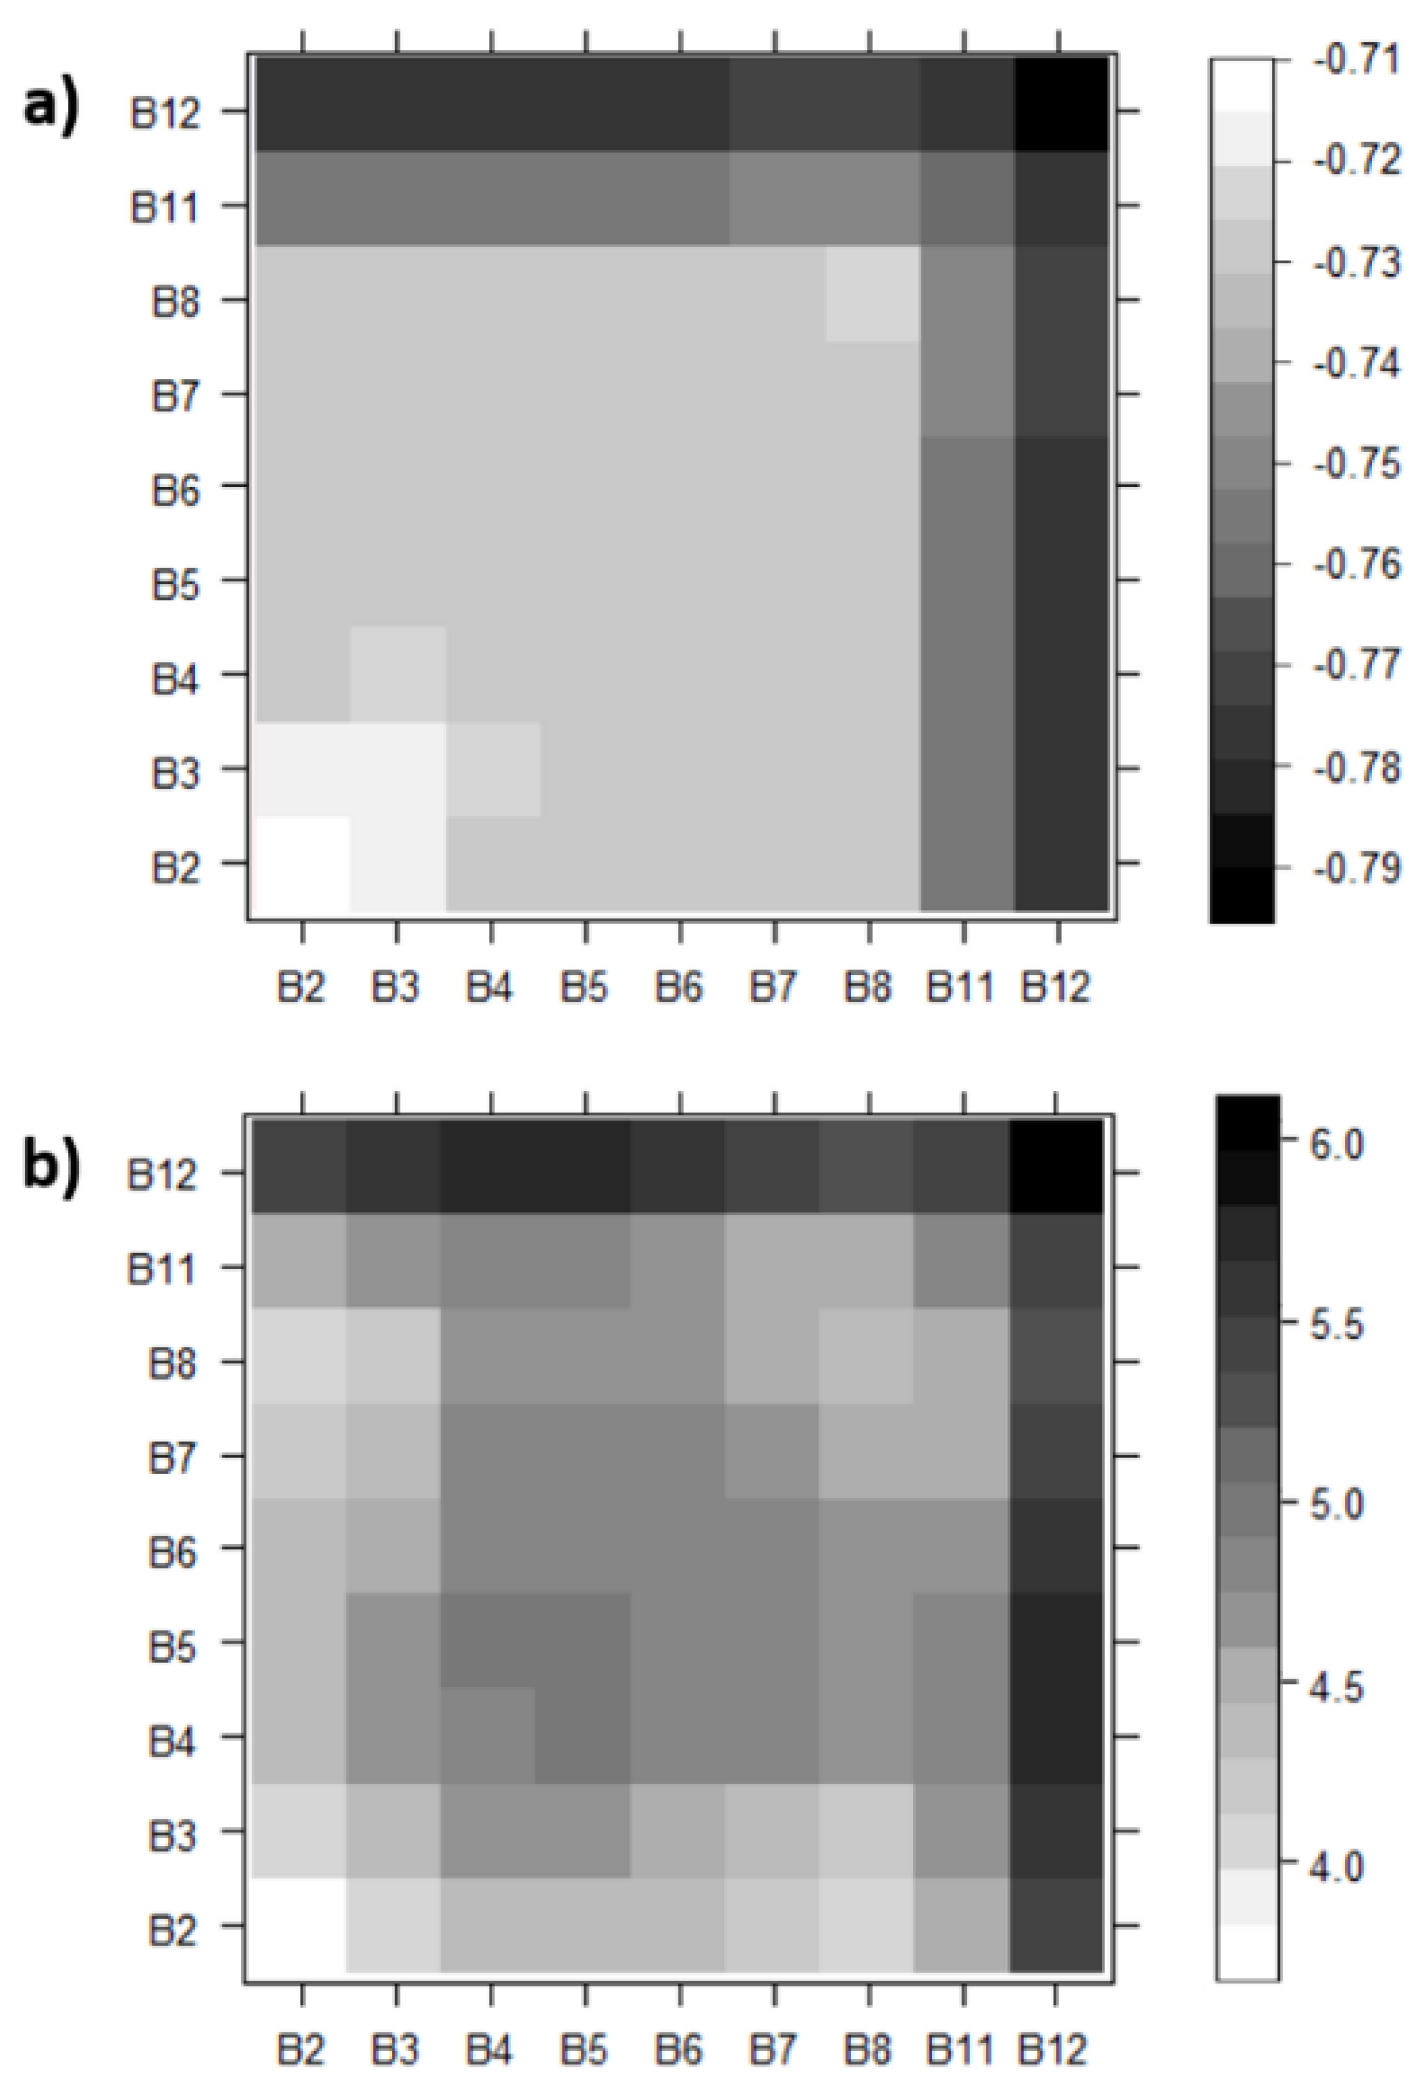
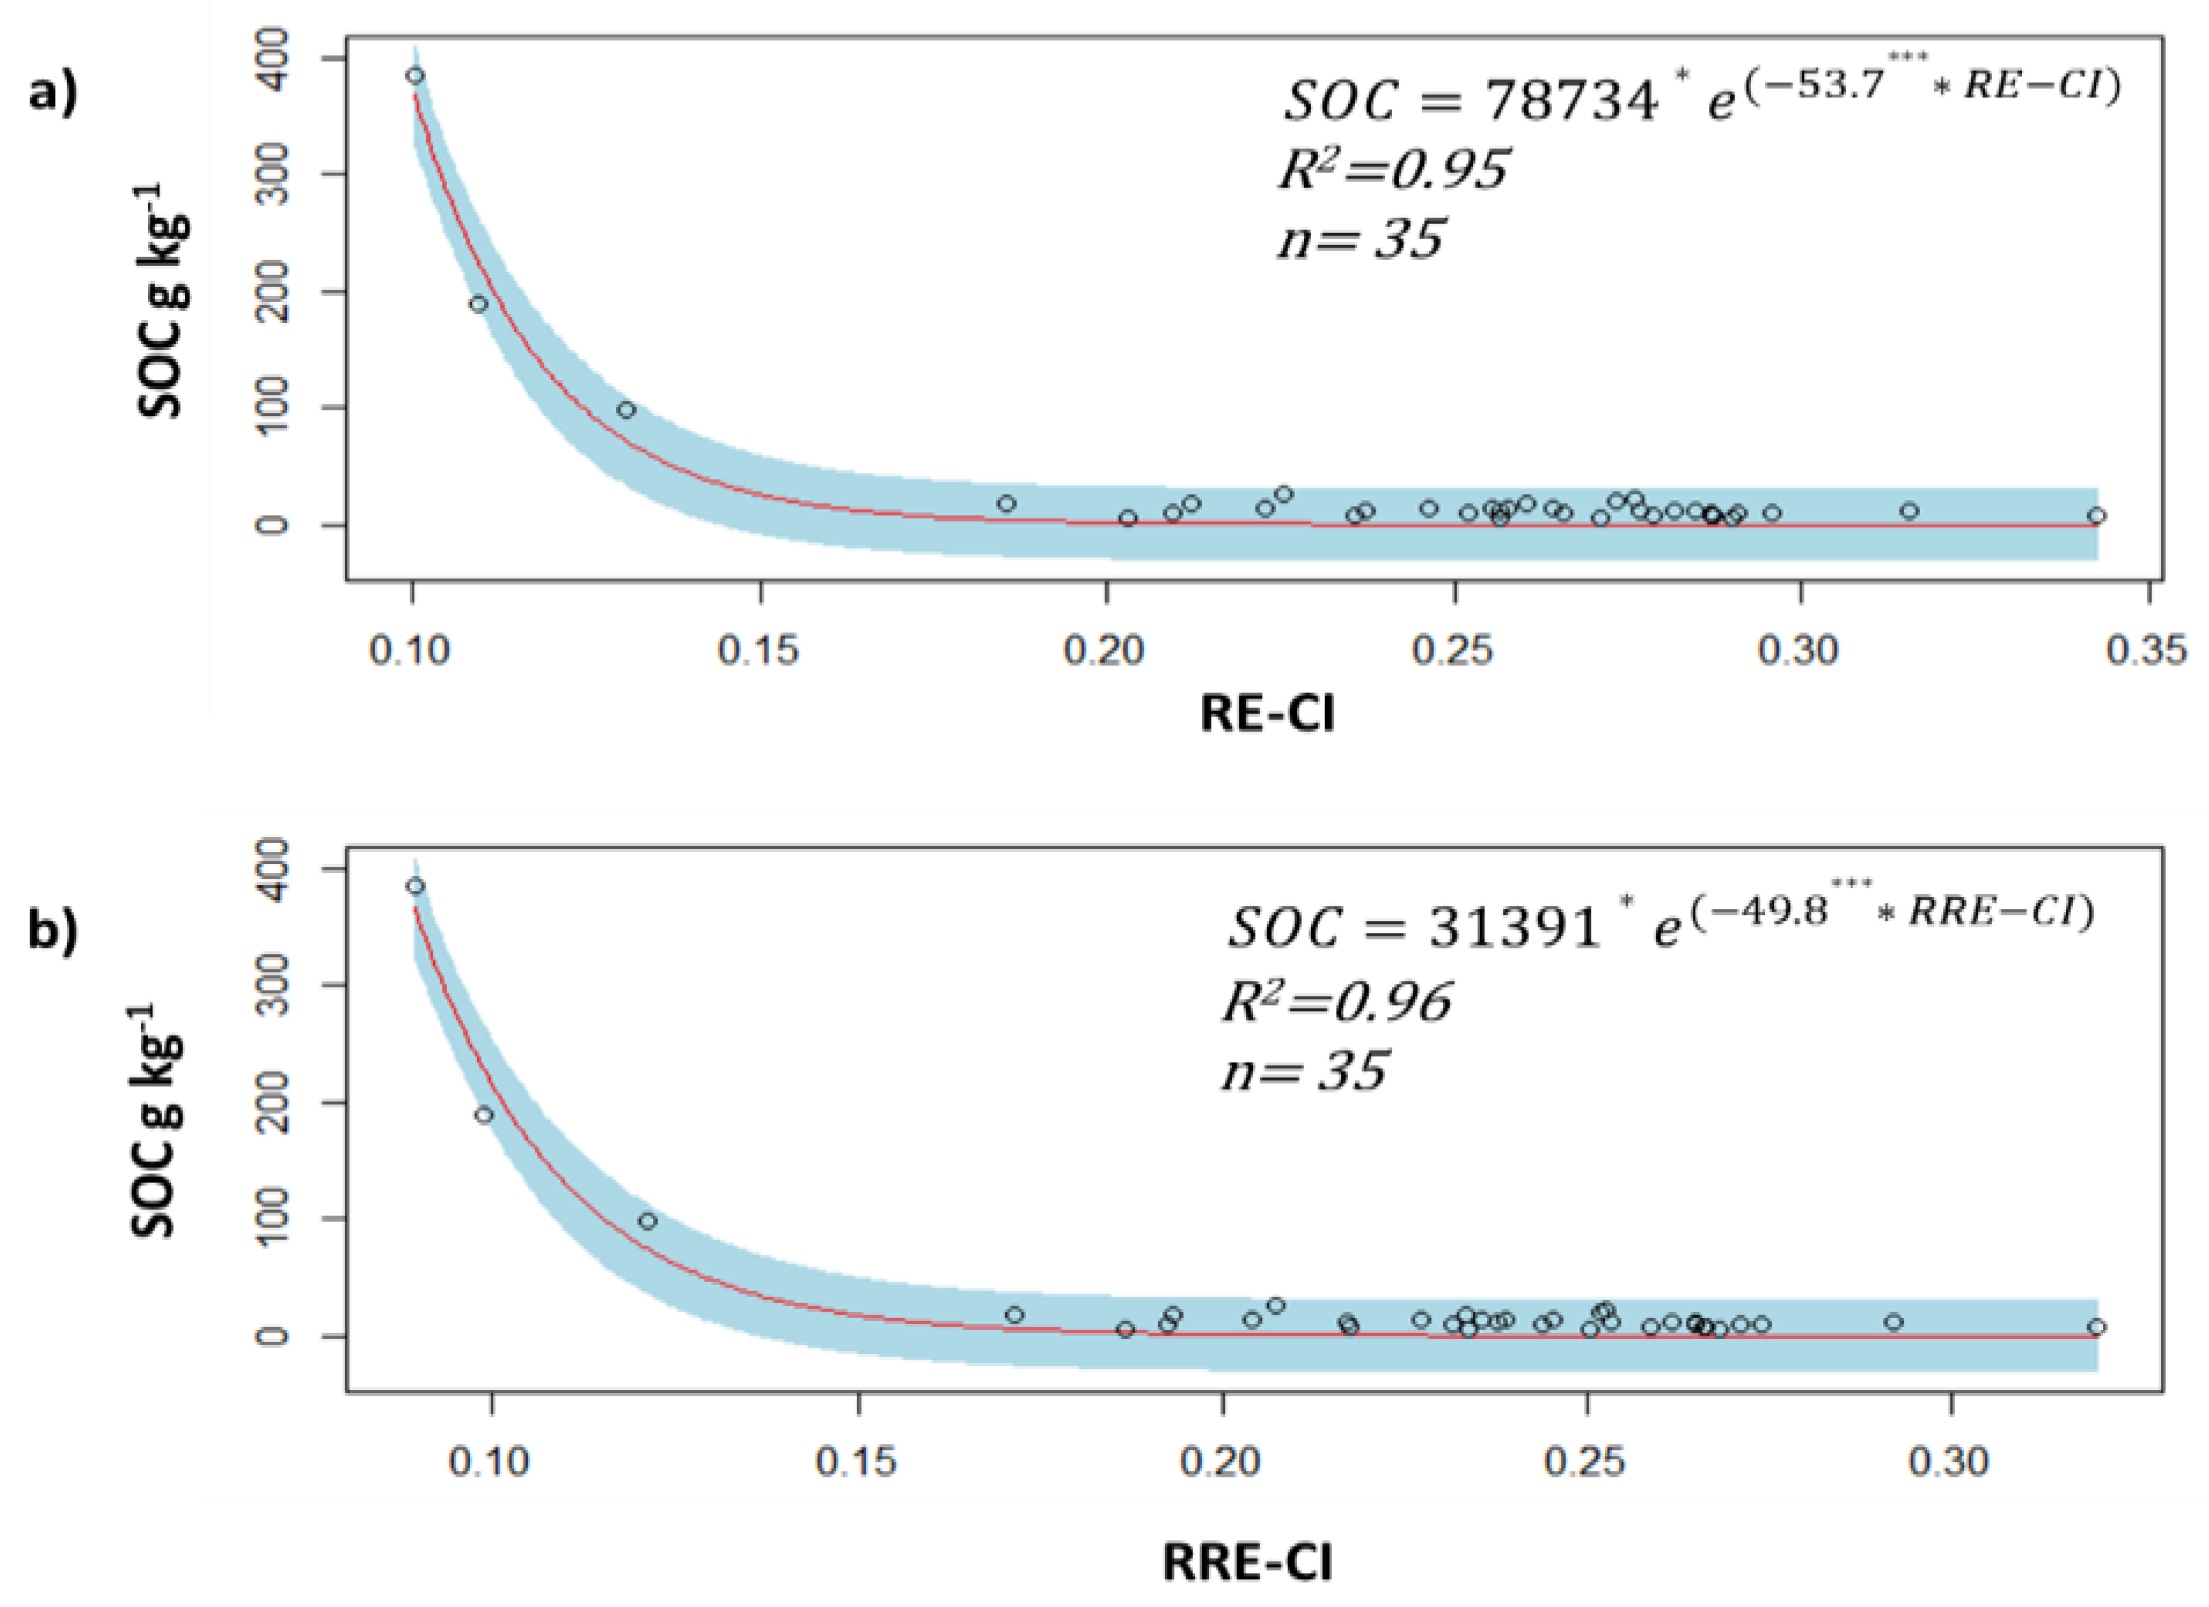
3.1. SOC Indices
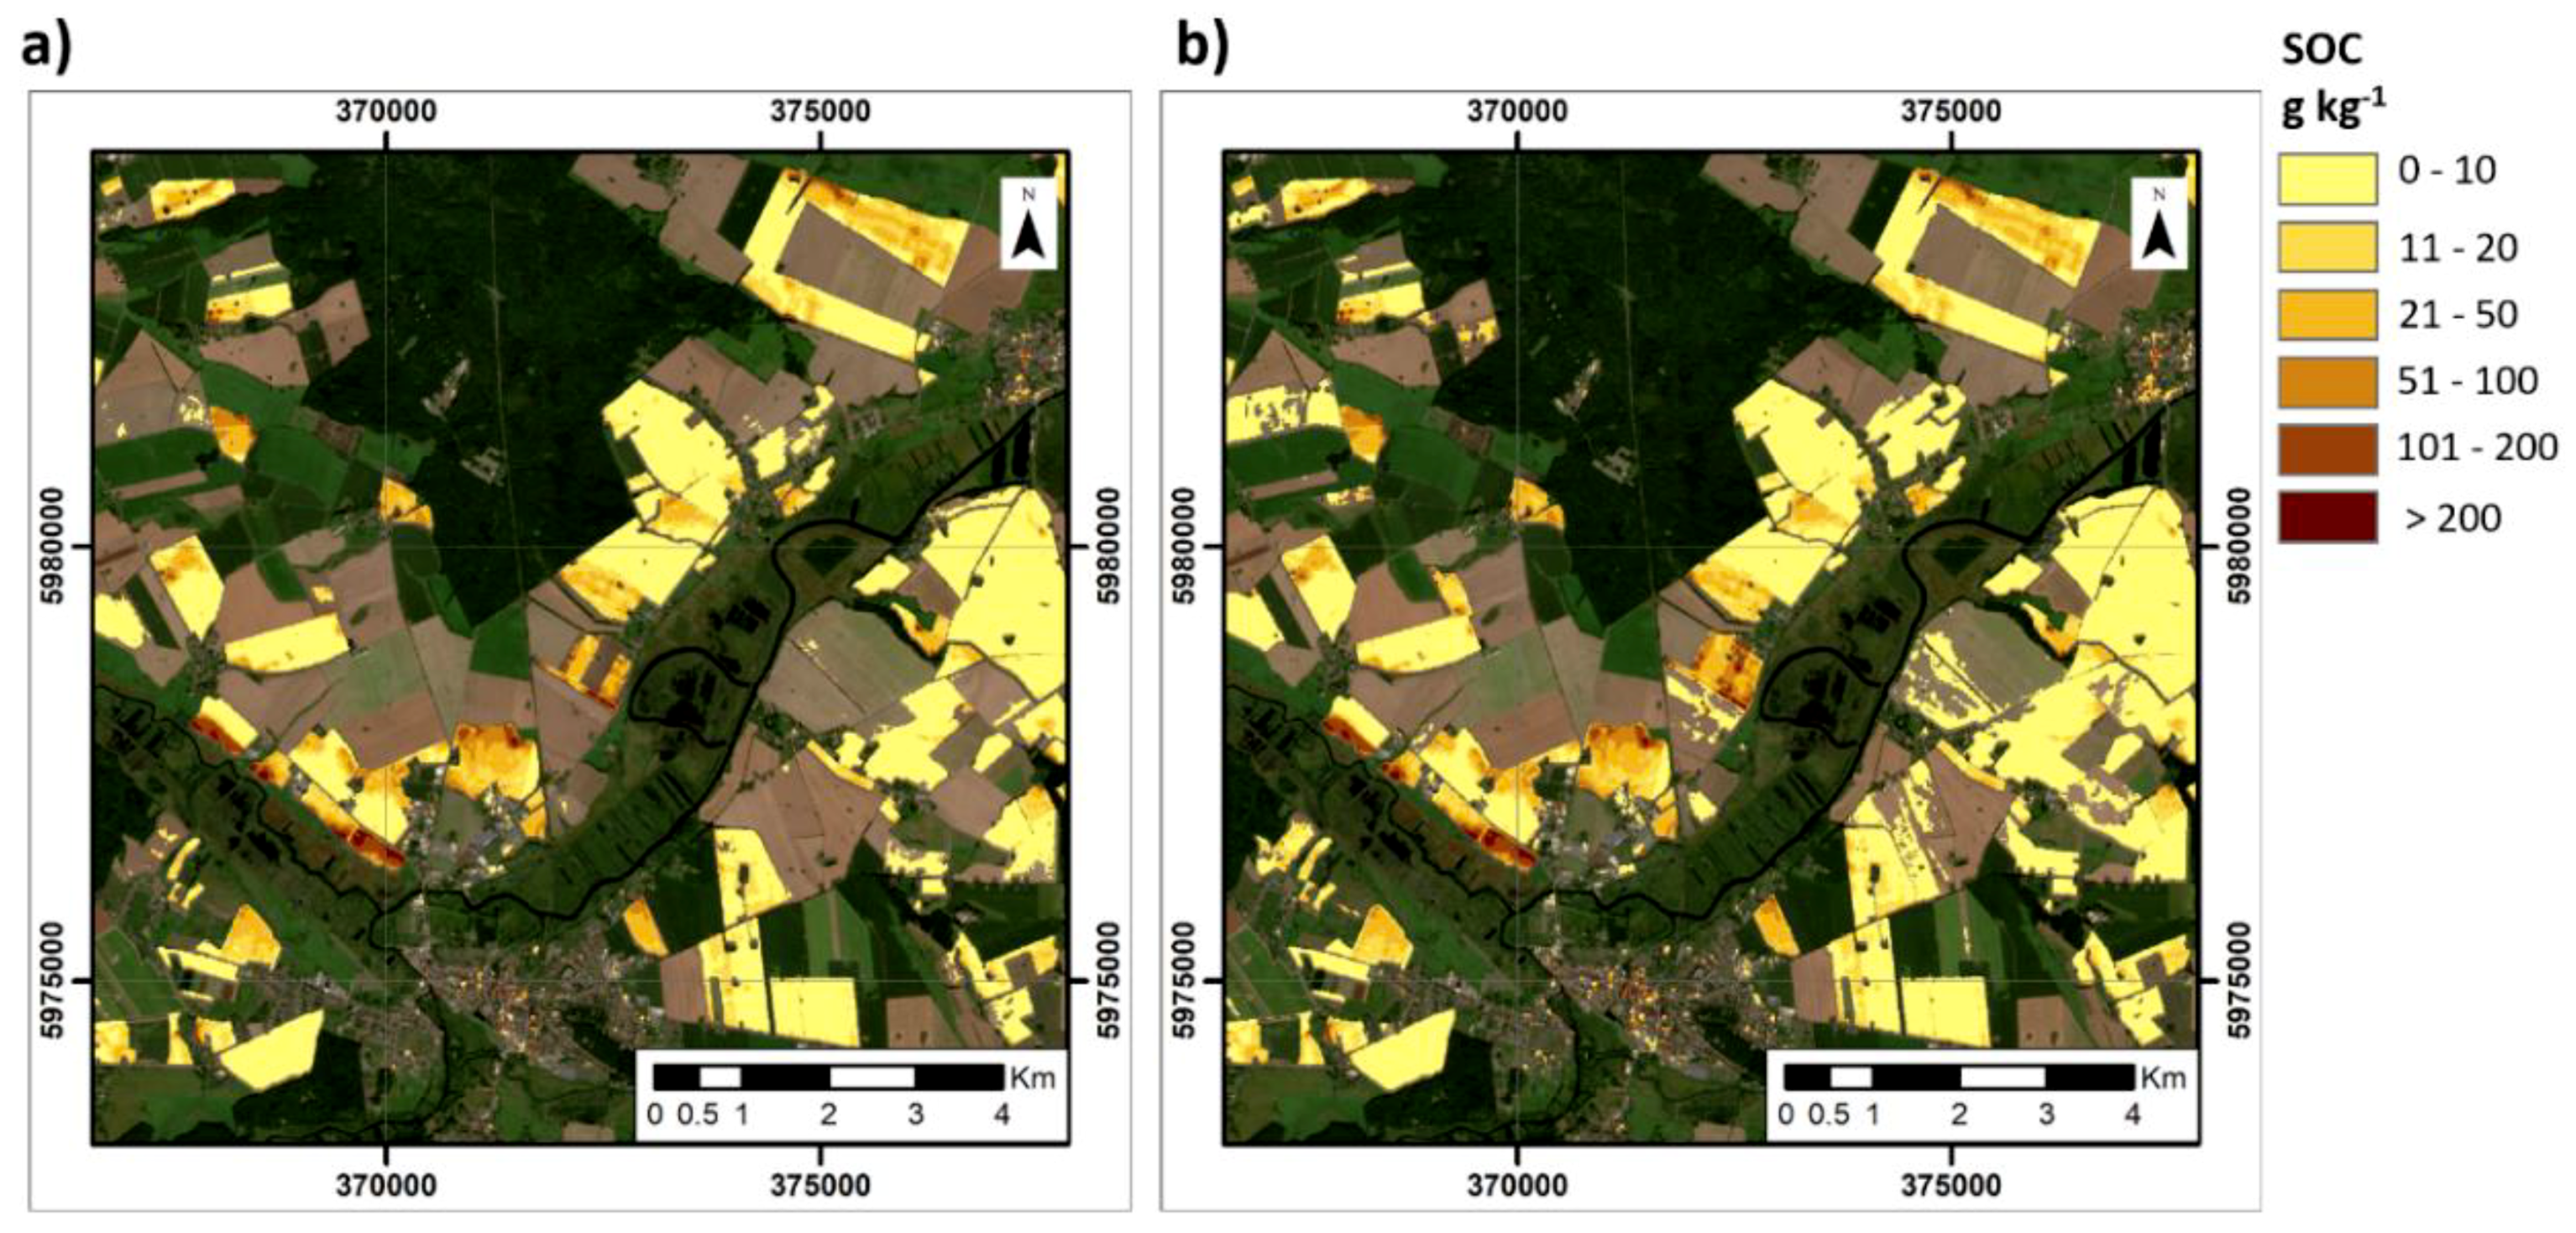
3.2. SOC Maps and Validation
4. Discussion
5. Conclusions
Author Contributions
Funding
Acknowledgments
Conflicts of Interest
References
- United Nations Conventions to Combat Desertification (UNCCD). Sustainable Indicator Goal 15.3.1. Available online: https://knowledge.unccd.int/topics/sustainable-development-goals-sdgs/sdg-indicator-1531 (accessed on 2 September 2019).
- FAO 2017. Voluntary Guidelines for Sustainable Soil Management Food and Agriculture Organization of the United Nations Rome, Italy. Available online: http://www.fao.org/3/a-bl813e.pdf (accessed on 30 July 2019).
- Panos, P.; Jones, A.; Aguglia, L.; Legowski, M.; Van Doorslaer, B.; Masson, J.; Laureau, D. CAP Specific Objectives Explained—Brief No 5: Efficient Soil Management. Available online: https://ec.europa.eu/info/sites/info/files/food-farming-fisheries/key_policies/documents/cap-specific-objectives-brief-5-soil_en.pdf (accessed on 3 September 2019).
- Ben-Dor, E.; Inbar, Y.; Chen, Y. The reflectance spectra of organic matter in the visible near-infrared and short wave infrared region (400–2500 nm) during a controlled decomposition process. Remote Sens. Environ. 1997, 61, 1–15. [Google Scholar] [CrossRef]
- Gholizadeh, A.; Žižala, D.; Saberioon, M.; Borůvka, L. Soil organic carbon and texture retrieving and mapping using proximal, airborne and Sentinel-2 spectral imaging. Remote Sens. Environ. 2018, 218, 89–103. [Google Scholar] [CrossRef]
- Castaldi, F.; Hueni, A.; Chabrillat, S.; Ward, K.; Buttafuoco, G.; Bomans, B.; Vreys, K.; Brell, M.; van Wesemael, B. Evaluating the capability of the Sentinel-2 data for soil organic carbon prediction in croplands. ISPRS J. Photogramm. Remote Sens. 2019, 147, 267–282. [Google Scholar] [CrossRef]
- Vaudour, E.; Gomez, C.; Fouad, Y.; Lagacherie, P. Sentinel-2 image capacities to predict common topsoil properties of temperate and Mediterranean agroecosystems. Remote Sens. Environ. 2019, 223, 21–33. [Google Scholar] [CrossRef]
- Taghadosi, M.M.; Hasanlou, M.; Eftekhari, K. Retrieval of soil salinity from Sentinel-2 multispectral imagery. Eur. J. Remote Sens. 2019, 52, 138–154. [Google Scholar] [CrossRef]
- Castaldi, F.; Chabrillat, S.; van Wesemael, B. Sampling Strategies for Soil Property Mapping Using Multispectral Sentinel-2 and Hyperspectral EnMAP Satellite Data. Remote Sens. 2019, 11, 309. [Google Scholar] [CrossRef]
- Castaldi, F.; Chabrillat, S.; Chartin, C.; Genot, V.; Jones, A.R.; van Wesemael, B. Estimation of soil organic carbon in arable soil in Belgium and Luxembourg with the LUCAS topsoil database. Eur. J. Soil Sci. 2018, 69, 592–603. [Google Scholar] [CrossRef]
- Castaldi, F.; Chabrillat, S.; Jones, A.; Vreys, K.; Bomans, B.; van Wesemael, B. Soil organic carbon estimation in croplands by hyperspectral remote APEX data using the LUCAS topsoil database. Remote Sens. 2018, 10, 153. [Google Scholar] [CrossRef]
- Rogge, D.; Bauer, A.; Zeidler, J.; Mueller, A.; Esch, T.; Heiden, U. Building an exposed soil composite processor (SCMaP) for mapping spatial and temporal characteristics of soils with Landsat imagery (1984–2014). Remote Sens. Environ. 2018, 205, 1–17. [Google Scholar] [CrossRef]
- Haubrock, S.-N.; Chabrillat, S.; Lemmnitz, C.; Kaufmann, H. Surface soil moisture quantification models from reflectance data under field conditions. Int. J. Remote Sens. 2008, 29, 3–29. [Google Scholar] [CrossRef]
- Demattê, J.A.M.; Fongaro, C.T.; Rizzo, R.; Safanelli, J.L. Geospatial Soil Sensing System (GEOS3): A powerful data mining procedure to retrieve soil spectral reflectance from satellite images. Remote Sens. Environ. 2018, 212, 161–175. [Google Scholar] [CrossRef]
- Zacharias, S.; Bogena, H.; Samaniego, L.; Mauder, M.; Fuß, R.; Pütz, T.; Frenzel, M.; Schwank, M.; Baessler, C.; Butterbach-Bahl, K.; et al. A Network of Terrestrial Environmental Observatories in Germany. Vadose Zone J. 2011, 10, 955. [Google Scholar] [CrossRef]
- Blasch, G.; Spengler, D.; Itzerott, S.; Wessolek, G. Organic Matter Modeling at the Landscape Scale Based on Multitemporal Soil Pattern Analysis Using RapidEye Data. Remote Sens. 2015, 7, 11125–11150. [Google Scholar] [CrossRef]
- NutzungsdifferenzierteBodenübersichtskarte der Bundesrepublik Deutschland 1:1.000.000 (BÜK 1000 N2.3)—Auszugskarten Acker. Available online: https://www.bgr.bund.de/DE/Themen/Boden/Informationsgrundlagen/Bodenkundliche_Karten_Datenbanken/BUEK1000/buek1000_node.html (accessed on 6 June 2019).
- Heinrich, I.; Balanzategui, D.; Bens, O.; Blasch, G.; Blume, T.; Böttcher, F.; Borg, E.; Brademann, B.; Brauer, A.; Conrad, C.; et al. Interdisciplinary Geo-ecological Research across Time Scales in the Northeast German Lowland Observatory (TERENO-NE). Vadose Zone J. 2018, 17. [Google Scholar] [CrossRef]
- Mueller-Wilm, U.; Devignot, O.; Pessiot, L. Sen2Cor Configuration and User Manual. S2-PDGS-MPC-L2A-SUM-V2.5.5. 2018. Available online: http://step.esa.int/thirdparties/sen2cor/2.5.5/docs/S2-PDGS-MPC-L2A-SUM-V2.5.5_V2.pdf (accessed on 1 July 2019).
- Tóth, G.; Jones, A.; Montanarella, L. The LUCAS topsoil database and derived information on the regional variability of cropland topsoil properties in the European Union. Environ. Monit. Assess. 2013, 185, 7409–7425. [Google Scholar] [CrossRef] [PubMed]
- Vos, C.; Don, A.; Hobley, E.U.; Prietz, R.; Heidkamp, A.; Freibauer, A. Factors controlling the variation in organic carbon stocks in agricultural soils of Germany. Eur. J. Soil Sci. 2019, 70, 550–564. [Google Scholar] [CrossRef]
- Musick, H.B.; Pelletier, R.E. Response to soil moisture of spectral indexes derived from bidirectional reflectance in thematic mapper wavebands. Remote Sens. Environ. 1988, 25, 167–184. [Google Scholar] [CrossRef]
- Nocita, M.; Stevens, A.; Noon, C.; van Wesemael, B. Prediction of soil organic carbon for different levels of soil moisture using Vis-NIR spectroscopy. Geoderma 2013, 199, 37–42. [Google Scholar] [CrossRef]
- Steinberg, A.; Chabrillat, S.; Stevens, A.; Segl, K.; Foerster, S. Prediction of Common Surface Soil Properties Based on Vis-NIR Airborne and Simulated EnMAP Imaging Spectroscopy Data: Prediction Accuracy and Influence of Spatial Resolution. Remote Sens. 2016, 8, 613. [Google Scholar] [CrossRef]
- Rossel, R.A.V.; Behrens, T. Using data mining to model and interpret soil diffuse reflectance spectra. Geoderma 2010, 158, 46–54. [Google Scholar] [CrossRef]
- Katuwal, S.; Knadel, M.; Norgaard, T.; Greve, M.H.; De Jonge, L.W. Visible-Near-Infrared Spectroscopy can predict Mass Transport of Dissolved Chemicals through Intact Soil. Sci. Rep. 2018, 8, 11188. [Google Scholar] [CrossRef] [PubMed]
- Senwo, Z.N.; Tabatabai, M.A. Amino acid composition of soil organic matter. Biol. Fertil. Soils 1998, 26, 235–242. [Google Scholar] [CrossRef]
- Kappler, C.; Kaiser, K.; Tanski, P.; Klos, F.; Fülling, A.; Mrotzek, A.; Sommer, M.; Bens, O. Stratigraphy and age of colluvial deposits indicating Late Holocene soil erosion in northeastern Germany. CATENA 2018, 170, 224–245. [Google Scholar] [CrossRef]
- Stevens, A.; Nocita, M.; Tóth, G.; Montanarella, L.; van Wesemael, B. Prediction of Soil Organic Carbon at the European Scale by Visible and Near InfraRed Reflectance Spectroscopy. PLoS ONE 2013, 8, e66409. [Google Scholar] [CrossRef] [PubMed]
- Chabrillat, S.; Ben-Dor, E.; Cierniewski, J.; Gomez, C.; Schmid, T.; van Wesemael, B. Imaging Spectroscopy for Soil Mapping and Monitoring. Surv. Geophys. 2019, 40, 361–399. [Google Scholar] [CrossRef]
- Gomez, C.; Lagacherie, P.; Coulouma, G. Regional predictions of eight common soil properties and their spatial structures from hyperspectral Vis–NIR data. Geoderma 2012, 189–190, 176–185. [Google Scholar] [CrossRef]
- Lobell, D.B.; Asner, G.P. Moisture Effects on Soil Reflectance. Soil Sci. Soc. Am. J. 2002, 66, 722. [Google Scholar] [CrossRef]
- Nouri, M.; Gomez, C.; Gorretta, N.; Roger, J.M. Clay content mapping from airborne hyperspectral Vis-NIR data by transferring a laboratory regression model. Geoderma 2017, 298, 54–66. [Google Scholar] [CrossRef]
- Castaldi, F.; Palombo, A.; Pascucci, S.; Pignatti, S.; Santini, F.; Casa, R. Reducing the influence of soil moisture on the estimation of clay from hyperspectral data: A case study using simulated PRISMA data. Remote Sens. 2015, 7, 15561–15582. [Google Scholar] [CrossRef]
- Fabre, S.; Briottet, X.; Lesaignoux, A. Estimation of Soil Moisture Content from the Spectral Reflectance of Bare Soils in the 0.4–2.5 µm Domain. Sensors 2015, 15, 3262–3281. [Google Scholar] [CrossRef]


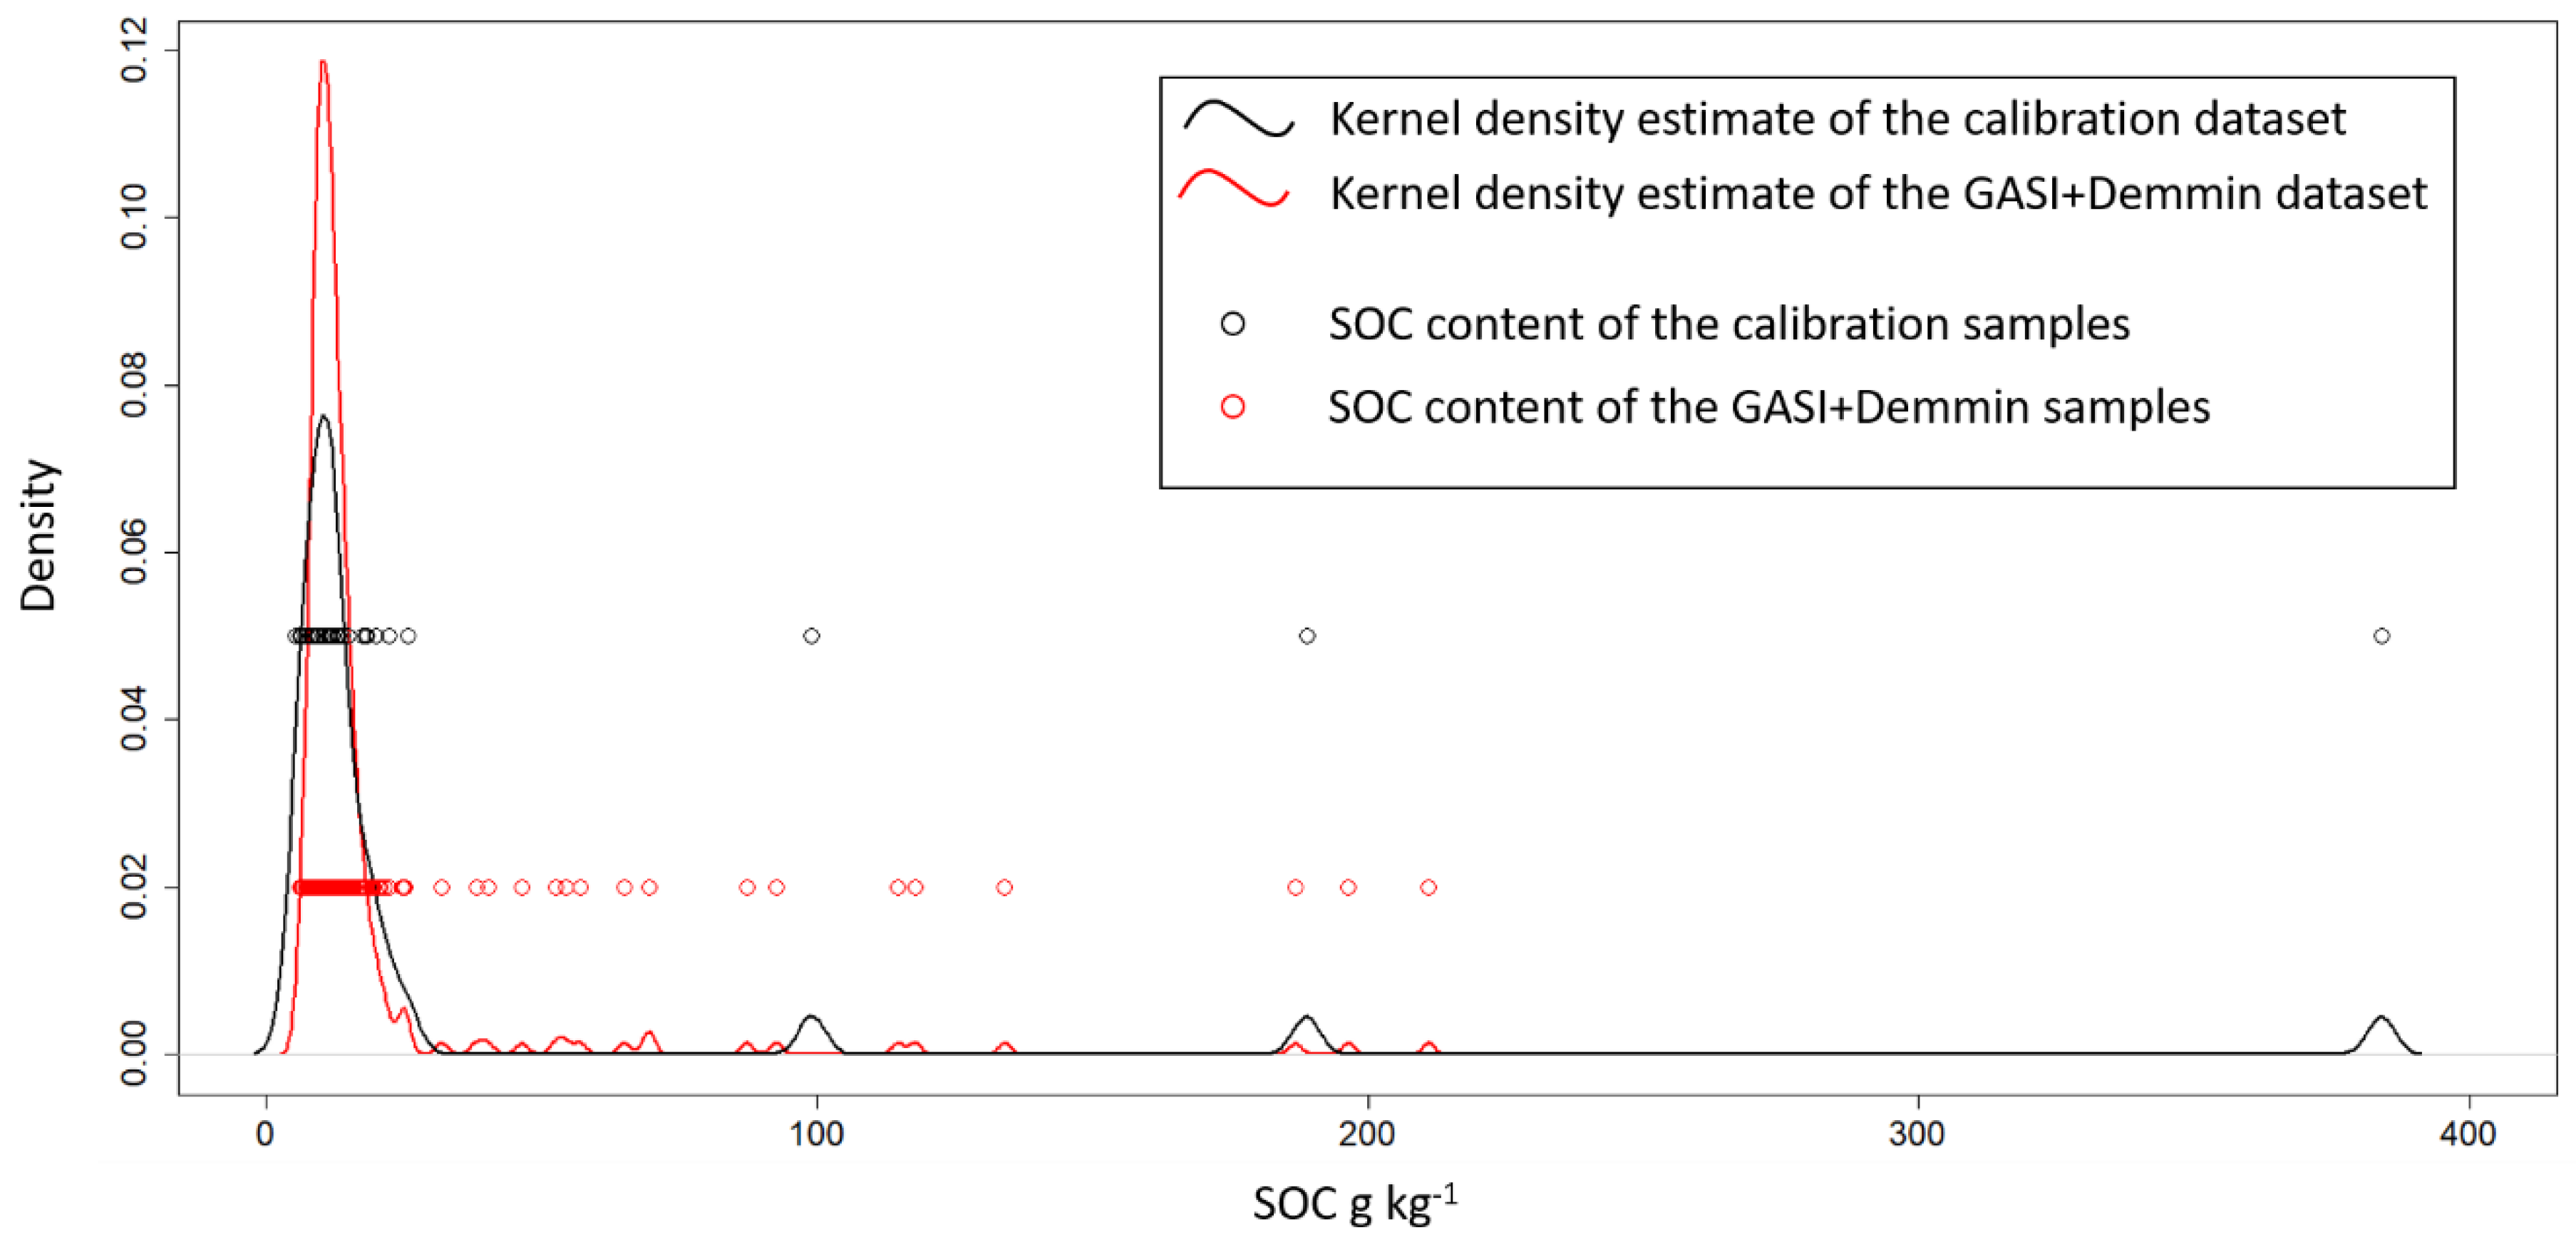
| SOC g kg−1 | |||||
|---|---|---|---|---|---|
| Dataset | N° | Mean | Min | Max | Std |
| Calibration | 35 | 30.0 | 5.2 | 384.0 | 70.0 |
| GASI+Demmin | 253 | 17.7 | 6.0 | 211.0 | 25.6 |
| SOC g kg−1 | Best Validation Results | RE-CI | RRE-CI | ||||||||
|---|---|---|---|---|---|---|---|---|---|---|---|
| NBR2 | N | Mean | Min | Max | Std | RMSE g kg−1 | RPD | RMSE g kg−1 | RPD | RMSE g kg−1 | RPD |
| 0.05 | 17 | 18.0 | 7.7 | 134.1 | 30.0 | 6.8 | 4.4 | 6.8 | 4.4 | 10.3 | 2.9 |
| 0.075 | 36 | 14.7 | 6.3 | 134.1 | 21.1 | 8.1 | 2.6 | 8.1 | 2.6 | 9.2 | 2.3 |
| 0.1 | 58 | 17.7 | 6.0 | 134.1 | 23.6 | 14.8 | 1.6 | 18.2 | 1.3 | 15.7 | 1.5 |
| 0.125 | 125 | 20.8 | 6.0 | 196.4 | 30.8 | 13.4 | 2.3 | 30.8 | 1.0 | 18.1 | 1.7 |
| 0.15 | 164 | 18.9 | 6.0 | 196.4 | 27.2 | 12.4 | 2.2 | 27.2 | 1.0 | 17.0 | 1.6 |
| 0.175 | 186 | 18.3 | 6.0 | 196.4 | 25.7 | 12.2 | 2.1 | 25.7 | 1.0 | 17.1 | 1.5 |
| 0.2 | 207 | 17.7 | 6.0 | 196.4 | 24.5 | 24.5 | 1.0 | 49.0 | 0.5 | 49.0 | 0.5 |
| 0.225 | 217 | 17.4 | 6.0 | 196.4 | 24.0 | 26.7 | 0.9 | 48.0 | 0.5 | 48.0 | 0.5 |
| 0.25 | 219 | 17.4 | 6.0 | 196.4 | 23.9 | 26.6 | 0.9 | 47.8 | 0.5 | 47.8 | 0.5 |
| 0.275 | 219 | 17.4 | 6.0 | 196.4 | 23.9 | 26.6 | 0.9 | 47.8 | 0.5 | 47.8 | 0.5 |
| 0.3 | 219 | 17.4 | 6.0 | 196.4 | 23.9 | 26.6 | 0.9 | 47.8 | 0.5 | 47.8 | 0.5 |
| 0.325 | 219 | 17.4 | 6.0 | 196.4 | 23.9 | 26.6 | 0.9 | 47.8 | 0.5 | 47.8 | 0.5 |
| 0.35 | 219 | 17.4 | 6.0 | 196.4 | 23.9 | 26.6 | 0.9 | 47.8 | 0.5 | 47.8 | 0.5 |
© 2019 by the authors. Licensee MDPI, Basel, Switzerland. This article is an open access article distributed under the terms and conditions of the Creative Commons Attribution (CC BY) license (http://creativecommons.org/licenses/by/4.0/).
Share and Cite
Castaldi, F.; Chabrillat, S.; Don, A.; van Wesemael, B. Soil Organic Carbon Mapping Using LUCAS Topsoil Database and Sentinel-2 Data: An Approach to Reduce Soil Moisture and Crop Residue Effects. Remote Sens. 2019, 11, 2121. https://doi.org/10.3390/rs11182121
Castaldi F, Chabrillat S, Don A, van Wesemael B. Soil Organic Carbon Mapping Using LUCAS Topsoil Database and Sentinel-2 Data: An Approach to Reduce Soil Moisture and Crop Residue Effects. Remote Sensing. 2019; 11(18):2121. https://doi.org/10.3390/rs11182121
Chicago/Turabian StyleCastaldi, Fabio, Sabine Chabrillat, Axel Don, and Bas van Wesemael. 2019. "Soil Organic Carbon Mapping Using LUCAS Topsoil Database and Sentinel-2 Data: An Approach to Reduce Soil Moisture and Crop Residue Effects" Remote Sensing 11, no. 18: 2121. https://doi.org/10.3390/rs11182121
APA StyleCastaldi, F., Chabrillat, S., Don, A., & van Wesemael, B. (2019). Soil Organic Carbon Mapping Using LUCAS Topsoil Database and Sentinel-2 Data: An Approach to Reduce Soil Moisture and Crop Residue Effects. Remote Sensing, 11(18), 2121. https://doi.org/10.3390/rs11182121