Article

Introducing a New Remote Sensing-Based Model for Forecasting Forest Fire Danger Conditions at a Four-Day Scale

1
Department of Geomatics Engineering, Schulich School of Engineering, University of Calgary, 2500 University Dr. NW, Calgary, AB T2N 1N4, Canada
2
Environmental Monitoring and Science Division, Alberta Environment and Parks, 3535 Research Road NW, University Research Park, Calgary, AB T2L 2K8, Canada
*
Author to whom correspondence should be addressed.
Remote Sens. 2019, 11(18), 2101; https://doi.org/10.3390/rs11182101
Submission received: 20 August 2019 / Revised: 5 September 2019 / Accepted: 6 September 2019 / Published: 9 September 2019
(This article belongs to the Special Issue Environmental Modelling and Remote Sensing)

Abstract

:
Forest fires are natural disasters that create a significant risk to the communities living in the vicinity of forested landscape. To minimize the risk of forest fires for the resilience of such urban communities and forested ecosystems, we proposed a new remote sensing-based medium-term (i.e., four-day) forest fire danger forecasting system (FFDFS) based on an existing framework, and applied the system over the forested regions in the northern Alberta, Canada. Hence, we first employed moderate resolution imaging spectroradiometer (MODIS)-derived daily land surface temperature (Ts) and surface reflectance products along with the annual land cover to generate three four-day composite for Ts, normalized difference vegetation index (NDVI), and normalized difference water index (NDWI) at 500 m spatial resolution for the next four days over the forest-dominant regions. Upon generating these four-day composites, we calculated the variable-specific mean values to determine variable-specific fire danger maps with two danger classes (i.e., high and low). Then, by assuming the cloud-contaminated pixels as the low fire danger areas, we combined these three danger maps to generate a four-day fire danger map with four danger classes (i.e., low, moderate, high, and very high) over our study area of interest, which was further enhanced by incorporation of a human-caused static fire danger map. Finally, the four-day scale fire danger maps were evaluated using observed/ground-based forest fire occurrences during the 2015–2017 fire seasons. The results revealed that our proposed system was able to detect about 75% of the fire events in the top two danger classes (i.e., high and very high). The system was also able to predict the 2016 Horse River wildfire, the worst fire event in Albertian and Canadian history, with about 67% agreement. The higher accuracy outputs from our proposed model indicated that it could be implemented in the operational management, which would be very useful for lessening the adverse impact of such fire events.

1. Introduction

Forest fires are natural disturbances in many forest ecosystems around the world, including the forested regions in Canada. The Canadian forested landscape experiences about 8600 forest fires per year on an average [1], which have destroyed an average of 2.5 million hectares of forest every year since 1990 [2]. It is worth noting that the boreal forest occupies about 35% total land area and 77% of the forested landscape in Canada [3] that experiences recurrent fire disturbances, in which 97% of the burned areas in each year are caused by large fires that are greater than 200 ha [4]. As a country, Canada has spent an average of approximately C$500 million to C$1 billion every year to suppress fires during the last decade [5]. Thus, it is critical to study the potential of fire occurrences, i.e., fire danger conditions, which is an integral part of the integrated forest fire management system.
Forest fire danger conditions could be monitored using a forest fire danger rating system (FFDRS) for rating the risk of forest fires. There are different national FFDRS in operation worldwide, including the United States of America, Canada, Australia, and Russia [6,7,8,9]. In Canada, the system is known as the Canadian forest fire danger rating system (CFFDRS) and has been under development since 1968 [10]. Currently, the system consists of two major subsystems, i.e., forest fire weather index (FWI) and forest fire behavior prediction (FBP) [10,11,12,13]. The FWI is related to the relative forest fire potential, whereas the actual fire behavior is predicted by FBP [11]. The FWI subsystem is based on daily weather observations, including temperature, relative humidity, wind speed, and 24-h rainfall [14], whereas the FBP subsystem additionally includes fuels, topography, and type and duration of prediction [15]. However, the inherent problem of deriving the spatial dynamics from weather observations has already been identified in literature, as employing interpolation methods for deriving the spatial extent of weather dynamics from station-based weather observations is problematic [16]. To overcome such issue, satellite-based remote sensing (RS) technology would be an alternative approach to study the forest fire danger conditions [16,17,18].
Researchers have used satellite-based RS approaches to study forest fire danger conditions for developing a forest fire danger forecasting system (FFDFS) in recent decades because they can provide synoptic view and continuous coverage for large areas, even for the remote locations [17]. As such, forecasting systems may potentially predict the forest fire danger conditions before fire occurrences. Thus, it would be more useful for the operational forest fire management purposes [19]. The RS-based FFDFS could be grouped into three different forecasting time scales, i.e., daily, 8-day, and 16-day. In the case of daily-scale forecasting, we summarized some of the recent studies. For example, Abdollahi et al. [17] forecasted the fire danger conditions at daily-scale over the northern part of Alberta, Canada upon employing moderate resolution imaging spectroradiometer (MODIS)-based daily surface temperature (Ts) and precipitable water (PW) at 1 km, and eight-day composites of normalized difference vegetation index (NDVI) and normalized difference water index (NDWI) at 500 m. The study produced daily fire danger maps in five forest fire danger classes (i.e., low, moderate, high, very high, and extremely high) at 500 m spatial resolution, which were able to detect about 77% of the observed fire events during the 2009–2011 period under the high danger (i.e., high to extremely high) classes. Incorporating two developed human- and lightning-caused static fire danger (SFD) maps using historical ground-based fire dataset during 1961–2014, they improved the models’ fire detection performance up to about 93%. However, considering the occupied area by each of the danger classes, they reported the combination of human-caused SFD map with the daily forest fire danger model as the best combination to detect forest fire occurrences, with about 82% of events falling in the high danger classes. In another study, Chowdhury and Hassan [16] produced fire danger (FD) maps for the forest areas in Alberta, Canada during the 2009–2011 period. To forecast the FD conditions at daily-scale, the study used MODIS-derived 8-day composites of NDVI and normalized multiband drought index (NMDI) at 500 m and Ts km, and PW at 1 km. They generated five FD classes (i.e., low, moderate, high, very high, and extremely high), which demonstrated that about 77% of the fire events fell under the high to extremely high categories. Despite such a good accuracy, their model employed a gap-filling algorithm to overcome the cloud-pixel problem in their input images. However, such a time-consuming algorithm was not able to eliminate all the cloudy pixels. Additionally, the study performed by Babu et al. [20] generated daily-scale maps of forest fire danger conditions in Kazakhstan for 10 selected dates during the 2017 fire season. They combined two different types of fire danger map, i.e., static and dynamic. The static map was generated using a digital elevation model (DEM) of the shuttle radar topography mission (SRTM) at 1 km and MODIS-derived yearly land cover at 500 m spatial resolution (i.e., MCD12Q1 product). The dynamic map was developed from MODIS-derived Ts (1 km), NMDI (500 m), visible atmospheric resistant index (VARI at 500 m), and modified normalized difference fire index (MNDFI at 500 m). The final daily-scale map of forest fire danger conditions was produced by adding both static and dynamic forest FD maps, which consisted of five categories, i.e., no fire, low, moderate, high, and very high. The study finally evaluated the performance of the model by comparing with MODIS-derived fire hotspot data and achieved about 84% overall accuracy for the selected dates.
In addition, there were some of the noteworthy RS-based eight-day scale forecasting studies found in the literature. For example, Yu et al. [21] predicted fire risk ratings in Cambodia at an eight-day scale during 2014–2015. The study used eight-day composites of MODIS-derived Ts at 1 km, and NDVI and NDWI at 500 m; eight-day accumulated precipitation from tropical rainfall measuring mission (TRMM) at 28 km; SRTM DEM at 30 m; and fire mask at 1 km. The study found a good agreement (i.e., r2 = 0.99) with the MODIS-derived fire spots. The study by Chowdhury and Hassan [22] used MODIS-derived eight-day composites of Ts at 1 km, and NMDI and NDVI at 500 m for Alberta, Canada during the 2011 fire season. The study forecasted fire danger conditions in four FD classes (i.e., low, moderate, high, and very high). The results demonstrated that about 49% and 39% of forecasted forest fires fell under very high and high classes, respectively, which indicated that about 88% fires fell under these two FD classes. This study validated the forecasted fire danger classes by employing MODIS-derived fire-spot images instead of using ground-based observed data. Moreover, Akther and Hassan [18] studied the boreal forest in Alberta, Canada during the 2006–2008 period. The study used MODIS-derived eight-day composites of Ts at 1 km, and NMDI and temperature vegetation wetness index (TVWI) at 500 m. The eight-day scale forecasting of forest fire danger conditions were performed by combining all three individual variables, which included four FD classes (i.e., low, moderate, high, and very high). The study reported that about 66% of forest fires fell under the very high and high FD classes, and a total of 91.63% forest fires fell under top three classes (i.e., very high to moderate) when compared with the historical fire occurrences database.
Also, some studies focused on RS-based forecasting at the 16-day scale. For example, Li et al. [23] forecasted for northern China during 2008–2011 using MODIS-derived 16-day composites of relative greenness (RG) and vegetation danger index (VDI) at 250 m including historical fire events. They evaluated RG and VDI values for fire-spot locations in three ways, i.e., before fire occurrences in 2008 and 2009; during fire occurrences in 2010; and after fire occurrences in 2011. The RG values were found to be more than 70% at the fire-spot locations before the fire occurrences where VDI values were positive. The study by Bisquert et al. [24] applied MODIS-derived 16-day composites of enhanced vegetation index (EVI) at 250 m spatial resolution, and daily Ts at 1 km for the Galicia region, Spain during the 2001–2006 period. The study evaluated different combinations of input variables (i.e., differences between two 16-day composites of EVI, and two Ts images in the same composite period; and average and maximum values of 2- to 16-day composites) by integrating fire occurrence history and the period of year in logistic regression and artificial neural networks. A combination of eight-day Ts images with the period of year and fire history in each cell was found as the best predictor to classify 65% of the observed fires in the high FD class.
In general, recent literature on developing RS-based FFDFS revealed that the use of MODIS-derived variables (i.e., NDVI, NDWI, and Ts) are clearly simple, freely available, and very effective [17,21,25,26]. In addition, most of these studies showed the effective forecasting at daily, 8-day, or 16-day scale using the MODIS-derived variables. However, Ts is the most dynamic among these variables and is expected to change over the forecasted 8- or 16-day period, where NDVI and NDWI may not change significantly during these periods. Therefore, it may not be appropriate to average Ts data over 8 or 16 days (i.e., for preparing composite of 8-day or 16-day) for use in FFDFS at 8- or 16-day scales, respectively. Hence, employing higher temporal resolution (e.g., daily scale) for Ts would be more effective in the daily forecasting systems. However, such a daily-scale (i.e., 24-h or less) forecasting is not good enough in terms of sustainable fire management strategies because the lead time is not sufficient enough to follow the protocols in the preparation and evacuation, and determine the safest, most effective, and cost-efficient strategies by the fire managers to evaluate and manage. In fact, a review report on the 2016 Horse River Wildfire (the worst fire event in Albertian and Canadian history) by MNP LLP [27] for the Govt. of Alberta also highlighted the need for four-day forecasting and fire propagation modeling. Consequently, we proposed to develop a unique four-day scale primarily RS-based FFDFS model for the forested areas in northern Alberta, Canada. Herein our proposed model, we planned to integrate four-day composites of daily NDVI, NDWI, and Ts dynamic variables during the 2015–2017 fire seasons spanning between April and September each year over the northern part of Alberta. We additionally planned to include ignition source as a static variable to our model. Our aim was to evaluate the generated final maps of forest fire danger conditions with the actual fire occurrences during the study period. In addition, our plan was to evaluate the maps based on the three different time segments (i.e., spring, growing, and late summer seasons) in each fire season to observe their dynamics. Further, our intention was to analyze the forest danger conditions during the devastating 2016 Horse River wildfire in Fort McMurray, Alberta that started on 01 May 2016, and also intersected with our study area and period.

2. Study Area and Data Requirements

2.1. General Description of the Study Area

We considered the forested areas of the northern part of Alberta, Canada as our study area that are situated between latitude 52–60°N and longitude 110–120°W (see Figure 1a). The ecology of Alberta is divided into 21 natural subregions depending on the vegetation, climate, elevation, and physiographic differences [28]. Since our objective was to study fire danger conditions in the forested areas, we considered the ecological subregions that include the forest vegetation (i.e., both evergreen and deciduous broadleaf and needleleaf forests; see Figure 1a and Table 1). In addition, fire regimes in different sub-ecoregions in Alberta are shown in Figure 1b to understand the general pattern in which forest fires occurred in a particular ecosystem over the 1961–2014 period. In terms of climate, the mean annual temperature varies from −3.6 to 1.1 ◦C, and precipitation between 377–535 mm in the study area. The area is known for its short summer and long cold winter, and the elevation varies from 162 to 3596 m above mean sea level [17,28].

2.2. Data Requirements

In this study, we used three different products acquired by the Terra MODIS, including: (i) Daily surface reflectance; (ii) daily land surface temperature (Ts); and (iii) land cover map for Alberta. Annually, we acquired the daily data from 30 March to 29 September (i.e., day of year, DOY 89 to 272 for 2015 and 2017; and DOY 90 to 273 for 2016, as it was a leap year). In addition, we employed a spatial database of historical fire occurrences and two vector layers (i.e., road network and geographic boundary), which were required for the study. A brief description for each of these datasets is provided in Table 1.

3. Methods

The conceptual diagram of the proposed RS-based four-day FFDFS model is shown in Figure 2. The development of the model followed three major steps, i.e., generation of four-day composite for the RS-based input variables, forecasting of the fire danger conditions, and evaluation of the fire danger maps. These steps are described in the following subsections.

3.1. Generation of Four-Day Composites for the RS-Based Input Variables

Upon acquisition of the MODIS-derived daily surface reflectance images (i.e., MOD09GA), we generated daily NDVI and NDWI images using the following combinations of the spectral bands:
N D V I = ρ n i r     ρ r ρ n i r   +   ρ r
N D W I = ρ n i r     ρ s w i r ρ n i r   +   ρ s w i r
where ρ is the spectral band-specific surface reflectance-values, and r , n i r , and s w i r represent the spectral bands centered at 0.65, 0.86, and 2.13 µm wavelengths, respectively.
Then, we considered the dynamics of NDVI, NDWI, and Ts over the previous four days, i.e., i-1 to i-4 days, to generate the variable-specific four-day composites. In the make-up of both NDVI and NDWI composites, we took the variable-specific maximum values for each pixel in the images during the j-1 period consisting of i-1 to i-4 days. In the case of the Ts composite, we averaged its values during the j-1 period considering the cloud-free pixels only. Then, we resampled the Ts composite image from 1 km to 500 m to be consistent with the other composites of both NDVI and NDWI. Finally, we repeated the above steps to generate the four-day composites over the entire fire seasons during the 2015–2017 period.

3.2. Forecasting of the Forest Fire Danger Conditions

Upon generating the composites (i.e., NDVIj-1, NDWIj-1, and Tsj-1) in the previous subsection, we computed our study area-specific average (i.e., mean) value for each of the variable-specific composite. Next, we calculated two FD classes (i.e., high and low) for each of the variable-specific composites over the forested areas only upon comparing the variable-specific instantaneous values at a given pixel with their corresponding average values computed in the previous step. Note that in the process, we used the annual land cover 2008 MODIS product (MCD12Q1) for the identification of the forested areas. Nevertheless, in generating the two FD classes for each of the variables, we assumed that the magnitudes of the variables in relation with their respective study area-specific values might support fire occurrences (see Table 2 for details). In the next step, we combined the three maps of the input variable-specific danger conditions to generate an integrated FD map for the next four days (i.e., j period). This integrated FD map was categorized into four different FD classes (i.e., very high, high, moderate, and low) based on the total number of variables that were observed in the high danger class (see Table 3 and Figure 2b). In integrating the variable-specific FD conditions in the model, we assumed that the impact of the variables of the composites of NDVIj-1, NDWIj-1, and Tsj-1 would be constant over the following four days (i.e., j period). In addition, cloud- and shadow-pixels in the composites were assumed to exhibit low fire danger conditions.
In addition, we integrated a static variable describing the influence of road networks (known as human-caused ignition source, adopted from Abdollahi et al. [17]) in our integrated FD map for preparing the final FD map. This human-caused SFD map had two fire danger classes, i.e., high and low. The high danger class included the forest areas (i.e., the four types of forest land cover mentioned in Table 1) located within the 500 m buffer zone, while the low danger class was the forest areas located outside the buffer zone. In generating the final FD map consisting of four FD classes (i.e., very high, high, moderate, and low), we assigned the classes in the integrated FD map into a higher danger class if the SFD map demonstrated high danger class (see Table 4 for details). However, the final FD class remained unchanged if the SFD map showed low danger class. Note that although the forest fire occurrences could be classified into two categories based on its ignition source, i.e., human- and lightning-caused fires, we used only the SFD map of human-caused ignition source. This was because a recent study [17] did not find any significant improvement in detecting forest fires by using the lightning-caused ignition source in the same geographical region. Further, the assumption was that the likelihood of starting forest fires might be high within the 500 m vicinity of roads due to peoples’ accessibility to the forest near the roads.

3.3. Evaluation of the Final Danger Map

To understand the performance of our newly developed primarily RS-based FFDFS model to forecast forest fire danger conditions for the next four days (i.e., during j period; see Figure 2c), we evaluated the generated final FD maps (described in the previous subsection) by overlaying the ground-based locations of the forest fire occurrences during the 2015–2017 period. Note that we used a spatial database with the locations of historical fire occurrences for deriving the ground-based locations. In this process, we calculated the percentages of detected forest fire occurrences identified in the final FD maps during the forecasted next four days (i.e., i, i+1, i+2, and i+3 during the j period; see Figure 2c) on an everyday basis (i.e., i is the daily/current day that included in the j period; see Figure 2c). We additionally calculated the occupied area of each FD class in the final FD maps for the 2015–2017 period. In addition, in order to understand the seasonal forest fire pattern, we evaluated the final FD maps for three different seasons in each year, including: (i) Spring season, i.e., start of the fire season till the start of summer, (ii) early summer season, i.e., start of summer (DOY 173) to the peak of the vegetation growing season (DOY 194) [29], and (iii) late summer, i.e., peak of the growing season to the end of fire season (see Figure 3).

4. Results and Discussion

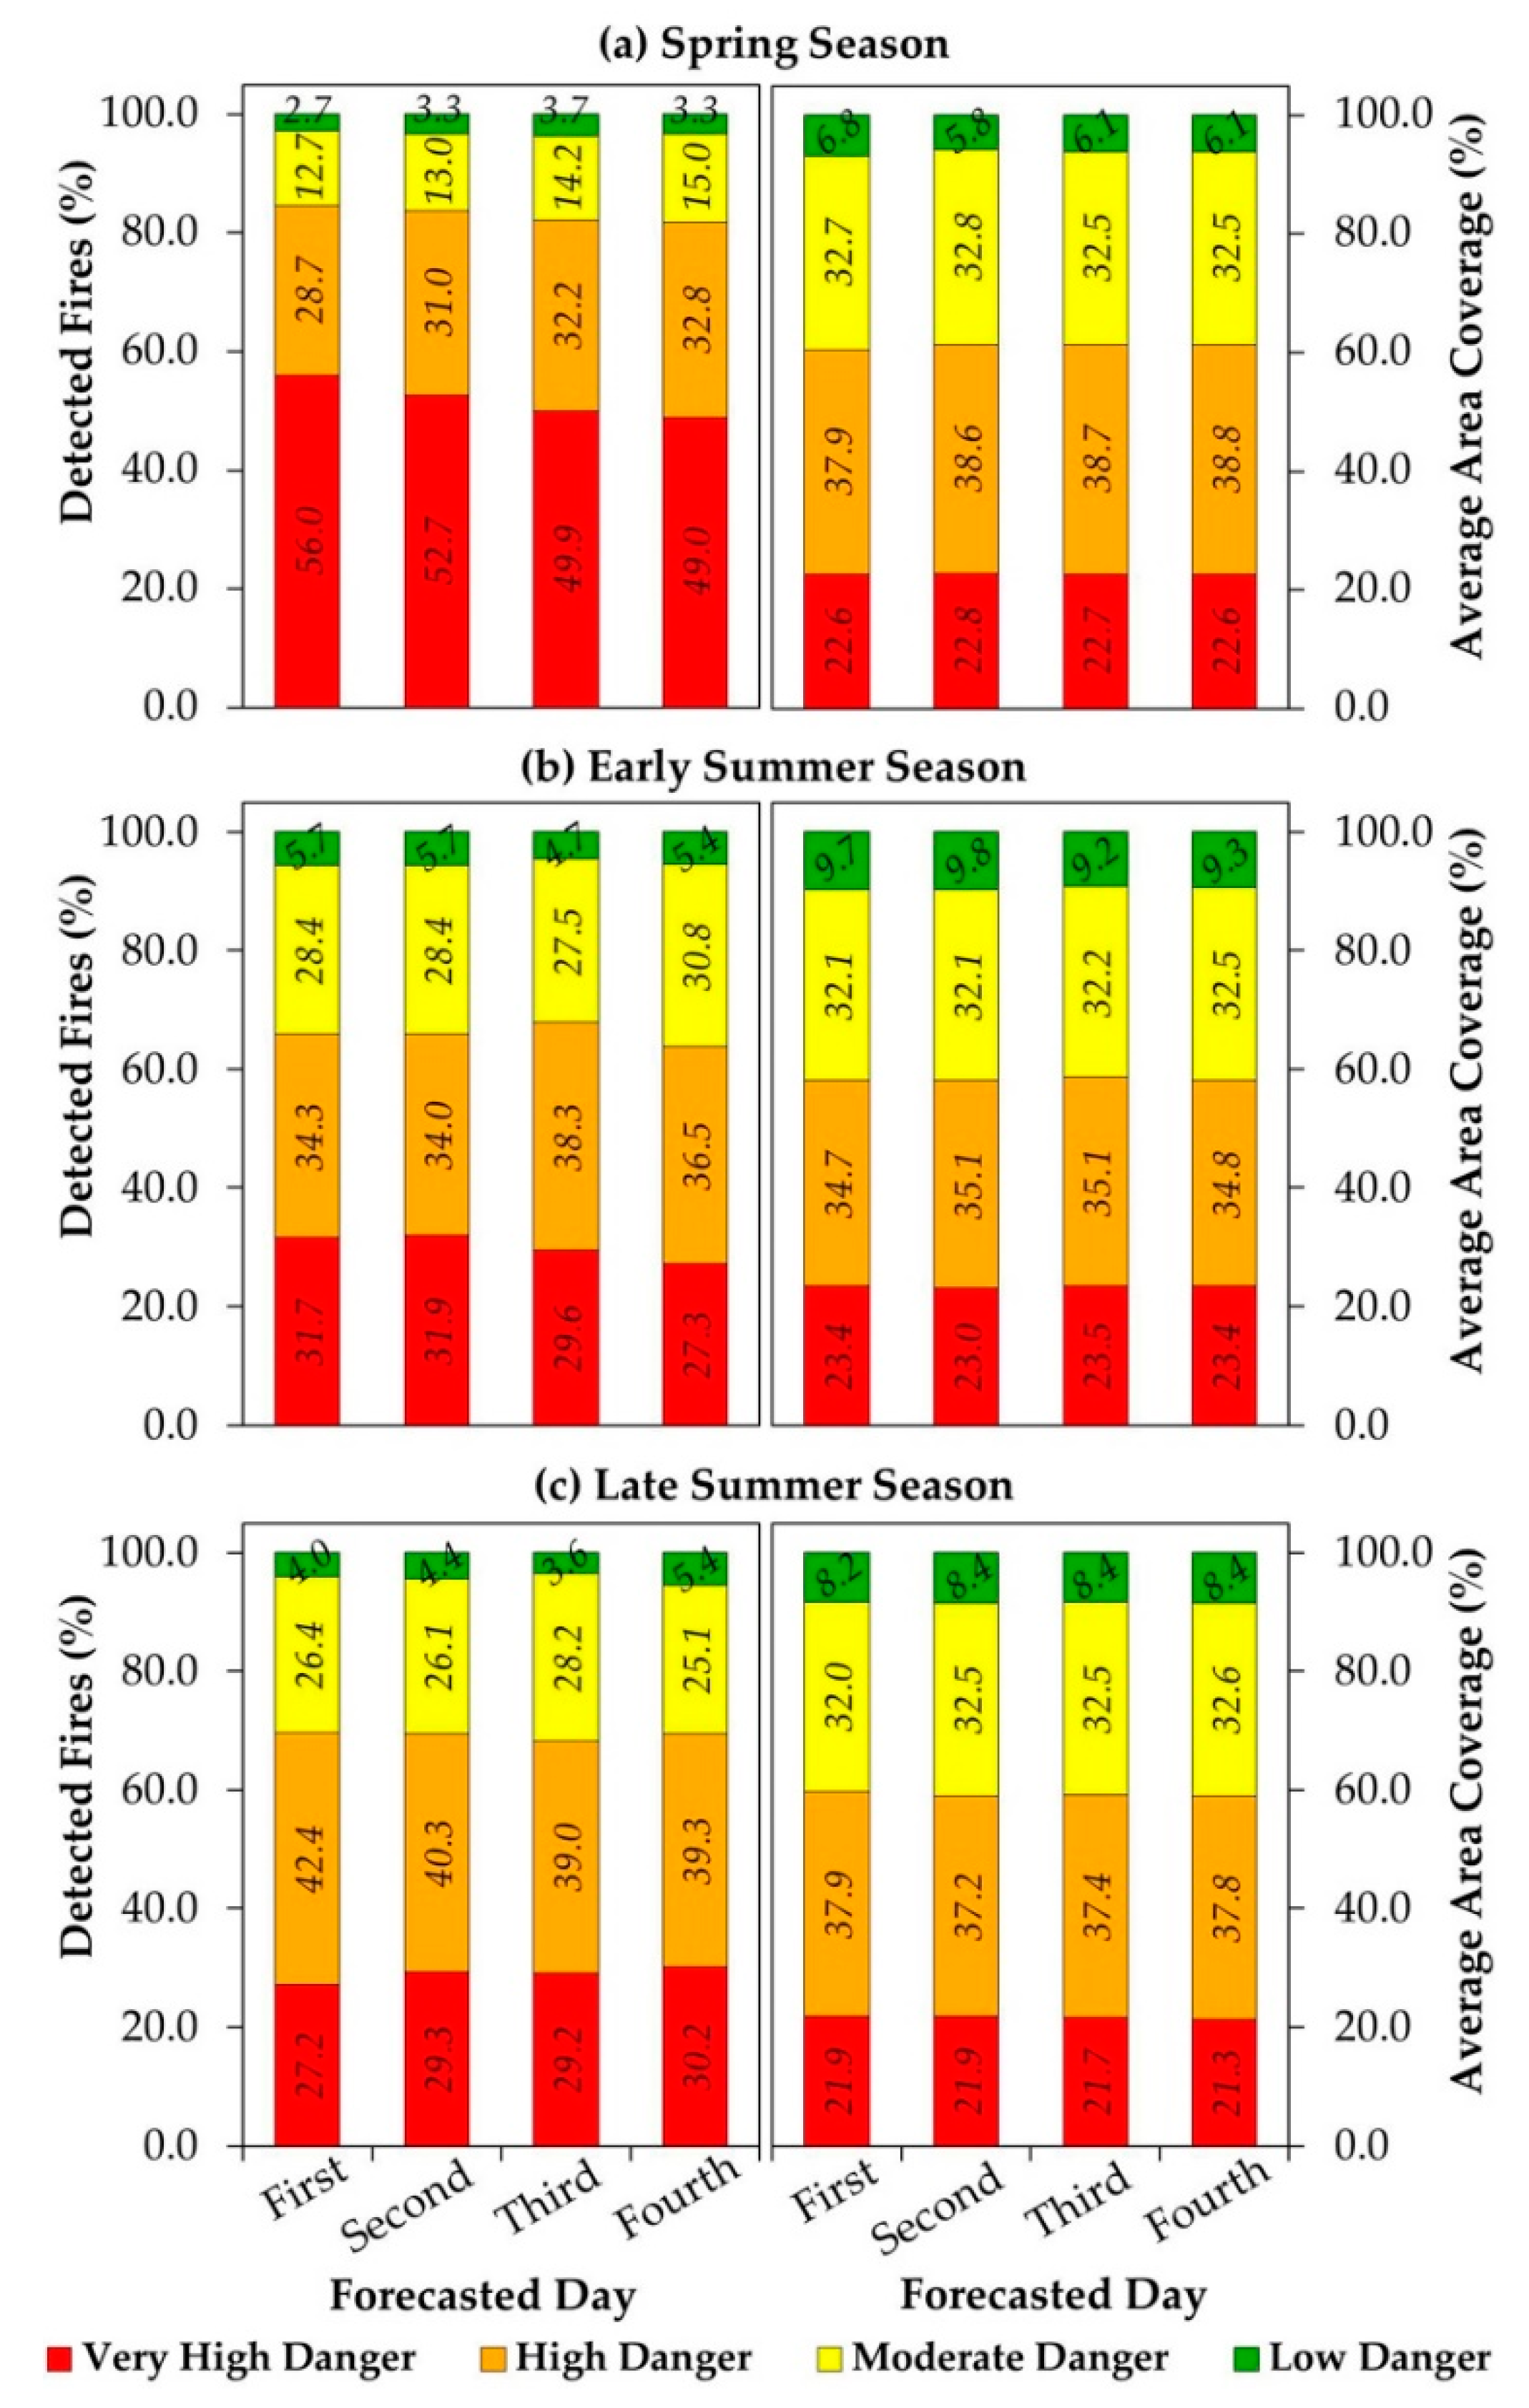
4.1. Quantitative Performance Assessment of the New Four-Day Scale RS-Based FFDFS Model

To understand the performance of the new four-day scale RS-based FFDFS model, we evaluated the generated FD maps with the actual fire occurrences. The final FD maps showed that a total of about 75.1%, 74.9%, 74.5%, and 74.2% forest fires fell in the forecasted first, second, third, and fourth day, respectively, for very high and high fire danger categories during the 2015–2017 period (see Figure 4a). It was obvious to receive the highest matching (i.e., 75.1%) with the forecasted first day, the lowest matching (i.e., 74.2%) for the fourth day, and a gradual decrease from the first to the fourth day. However, the difference between the forecasted first and fourth day for very high and high categories was not significant (i.e., 0.9%). Such a low difference indicated that this four-day scale FFDFS model would be suitable for a reliable forecasting of forest fire danger conditions up to four days using our proposed model.
The average matching of these forecasted four days for the very high and high danger classes was found to be about 74.68% in this study, which was higher than the reported accuracy (i.e., about 65.51%) achieved by the eight-day scale RS-based forecasting study conducted by Akther and Hassan [18]. This was obvious because short-term predictions (e.g., four days) have less uncertainty when compared to the medium- and long-term predictions (e.g., 8 days to 16 days). However, Chowdhury and Hassan [22] reported about 88.04% forest fires fell under forecasted eight-day fire danger classes of very high and high, and Babu et al. [20] achieved about 84% overall accuracy. In fact, such high accuracies with the reference data were likely achieved because these studies validated the forecasted FD classes with MODIS-derived fire spot images instead of using ground-based reference data. Note that MODIS-derived fire spot images have some limitations, e.g., it could produce additional false alarms over bright/reflective surfaces and the product confidence value varies from 0 to 100% [30,31,32,33,34]. Hence, there were possibilities of containing pixels with false alarms (i.e., actual forest fires did not occur in the areas that covered by the pixels) in the reference images that were used, especially in cases the confidence ranked with lower percentages, which eventually increased the accuracy for those studies.
Additionally, we calculated area coverage under each forecasted forest fire danger category. It revealed that about 40% of the study area was categorized under moderate and low danger classes (see Figure 4b) while using four variables (i.e., Ts, NDVI, NDWI, and human-caused ignition source). This result was a little less when compared to the area (about 46%) reported in Abdollahi et al. [17], where five variables (i.e., Ts, NDVI, NDWI, PW, and ignition sources) were used. However, the findings of Abdollahi et al. [17] are not directly comparable because they developed a daily forecasting system using an additional variable, i.e., the daily PW. Note that we tried to compare our results with the study because there was no other RS-based four-day scale study available in the literature to our knowledge. Nevertheless, receiving less area coverage in our forecasted FD maps could also be due to integrating the human-caused SFD map as an additional variable in our study. In that case, some of the initial moderate danger classes (derived from Ts, NDVI, and NDWI variables) were reassigned to high danger class in the final FD maps, where the human-caused SFD map showed the high danger class [17]. Note that it would be highly desirable to receive the lowest number of areas as possible under very high and high danger categories (i.e., more areas under moderate and low danger categories) from FFDFS models, so that the fire managers could focus and provide the available resources on a smaller area for the preparation and effective management of the potential forest fires.
Despite our RS-based four-day FFDFS showing a promising performance of detecting forest fires, we observed that a small number of fires (i.e., 4.35%) were identified in the low fire danger category. This situation could be improved by integrating other forest fire-related variables in this model, such as topographical parameters (e.g., slope, elevation, and aspect of the landscape) that might have influence on the conditions of vegetation [16,17,35], meteorological variables (e.g., incident solar radiation, precipitation, and wind) [16,17], and vegetation phenology to define water stress in vegetation and the fuel availability for fire occurrences [16,36,37].
Further, during the validation of the final FD maps during the 2015-2017 period, we observed about 83% forest fires in very high and high FD classes compared with the historical forest fire occurrences over the spring season (see Figure 5a). This result was followed by 66% and 69% for the growing and late summer seasons, respectively, for those top two FD lasses (i.e., very high and high; Figure 5b,c). The highest accuracy in detecting fires in the spring season was probably because of the higher frequency of forest fires during that season. In contrast, the area coverage of low and medium FD classes was found to be about 39%, 42%, and 41% for the spring, growing, and late summer seasons, respectively. This result indicated that area coverage did not significantly change over the different seasons.

4.2. Case of the 2016 Horse River Wildfire

Daily four-day scale final FD maps were generated in this study for the dates between 30 March and 29 September for three years (2015–2017) using a total of four variables (i.e., NDVI, NDWI, Ts, and human-caused ignition source). The process resulted with a total of 583 final FD maps (i.e., 181 maps for each year) for the studied three years. As an example, we presented the generated FD map of 01 May 2016 as a case study to analyze the matching of forest FD conditions around Fort McMurray, Alberta. This area and time have been chosen because we intended to observe the performance of our generated FD map with a major forest fire event. In fact, Alberta experienced the worst forest fire (i.e., the 2016 Horse River wildfire) in Canadian history, starting in an area approximately 7 km southwest of downtown Fort McMurray on 01 May 2016 (detected shortly after 16:00 h MDT) [27].
To comprehend the event, we produced the final forecasted FD map on 01 May 2016 (Figure 6e) for the next four days including the day itself (i.e., 01–04 May 2016). In this case, the forecasted map was generated by combining the FD maps of the four variables (Figure 6a–d), such as: (i) Three MODIS-based four-day composites of NDVI, NDWI, and Ts (see Figure 6a–c) of the previous four days (i.e., 27–30 April 2016); and (ii) the human-caused ignition source based SFD map (Figure 6d). Here, each variable-specific danger map was classified into high and low categories (see Figure 6a–d). The high danger condition in the forested area for the variables NDVI, NDWI, Ts, and ignition-source were observed approximately 44%, 49%, 52%, and 12% respectively, and the low danger conditions were 56%, 51%, 48%, 88% respectively. The combined result of the four variables, i.e., the final FD map to forecast the next four days (i.e., 01–04 May 2019) was divided into four categories of the FD classes (see Figure 6e) that included very high (17%), high (40%), moderate (29%), and low (4%). The period herein for each variable composition and the forecasting fell within the spring burning window [38]. In fact, during this time period, the potential of human-caused fires would increase, as people would visit forested areas for recreational purposes more frequently. Also, the forest would become more flammable because of lower water content in the plants [39]. Such high potential of forest fire danger conditions was also reflected in the forecasted map of 01–04 May 2019, showing that approximately 67% of the total forested landscape in our study area was under very high and high FD categories.
From the final FD map generated for 01 May 2016 to forecast 01–04 May 2016, we observed that the location of ignition that caused the 2016 Horse River wildfire was under a very high FD class during the period (see Figure 6f). According to the danger map, the forest areas around Fort McMurray were also predicted for very high to high danger conditions (see Figure 6f). Because of such favorable conditions, the fire was able to spread quickly into the surrounding fuels (i.e., vegetation), and propagated eastward at an estimated rate of 10 m per minute [27]. On 03 May 2016, the fire eventually reached the communities, with a higher spread rate of approximately 28 m per minute due to an approaching cold front with a wind speed of 20–25 km per hour and gusts reaching 30–40 km per hour [27]. As a result, the enormous fire destroyed 2579 dwelling units (1595 structures), and forced the evacuation of about 88,000 people from the communities of Fort McMurray [40,41]. In fact, due to this forest fire event, the total estimated economic impact was about $8.9 billion, which represented the costliest insured natural disaster in the Canadian history [42]. Finally, it is worthwhile to note that our proposed model would be able to forecast danger conditions for the next four days within 30 min to an hour after acquiring the near real-time MODIS data. Consequently, it might be critical for managing forest fire-related disasters in a timely manner.

5. Conclusions

In this article, we proposed a simple but effective four-day scale FFDFS primarily using RS-based input variables. This model considered MODIS-derived four-day composites of NDVI, NDWI, and Ts variables over the previous four days, as well as a human-cause ignition source-based SFD variable, to forecast the forest fire danger conditions for the next four days. We implemented the developed model over the boreal forested region in northern Alberta. Upon implementing the model, we achieved about 75% agreement for the very high and high danger conditions when compared with the historical fire occurrences during the forest fire seasons of 2015–2017 period. Further, we analyzed the forest fire danger conditions during the 2016 Horse River Wildfire as a case study. It showed a reasonably high agreement (i.e., about 67%) on 01 May 2016 (i.e., forecasted for 01–04 May 2016) for the very high and high danger conditions over the entire study area, while all the surrounding areas of the ignition point showed very high danger class. Moreover, we observed the starting location and the surrounding vegetation of the Fort McMurray urban service area during the 2016 Horse River Wildfire. We identified that the very high and high danger conditions were prevailed, which helped to ignite the source and eventually propagated the devastating fire toward the communities. One of the major advantages of this model would be the ability to receive a forecast map for the next four days within 30 min to an hour after acquiring the near real-time MODIS data. Therefore, in the operation point of view, stakeholders (e.g., fire managers) could initiate immediate protocols in the preparation and evacuation to determine the safest, most effective, and cost-efficient strategies to focus and provide the available resources for the forecasted areas with potential very high and high forest fire danger conditions. Despite our proposed FFDFS exhibiting a promising performance on the boreal forest in Alberta, we strongly recommend that it should be evaluated for the other locations in Canada or elsewhere in the world before being adopted for operational purposes.

Author Contributions

Conception and design: M.R.A., and Q.K.H.; data processing and analysis: M.R.A.; writing—original draft preparation: M.R.A.; writing—review and editing: M.R.A., Q.K.H., M.A., and A.G.; supervision: Q.K.H.

Funding

The study was partially funded by: (i) Queen Elizabeth-II PhD Scholarship to M. Ahmed; and (ii) NSERC DG to Q. Hassan.

Acknowledgments

We would like to thank NASA and Alberta Forest Service of the Government of Alberta for providing MODIS and historical fire spots database respectively with free of cost.

Conflicts of Interest

The authors declare no conflict of interest.

References

  1. Natural Resources Canada. Wildland Fire Evacuations. Available online: http://www.nrcan.gc.ca/forests/climate-change/forest-change/17787 (accessed on 8 November 2017).
  2. Natural Resources Canada. Wildland Fire Management: Balancing the Bad and the Good. Available online: http://www.nrcan.gc.ca/forests/fire-insects-disturbances/fire/13143 (accessed on 23 July 2018).
  3. Regional Aquatics Monitoring Program (RAMP). The Distribution of Boreal Forests. Available online: http://www.ramp-alberta.org/river/boreal/distribution.aspx (accessed on 18 July 2019).
  4. Natural Resources Canada. Canadian National Fire Database. Available online: http://cwfis.cfs.nrcan.gc.ca/ha/nfdb (accessed on 18 July 2019).
  5. NRCan Natural Resources Canada. Facts about Wildland Fires in Canada. Available online: http://www.nrcan.gc.ca/forests/fire-insects-disturbances/fire/13143 (accessed on 23 July 2018).
  6. Wang, X.; Wotton, B.M.; Cantin, A.S.; Parisien, M.A.; Anderson, K.; Moore, B.; Flannigan, M.D. cffdrs: An R package for the Canadian Forest Fire Danger Rating System. Ecol. Process. 2017, 6. [Google Scholar] [CrossRef]
  7. Stocks, B.J.; Lawson, B.; Alexander, M.E.; Van Wagner, C.E.; McAlpine, R.S.; Lynham, T.J.; Dube, D.E. Canadian forest fire danger rating system: An overview. For. Chron. 1989, 65, 258–265. [Google Scholar] [CrossRef]
  8. Luke, R.H.; McArthur, A.G. Bushfires in Australia; Australian Government Publishing Service: Canberra, Australia, 1978; ISBN 9900020032504.
  9. Bradshaw, L.S.; Deeming, J.E.; Burgan, R.E.; Cohen, J.D. The 1978 National Fire-Danger Rating System; Department of Agriculture (Forest Service, Intermountain Forest and Range Experiment Station): Ogden, UT, USA, 1984.
  10. Natural Resources Canada. Canadian Wildland Fire Information System: Canadian Forest Fire Danger Rating System (CFFDRS). Available online: http://cwfis.cfs.nrcan.gc.ca/background/summary/fwi (accessed on 1 August 2018).
  11. Hély, C.; Flannigan, M.; Bergeron, Y.; McRae, D. Role of vegetation and weather on fire behavior in the Canadian mixedwood boreal forest using two fire behavior prediction systems. Can. J. For. Res. 2001, 31, 430–441. [Google Scholar] [CrossRef]
  12. Taylor, S.W.; Alexander, M.E. Science, technology, and human factors in fire danger rating: The Canadian experience. Int. J. Wildl. Fire 2006, 15, 121–135. [Google Scholar] [CrossRef]
  13. Forestry Canada Fire Danger Group. Development of the Canadian Forest Fire Behavior Prediction System; Forestry Canada, Science and Sustainable Development Directorate: Ottawa, ON, Canada, 1992.
  14. Natural Resources Canada. Canadian Wildland Fire Weather Index (FWI) System. Available online: http://cwfis.cfs.nrcan.gc.ca/background/summary/fwi (accessed on 1 August 2018).
  15. Natural Resources Canada. Canadian Forest Fire Behavior Prediction (FBP) System. Available online: http://cwfis.cfs.nrcan.gc.ca/background/summary/fbp (accessed on 1 August 2018).
  16. Chowdhury, E.H.; Hassan, Q.K. Development of a new daily-scale forest fire danger forecasting system using remote sensing data. Remote Sens. 2015, 7, 2431–2448. [Google Scholar] [CrossRef]
  17. Abdollahi, M.; Islam, T.; Gupta, A.; Hassan, Q. An Advanced Forest Fire Danger Forecasting System: Integration of Remote Sensing and Historical Sources of Ignition Data. Remote Sens. 2018, 10, 923. [Google Scholar] [CrossRef]
  18. Akther, M.S.; Hassan, Q.K. Remote sensing-based assessment of fire danger conditions over boreal forest. IEEE J. Sel. Top. Appl. Earth Obs. Remote Sens. 2011, 4, 992–999. [Google Scholar] [CrossRef]
  19. Chowdhury, E.H.; Hassan, Q.K. Operational perspective of remote sensing-based forest fire danger forecasting systems. ISPRS J. Photogramm. Remote Sens. 2015, 104, 224–236. [Google Scholar] [CrossRef]
  20. Babu, K.V.S.; Kabdulova, G.; Kabzhanova, G. Developing the Forest Fire Danger Index for the Country Kazakhstan by Using Geospatial Techniques. J. Environ. Inform. Lett. 2019, 1, 48–59. [Google Scholar] [CrossRef]
  21. Yu, B.; Chen, F.; Li, B.; Wang, L.; Wu, M. Fire Risk Prediction Using Remote Sensed Products: A Case of Cambodia. Photogramm. Eng. Remote Sens. 2017, 83, 19–25. [Google Scholar] [CrossRef]
  22. Chowdhury, E.H.; Hassan, Q.K. Use of remote sensing-derived variables in developing a forest fire danger forecasting system. Nat. Hazards 2013, 67, 321–334. [Google Scholar] [CrossRef] [Green Version]
  23. Li, X.; Lanorte, A.; Telesca, L.; Song, W.; Lasaponara, R. Assessment of MODIS-Based NDVI-Derived Index for Fire Susceptibility Estimation in Northern China Abstract. In Computational Science and Its Applications—ICCSA 2015; Gervasi, O., Murgante, B., Misra, S., Gavrilova, M.L., Rocha, A.M.A.C., Torre, C., Taniar, D., Apduhan, B.O., Eds.; Springer International Publishing AG Switzerland: Banff, AB, Canada, 2015; pp. 193–203. ISBN 78-3-319-21409-2. [Google Scholar]
  24. Bisquert, M.; Caselles, E.; Sánchez, J.M.; Caselles, V. Application of artificial neural networks and logistic regression to the prediction of forest fire danger in Galicia using MODIS data. Int. J. Wildl. Fire 2011, 21, 1025–1029. [Google Scholar] [CrossRef]
  25. Liu, W.; Wang, S.; Zhou, Y.; Wang, L.; Zhu, J.; Wang, F. Lightning-caused forest fire risk rating assessment based on case-based reasoning: A case study in DaXingAn Mountains of China. Nat. Hazards 2016, 81, 347–363. [Google Scholar] [CrossRef]
  26. Argañaraz, J.P.; Landi, M.A.; Bravo, S.J.; Gavier-Pizarro, G.I.; Scavuzzo, C.M.; Bellis, L.M. Estimation of Live Fuel Moisture Content from MODIS Images for Fire Danger Assessment in Southern Gran Chaco. IEEE J. Sel. Top. Appl. Earth Obs. Remote Sens. 2016, 9, 5339–5349. [Google Scholar] [CrossRef]
  27. MNP LLP. A Review of the 2016 Horse River Wildfire: Alberta Agriculture and Forestry Preparedness and Response; Forestry Division, Alberta Agriculture and Forestry: Edmonton, AB, Canada, 2017.
  28. Natural Regions Committee. Natural Regions and Subregions of Alberta; Government of Alberta: Edmonton, AB, Canada, 2006.
  29. Hassan, Q.K.; Bourque, C.P.A. Spatial enhancement of MODIS-based images of leaf area index: Application to the boreal forest region of northern Alberta, Canada. Remote Sens. 2010, 2, 278–289. [Google Scholar] [CrossRef]
  30. Roy, D.P.; Frost, P.G.H.; Justice, C.O.; Landmann, T.; Le Roux, J.L.; Gumbo, K.; Makungwa, S.; Dunham, K.; Du Toit, R.; Mhwandagara, K.; et al. The Southern Africa Fire Network (SAFNet) regional burned-area product-validation protocol. Int. J. Remote Sens. 2007, 26, 4265–4292. [Google Scholar] [CrossRef]
  31. Morisette, J.T.; Baret, F.; Liang, S. Special issue on global land product validation. IEEE Trans. Geosci. Remote Sens. 2006, 44, 1695–1696. [Google Scholar] [CrossRef]
  32. Olofsson, P.; Foody, G.M.; Herold, M.; Stehman, S.V.; Woodcock, C.E.; Wulder, M.A. Good practices for estimating area and assessing accuracy of land change. Remote Sens. Environ. 2014, 148, 42–57. [Google Scholar] [CrossRef]
  33. Fornacca, D.; Ren, G.; Xiao, W. Performance of Three MODIS Fire Products (MCD45A1, MCD64A1, MCD14ML), and ESA Fire_CCI in a Mountainous Area of Northwest Yunnan, China, Characterized by Frequent Small Fires. Remote Sens. 2017, 9, 1131. [Google Scholar] [CrossRef]
  34. EARTHDATA. FIRMS FAQ. Available online: https://earthdata.nasa.gov/faq/firms-faq (accessed on 21 June 2019).
  35. Adab, H.; Kanniah, K.D.; Solaimani, K. Modeling forest fire risk in the northeast of Iran using remote sensing and GIS techniques. Nat. Hazards 2013, 65, 1723–1743. [Google Scholar] [CrossRef]
  36. Abdollahi, M.; Dewan, A.; Hassan, Q. Applicability of Remote Sensing-Based Vegetation Water Content in Modeling Lightning-Caused Forest Fire Occurrences. ISPRS Int. J. Geo-Inf. 2019, 8, 143. [Google Scholar] [CrossRef]
  37. De Angelis, A.; Bajocco, S.; Ricotta, C. Phenological variability drives the distribution of wildfires in Sardinia. Landsc. Ecol. 2012, 27, 1535–1545. [Google Scholar] [CrossRef]
  38. Jolly, W.M.; Hintz, J.; Kropp, R.C.; Conrad, E.T. Physiological drivers of the live foliar moisture content ‘spring dip’ in Pinus resinosa and Pinus banksiana and their relationship to foliar flammability. In Proceedings of the VII International Conference on Forest Fire Research, Coimbra, Portugal, 17–20 November 2014. [Google Scholar]
  39. Pickell, P.D.; Coops, N.C.; Ferster, C.J.; Bater, C.W.; Blouin, K.D.; Flannigan, M.D.; Zhang, J. An early warning system to forecast the close of the spring burning window from satellite-observed greenness. Sci. Rep. 2017, 7, 1–10. [Google Scholar] [CrossRef]
  40. McIntyre, J. Moving forward: The Economic Impact of Rebuilding the Wood Buffalo Region’s Economy; The Conference Board of Canada: Ottawa, ON, Canada, 2017. [Google Scholar]
  41. Ahmed, M.R.; Rahaman, K.R.; Hassan, Q.K. Remote Sensing of Wildland Fire-Induced Risk Assessment at the Community Level. Sensors 2018, 18, 1570. [Google Scholar] [CrossRef]
  42. KPMG. May 2016 Wood Buffalo Wildfire: Post-Incident Assessment Report; Alberta Emergency Management Agency: Edmonton, AB, Canada, 2017.
Figure 1. (a) Map showing the land cover of Alberta. The northern part was our study area. This area is dominated by the four different types of forest vegetation (i.e., evergreen and deciduous broadleaves, and evergreen and deciduous needleleaves) that were used in our four-day scale remote sensing (RS)-based forest fire danger rating system (FFDFS) modeling exercise. (b) Fire dynamics in different sub-ecoregions, where the asterisk marks, denote the subregions located in the study area.
Remotesensing 11 02101 g001
Figure 2. Conceptual model for the proposed RS-based FFDFS at a four-day scale and its validation.
Remotesensing 11 02101 g002
Figure 3. A schematic diagram representing three different timelines of an entire fire season.
Remotesensing 11 02101 g003
Figure 4. The performance of the RS-based four-day scale FFDFS model against the historical forest fire occurrences during the 2015–2017 period in terms of the matching of the detected fires with the four FD classes in the final forecasted FD maps (a); and the average area covered by each of the FD classes (b).
Remotesensing 11 02101 g004
Figure 5. The seasonal validation of the RS-based four-day scale FFDFS model against the historical forest fire occurrences during the 2015–2017 period that included (a) spring season, (b) early summer season, and (c) late summer season.
Remotesensing 11 02101 g005
Figure 6. An example of the fire danger maps categorized into high and low FD classes that were produced on 01 May, 2016 by the RS-based four-day scale FFDFS model based on the individual variable specific danger conditions, i.e., NDVI (a), NDWI (b), TS (c), and human-caused ignition source (d) over the previous four days (i.e., 27–30 April 2016). These maps were combined to produce a final forest fire danger map to forecast the danger conditions over the next four days (i.e., 01–04 May 2016) in four different danger categories, i.e., very high to low (e). A case study location of Fort McMurray, Alberta that suffered the devastating 2016 Horse River Wildfire started on 01 May 2016, illustrating the forecasted forest fire danger conditions generated by RS-based four-day scale FFDFS model during the event (f).
Remotesensing 11 02101 g006
Table 1. Description of the different datasets that were used in the study to fulfill the objectives.
DataSourcePeriodDescriptionScope of Use
Moderate resolution imaging spectro-radiometer (MODIS)National aeronautics and space administration (NASA)2015–2017 (30 Mar to 29 Sept each year)MODIS/Terra Surface Reflectance Daily L2G Global imagery
(i.e., MOD09GA v006)
at 500 m spatial resolution.
Employed to calculate NDVI and NDWI; and generating their four-day composites over our study area.
MODIS/Terra Land Surface Temperature/Emissivity Daily L3 Global 1 imagery
(i.e., MOD11A1 v006)
at 1 km spatial resolution.
Utilized to generate four-day composites at 500m spatial resolution for the study area.
2008Land cover of MODIS/Terra+Aqua Type Yearly
L3 Global (i.e., MCD12Q1)
at 500 m spatial resolution.
Used to identify the intended forest vegetation types in our study area that includes:
(i) evergreen broadleaf,
(ii) deciduous broadleaf,
(iii) evergreen needleleaf, and
(iv) deciduous needleleaf
Ground-basedAlberta Forest Service, Govt. of Alberta1961–2017A spatial database with the locations of historical fire occurrence.Employed as a validation dataset for evaluating the FD maps.
Vector layers2006Geographical boundary of AlbertaUsed in generating the FD maps.
2000Road network of Alberta
Table 2. Assumptions of the fire danger conditions that were considered in the model for forecasting the next four days for each pixel in each variable.
Input VariableDanger Condition, jAssumptions
HighLow
Tsj Tsj-1< Tsj-1Higher than average temperatures of the surrounding landscape may favor forest fire occurrence
NDVIjNDVIj-1> NDVIj-1Low greenness in compare to the surrounding landscape may support initiating forest fire
NDWIjNDWIj-1> NDWIj-1Low moisture content in vegetation may support fire
Table 3. The categorization criteria (i.e., the total number of variables occurred in the high danger class) that were followed to define the fire danger classes in the integrated forest fire danger map.
CategoryNumber of Variable in the High Danger Class
Very High (VH)All three variables
High (H)At least two variables
Moderate (M)At least one variable
Low (L)None of the variables
Table 4. Reassigning the FD classes for deriving the final FD map of the four-day FFDFS model with four variables by integrating the fourth variable (i.e., human-caused ignition source) with the integrated FD map.
Integrated FD Map
(Three Variables)
Ignition Source-Based SFD MapFinal FD Map
(Four Variables)
Very HighHighVery High
HighVery High
ModerateHigh
LowModerate
Very HighLowVery High
HighHigh
ModerateModerate
LowLow

